Attached files
| file | filename |
|---|---|
| 8-K - FORM 8-K - PATHEON INC | d451798d8k.htm |
| EX-99.1 - PRESS RELEASE - PATHEON INC | d451798dex991.htm |
 Patheon
Fiscal 2012 Fourth Quarter Results
December 17, 2012
Exhibit 99.2 |
 1
Use of Non-GAAP Financial Measures
Forward-looking statement
This presentation contains forward-looking statements or information which reflect our
expectations regarding possible events, conditions, our future growth, results of
operations, performance, and business prospects and opportunities. All statements, other
than statements of historical fact, are forward-looking statements. Forward-looking
statements necessarily involve significant known and unknown risks, assumptions and
uncertainties that may cause our actual results in future periods to differ materially from those
expressed or implied by such forward-looking statements. These risks are described in our
2011 Form 10-K, and our other filings with the U.S. Securities and Exchange
Commission and with the Canadian Securities Administrators. Accordingly, you are cautioned not to
place undue reliance on forward-looking statements. These forward-looking
statements are made as of the date hereof, and except as required by law, we assume no
obligation to update or revise them to reflect new events or circumstances. These
slides contain references to the following non-GAAP measures: (1) “Adjusted EBITDA” which is income (loss) before
discontinued operations before repositioning expenses, interest expense, foreign exchange
losses reclassified from other comprehensive income (loss), refinancing expenses,
acquisition and related costs, gains and losses on sale of capital assets, gain on
extinguishment of debt, income taxes, asset impairment charges, depreciation and amortization
and other income and expenses; (2) “Adjusted EBITDA Margin which is adjusted
EBITDA as a percentage of revenue; and (3) “Adjusted EBITDA Excluding Certain Items,”
which is “Adjusted EBITDA” excluding the consulting fees associated with the
strategic initiatives. Since Adjusted EBITDA, Adjusted EBITDA Margin, and Adjusted
EBITDA before certain items are non-GAAP measures that do not have a standardized meaning, they
may not be comparable to similar measures presented by other issuers. You are cautioned that
these non-GAAP measures should not be substituted for their comparable GAAP measures
as indicators of performance. We have included these measures because we believe
that this information is used by certain investors to assess our financial performance, before non-cash charges and certain
costs that we do not believe are reflective of our underlying business. In addition, Adjusted
EBITDA is used by management as an internal measure of profitability.
Reconciliations of Adjusted EBITDA and Adjusted EBITDA before certain items to the closest U.S.
GAAP measures are included in the Appendix to this presentation.
|
                   2
Guidance
Actual
Revenue
>$700 M
$749.1 M
Transformation
Savings
$20 M
>$40 M
Adjusted
EBITDA margin
High-teens or 20%
Q3 & Q4 Adjusted
EBITDA approx. 17%
Full fiscal 2012 highlights |
 3
•
Revenue increased by $28.4 million from prior year
•
Conversion to a gross profit increase of $21.9 million from prior year
•
Operating income increase of $29.1 million from prior year
•
Adjusted EBITDA increase of $21.4 million from prior year
•
Transformation continues to yield benefits
Fourth quarter highlights |
 4
•
Increases size and scale in attractive contract development and
manufacturing market
•
Adds proprietary technologies and products
•
Broadens combined company geographic footprint
–
Patheon gains greater access to Emerging Markets
–
Banner penetrates more deeply into Europe
•
Provides opportunity to cross-sell Patheon and Banner services
Banner Acquisition rationale |
 5
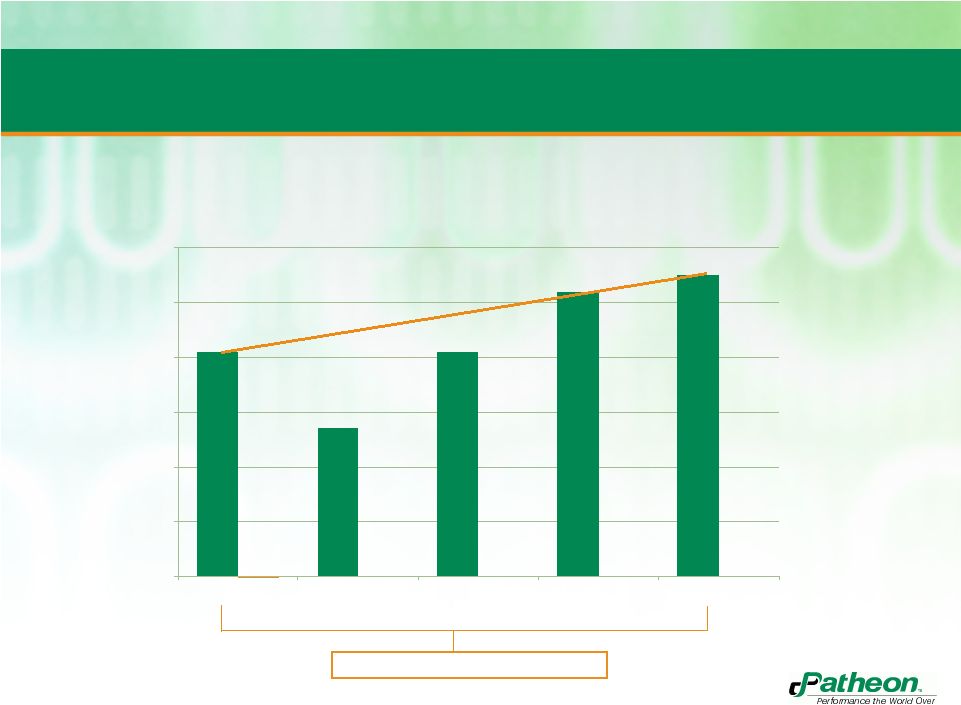
181.6
153.9
181.5
203.7
210.0
100
120
140
160
180
200
220
Q4 2011
Q1 2012
Q2 2012
Q3 2012
Q4 2012
Revenue increased by $28.4 million from prior year
Revenue
(U.S. $ in millions)
15.6% yr-yr revenue growth |
 6
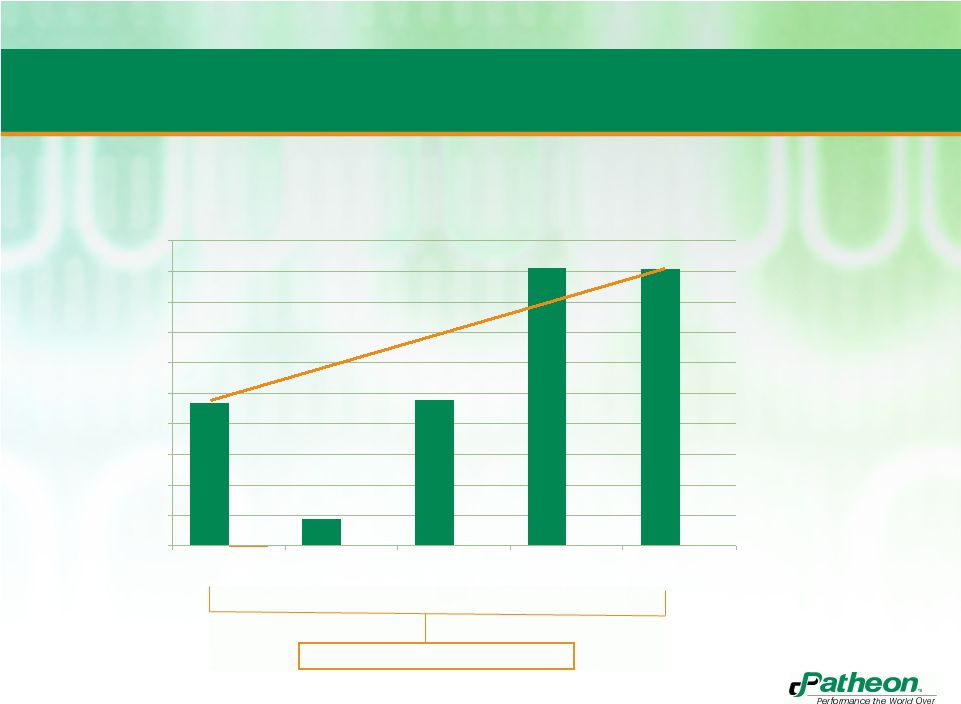
33.5
14.4
34.0
55.5
55.4
10
15
20
25
30
35
40
45
50
55
60
Q4 2011
Q1 2012
Q2 2012
Q3 2012
Q4 2012
Gross profit increased by $21.9 million from prior year
Gross Profit
(U.S. $ in millions)
65.4% yr-yr gross profit growth |
 7
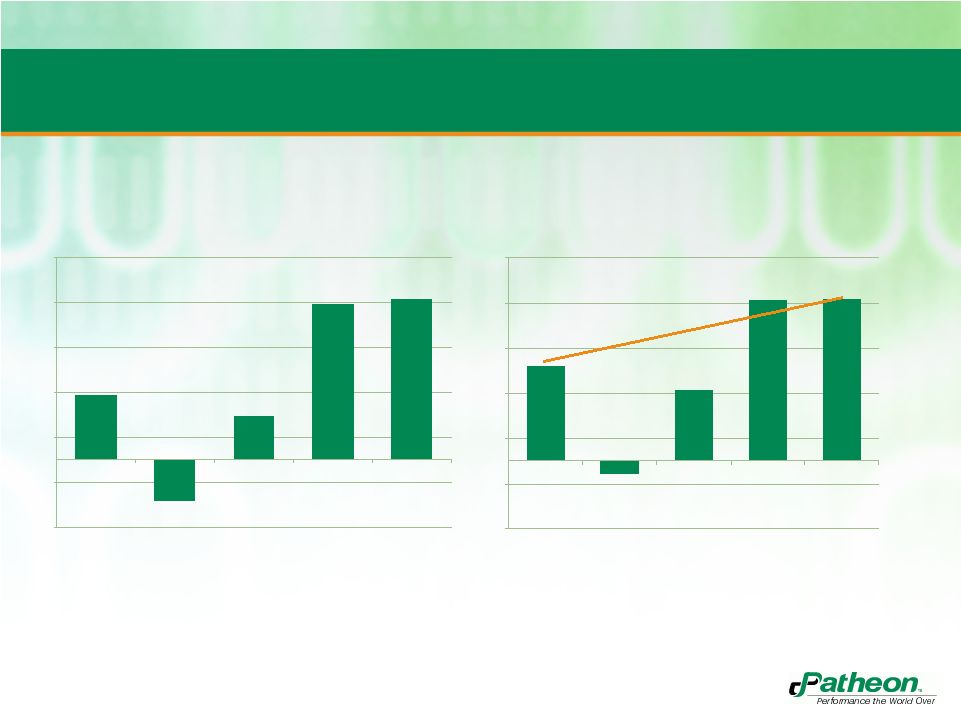
Adjusted EBITDA increase of $21.4 million from prior year
14.5
(9.2)
9.7
34.6
35.9
-15
-5
5
15
25
35
45
Q4 2011
Q1 2012
Q2 2012
Q3 2012
Q4 2012
Adjusted EBITDA
(U.S. $ in millions)
21.0
(2.9)
15.7
35.6
35.9
-15
-5
5
15
25
35
45
Q4 2011
Q1 2012
Q2 2012
Q3 2012
Q4 2012
Adjusted EBITDA Excluding Certain Items
(U.S. $ in millions) |
 8
8.0 %
6.0 %
5.3 %
17.0 %
17.1 %
2
4
6
8
10
12
14
16
18
20
Q4 2011
Q1 2012
Q2 2012
Q3 2012
Q4 2012
Improving Adjusted EBITDA Margin
Adjusted EBITDA Margin
9.1% increase in Adjusted EBITDA Margin |
 9
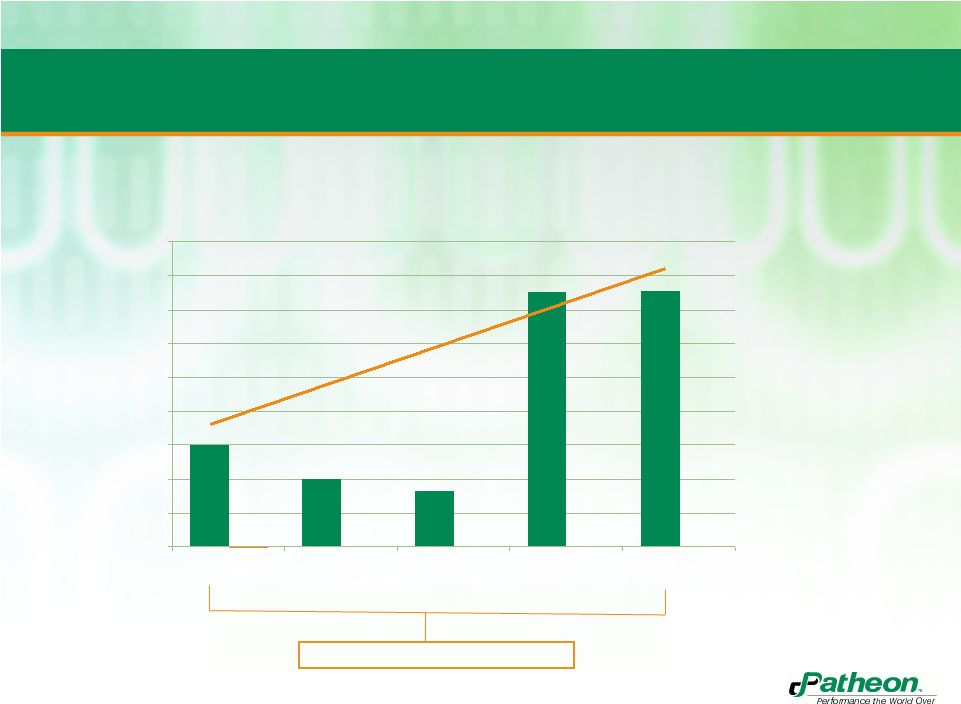
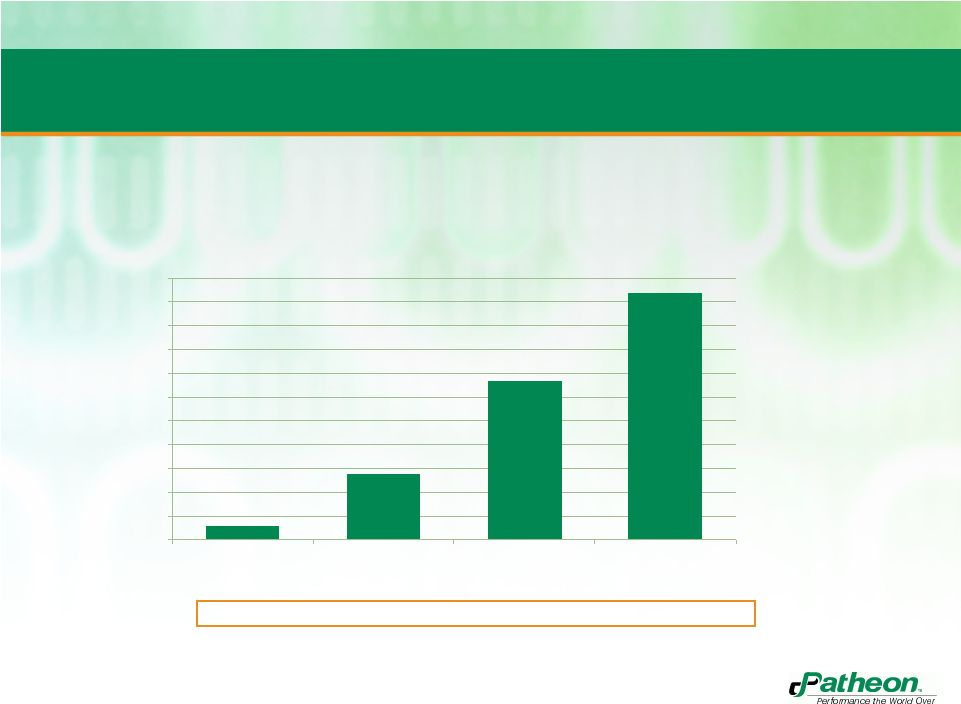
2.4
11.1
26.8
41.4
0
4
8
12
16
20
24
28
32
36
40
44
Q1 2012
Q2 2012
Q3 2012
Q4 2012
Cumulative Transformation Impact
Transformation Impact
Transformation Impact
(U.S. $ in millions)
$19.8 million in consulting fees and $41.4 million in positive Adjusted EBITDA
impact |
 10
Summary financial results
Three months ended October 31,
Statement of Operations
2012
2011
Change
(in millions of U.S. dollars)
$
$
$
Revenues
210.0
181.6
28.4
Gross Profit
55.4
33.5
21.9
Selling, general and administrative expenses
29.5
35.9
6.4
Operating income (loss)
23.1
(6.0)
29.1
Loss before discontinued operations
(23.0)
(9.8)
(13.2)
Adjusted EBITDA
35.9
14.5
21.4
Balance Sheets
Q4 2012
Q4 2011
Cash and cash equivalents
39.4
33.4
Total debt (LT & ST)
313.1
287.3
Undrawn lines of credit
64.4
94.9 |
 Thank you
11 |
 Appendix
Adjusted EBITDA and Adjusted EBITDA Excluding Certain Items
Q4 2011
Q1 2012
Q2 2012
Q3 2012
Q4 2012
(in millions of U.S. dollars)
$
$
$
$
$
(Loss) income before discontinued operations
(9.8)
(19.3)
(79.6)
15.5
23.0
Depreciation and amortization
12.2
10.6
10.8
9.3
10.1
Repositioning expenses
3.5
0.8
6.0
0.1
(0.8)
Interest expense, net
6.6
6.5
6.5
6.8
6.7
Acquisition-related costs
-
-
-
-
3.2
Impairment charge
-
-
57.9
-
-
Loss on sale of capital assets
0.1
-
-
-
0.4
Provision for (benefit from) income taxes
1.0
(7.7)
8.0
3.3
39.8
Other (income) expense, net
0.9
(0.1)
0.1
(0.4)
(0.5)
Adjusted EBITDA
14.5
(9.2)
9.7
34.6
35.9
Consulting
6.5
6.3
6.0
1.0
-
Adjusted EBITDA excluding certain items
21.0
(2.9)
15.7
35.6
35.9
12 |