Attached files
| file | filename |
|---|---|
| 8-K - 8-K - EDISON MISSION ENERGY | a12-29490_18k.htm |
| EX-10.1 - EX-10.1 - EDISON MISSION ENERGY | a12-29490_1ex10d1.htm |
| EX-99.2 - EX-99.2 - EDISON MISSION ENERGY | a12-29490_1ex99d2.htm |
| EX-99.1 - EX-99.1 - EDISON MISSION ENERGY | a12-29490_1ex99d1.htm |
Exhibit 99.3
|
|
Edison Mission Energy Presentation to Restricted Senior Noteholders December 14, 2012 0 Confidential Subject to FRE 408 – Prepared at the Request of Counsel in Preparation for Settlement Negotiations |
|
|
Statement of Limiting Conditions The content and analyses contained herein are the property of Houlihan Lokey and may not be copied or distributed without the express consent of Houlihan Lokey. By your receipt and review of these materials, you agree to be bound by the terms of this Statement of Limiting Conditions. The financial information contained herein (both historical and projected) has been prepared by Houlihan Lokey based on diligence provided by Edison Mission Energy (the "Company") and Houlihan Lokey has relied on the accuracy thereof. Certain financial information is preliminary in nature and subject to adjustments. Houlihan Lokey makes no representations as to the accuracy or completeness of the financial information contained herein and expressly disclaims any liability associated therewith. Houlihan Lokey has relied on the truth, accuracy and completeness of the representations of current management and counsel and disclaims all liability for any misrepresentation or omissions that may be contained herein based on such statements. Any analyses contained herein (as well as any suggestions or recommendations contained herein and/or derived from the content of this Presentation) are preliminary in nature and subject to reconsideration and modification, this Presentation shall in no way be considered a solicitation to any party to participate or support a particular course of action or transaction. As of the date hereof, material non-public and/or confidential information is contained in this Presentation ("Confidential Information"). Accordingly, until such time as this information is made public by authorized means, any such Confidential Information obtained through your receipt of this Presentation, and any analyses of such information, is to be considered strictly confidential. Distribution of this document or disclosure of any Confidential Information set forth herein to any party other than the intended recipient of this Presentation is expressly prohibited without the prior written authorization of the Company and Houlihan Lokey. Edison Mission Energy CONFIDENTIAL – PREPARED AT THE REQUEST OF COUNSEL & SUBJECT TO FRE 408 1 |
|
|
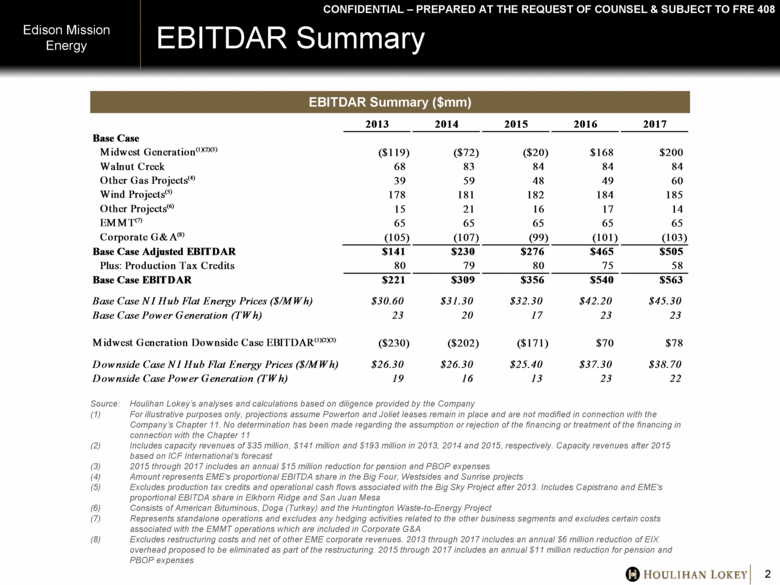
Source: Houlihan Lokey’s analyses and calculations based on diligence provided by the Company For illustrative purposes only, projections assume Powerton and Joliet leases remain in place and are not modified in connection with the Company’s Chapter 11. No determination has been made regarding the assumption or rejection of the financing or treatment of the financing in connection with the Chapter 11 Includes capacity revenues of $35 million, $141 million and $193 million in 2013, 2014 and 2015, respectively. Capacity revenues after 2015 based on ICF International’s forecast 2015 through 2017 includes an annual $15 million reduction for pension and PBOP expenses Amount represents EME's proportional EBITDA share in the Big Four, Westsides and Sunrise projects Excludes production tax credits and operational cash flows associated with the Big Sky Project after 2013. Includes Capistrano and EME's proportional EBITDA share in Elkhorn Ridge and San Juan Mesa Consists of American Bituminous, Doga (Turkey) and the Huntington Waste-to-Energy Project Represents standalone operations and excludes any hedging activities related to the other business segments and excludes certain costs associated with the EMMT operations which are included in Corporate G&A Excludes restructuring costs and net of other EME corporate revenues. 2013 through 2017 includes an annual $6 million reduction of EIX overhead proposed to be eliminated as part of the restructuring. 2015 through 2017 includes an annual $11 million reduction for pension and PBOP expenses EBITDAR Summary Edison Mission Energy 2 EBITDAR Summary ($mm) CONFIDENTIAL – PREPARED AT THE REQUEST OF COUNSEL & SUBJECT TO FRE 408 2013 2014 2015 2016 2017 Base Case Midwest Generation (1)(2)(3) ($119) ($72) ($20) $168 $200 Walnut Creek 68 83 84 84 84 Other Gas Projects (4) 39 59 48 49 60 Wind Projects (5) 178 181 182 184 185 Other Projects (6) 15 21 16 17 14 EMMT (7) 65 65 65 65 65 Corporate G&A (8) (105) (107) (99) (101) (103) Base Case Adjusted EBITDAR $141 $230 $276 $465 $505 Plus: Production Tax Credits 80 79 80 75 58 Base Case EBITDAR $221 $309 $356 $540 $563 Base Case NI Hub Flat Energy Prices ($/MWh) $30.60 $31.30 $32.30 $42.20 $45.30 Base Case Power Generation (TWh) 23 20 17 23 23 Midwest Generation Downside Case EBITDAR (1)(2)(3) ($230) ($202) ($171) $70 $78 Downside Case NI Hub Flat Energy Prices ($/MWh) $26.30 $26.30 $25.40 $37.30 $38.70 Downside Case Power Generation (TWh) 19 16 13 23 22 |
|
|
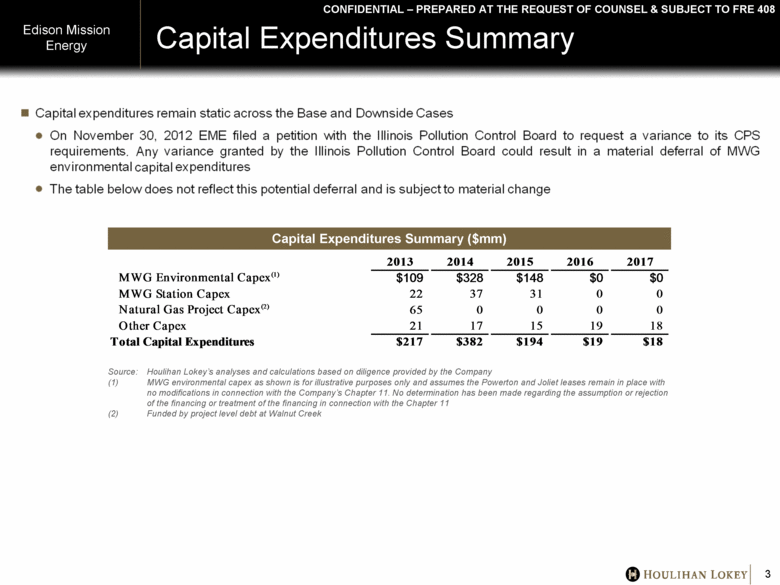
Capital Expenditures Summary Edison Mission Energy 3 Capital Expenditures Summary ($mm) Source: Houlihan Lokey’s analyses and calculations based on diligence provided by the Company MWG environmental capex as shown is for illustrative purposes only and assumes the Powerton and Joliet leases remain in place with no modifications in connection with the Company’s Chapter 11. No determination has been made regarding the assumption or rejection of the financing or treatment of the financing in connection with the Chapter 11 Funded by project level debt at Walnut Creek CONFIDENTIAL – PREPARED AT THE REQUEST OF COUNSEL & SUBJECT TO FRE 408 2013 2014 2015 2016 2017 MWG Environmental Capex (1) $109 $328 $148 $0 $0 MWG Station Capex 22 37 31 0 0 Natural Gas Project Capex (2) 65 0 0 0 0 Other Capex 21 17 15 19 18 Total Capital Expenditures $217 $382 $194 $19 $18 |
|
|
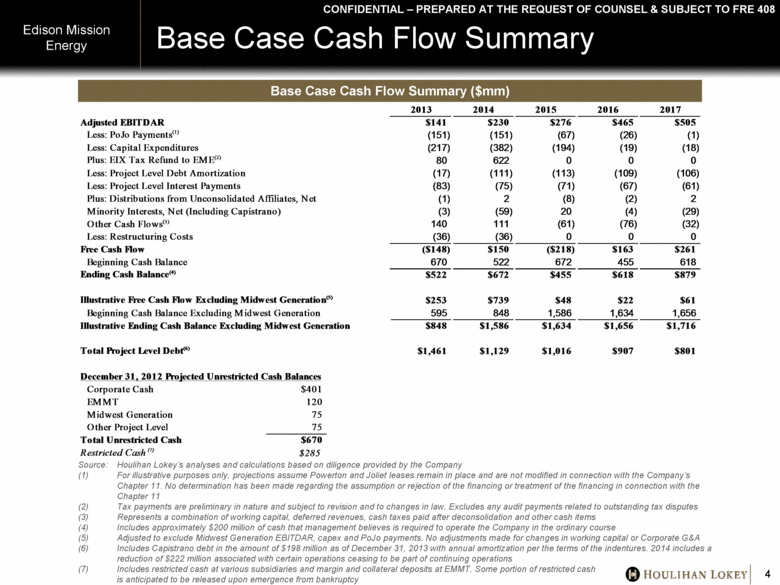
Base Case Cash Flow Summary Edison Mission Energy 4 Base Case Cash Flow Summary ($mm) Source: Houlihan Lokey’s analyses and calculations based on diligence provided by the Company For illustrative purposes only, projections assume Powerton and Joliet leases remain in place and are not modified in connection with the Company’s Chapter 11. No determination has been made regarding the assumption or rejection of the financing or treatment of the financing in connection with the Chapter 11 Tax payments are preliminary in nature and subject to revision and to changes in law. Excludes any audit payments related to outstanding tax disputes Represents a combination of working capital, deferred revenues, cash taxes paid after deconsolidation and other cash items Includes approximately $200 million of cash that management believes is required to operate the Company in the ordinary course Adjusted to exclude Midwest Generation EBITDAR, capex and PoJo payments. No adjustments made for changes in working capital or Corporate G&A Includes Capistrano debt in the amount of $198 million as of December 31, 2013 with annual amortization per the terms of the indentures. 2014 includes a reduction of $222 million associated with certain operations ceasing to be part of continuing operations Includes restricted cash at various subsidiaries and margin and collateral deposits at EMMT. Some portion of restricted cash is anticipated to be released upon emergence from bankruptcy CONFIDENTIAL – PREPARED AT THE REQUEST OF COUNSEL & SUBJECT TO FRE 408 2013 2014 2015 2016 2017 Adjusted EBITDAR $141 $230 $276 $465 $505 Less: PoJo Payments (1) (151) (151) (67) (26) (1) Less: Capital Expenditures (217) (382) (194) (19) (18) Plus: EIX Tax Refund to EME (2) 80 622 0 0 0 Less: Project Level Debt Amortization (17) (111) (113) (109) (106) Less: Project Level Interest Payments (83) (75) (71) (67) (61) Plus: Distributions from Unconsolidated Affiliates, Net (1) 2 (8) (2) 2 Minority Interests, Net (Including Capistrano) (3) (59) 20 (4) (29) Other Cash Flows (3) 140 111 (61) (76) (32) Less: Restructuring Costs (36) (36) 0 0 0 Free Cash Flow ($148) $150 ($218) $163 $261 Beginning Cash Balance 670 522 672 455 618 Ending Cash Balance (4) $522 $672 $455 $618 $879 Illustrative Free Cash Flow Excluding Midwest Generation (5) $253 $739 $48 $22 $61 Beginning Cash Balance Excluding Midwest Generation 595 848 1,586 1,634 1,656 Illustrative Ending Cash Balance Excluding Midwest Generation $848 $1,586 $1,634 $1,656 $1,716 Total Project Level Debt (6) $1,461 $1,129 $1,016 $907 $801 December 31, 2012 Projected Unrestricted Cash Balances Corporate Cash $401 EMMT 120 Midwest Generation 75 Other Project Level 75 Total Unrestricted Cash $670 Restricted Cash (7) $285 |
|
|
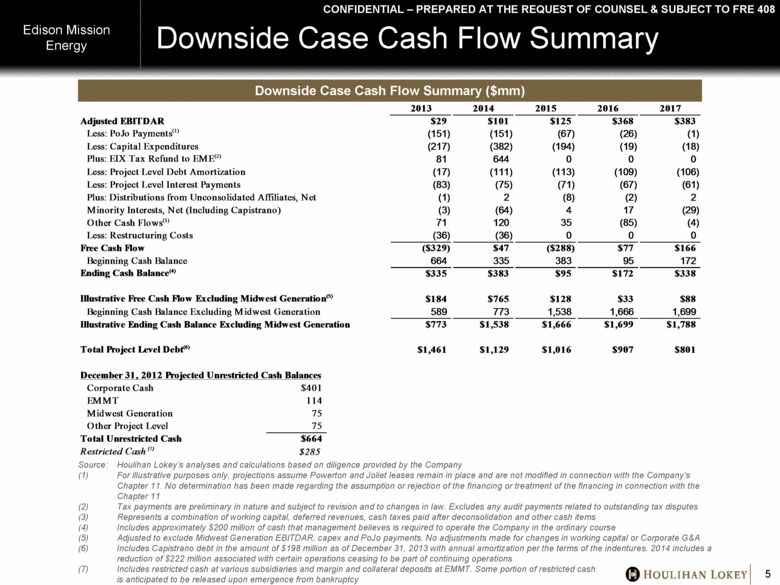
Downside Case Cash Flow Summary Edison Mission Energy 5 Downside Case Cash Flow Summary ($mm) CONFIDENTIAL – PREPARED AT THE REQUEST OF COUNSEL & SUBJECT TO FRE 408 Source: Houlihan Lokey’s analyses and calculations based on diligence provided by the Company For illustrative purposes only, projections assume Powerton and Joliet leases remain in place and are not modified in connection with the Company’s Chapter 11. No determination has been made regarding the assumption or rejection of the financing or treatment of the financing in connection with the Chapter 11 Tax payments are preliminary in nature and subject to revision and to changes in law. Excludes any audit payments related to outstanding tax disputes Represents a combination of working capital, deferred revenues, cash taxes paid after deconsolidation and other cash items Includes approximately $200 million of cash that management believes is required to operate the Company in the ordinary course Adjusted to exclude Midwest Generation EBITDAR, capex and PoJo payments. No adjustments made for changes in working capital or Corporate G&A Includes Capistrano debt in the amount of $198 million as of December 31, 2013 with annual amortization per the terms of the indentures. 2014 includes a reduction of $222 million associated with certain operations ceasing to be part of continuing operations Includes restricted cash at various subsidiaries and margin and collateral deposits at EMMT. Some portion of restricted cash is anticipated to be released upon emergence from bankruptcy 2013 2014 2015 2016 2017 Adjusted EBITDAR $29 $101 $125 $368 $383 Less: PoJo Payments (1) (151) (151) (67) (26) (1) Less: Capital Expenditures (217) (382) (194) (19) (18) Plus: EIX Tax Refund to EME (2) 81 644 0 0 0 Less: Project Level Debt Amortization (17) (111) (113) (109) (106) Less: Project Level Interest Payments (83) (75) (71) (67) (61) Plus: Distributions from Unconsolidated Affiliates, Net (1) 2 (8) (2) 2 Minority Interests, Net (Including Capistrano) (3) (64) 4 17 (29) Other Cash Flows (3) 71 120 35 (85) (4) Less: Restructuring Costs (36) (36) 0 0 0 Free Cash Flow ($329) $47 ($288) $77 $166 Beginning Cash Balance 664 335 383 95 172 Ending Cash Balance (4) $335 $383 $95 $172 $338 Illustrative Free Cash Flow Excluding Midwest Generation (5) $184 $765 $128 $33 $88 Beginning Cash Balance Excluding Midwest Generation 589 773 1,538 1,666 1,699 Illustrative Ending Cash Balance Excluding Midwest Generation $773 $1,538 $1,666 $1,699 $1,788 Total Project Level Debt (6) $1,461 $1,129 $1,016 $907 $801 December 31, 2012 Projected Unrestricted Cash Balances Corporate Cash $401 EMMT 114 Midwest Generation 75 Other Project Level 75 Total Unrestricted Cash $664 Restricted Cash (7) $285 |
|
|
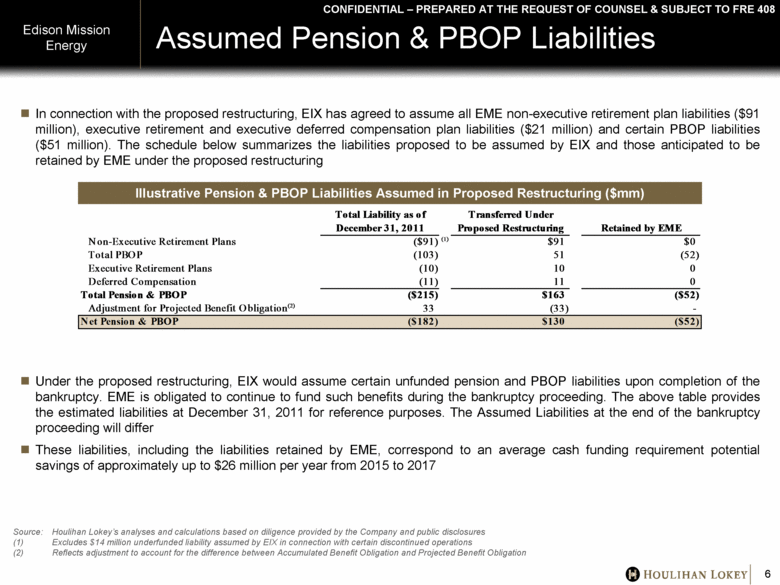
Assumed Pension & PBOP Liabilities In connection with the proposed restructuring, EIX has agreed to assume all EME non-executive retirement plan liabilities ($91 million), executive retirement and executive deferred compensation plan liabilities ($21 million) and certain PBOP liabilities ($51 million). The schedule below summarizes the liabilities proposed to be assumed by EIX and those anticipated to be retained by EME under the proposed restructuring Under the proposed restructuring, EIX would assume certain unfunded pension and PBOP liabilities upon completion of the bankruptcy. EME is obligated to continue to fund such benefits during the bankruptcy proceeding. The above table provides the estimated liabilities at December 31, 2011 for reference purposes. The Assumed Liabilities at the end of the bankruptcy proceeding will differ These liabilities, including the liabilities retained by EME, correspond to an average cash funding requirement potential savings of approximately up to $26 million per year from 2015 to 2017 Edison Mission Energy 6 Illustrative Pension & PBOP Liabilities Assumed in Proposed Restructuring ($mm) Source: Houlihan Lokey’s analyses and calculations based on diligence provided by the Company and public disclosures Excludes $14 million underfunded liability assumed by EIX in connection with certain discontinued operations Reflects adjustment to account for the difference between Accumulated Benefit Obligation and Projected Benefit Obligation CONFIDENTIAL – PREPARED AT THE REQUEST OF COUNSEL & SUBJECT TO FRE 408 Total Liability as of Transferred Under December 31, 2011 Proposed Restructuring Retained by EME Non-Executive Retirement Plans ($91) (1) $91 $0 Total PBOP (103) 51 (52) Executive Retirement Plans (10) 10 0 Deferred Compensation (11) 11 0 Total Pension & PBOP ($215) $163 ($52) Adjustment for Projected Benefit Obligation (2) 33 (33) - Net Pension & PBOP ($182) $130 ($52) |

