Attached files
| file | filename |
|---|---|
| 8-K - 8-K - Inland Diversified Real Estate Trust, Inc. | a12-29345_18k.htm |
Exhibit 99.1
|
|
Inland Diversified Real Estate Trust, Inc. Third Quarter 2012 Earnings Webcast Thursday, December 13, 2012 2:00 PM (Central) Barry Lazarus, President & Chief Operating Officer Inland Diversified Real Estate Trust, Inc. JoAnn McGuinness, President & Chief Executive Officer Inland Diversified Real Estate Services, LLC Steven Hippel, Chief Financial Officer & Treasurer Inland Diversified Real Estate Trust, Inc. Audio is available via webcast – dial in number not required. |

|
|
Important Disclosure 2 This material is neither an offer to sell nor the solicitation of an offer to buy any security, which can be made only by a prospectus, filed or registered with appropriate state and federal regulatory agencies, and sold only by broker dealers authorized to do so. An investment in Inland Diversified Real Estate Trust, Inc. (“Inland Diversified”) involves a high degree of risk. Consult Inland Diversified’s most recent Annual Report on Form 10-K and any subsequent Quarterly Reports on Form 10-Q for more information on the specific risks. All properties represented in photographs herein are owned by Inland Diversified or its subsidiaries. The companies depicted in photographs herein may have proprietary interests in their trade names and trademarks and nothing herein shall be considered to be an endorsement, authorization or approval of Inland Diversified by the companies. Further, none of these companies are affiliated with Inland Diversified or its subsidiaries in any manner. The Inland name and logo are registered trademarks being used under license. This material has been distributed by Inland Securities Corporation. Inland Securities Corporation member FINRA/SIPC. Inland Diversified is a part of The Inland Real Estate Group of Companies, Inc., a group of independent legal entities some of which may be affiliates, share some common ownership or have been sponsored and managed by Inland Investments or its subsidiaries. Date first published: 12/1/11 Current publication date: 12/13/12 |
|
|
Current & Future Outlook for Inland Diversified Successful completion of public offering Deployment of capital and status of pipeline Profile of portfolio after investing initial capital raised Next phase of operation for the company Consideration of potential liquidity event Joint venture potential Pursue limited development opportunities Other considerations 4 |
|
|
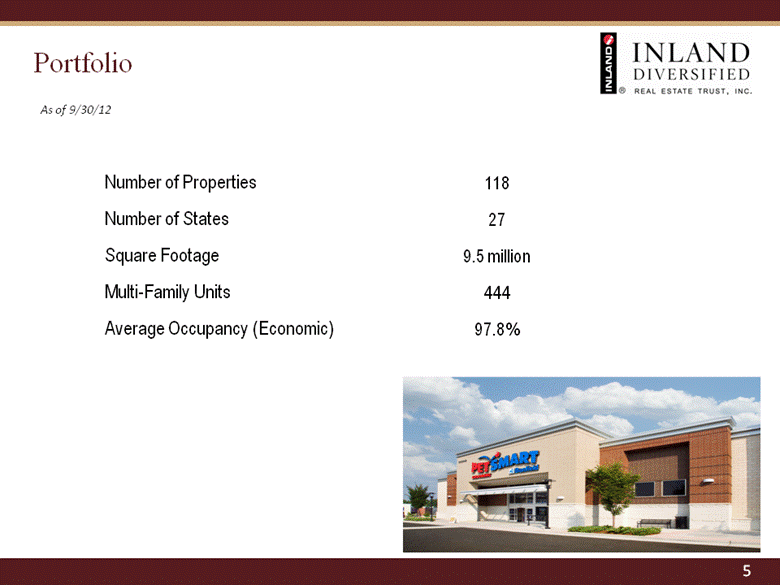
Portfolio 5 Number of Properties 118 Number of States 27 Square Footage 9.5 million Multi-Family Units 444 Average Occupancy (Economic) 97.8% As of 9/30/12 |
|
|
Top Five Tenants* % of % of Portfolio Portfolio Gross Total Gross Total Total No. of Leasable Leasable Annualized Annualized Tenant Leases Area SF Area Base Rent Base Rent Kohl’s 9 764,200 10.5% $7,392,000 7.1% Walgreens 13 189,347 2.6% $6,727,000 6.5% Dollar General 39 427,321 5.9% $4,178,000 4.0% PetSmart 14 261,966 3.6% $3,959,000 3.8% Publix Super Markets 7 336,719 4.6% $3,747,000 3.6% Top Five Tenants 82 1,979,553 27.2% $26,003,000 25.0% *Based on annualized base rent. Table based on leases in-place on September 30, 2012. 6 |

|
|
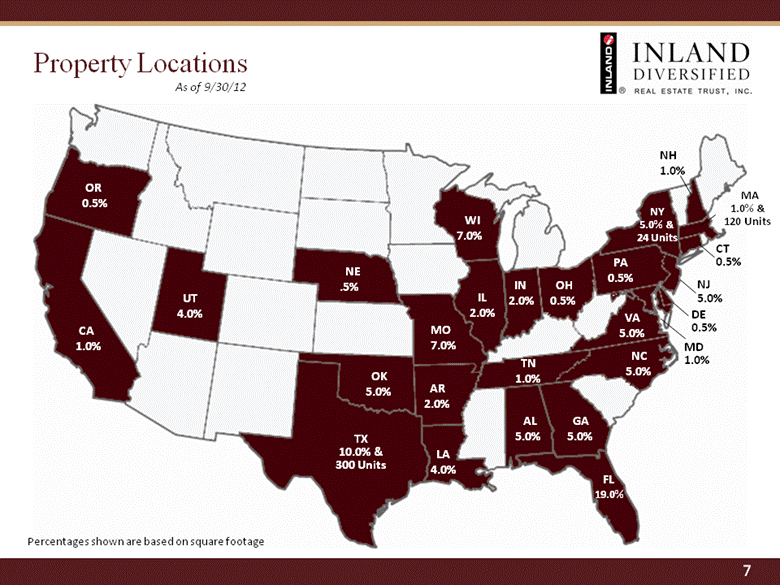
Property Locations 7 As of 9/30/12 21 States % Based on Square Footage 1.2% 1.5% 6.7% 1.2% 4.9% 300 units 7.6% 2.6% 6.1% 5% 6% 22.2% 8.1% 6.9% 1.7% 3.4% 1.8% 11.7% OR 0.5% CA 1.0% UT 4.0% TX 10.0% & 300 Units NE .5% OK 5.0% MO 7.0% AR 2.0% LA 4.0% WI 7.0% IL 2.0% IN 2.0% FL 19.0% AL 5.0% GA 5.0% TN 1.0% NC 5.0% VA 5.0% NY 5.0% & 24 Units NH 1.0% NJ 5.0% OH 0.5% MA 1.0% & 120 Units CT 0.5% Percentages shown are based on square footage PA 0.5% MD 1.0% DE 0.5% |
|
|
Diverse Tenant Mix* As of 9/30/12 Other 0.8% Electronic 2.6% Commercial Office 2.9% Health, Doctors & Health Food 3.4% Pet Supplies 3.5% Consumer Services, Salons, Cleaners & Banks 4.0% Industrial 4.4% Multi-Family 4.6% Home Improvement 4.9% Sporting Goods 4.9% Home Goods 5.2% Restaurants & Fast Food 5.6% Clothing & Accessories 6.1% Lifestyle, Health Clubs, Books & Phones 11.1% Department 11.2% Dollar Stores & Off Price Clothing 11.7% Grocery *By Square Feet 8 |

|
|
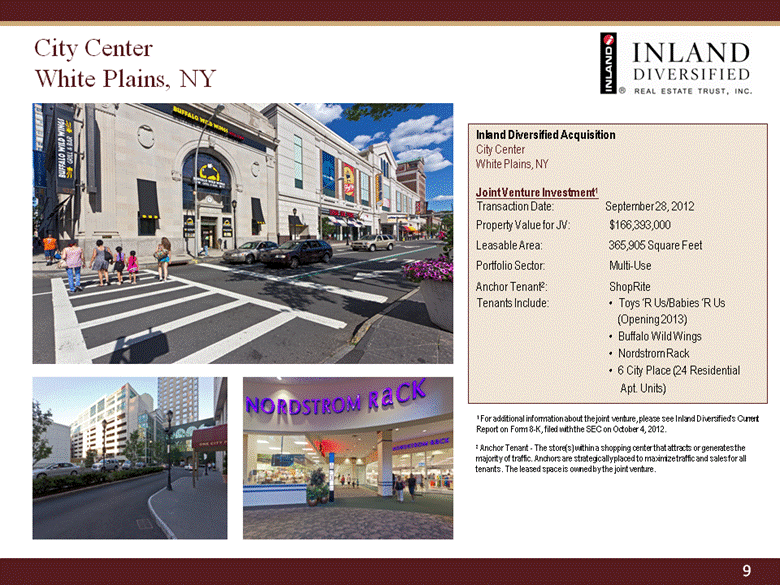
Inland Diversified Acquisition City Center White Plains, NY Joint Venture Investment1 Transaction Date: September 28, 2012 Property Value for JV: $166,393,000 Leasable Area: 365,905 Square Feet Portfolio Sector: Multi-Use Anchor Tenant2: ShopRite Tenants Include: • Toys ‘R Us/Babies ‘R Us (Opening 2013) • Buffalo Wild Wings • Nordstrom Rack • 6 City Place (24 Residential Apt. Units) City Center White Plains, NY 9 2 Anchor Tenant - The store(s) within a shopping center that attracts or generates the majority of traffic. Anchors are strategically placed to maximize traffic and sales for all tenants. The leased space is owned by the joint venture. 1 For additional information about the joint venture, please see Inland Diversified’s Current Report on Form 8-K, filed with the SEC on October 4, 2012. |
|
|
Inland Diversified Acquisition Miramar Square Miramar, FL Transaction Date: September 28, 2012 Transaction Price: $57,120,000 Leasable Area: 238,334 Square Feet Portfolio Sector: Retail Anchor Tenant*: Kohl’s Tenants Include: • Staples • Plato’s Closet • Dollar General • Goodard School Miramar Square Miramar, FL * Anchor Tenant - The store(s) within a shopping center that attracts or generates the majority of traffic. Anchors are strategically placed to maximize traffic and sales for all tenants. The leased space is owned by Inland Diversified. 10 |

|
|
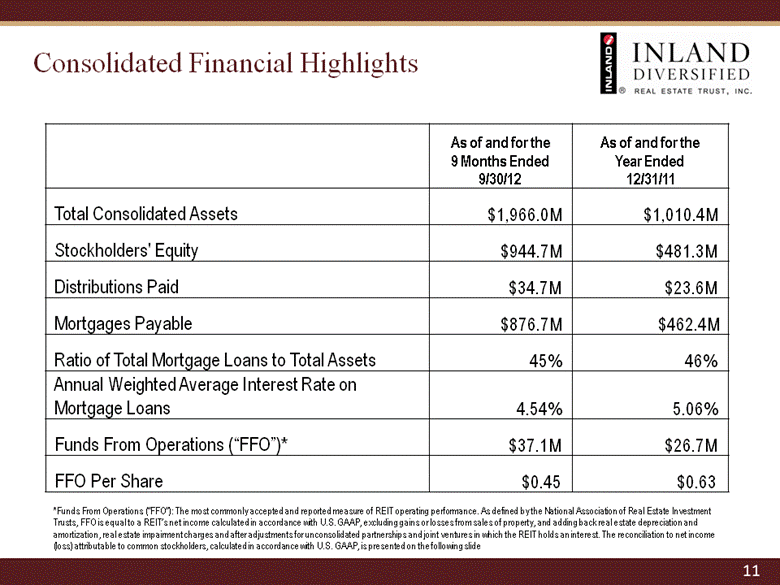
Consolidated Financial Highlights 11 As of and for the 9 Months Ended 9/30/12 As of and for the Year Ended 12/31/11 Total Consolidated Assets $1,966.0M $1,010.4M Stockholders' Equity $944.7M $481.3M Distributions Paid $34.7M $23.6M Mortgages Payable $876.7M $462.4M Ratio of Total Mortgage Loans to Total Assets 45% 46% Annual Weighted Average Interest Rate on Mortgage Loans 4.54% 5.06% Funds From Operations (“FFO”)* $37.1M $26.7M FFO Per Share $0.45 $0.63 *Funds From Operations (“FFO”): The most commonly accepted and reported measure of REIT operating performance. As defined by the National Association of Real Estate Investment Trusts, FFO is equal to a REIT’s net income calculated in accordance with U.S. GAAP, excluding gains or losses from sales of property, and adding back real estate depreciation and amortization, real estate impairment charges and after adjustments for unconsolidated partnerships and joint ventures in which the REIT holds an interest. The reconciliation to net income (loss) attributable to common stockholders, calculated in accordance with U.S. GAAP, is presented on the following slide |
|
|
Cash Flows From Operations and FFO Dollar Amounts in Thousands 12 For the 9 Months Ended 9/30/12 For the 9 Months Ended 9/30/11 For the Year Ended 12/31/11 GAAP Net Income (Loss) Attributable to Common Stockholders $2,922 ($2,581) ($2,279) Add: Depreciation and Amortization Related to Investment Properties $34,215 $20,327 $28,980 Less: Non-controlling Interest’s Share of Depreciation and Amortization Related to Investment Properties - ($16) ($29) FFO* $37,137 $17,730 $26,672 Cash Flow From Operations $39,686 $22,843 $27,872 Distributions Paid $34,741 $15,997 $23,641 *This is a non-GAAP measure. |

|
|
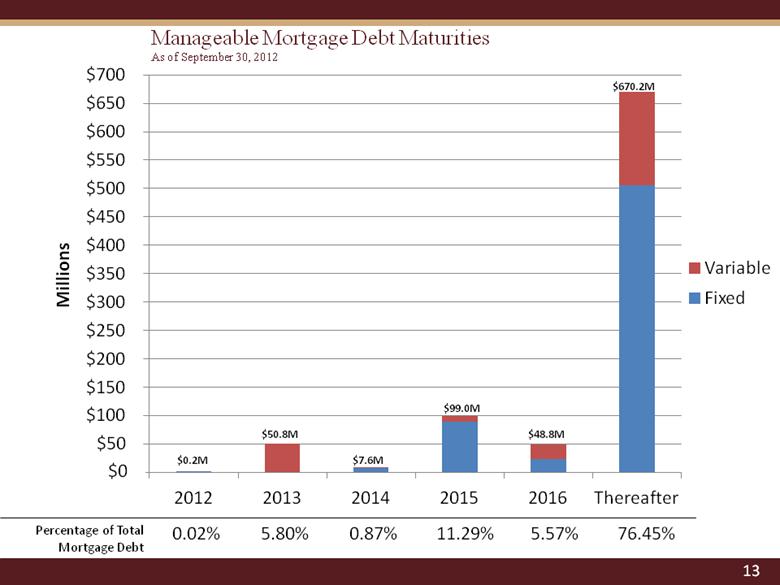
Manageable Mortgage Debt Maturities As of September 30, 2012 $50 $100 $150 $200 $250 $300 $350 $400 $450 $500 $550 $600 $650 $700 2012 2013 2014 2015 2016 Thereafter Millions Variable Fixed $670.2M $48.8M $99.0M $7.6M $50.8M $0.2M $0 Percentage of Total Mortgage Debt 0.02% 5.80% 0.87% 11.29% 5.57% 76.45% 13 |