Attached files
| file | filename |
|---|---|
| 8-K - CURRENT REPORT OF MATERIAL EVENTS OR CORPORATE CHANGES - Southcross Energy Partners, L.P. | a12-28339_18k.htm |
Exhibit 99.1
|
|
Southcross Energy Partners Wells Fargo Securities Research and Economics 11th Annual Pipeline, MLP and Energy Symposium December 4, 2012 |
|
|
Cautionary Statements This presentation contains forward-looking statements and information. These forward-looking statements, which in many instances can be identified by words such as “could,” “will,” “may,” “assume,” “forecast,” “position,” “predict,” “strategy,” “expect,” “intend,” “plan,” “estimate,” “anticipate,” “believe,” “project,” “budget,” “potential,” or “proposed,” give current expectations or forecasts of future events or contain projections of results of operations or financial condition. Examples include discussion of our strategies, financing plans and growth opportunities. These forward-looking statements are based on our current information, expectations and beliefs; they are not a guarantee of future results, and you should not place undue reliance on such statements. Forward-looking statements are subject to many risks, uncertainties and other variable circumstances including those discussed in filings we make with the Securities and Exchange Commission, particularly under the headings “Risk Factors” and “Management’s Discussion and Analysis of Financial Condition and Results of Operations.” Many of these risks are outside of our control and could cause our actual results and experience to differ materially from those we anticipated would occur. Key uncertainties and risks that may directly affect our performance, future growth, results of operations, and financial condition, include, but are not limited to: • the volatility of prices and market demand for natural gas, crude oil, condensate and NGLs, and for products derived from these commodities; • our ability to continue to connect new sources of natural gas, crude oil and condensate, and the NGL content of new gas supplies; the ability of producers to continue to drill and successfully complete and connect new volumes; our ability to attract and retain key customers and contract with new customers, and such customers' performance under their contracts with us; • the availability of local, intrastate and interstate transportation systems, trucks and other facilities and services for natural gas, NGLs and related products; • financial credit risks and the failure of customers to satisfy payment or other obligations under our contracts; • effects of our debt and other financial obligations, access to capital, or our future financial or operational flexibility or liquidity; • construction, procurement, and regulatory risks in our development projects; • hurricanes, fires, and other natural and accidental events impacting our operations, and adequate insurance coverage; • terrorist attacks directed at our facilities or related facilities; • changes in and impacts of laws and regulations affecting our operations and risk management strategy; and • our ability to integrate acquisitions. The forward-looking statements included in this presentation are made only as of the date hereof. Except as required by law, we do not undertake, and specifically decline, any obligation to update any such statements or to publicly announce the results of any revisions to any of such statements to reflect future events or developments. |
|
|
Summary |
|
|
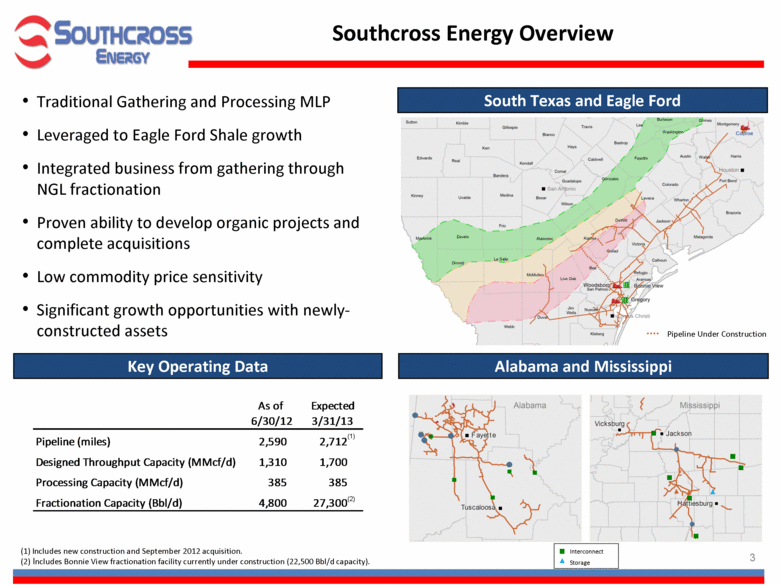
Southcross Energy Overview Alabama and Mississippi South Texas and Eagle Ford Storage Interconnect Traditional Gathering and Processing MLP Leveraged to Eagle Ford Shale growth Integrated business from gathering through NGL fractionation Proven ability to develop organic projects and complete acquisitions Low commodity price sensitivity Significant growth opportunities with newly-constructed assets Key Operating Data (1) Includes new construction and September 2012 acquisition. (2) Includes Bonnie View fractionation facility currently under construction (22,500 Bbl/d capacity). Pipeline Under Construction (1) (2) As of Expected 6/30/12 3/31/13 Pipeline (miles) 2,590 2,712 Designed Throughput Capacity (MMcf/d) 1,310 1,700 Processing Capacity (MMcf/d) 385 385 Fractionation Capacity (Bbl/d) 4,800 27,300 |
|
|
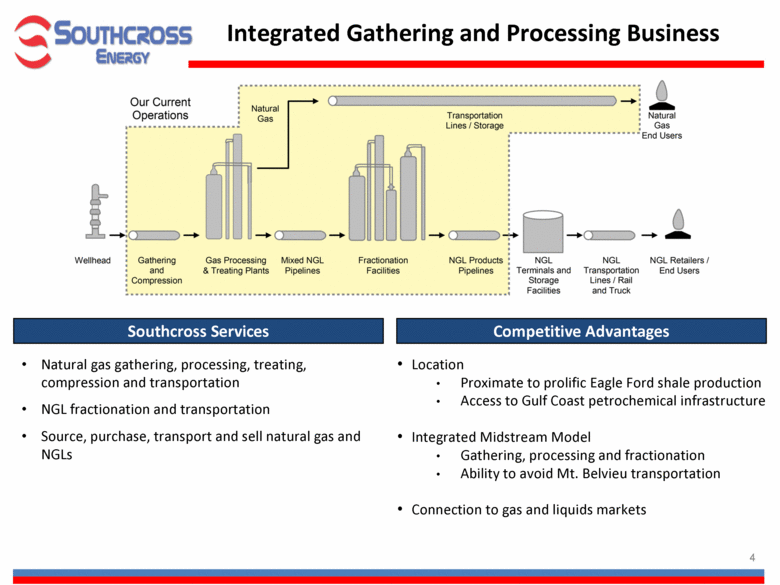
Integrated Gathering and Processing Business Competitive Advantages Southcross Services Natural gas gathering, processing, treating, compression and transportation NGL fractionation and transportation Source, purchase, transport and sell natural gas and NGLs Location Proximate to prolific Eagle Ford shale production Access to Gulf Coast petrochemical infrastructure Integrated Midstream Model Gathering, processing and fractionation Ability to avoid Mt. Belvieu transportation Connection to gas and liquids markets |
|
|
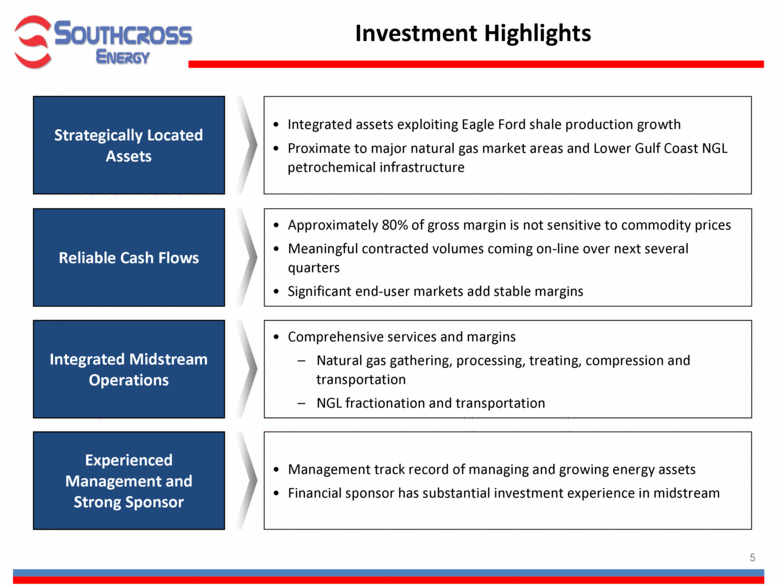
Investment Highlights Reliable Cash Flows Approximately 80% of gross margin is not sensitive to commodity prices Meaningful contracted volumes coming on-line over next several quarters Significant end-user markets add stable margins Strategically Located Assets Integrated assets exploiting Eagle Ford shale production growth Proximate to major natural gas market areas and Lower Gulf Coast NGL petrochemical infrastructure Integrated Midstream Operations Comprehensive services and margins Natural gas gathering, processing, treating, compression and transportation NGL fractionation and transportation Experienced Management and Strong Sponsor Management track record of managing and growing energy assets Financial sponsor has substantial investment experience in midstream |
|
|
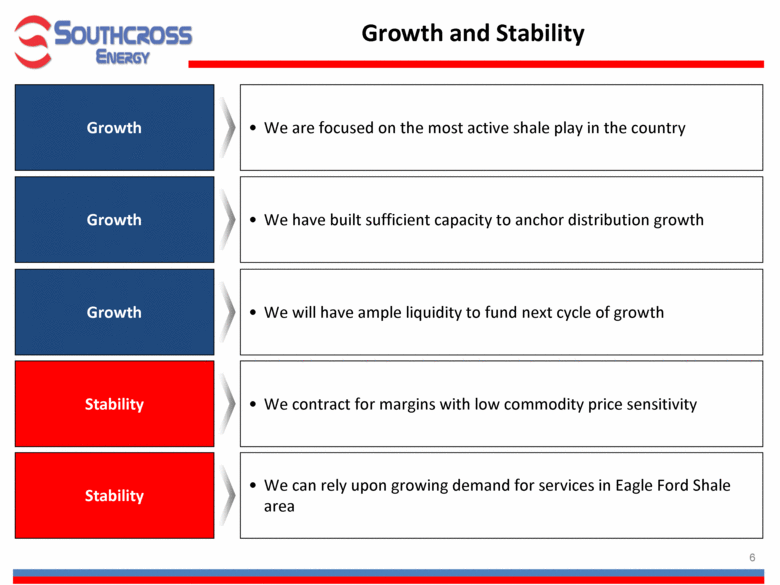
Growth We will have ample liquidity to fund next cycle of growth Growth We are focused on the most active shale play in the country Growth We have built sufficient capacity to anchor distribution growth Stability We can rely upon growing demand for services in Eagle Ford Shale area Stability We contract for margins with low commodity price sensitivity Growth and Stability |
|
|
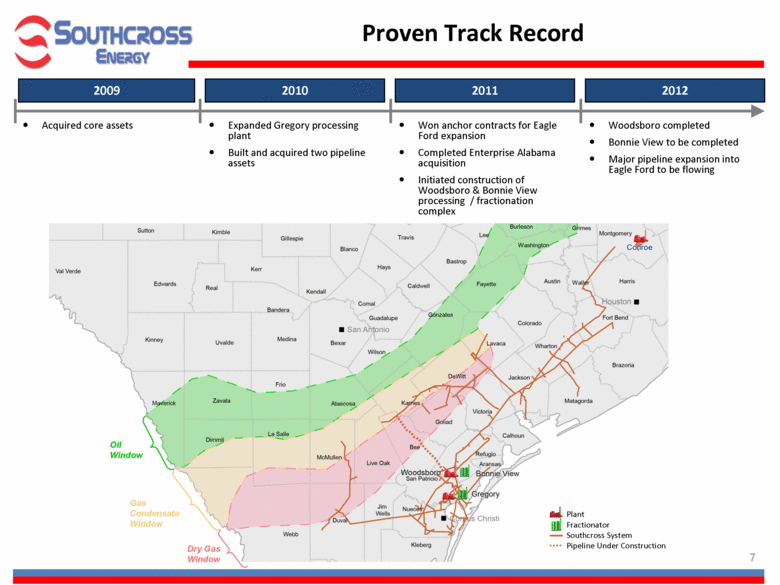
Proven Track Record 2009 Acquired core assets Oil Window Gas Condensate Window Dry Gas Window Plant Fractionator Southcross System Pipeline Under Construction 2010 2011 2012 Expanded Gregory processing plant Built and acquired two pipeline assets Won anchor contracts for Eagle Ford expansion Completed Enterprise Alabama acquisition Initiated construction of Woodsboro & Bonnie View processing / fractionation complex Woodsboro completed Bonnie View to be completed Major pipeline expansion into Eagle Ford to be flowing |
|
|
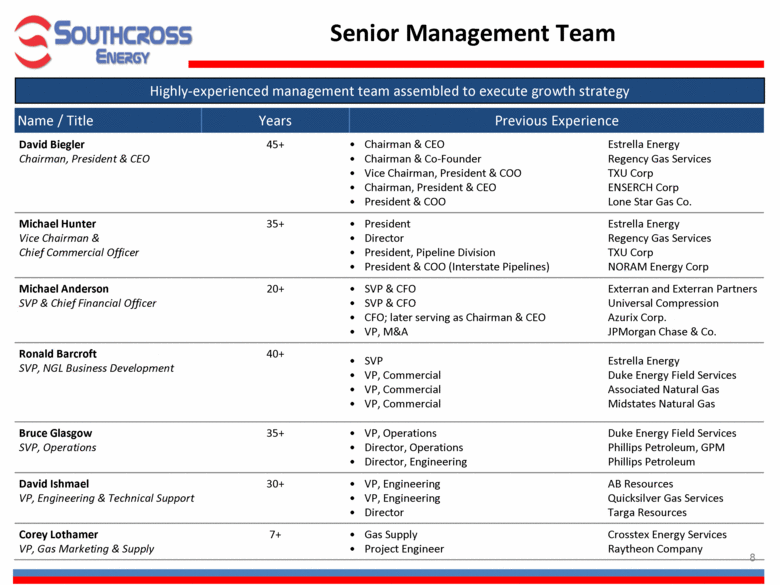
Senior Management Team Name / Title Years Previous Experience David Biegler Chairman, President & CEO 45+ Chairman & CEO Estrella Energy Chairman & Co-Founder Regency Gas Services Vice Chairman, President & COO TXU Corp Chairman, President & CEO ENSERCH Corp President & COO Lone Star Gas Co. Michael Hunter Vice Chairman & Chief Commercial Officer 35+ President Estrella Energy Director Regency Gas Services President, Pipeline Division TXU Corp President & COO (Interstate Pipelines) NORAM Energy Corp Michael Anderson SVP & Chief Financial Officer 20+ SVP & CFO Exterran and Exterran Partners SVP & CFO Universal Compression CFO; later serving as Chairman & CEO Azurix Corp. VP, M&A JPMorgan Chase & Co. Ronald Barcroft SVP, NGL Business Development 40+ SVP Estrella Energy VP, Commercial Duke Energy Field Services VP, Commercial Associated Natural Gas VP, Commercial Midstates Natural Gas Bruce Glasgow SVP, Operations 35+ VP, Operations Duke Energy Field Services Director, Operations Phillips Petroleum, GPM Director, Engineering Phillips Petroleum David Ishmael VP, Engineering & Technical Support 30+ VP, Engineering AB Resources VP, Engineering Quicksilver Gas Services Director Targa Resources Corey Lothamer VP, Gas Marketing & Supply 7+ Gas Supply Crosstex Energy Services Project Engineer Raytheon Company Highly-experienced management team assembled to execute growth strategy |
|
|
Asset Overview |
|
|
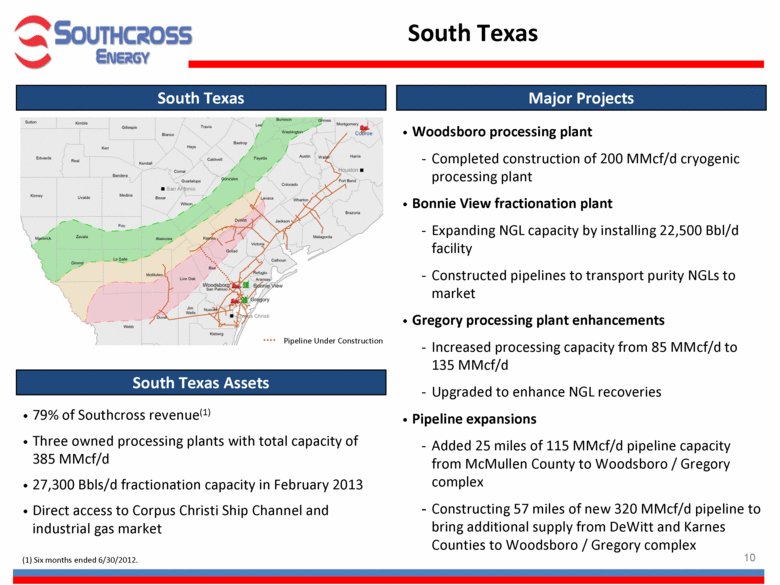
Woodsboro processing plant Completed construction of 200 MMcf/d cryogenic processing plant Bonnie View fractionation plant Expanding NGL capacity by installing 22,500 Bbl/d facility Constructed pipelines to transport purity NGLs to market Gregory processing plant enhancements Increased processing capacity from 85 MMcf/d to 135 MMcf/d Upgraded to enhance NGL recoveries Pipeline expansions Added 25 miles of 115 MMcf/d pipeline capacity from McMullen County to Woodsboro / Gregory complex Constructing 57 miles of new 320 MMcf/d pipeline to bring additional supply from DeWitt and Karnes Counties to Woodsboro / Gregory complex South Texas South Texas 79% of Southcross revenue(1) Three owned processing plants with total capacity of 385 MMcf/d 27,300 Bbls/d fractionation capacity in February 2013 Direct access to Corpus Christi Ship Channel and industrial gas market South Texas Assets Major Projects Pipeline Under Construction (1) Six months ended 6/30/2012. |
|
|
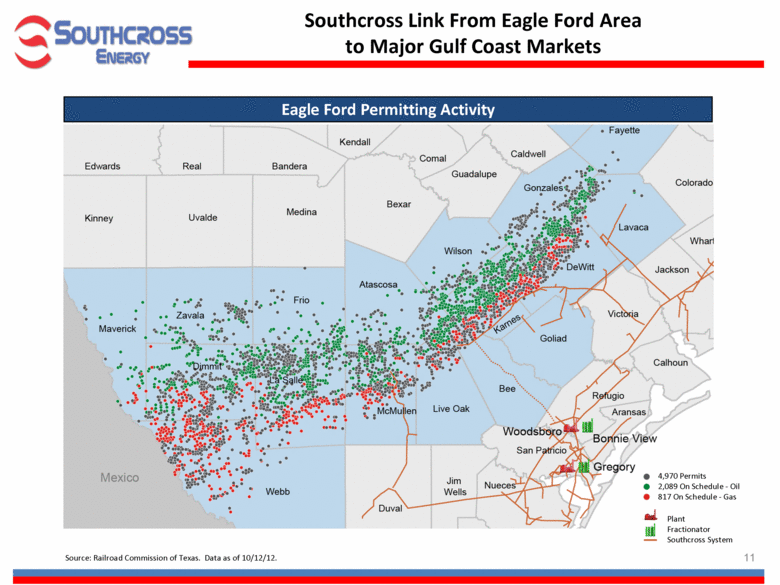
Southcross Link From Eagle Ford Area to Major Gulf Coast Markets Eagle Ford Permitting Activity 4,970 Permits 2,089 On Schedule - Oil 817 On Schedule - Gas Source: Railroad Commission of Texas. Data as of 10/12/12. Plant Fractionator Southcross System |
|
|
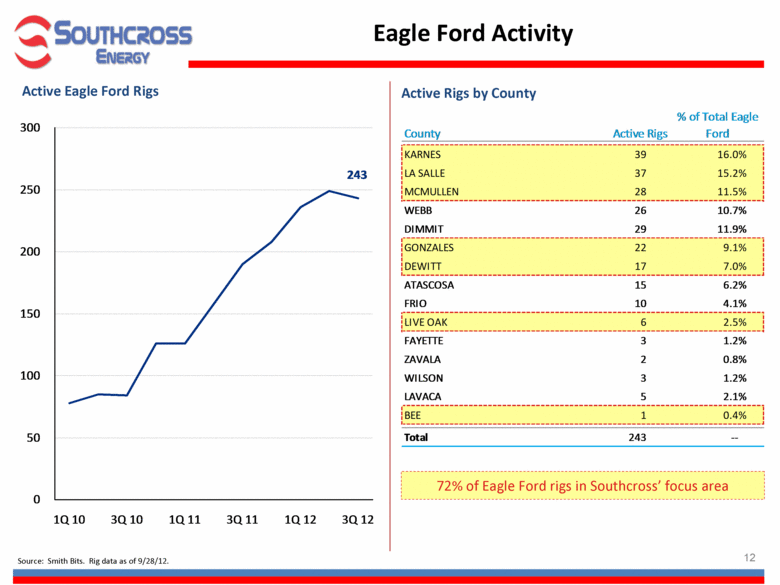
Eagle Ford Activity Active Rigs by County Active Eagle Ford Rigs Source: Smith Bits. Rig data as of 9/28/12. 72% of Eagle Ford rigs in Southcross’ focus area 0 50 100 150 200 250 300 1Q 10 3Q 10 1Q 11 3Q 11 1Q 12 3Q 12 243 County Active Rigs % of Total Eagle Ford KARNES 39 16.0% LA SALLE 37 15.2% MCMULLEN 28 11.5% WEBB 26 10.7% DIMMIT 29 11.9% GONZALES 22 9.1% DEWITT 17 7.0% ATASCOSA 15 6.2% FRIO 10 4.1% LIVE OAK 6 2.5% FAYETTE 3 1.2% ZAVALA 2 0.8% WILSON 3 1.2% LAVACA 5 2.1% BEE 1 0.4% Total 243 -- |
|
|
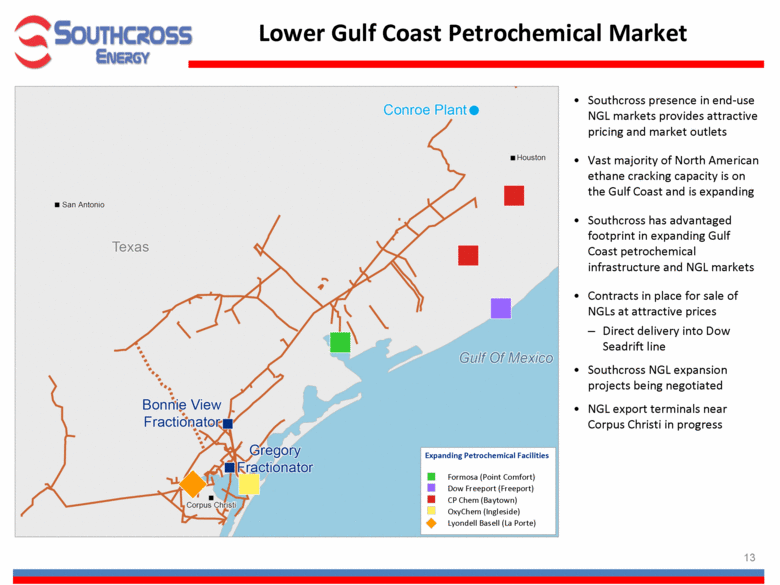
Southcross presence in end-use NGL markets provides attractive pricing and market outlets Vast majority of North American ethane cracking capacity is on the Gulf Coast and is expanding Southcross has advantaged footprint in expanding Gulf Coast petrochemical infrastructure and NGL markets Contracts in place for sale of NGLs at attractive prices Direct delivery into Dow Seadrift line Southcross NGL expansion projects being negotiated NGL export terminals near Corpus Christi in progress Lower Gulf Coast Petrochemical Market Expanding Petrochemical Facilities Formosa (Point Comfort) Dow Freeport (Freeport) CP Chem (Baytown) OxyChem (Ingleside) Lyondell Basell (La Porte) |
|
|
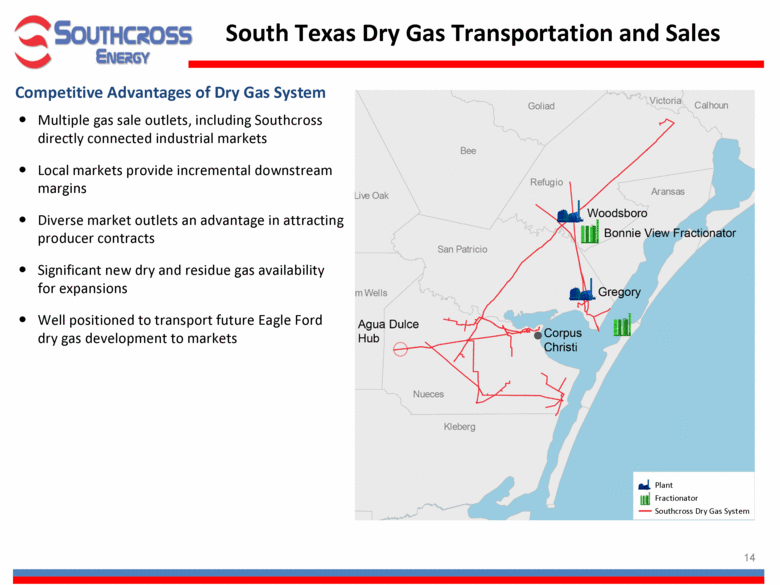
Multiple gas sale outlets, including Southcross directly connected industrial markets Local markets provide incremental downstream margins Diverse market outlets an advantage in attracting producer contracts Significant new dry and residue gas availability for expansions Well positioned to transport future Eagle Ford dry gas development to markets South Texas Dry Gas Transportation and Sales Competitive Advantages of Dry Gas System Plant Fractionator Southcross Dry Gas System |
|
|
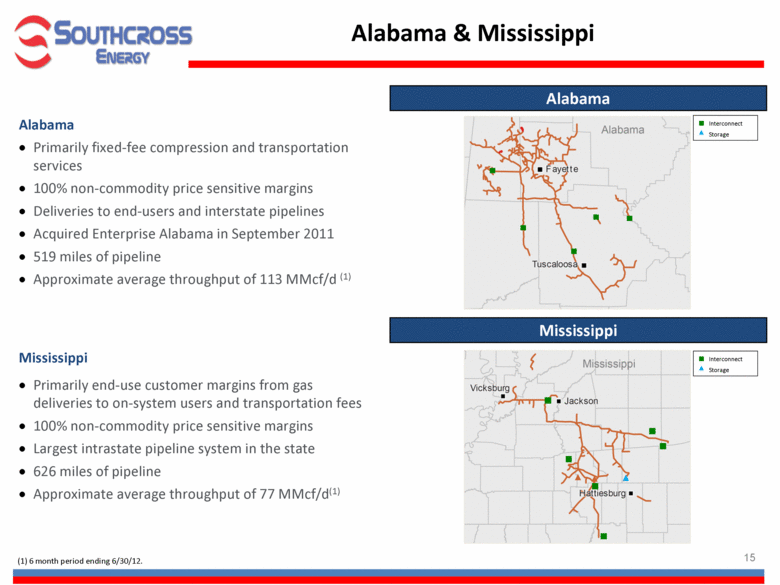
Alabama Primarily fixed-fee compression and transportation services 100% non-commodity price sensitive margins Deliveries to end-users and interstate pipelines Acquired Enterprise Alabama in September 2011 519 miles of pipeline Approximate average throughput of 113 MMcf/d (1) Alabama & Mississippi Mississippi Alabama Mississippi Primarily end-use customer margins from gas deliveries to on-system users and transportation fees 100% non-commodity price sensitive margins Largest intrastate pipeline system in the state 626 miles of pipeline Approximate average throughput of 77 MMcf/d(1) Storage Interconnect Storage Interconnect (1) 6 month period ending 6/30/12. |
|
|
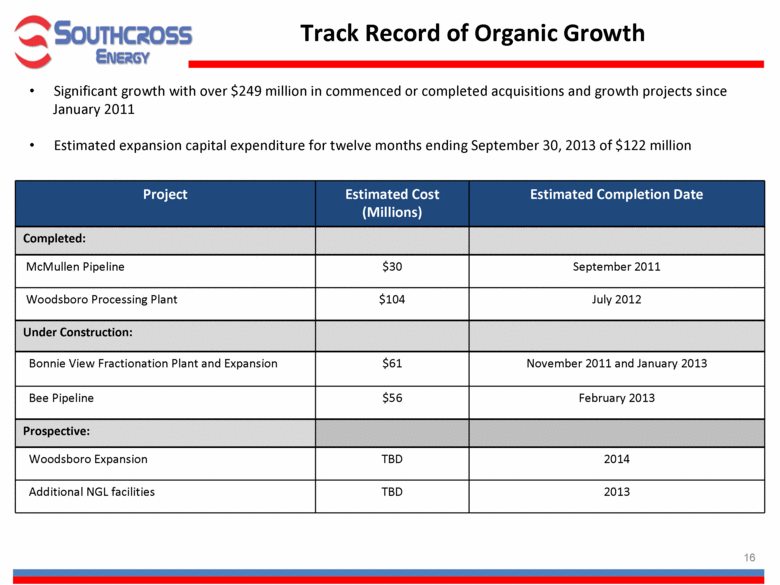
Track Record of Organic Growth Significant growth with over $249 million in commenced or completed acquisitions and growth projects since January 2011 Estimated expansion capital expenditure for twelve months ending September 30, 2013 of $122 million Project Estimated Cost (Millions) Estimated Completion Date Completed: McMullen Pipeline $30 September 2011 Woodsboro Processing Plant $104 July 2012 Under Construction: Bonnie View Fractionation Plant and Expansion $61 November 2011 and January 2013 Bee Pipeline $56 February 2013 Prospective: Woodsboro Expansion TBD 2014 Additional NGL facilities TBD 2013 |
|
|
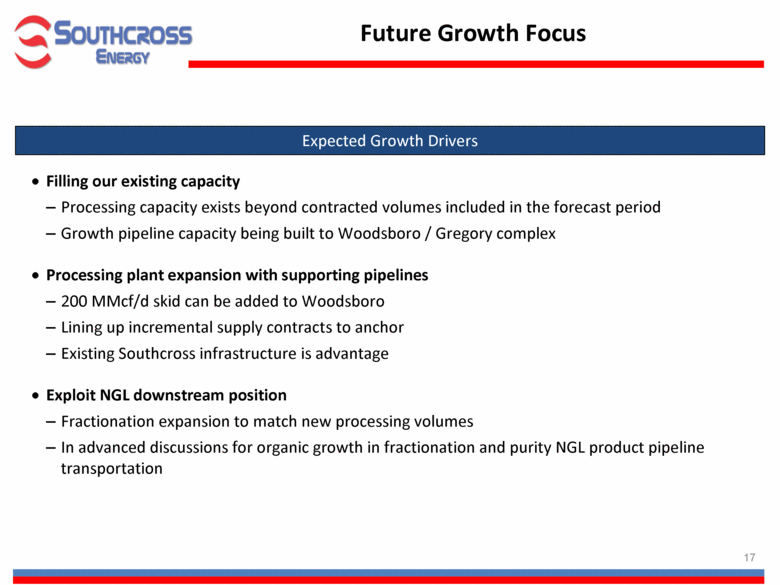
Future Growth Focus Expected Growth Drivers Filling our existing capacity Processing capacity exists beyond contracted volumes included in the forecast period Growth pipeline capacity being built to Woodsboro / Gregory complex Processing plant expansion with supporting pipelines 200 MMcf/d skid can be added to Woodsboro Lining up incremental supply contracts to anchor Existing Southcross infrastructure is advantage Exploit NGL downstream position Fractionation expansion to match new processing volumes In advanced discussions for organic growth in fractionation and purity NGL product pipeline transportation |
|
|
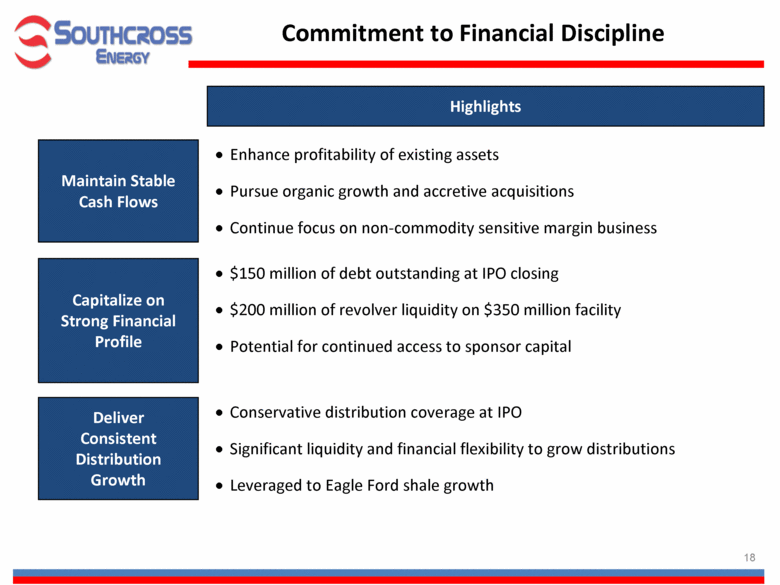
Commitment to Financial Discipline Enhance profitability of existing assets Pursue organic growth and accretive acquisitions Continue focus on non-commodity sensitive margin business $150 million of debt outstanding at IPO closing $200 million of revolver liquidity on $350 million facility Potential for continued access to sponsor capital Conservative distribution coverage at IPO Significant liquidity and financial flexibility to grow distributions Leveraged to Eagle Ford shale growth Maintain Stable Cash Flows Capitalize on Strong Financial Profile Deliver Consistent Distribution Growth Highlights |
|
|
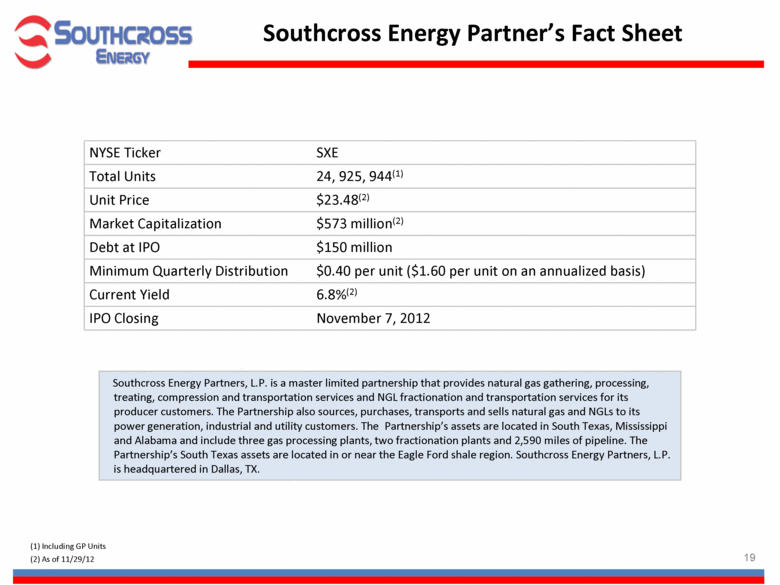
Southcross Energy Partner’s Fact Sheet NYSE Ticker SXE Total Units 24, 925, 944(1) Unit Price $23.48(2) Market Capitalization $573 million(2) Debt at IPO $150 million Minimum Quarterly Distribution $0.40 per unit ($1.60 per unit on an annualized basis) Current Yield 6.8%(2) IPO Closing November 7, 2012 Southcross Energy Partners, L.P. is a master limited partnership that provides natural gas gathering, processing, treating, compression and transportation services and NGL fractionation and transportation services for its producer customers. The Partnership also sources, purchases, transports and sells natural gas and NGLs to its power generation, industrial and utility customers. The .Partnership’s assets are located in South Texas, Mississippi and Alabama and include three gas processing plants, two fractionation plants and 2,590 miles of pipeline. The Partnership’s South Texas assets are located in or near the Eagle Ford shale region. Southcross Energy Partners, L.P. is headquartered in Dallas, TX. (2) As of 11/29/12 (1) Including GP Units |
|
|
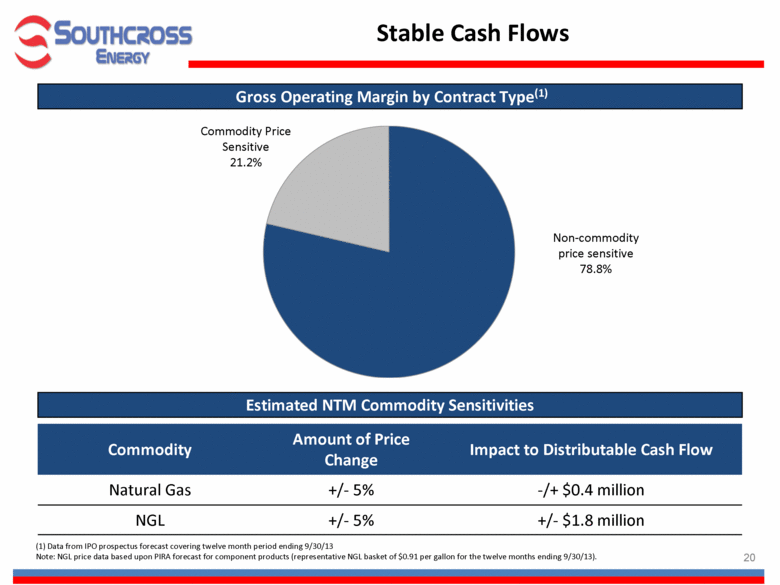
Stable Cash Flows Commodity Amount of Price Change Impact to Distributable Cash Flow Natural Gas +/- 5% -/+ $0.4 million NGL +/- 5% +/- $1.8 million Estimated NTM Commodity Sensitivities Gross Operating Margin by Contract Type(1) Non-commodity price sensitive 78.8% Commodity Price Sensitive 21.2% (1) Data from IPO prospectus forecast covering twelve month period ending 9/30/13 Note: NGL price data based upon PIRA forecast for component products (representative NGL basket of $0.91 per gallon for the twelve months ending 9/30/13). |
|
|
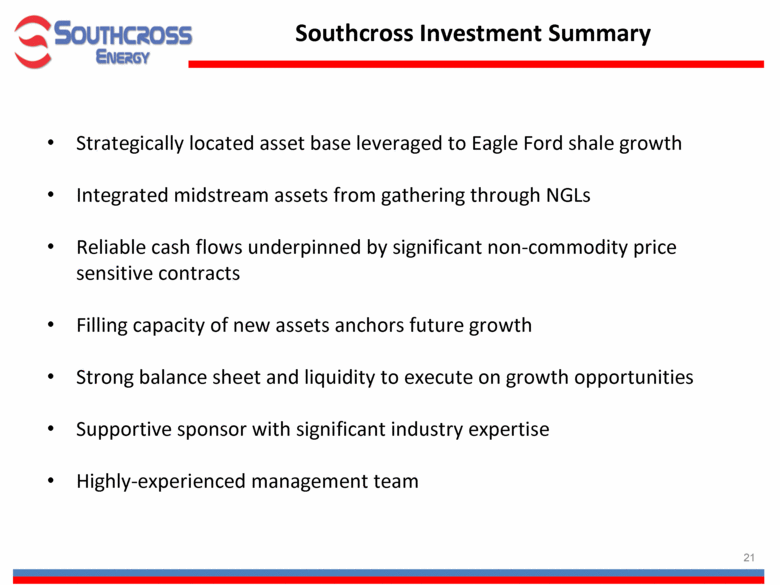
Southcross Investment Summary Strategically located asset base leveraged to Eagle Ford shale growth Integrated midstream assets from gathering through NGLs Reliable cash flows underpinned by significant non-commodity price sensitive contracts Filling capacity of new assets anchors future growth Strong balance sheet and liquidity to execute on growth opportunities Supportive sponsor with significant industry expertise Highly-experienced management team |
|
|
Appendix |
|
|
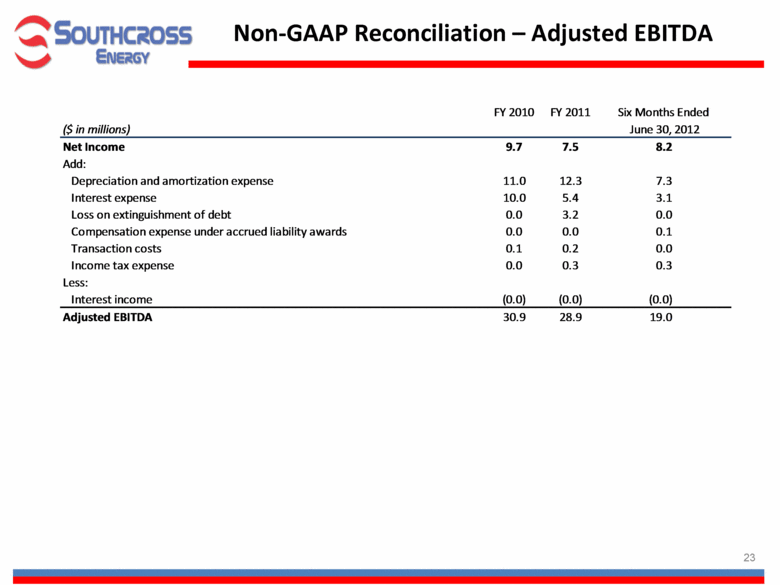
Non-GAAP Reconciliation – Adjusted EBITDA FY 2010 FY 2011 ($ in millions) Net Income 9.7 7.5 8.2 Add: Depreciation and amortization expense 11.0 12.3 7.3 Interest expense 10.0 5.4 3.1 Loss on extinguishment of debt 0.0 3.2 0.0 Compensation expense under accrued liability awards 0.0 0.0 0.1 Transaction costs 0.1 0.2 0.0 Income tax expense 0.0 0.3 0.3 Less: Interest income (0.0) (0.0) (0.0) Adjusted EBITDA 30.9 28.9 19.0 Six Months Ended June 30, 2012 |
|
|
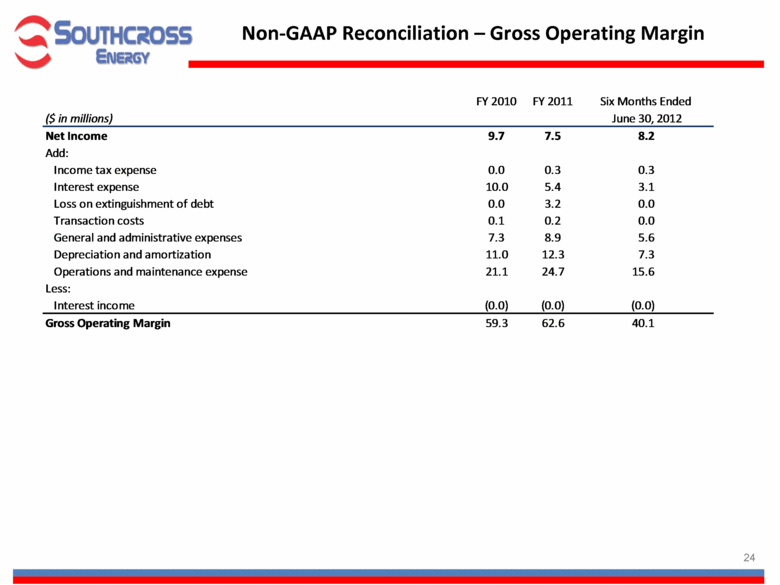
Non-GAAP Reconciliation – Gross Operating Margin FY 2010 FY 2011 ($ in millions) Net Income 9.7 7.5 8.2 Add: Income tax expense 0.0 0.3 0.3 Interest expense 10.0 5.4 3.1 Loss on extinguishment of debt 0.0 3.2 0.0 Transaction costs 0.1 0.2 0.0 General and administrative expenses 7.3 8.9 5.6 Depreciation and amortization 11.0 12.3 7.3 Operations and maintenance expense 21.1 24.7 15.6 Less: Interest income (0.0) (0.0) (0.0) Gross Operating Margin 59.3 62.6 40.1 June 30, 2012 Six Months Ended |
|
|
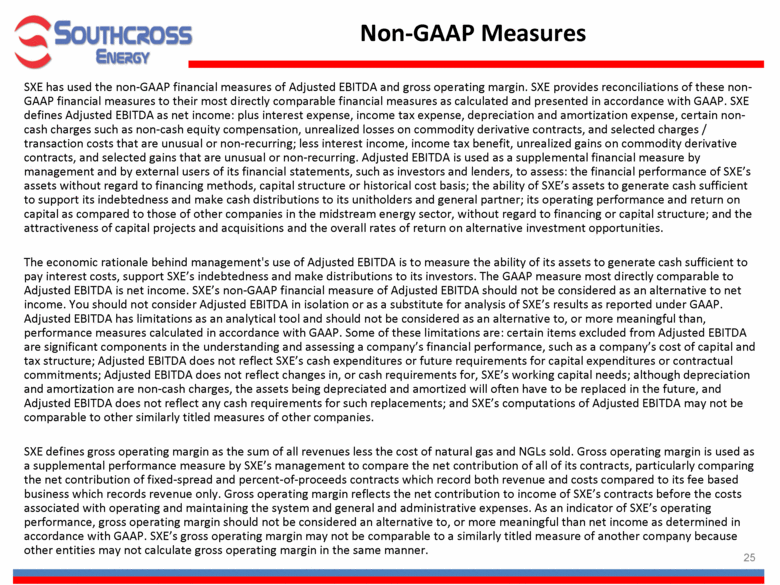
Non-GAAP Measures SXE has used the non-GAAP financial measures of Adjusted EBITDA and gross operating margin. SXE provides reconciliations of these non-GAAP financial measures to their most directly comparable financial measures as calculated and presented in accordance with GAAP. SXE defines Adjusted EBITDA as net income: plus interest expense, income tax expense, depreciation and amortization expense, certain non-cash charges such as non-cash equity compensation, unrealized losses on commodity derivative contracts, and selected charges / transaction costs that are unusual or non-recurring; less interest income, income tax benefit, unrealized gains on commodity derivative contracts, and selected gains that are unusual or non-recurring. Adjusted EBITDA is used as a supplemental financial measure by management and by external users of its financial statements, such as investors and lenders, to assess: the financial performance of SXE’s assets without regard to financing methods, capital structure or historical cost basis; the ability of SXE’s assets to generate cash sufficient to support its indebtedness and make cash distributions to its unitholders and general partner; its operating performance and return on capital as compared to those of other companies in the midstream energy sector, without regard to financing or capital structure; and the attractiveness of capital projects and acquisitions and the overall rates of return on alternative investment opportunities. The economic rationale behind management's use of Adjusted EBITDA is to measure the ability of its assets to generate cash sufficient to pay interest costs, support SXE’s indebtedness and make distributions to its investors. The GAAP measure most directly comparable to Adjusted EBITDA is net income. SXE’s non-GAAP financial measure of Adjusted EBITDA should not be considered as an alternative to net income. You should not consider Adjusted EBITDA in isolation or as a substitute for analysis of SXE’s results as reported under GAAP. Adjusted EBITDA has limitations as an analytical tool and should not be considered as an alternative to, or more meaningful than, performance measures calculated in accordance with GAAP. Some of these limitations are: certain items excluded from Adjusted EBITDA are significant components in the understanding and assessing a company’s financial performance, such as a company’s cost of capital and tax structure; Adjusted EBITDA does not reflect SXE’s cash expenditures or future requirements for capital expenditures or contractual commitments; Adjusted EBITDA does not reflect changes in, or cash requirements for, SXE’s working capital needs; although depreciation and amortization are non-cash charges, the assets being depreciated and amortized will often have to be replaced in the future, and Adjusted EBITDA does not reflect any cash requirements for such replacements; and SXE’s computations of Adjusted EBITDA may not be comparable to other similarly titled measures of other companies. SXE defines gross operating margin as the sum of all revenues less the cost of natural gas and NGLs sold. Gross operating margin is used as a supplemental performance measure by SXE’s management to compare the net contribution of all of its contracts, particularly comparing the net contribution of fixed-spread and percent-of-proceeds contracts which record both revenue and costs compared to its fee based business which records revenue only. Gross operating margin reflects the net contribution to income of SXE’s contracts before the costs associated with operating and maintaining the system and general and administrative expenses. As an indicator of SXE’s operating performance, gross operating margin should not be considered an alternative to, or more meaningful than net income as determined in accordance with GAAP. SXE’s gross operating margin may not be comparable to a similarly titled measure of another company because other entities may not calculate gross operating margin in the same manner. |

