Attached files
| file | filename |
|---|---|
| 8-K - 8-K - STATE STREET CORP | goldmansachsconference8-k1.htm |
Exhibit 99.1 Joseph L. Hooley Chairman of the Board, President and Chief Executive Officer Edward J. Resch Executive Vice President and Chief Financial Officer Goldman Sachs Financial Services Conference December 4, 2012 The Way Ahead
LIMITED ACCESS The Way Ahead Agenda Strong Foundation Strategy for Growth Financial Performance Summary 2

LIMITED ACCESS Forward-Looking Statements 3 This presentation contains forward-looking statements as defined by United States securities laws, including statements relating to our goals and expectations regarding our business, financial and capital condition, including without limitation, our capital ratios under Basel III, results of operations, investment portfolio performance and strategies, the financial and market outlook, governmental and regulatory initiatives and developments, and the business environment. Forward-looking statements are often, but not always, identified by such forward-looking terminology as “plan,” “program,” “expect,” “look,” “believe,” “anticipate,” “estimate,” “seek,” “may,” “will,” “trend,” “target,” and “goal,” or similar statements or variations of such terms. These statements are not guarantees of future performance, are inherently uncertain, are based on current assumptions that are difficult to predict and involve a number of risks and uncertainties. Therefore, actual outcomes and results may differ materially from what is expressed in those statements, and those statements should not be relied upon as representing our expectations or beliefs as of any date subsequent to December 4, 2012. Important factors that may affect future results and outcomes include, but are not limited to: the financial strength and continuing viability of the counterparties with which we or our clients do business and to which we have investment, credit or financial exposure, including, for example, the direct and indirect effects on counterparties to the current sovereign debt risks in Europe and other regions; financial market disruptions or economic recession, whether in the U.S., Europe or other regions internationally; increases in the volatility of, or declines in the level of, our net interest revenue, changes in the composition of the assets recorded in our consolidated statement of condition and the possibility that we may be required to change the manner in which we fund those assets; the liquidity of the U.S. and international securities markets, particularly the markets for fixed-income securities and inter-bank credits, and the liquidity requirements of our clients; the level and volatility of interest rates and the performance and volatility of securities, credit, currency and other markets in the U.S. and internationally; the credit quality, credit agency ratings, and fair values of the securities in our investment securities portfolio, a deterioration or downgrade of which could lead to other-than-temporary impairment of the respective securities and the recognition of an impairment loss in our consolidated statement of income; our ability to attract deposits and other low-cost, short-term funding, and our ability to deploy deposits in a profitable manner consistent with our liquidity requirements and risk profile; the manner in which the Federal Reserve and other regulators implement the Dodd-Frank Act, Basel III, European legislation with respect to banking and financial activities and other regulatory initiatives in the U.S. and internationally, including regulatory developments that result in changes to our structure or operating model, increased costs or other changes to the provision of our services; adverse changes in required regulatory capital ratios, whether arising under the Dodd-Frank Act, Basel II or Basel III, or due to changes in regulatory positions or regulations in jurisdictions in which we engage in banking activities; increasing requirements to obtain necessary approvals of the Federal Reserve and our other regulators for the use, allocation or distribution of our capital or for other specific capital actions or programs, including acquisitions, dividends and equity repurchases, without which our growth plans, distributions to shareholders, equity purchase programs or other capital initiatives may be restricted; changes in law or regulation that may adversely affect our, our clients' or our counterparties' business activities and the products or services that we sell, including additional or increased taxes or assessments thereon, capital adequacy requirements and changes that expose us to risks related to compliance; the maintenance of credit agency ratings for our debt and depository obligations as well as the level of credibility of credit agency ratings; delays or difficulties in the execution of our previously announced Business Operations and Information Technology Transformation program, which could lead to changes in our estimates of the charges, expenses or savings associated with the planned program, resulting in increased volatility of our earnings; the results of, and costs associated with, government investigations, litigation, and similar claims, disputes, or proceedings; the possibility that our clients will incur substantial losses in investment pools for which we act as agent, and the possibility of significant reductions in the valuation of assets; adverse publicity or other reputational harm; dependencies on information technology, complexities and costs of protecting the security of our systems and difficulties with protecting our intellectual property rights; our ability to grow revenue, attract and/or retain and compensate highly skilled people, control expenses and attract the capital necessary to achieve our business goals and comply with regulatory requirements; potential changes to the competitive environment, including changes due to regulatory and technological changes, the effects of consolidation, and perceptions of State Street as a suitable service provider or counterparty; potential changes in how clients compensate us for our services, and the mix of services that clients choose from us; the risks that acquired businesses and joint ventures will not achieve their anticipated financial and operational benefits or will not be integrated successfully, or that the integration will take longer than anticipated, that expected synergies will not be achieved or unexpected disynergies will be experienced, that client and deposit retention goals will not be met, that other regulatory or operational challenges will be experienced and that disruptions from the transaction will harm relationships with clients, employees or regulators; the ability to complete acquisitions, divestitures and joint ventures, including the ability to obtain regulatory approvals, the ability to arrange financing as required and the ability to satisfy closing conditions; our ability to recognize emerging needs of clients and to develop products that are responsive to such trends and profitable to the company; the performance of and demand for the products and services we offer, including the level and timing of redemptions and withdrawals from our collateral pools and other collective investment products; and the potential for new products and services to impose additional costs on us and expose us to increased operational risk; our ability to measure the fair value of the investment securities recorded in our consolidated statement of condition; our ability to control operating risks, data security breach risks, information technology systems risks and outsourcing risks, and our ability to protect our intellectual property rights, the possibility of errors in the quantitative models we use to manage our business and the possibility that our controls will prove insufficient, fail or be circumvented; changes in accounting standards and practices; and changes in tax legislation and in the interpretation of existing tax laws by U.S. and non-U.S. tax authorities that affect the amount of taxes due. Other important factors that could cause actual results to differ materially from those indicated by any forward-looking statements are set forth in our 2011 Annual Report on Form 10-K and our subsequent SEC filings. We encourage investors to read these filings, particularly the sections on risk factors, for additional information with respect to any forward-looking statements and prior to making any investment decision. The forward-looking statements contained in this presentation speak only as of the date hereof, December 4, 2012, and we do not undertake efforts to revise those forward-looking statements to reflect events after that date.
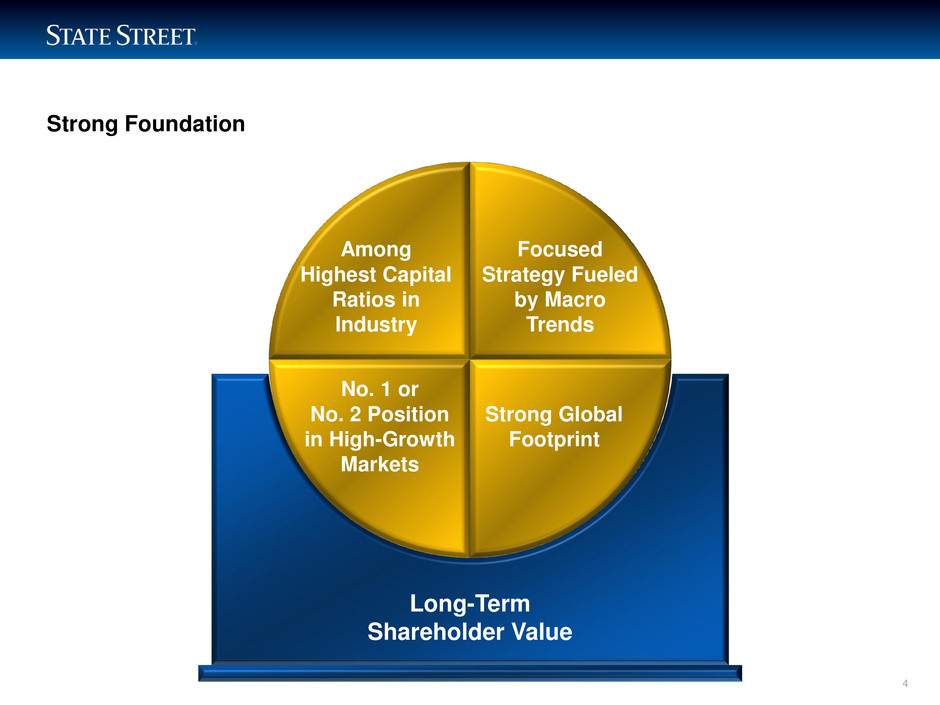
LIMITED ACCESS Strong Foundation 4 Strong Global Footprint Long-Term Shareholder Value Among Highest Capital Ratios in Industry Focused Strategy Fueled by Macro Trends Strong Global Footprint No. 1 or No. 2 Position in High-Growth Markets

5 Strategy for Growth
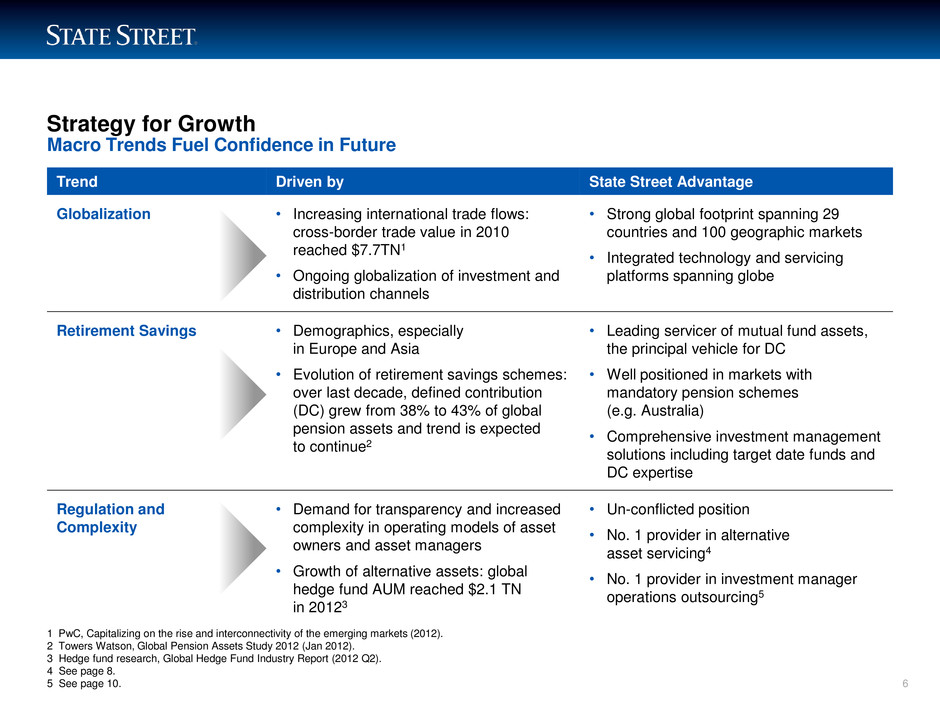
LIMITED ACCESS Strategy for Growth Macro Trends Fuel Confidence in Future 6 Trend Driven by State Street Advantage Globalization • Increasing international trade flows: cross-border trade value in 2010 reached $7.7TN1 • Ongoing globalization of investment and distribution channels • Strong global footprint spanning 29 countries and 100 geographic markets • Integrated technology and servicing platforms spanning globe Retirement Savings • Demographics, especially in Europe and Asia • Evolution of retirement savings schemes: over last decade, defined contribution (DC) grew from 38% to 43% of global pension assets and trend is expected to continue2 • Leading servicer of mutual fund assets, the principal vehicle for DC • Well positioned in markets with mandatory pension schemes (e.g. Australia) • Comprehensive investment management solutions including target date funds and DC expertise Regulation and Complexity • Demand for transparency and increased complexity in operating models of asset owners and asset managers • Growth of alternative assets: global hedge fund AUM reached $2.1 TN in 20123 • Un-conflicted position • No. 1 provider in alternative asset servicing4 • No. 1 provider in investment manager operations outsourcing5 1 PwC, Capitalizing on the rise and interconnectivity of the emerging markets (2012). 2 Towers Watson, Global Pension Assets Study 2012 (Jan 2012). 3 Hedge fund research, Global Hedge Fund Industry Report (2012 Q2). 4 See page 8. 5 See page 10.
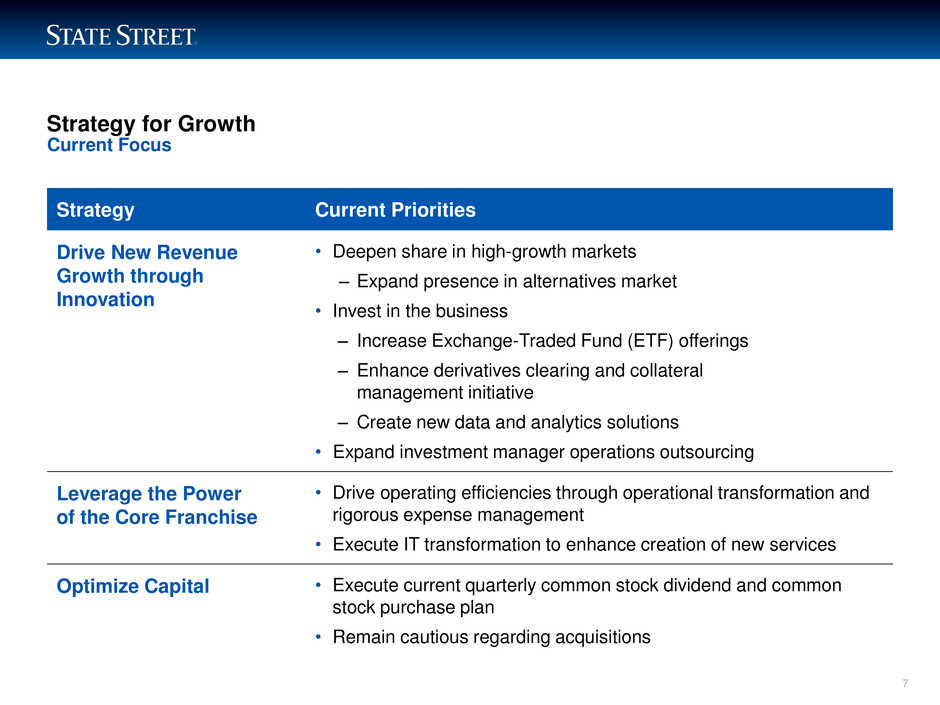
LIMITED ACCESS Strategy for Growth Strategy Current Priorities Drive New Revenue Growth through Innovation • Deepen share in high-growth markets ‒ Expand presence in alternatives market • Invest in the business ‒ Increase Exchange-Traded Fund (ETF) offerings ‒ Enhance derivatives clearing and collateral management initiative ‒ Create new data and analytics solutions • Expand investment manager operations outsourcing Leverage the Power of the Core Franchise • Drive operating efficiencies through operational transformation and rigorous expense management • Execute IT transformation to enhance creation of new services Optimize Capital • Execute current quarterly common stock dividend and common stock purchase plan • Remain cautious regarding acquisitions 7 Current Focus
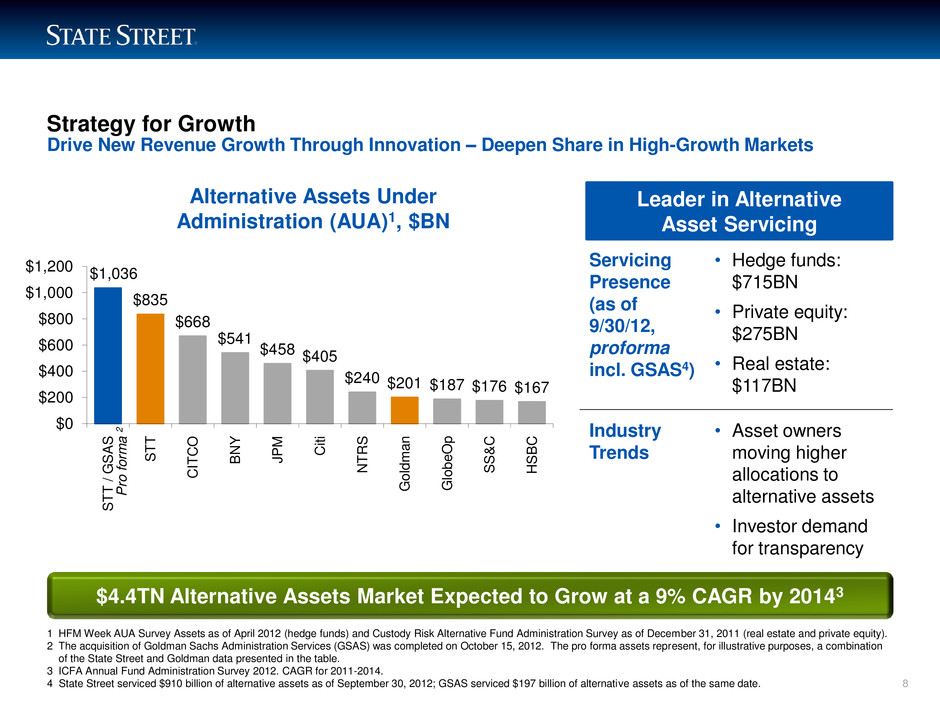
LIMITED ACCESS Strategy for Growth Drive New Revenue Growth Through Innovation ‒ Deepen Share in High-Growth Markets 8 Leader in Alternative Asset Servicing Alternative Assets Under Administration (AUA)1, $BN 1 HFM Week AUA Survey Assets as of April 2012 (hedge funds) and Custody Risk Alternative Fund Administration Survey as of December 31, 2011 (real estate and private equity). 2 The acquisition of Goldman Sachs Administration Services (GSAS) was completed on October 15, 2012. The pro forma assets represent, for illustrative purposes, a combination of the State Street and Goldman data presented in the table. 3 ICFA Annual Fund Administration Survey 2012. CAGR for 2011-2014. 4 State Street serviced $910 billion of alternative assets as of September 30, 2012; GSAS serviced $197 billion of alternative assets as of the same date. $4.4TN Alternative Assets Market Expected to Grow at a 9% CAGR by 20143 Servicing Presence (as of 9/30/12, proforma incl. GSAS4) • Hedge funds: $715BN • Private equity: $275BN • Real estate: $117BN Industry Trends • Asset owners moving higher allocations to alternative assets • Investor demand for transparency $1,036 $835 $668 $541 $458 $405 $240 $201 $187 $176 $167 $0 $200 $400 $600 $800 $1,000 $1,200 S T T / G S A S S T T C IT C O B N Y J P M C it i N T R S G o ldm a n G lo be O p S S & C H S B C P ro f or m a 2
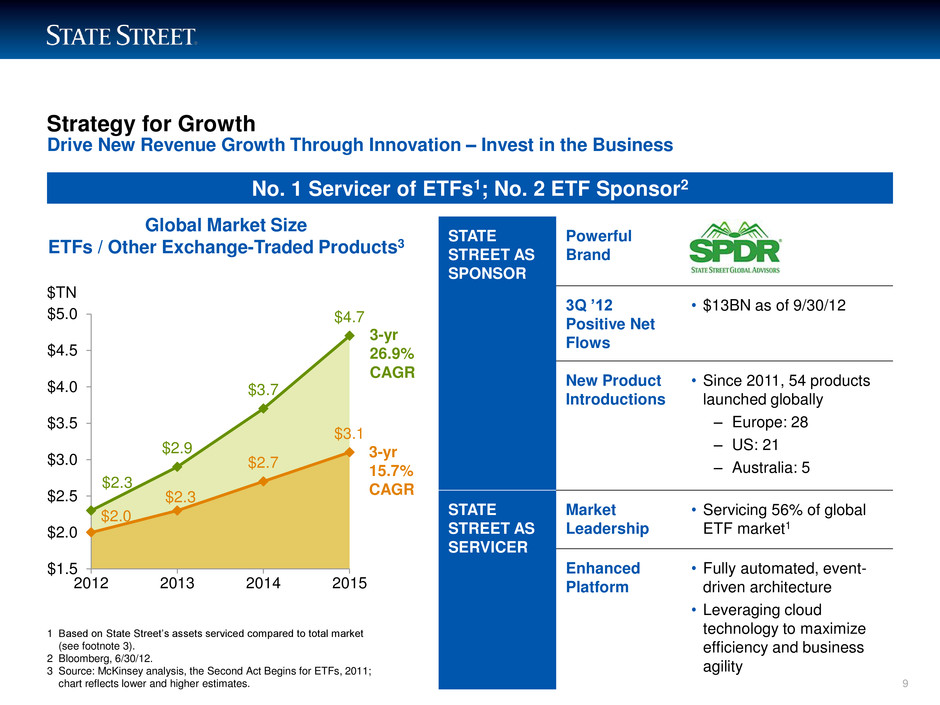
LIMITED ACCESS $2.0 $2.3 $2.7 $3.1 $2.3 $2.9 $3.7 $4.7 $1.5 $2.0 $2.5 $3.0 $3.5 $4.0 $4.5 $5.0 2012 2013 2014 2015 1 Based on State Street’s assets serviced compared to total market (see footnote 3). 2 Bloomberg, 6/30/12. 3 Source: McKinsey analysis, the Second Act Begins for ETFs, 2011; chart reflects lower and higher estimates. Strategy for Growth Drive New Revenue Growth Through Innovation – Invest in the Business STATE STREET AS SPONSOR Powerful Brand 3Q ’12 Positive Net Flows • $13BN as of 9/30/12 New Product Introductions • Since 2011, 54 products launched globally ‒ Europe: 28 ‒ US: 21 ‒ Australia: 5 STATE STREET AS SERVICER Market Leadership • Servicing 56% of global ETF market1 Enhanced Platform • Fully automated, event- driven architecture • Leveraging cloud technology to maximize efficiency and business agility $TN Global Market Size ETFs / Other Exchange-Traded Products3 No. 1 Servicer of ETFs1; No. 2 ETF Sponsor2 3-yr 26.9% CAGR 3-yr 15.7% CAGR 9

LIMITED ACCESS Strategy for Growth Drive New Revenue Growth Through Innovation ‒ Expand Investment Manager Operations Outsourcing 10 Global Middle Office Outsourced Assets, $TN 6/30/121 $TN 1 Scrip Issue Global Report (9/2012). 2 PwC, 15th Global CEO Survey, Asset Management Industry Insights, 2012. State Street Highlights • Capitalizing on growing demand for middle-office outsourcing ‒ 40% of global asset managers plan to outsource a key business function in 20132 • Multi-asset class capability fueled by integrated global servicing platform • Clients include AXA Investment Managers, Alliance Bernstein, PIMCO, Lloyds Banking Group, Lazard, Investec Asset Management and SSgA • Continue to enhance platform with new capabilities: collateral tracking, data and analytics and derivative servicing $8.8 $1.6 $1.4 $1.3 $0.7 $0.7 $0.3 $0 $2 $4 $6 $8 $10 STT BNY BBH NTRS JPM CITI BNP
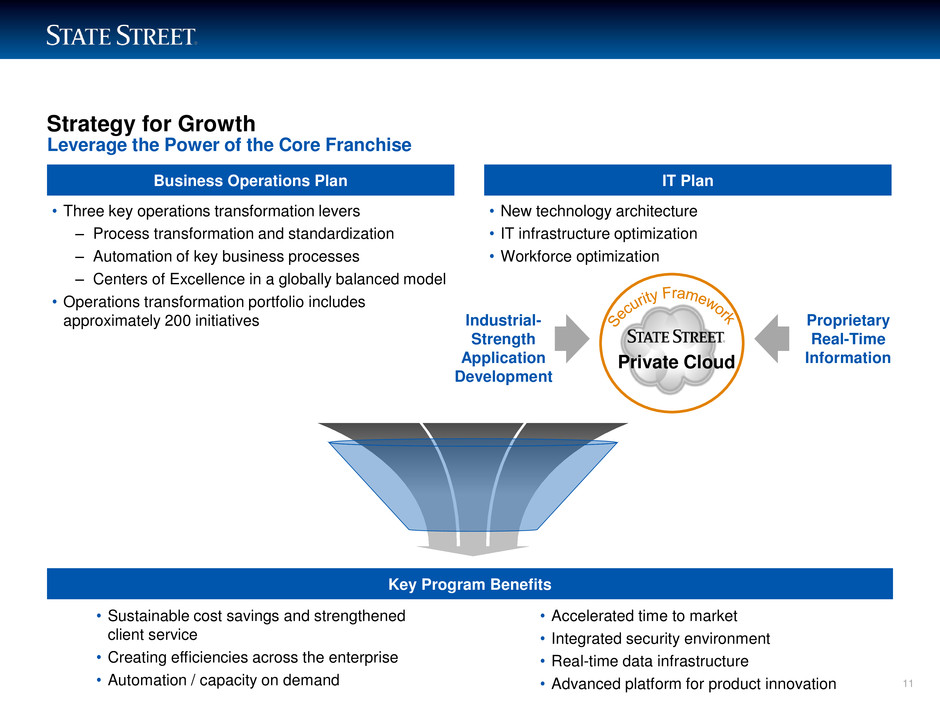
LIMITED ACCESS Strategy for Growth Leverage the Power of the Core Franchise 11 Private Cloud • Three key operations transformation levers – Process transformation and standardization – Automation of key business processes – Centers of Excellence in a globally balanced model • Operations transformation portfolio includes approximately 200 initiatives Business Operations Plan • New technology architecture • IT infrastructure optimization • Workforce optimization IT Plan Industrial- Strength Application Development • Sustainable cost savings and strengthened client service • Creating efficiencies across the enterprise • Automation / capacity on demand Key Program Benefits Proprietary Real-Time Information • Accelerated time to market • Integrated security environment • Real-time data infrastructure • Advanced platform for product innovation

LIMITED ACCESS Strategy for Growth Leverage the Power of the Core Franchise 1 Compared to 2010 run-rate expenses from operations, all else being equal. The full effect of the annual pre-tax, run-rate savings is not expected to be achieved until 2015. Chart data based on the approximate mid-point of the range of the estimated annual pre-tax, run-rate expense savings of $575MN - $625MN at the end of 2014, for full effect in 2015; estimated savings for individual years may vary up or down based on the continued implementation of the Business Operations and Information Technology Transformation program. Expected annual pre-tax, run-rate expense savings relate only to the Business Operations and Information Technology Transformation program; actual operating expenses of the Company may increase or decrease due to other factors. $86 $180 $400 $540 $600 $0 $100 $200 $300 $400 $500 $600 $700 2011 2012 2013 2014 2015 Annual Estimated Pre-Tax, Run-Rate Expense Savings1 $MN 12 2012 MILESTONES • Established two additional global Centers of Excellence • Achieved 20% targeted automation benefits • Realized 25% of the expected benefits from the IT component of the transformation program • IT service provider transition for infrastructure and application maintenance on track for year end • 40 applications in production within the cloud environment

13 Financial Performance
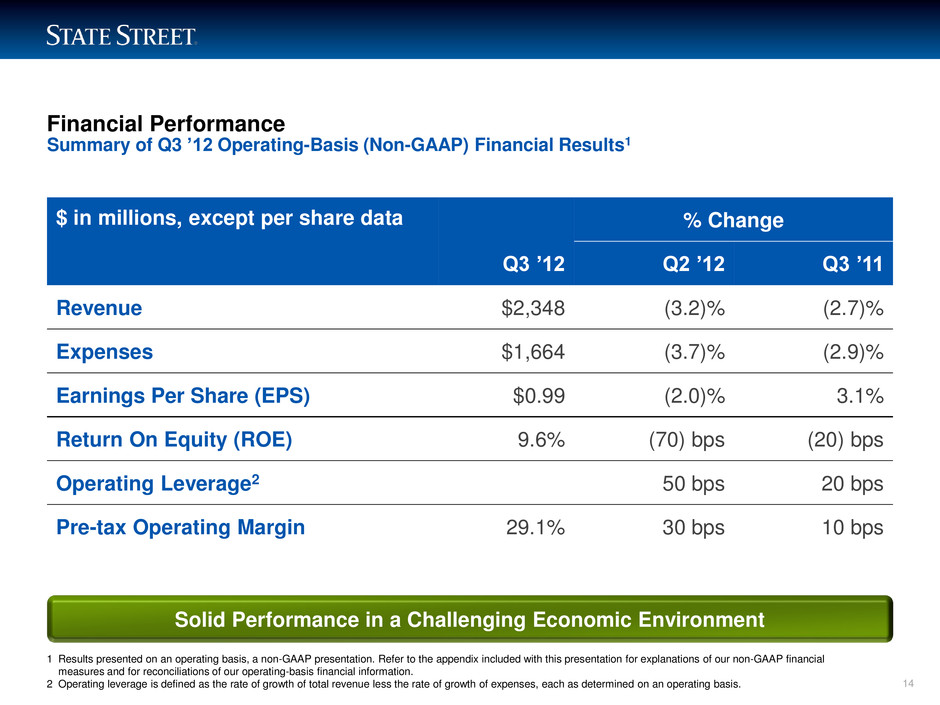
LIMITED ACCESS Financial Performance Summary of Q3 ’12 Operating-Basis (Non-GAAP) Financial Results1 14 1 Results presented on an operating basis, a non-GAAP presentation. Refer to the appendix included with this presentation for explanations of our non-GAAP financial measures and for reconciliations of our operating-basis financial information. 2 Operating leverage is defined as the rate of growth of total revenue less the rate of growth of expenses, each as determined on an operating basis. Solid Performance in a Challenging Economic Environment $ in millions, except per share data % Change Q3 ’12 Q2 ’12 Q3 ’11 Revenue $2,348 (3.2)% (2.7)% Expenses $1,664 (3.7)% (2.9)% Earnings Per Share (EPS) $0.99 (2.0)% 3.1% Return On Equity (ROE) 9.6% (70) bps (20) bps Operating Leverage2 50 bps 20 bps Pre-tax Operating Margin 29.1% 30 bps 10 bps

LIMITED ACCESS Financial Performance Q3 ’12 Operating-Basis (Non-GAAP) Revenue1 15 $ in millions Core Fee Revenue Q3 ’12 Q2 ’12 % Change Asset Servicing Fees $1,100 $1,086 1.3% Asset Management Fees $251 $246 2.0% Total $1,351 $1,332 1.4% Market-Driven Revenue Q3 ’12 Q2 ’12 % Change Net Interest Revenue $611 $629 (2.9)% Trading Services $232 $255 (9.0)% Securities Finance $91 $143 (36.4)% Total $934 $1,027 (9.1)% 1 Results presented on an operating basis, a non-GAAP presentation. Refer to the appendix included with this presentation for explanations of our non-GAAP financial measures and for reconciliations of our operating-basis financial information. Momentum in Core Fee Revenue Offset by Pressure on Market-Driven Revenue
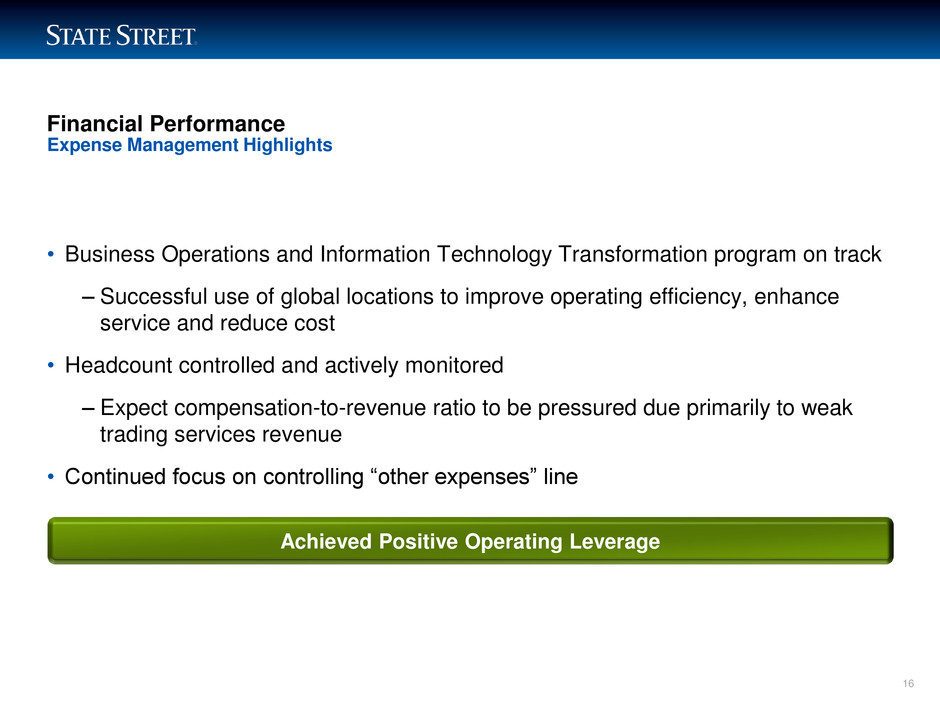
LIMITED ACCESS Financial Performance • Business Operations and Information Technology Transformation program on track – Successful use of global locations to improve operating efficiency, enhance service and reduce cost • Headcount controlled and actively monitored – Expect compensation-to-revenue ratio to be pressured due primarily to weak trading services revenue • Continued focus on controlling “other expenses” line Expense Management Highlights Achieved Positive Operating Leverage 16

LIMITED ACCESS Financial Performance Operating-Basis (Non-GAAP) Pre-Tax Operating Margin Relative to Peers Pre-Tax Operating Margin 3 Months Ended 09/30/121 17 Pre-Tax Operating Margin 9 Months Ended 9/30/121 Strongest Operating Margin Among Peers 29.1% 26.7% 28.2% 20% 25% 30% STT BK NTRS 27.7% 26.6% 27.1% 20% 25% 30% STT BK NTRS 1 Except as described in the appendix: (i) data for each of State Street Corporation (STT), The Bank of New York Mellon Corporation (BK) and Northern Trust Corporation (NTRS) is derived from the relevant company’s public filings, earnings announcements or related materials (individually or collectively, “publicly disclosed information”); (ii) data from the relevant company’s publicly disclosed information is presented on a non-GAAP basis, which presentation is described, at the discretion of the relevant company, in that company’s publicly disclosed information as “operating-basis,” “operating,” “adjusted” or “non-GAAP” (individually or collectively, “non-GAAP presentation”); and (iii) each company’s non- GAAP presentation is calculated differently and therefore may not be comparable to other companies’ non-GAAP presentations. Please review each company’s publicly disclosed information for a description, to the extent contained therein, of that company’s non-GAAP presentation. Additional information regarding the data in the chart, including changes made from the presentation in any company’s publicly disclosed information, can be found in the Appendix.
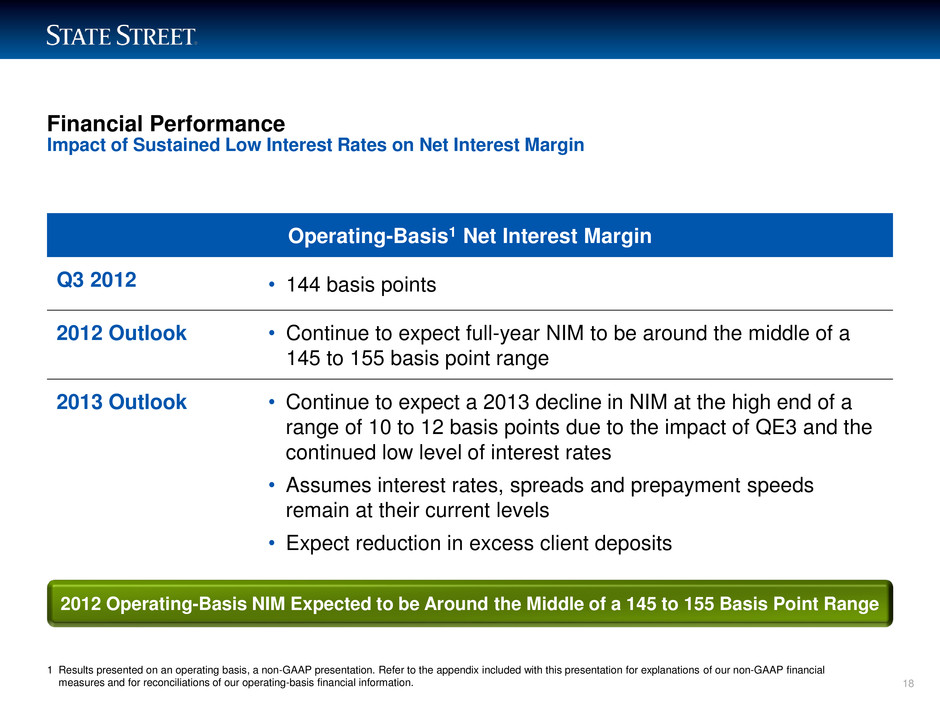
LIMITED ACCESS Financial Performance Impact of Sustained Low Interest Rates on Net Interest Margin Operating-Basis1 Net Interest Margin Q3 2012 • 144 basis points 2012 Outlook • Continue to expect full-year NIM to be around the middle of a 145 to 155 basis point range 2013 Outlook • Continue to expect a 2013 decline in NIM at the high end of a range of 10 to 12 basis points due to the impact of QE3 and the continued low level of interest rates • Assumes interest rates, spreads and prepayment speeds remain at their current levels • Expect reduction in excess client deposits 2012 Operating-Basis NIM Expected to be Around the Middle of a 145 to 155 Basis Point Range 1 Results presented on an operating basis, a non-GAAP presentation. Refer to the appendix included with this presentation for explanations of our non-GAAP financial measures and for reconciliations of our operating-basis financial information. 18
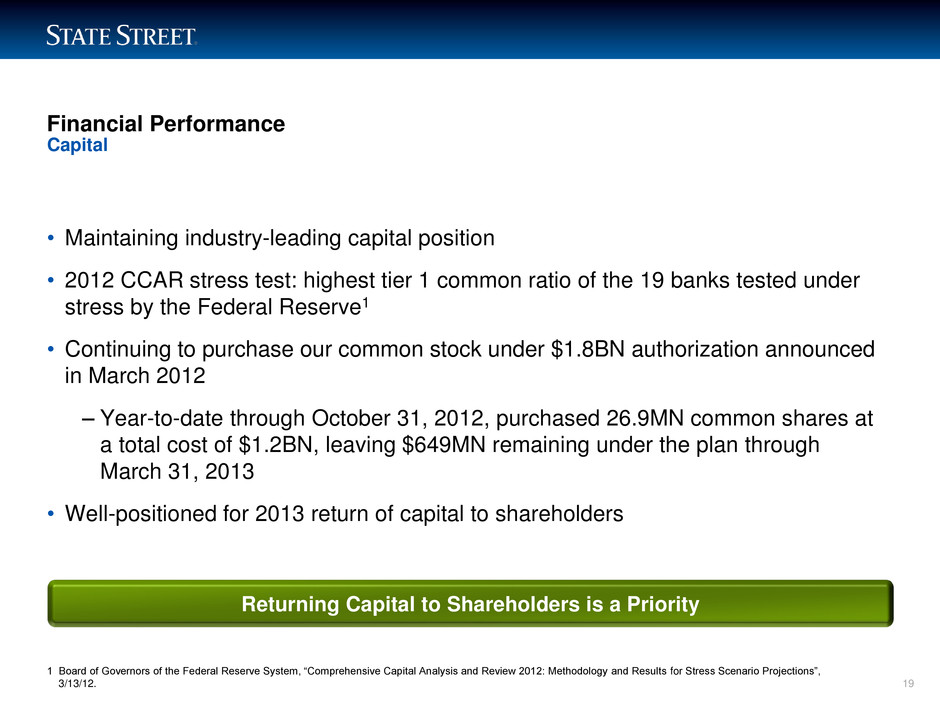
LIMITED ACCESS Financial Performance • Maintaining industry-leading capital position • 2012 CCAR stress test: highest tier 1 common ratio of the 19 banks tested under stress by the Federal Reserve1 • Continuing to purchase our common stock under $1.8BN authorization announced in March 2012 – Year-to-date through October 31, 2012, purchased 26.9MN common shares at a total cost of $1.2BN, leaving $649MN remaining under the plan through March 31, 2013 • Well-positioned for 2013 return of capital to shareholders Capital Returning Capital to Shareholders is a Priority 1 Board of Governors of the Federal Reserve System, “Comprehensive Capital Analysis and Review 2012: Methodology and Results for Stress Scenario Projections”, 3/13/12. 19

20 Summary
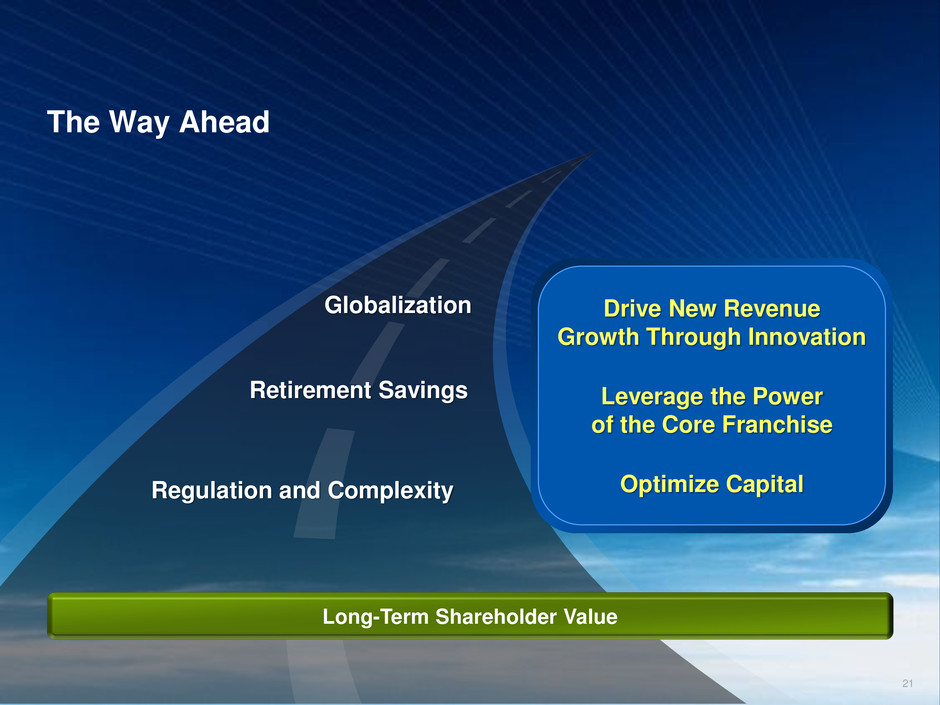
The Way Ahead Globalization Retirement Savings Regulation and Complexity Long-Term Shareholder Value Drive New Revenue Growth Through Innovation Leverage the Power of the Core Franchise Optimize Capital 21

LIMITED ACCESS 22

LIMITED ACCESS 23
LIMITED ACCESS 24 Appendix – Non-GAAP Measures 24 The foregoing presentation includes financial information presented on a GAAP basis as well as on a non-GAAP, or “operating” basis. Management measures and compares certain financial information on an operating basis, as it believes that this presentation supports meaningful comparisons from period to period and the analysis of comparable financial trends with respect to State Street’s normal ongoing business operations. Management believes that operating-basis financial information, which reports revenue from non-taxable sources on a fully taxable-equivalent basis and excludes the impact of revenue and expenses outside of the normal course of business, facilitates an investor’s understanding and analysis of State Street’s underlying financial performance and trends in addition to financial information prepared and reported in accordance with GAAP. Non-GAAP financial measures should be considered in addition to, not as a substitute for or superior to, financial measures determined in accordance with GAAP.
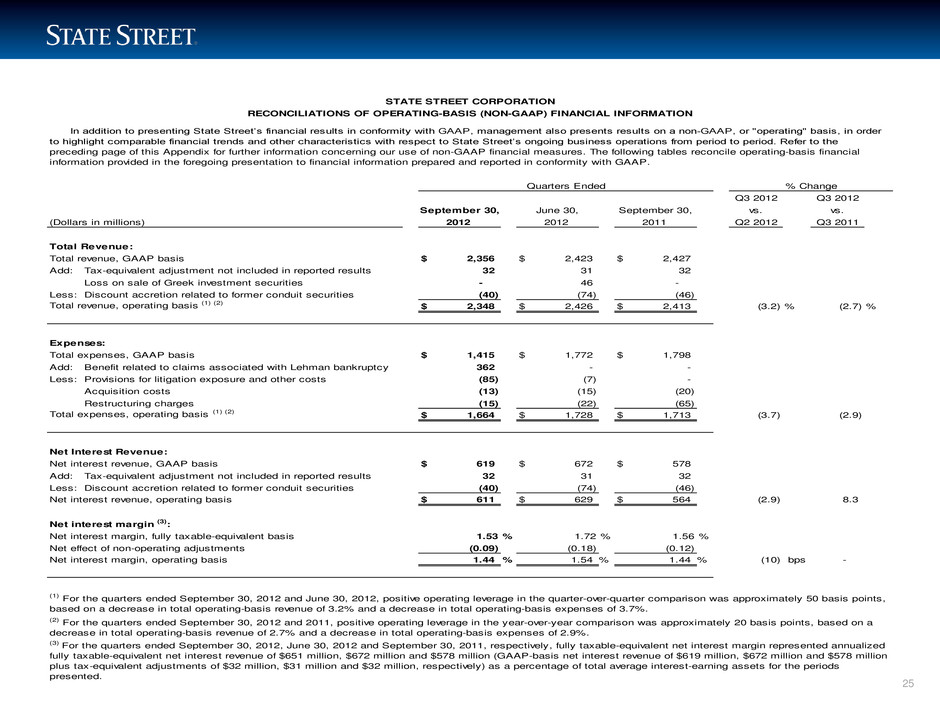
LIMITED ACCESS 25 Q3 2012 Q3 2012 vs. vs. (Dollars in millions) Q2 2012 Q3 2011 Total Revenue: Total revenue, GAAP basis $ 2,356 $ 2,423 $ 2,427 Add: Tax-equivalent adjustment not included in reported results 32 31 32 Loss on sale of Greek investment securities - 46 - Less: Discount accretion related to former conduit securities (40) (74) (46) Total revenue, operating basis (1) (2) $ 2,348 $ 2,426 $ 2,413 (3.2) % (2.7) % Expenses: Total expenses, GAAP basis $ 1,415 $ 1,772 $ 1,798 Add: Benefit related to claims associated with Lehman bankruptcy 362 - - Less: Provisions for litigation exposure and other costs (85) (7) - Acquisition costs (13) (15) (20) Restructuring charges (15) (22) (65) Total expenses, operating basis (1) (2) $ 1,664 $ 1,728 $ 1,713 (3.7) (2.9) Net Interest Revenue: Net interest revenue, GAAP basis $ 619 $ 672 $ 578 Add: Tax-equivalent adjustment not included in reported results 32 31 32 Less: Discount accretion related to former conduit securities (40) (74) (46) Net interest revenue, operating basis $ 611 $ 629 $ 564 (2.9) 8.3 Net interest margin (3): Net interest margin, fully taxable-equivalent basis 1.53 % 1.72 % 1.56 % Net effect of non-operating adjustments (0.09) (0.18) (0.12) Net interest margin, operating basis 1.44 % 1.54 % 1.44 % (10) bps - (3) For the quarters ended September 30, 2012, June 30, 2012 and September 30, 2011, respectively, fully taxable-equivalent net interest margin represented annualized fully taxable-equivalent net interest revenue of $651 million, $672 million and $578 million (GAAP-basis net interest revenue of $619 million, $672 million and $578 million plus tax-equivalent adjustments of $32 million, $31 million and $32 million, respectively) as a percentage of total average interest-earning assets for the periods presented. (2) For the quarters ended September 30, 2012 and 2011, positive operating leverage in the year-over-year comparison was approximately 20 basis points, based on a decrease in total operating-basis revenue of 2.7% and a decrease in total operating-basis expenses of 2.9%. June 30, September 30, 2012 2011 September 30, 2012 (1) For the quarters ended September 30, 2012 and June 30, 2012, positive operating leverage in the quarter-over-quarter comparison was approximately 50 basis points, based on a decrease in total operating-basis revenue of 3.2% and a decrease in total operating-basis expenses of 3.7%. STATE STREET CORPORATION RECONCILIATIONS OF OPERATING-BASIS (NON-GAAP) FINANCIAL INFORMATION In addition to presenting State Street’s financial results in conformity with GAAP, management also presents results on a non-GAAP, or "operating" basis, in order to highlight comparable financial trends and other characteristics with respect to State Street’s ongoing business operations from period to period. Refer to the preceding page of this Appendix for further information concerning our use of non-GAAP financial measures. The following tables reconcile operating-basis financial information provided in the foregoing presentation to financial information prepared and reported in conformity with GAAP. % ChangeQuarters Ended

LIMITED ACCESS 26 Q3 2012 Q3 2012 vs. vs. (Dollars in millions, except per share amounts) Q2 2012 Q3 2011 Pre-Tax Operating Margin(4): Income before income tax expense, GAAP basis $ 941 $ 651 $ 629 Net adjustments to revenue (8) 3 (14) Net adjustments to expenses (249) 44 85 Income before income tax expense, operating basis $ 684 $ 698 $ 700 Pre-tax operating margin, operating basis 29.1 % 28.8 % 29.0 % 30 bps 10 bps Diluted Earnings Per Common Share: Diluted earnings per common share, GAAP basis $ 1.36 $ .98 $ 1.10 Add: Loss on sale of Greek investment securities - .06 - Provisions for litigation exposure and other costs .11 .01 - Acquisition costs .02 .02 .02 Restructuring charges .02 .03 .08 Less: Benefit related to claims associated with Lehman bankruptcy (.46) - - Effect on income tax rate of non-operating adjustments (.01) - - Discount accretion related to former conduit securities (.05) (.09) (.06) Discrete tax benefit related to former conduit securities - - (.18) Diluted earnings per common share, operating basis $ .99 $ 1.01 $ .96 (2.0) % 3.1 % Return on Average Common Equity: Return on average common equity, GAAP basis 13.3 % 10.0 % 11.2 % Add: Loss on sale of Greek investment securities - 0.6 - Provisions for litigation exposure and other costs 1.0 0.1 - Acquisition costs 0.2 0.2 0.2 Restructuring charges 0.2 0.3 0.8 Less: Benefit related to claims associated with Lehman bankruptcy (4.4) - - Effect on income tax rate of non-operating adjustments (0.2) - - Discount accretion related to former conduit securities (0.5) (0.9) (0.6) Discrete tax benefit related to former conduit securities - - (1.8) Return on average common equity, operating basis 9.6 % 10.3 % 9.8 % (70) bps (20) bps STATE STREET CORPORATION RECONCILIATIONS OF OPERATING-BASIS (NON-GAAP) FINANCIAL INFORMATION (CONTINUED) Quarters Ended % Change (4) Represents income before income tax expense as a percentage of total revenue. September 30, June 30, September 30, 2012 2012 2011

LIMITED ACCESS 27 (Dollars in millions) Total Revenue: Total revenue, GAAP basis $ 7,200 Add: Tax-equivalent adjustment not included in reported results 93 Loss on sale of Greek investment securities 46 Less: Discount accretion related to former conduit securities (162) Total revenue, operating basis $ 7,177 Expenses: Total expenses, GAAP basis $ 5,022 Add: Benefit related to claims associated with Lehman bankruptcy 362 Less: Provisions for litigation exposure and other costs (107) Acquisition costs (41) Restructuring charges (45) Total expenses, operating basis $ 5,191 Pre-Tax Operating Margin(5): Income before income tax expense, GAAP basis $ 2,178 Net adjustments to revenue (23) Net adjustments to expenses (169) Income before income tax expense, operating basis $ 1,986 Pre-tax operating margin, operating basis 27.7 % (5) Represents income before income tax expense as a percentage of total revenue. September 30, 2012 STATE STREET CORPORATION RECONCILIATIONS OF OPERATING-BASIS (NON-GAAP) FINANCIAL INFORMATION (CONTINUED) Nine Months Ended
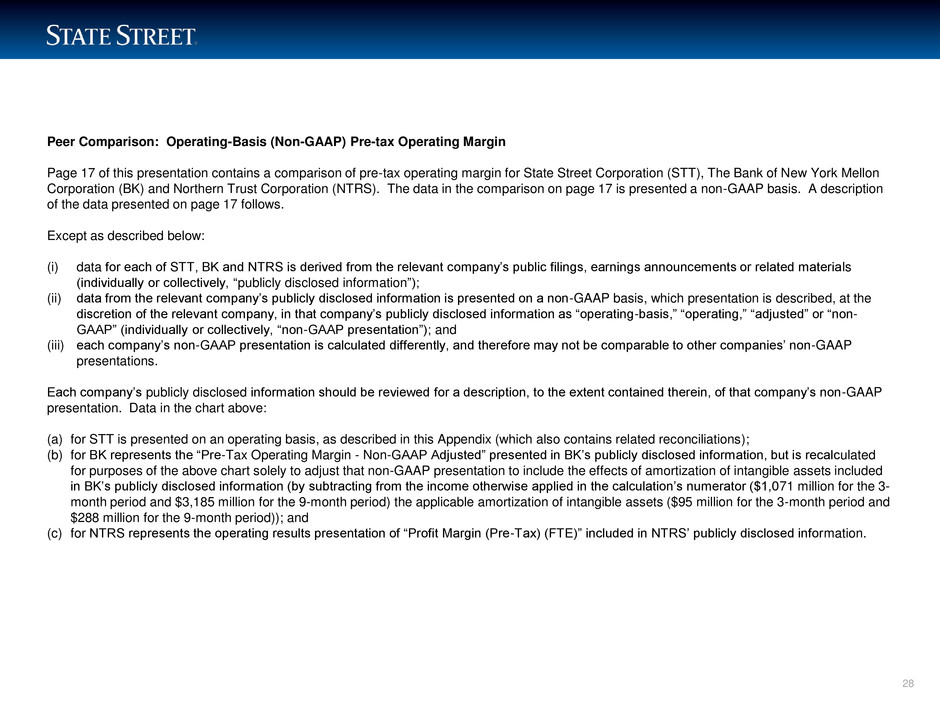
LIMITED ACCESS 28 Peer Comparison: Operating-Basis (Non-GAAP) Pre-tax Operating Margin Page 17 of this presentation contains a comparison of pre-tax operating margin for State Street Corporation (STT), The Bank of New York Mellon Corporation (BK) and Northern Trust Corporation (NTRS). The data in the comparison on page 17 is presented a non-GAAP basis. A description of the data presented on page 17 follows. Except as described below: (i) data for each of STT, BK and NTRS is derived from the relevant company’s public filings, earnings announcements or related materials (individually or collectively, “publicly disclosed information”); (ii) data from the relevant company’s publicly disclosed information is presented on a non-GAAP basis, which presentation is described, at the discretion of the relevant company, in that company’s publicly disclosed information as “operating-basis,” “operating,” “adjusted” or “non- GAAP” (individually or collectively, “non-GAAP presentation”); and (iii) each company’s non-GAAP presentation is calculated differently, and therefore may not be comparable to other companies’ non-GAAP presentations. Each company’s publicly disclosed information should be reviewed for a description, to the extent contained therein, of that company’s non-GAAP presentation. Data in the chart above: (a) for STT is presented on an operating basis, as described in this Appendix (which also contains related reconciliations); (b) for BK represents the “Pre-Tax Operating Margin - Non-GAAP Adjusted” presented in BK’s publicly disclosed information, but is recalculated for purposes of the above chart solely to adjust that non-GAAP presentation to include the effects of amortization of intangible assets included in BK’s publicly disclosed information (by subtracting from the income otherwise applied in the calculation’s numerator ($1,071 million for the 3- month period and $3,185 million for the 9-month period) the applicable amortization of intangible assets ($95 million for the 3-month period and $288 million for the 9-month period)); and (c) for NTRS represents the operating results presentation of “Profit Margin (Pre-Tax) (FTE)” included in NTRS’ publicly disclosed information.
