Attached files
| file | filename |
|---|---|
| 8-K - FORM 8-K - PNC FINANCIAL SERVICES GROUP, INC. | d448187d8k.htm |
 The PNC
Financial Services Group, Inc. Goldman Sachs Financial Services Conference
December 4, 2012
Exhibit 99.1 |
 2
DRAFT
Cautionary Statement Regarding Forward-Looking
Information and Adjusted Information
This presentation includes “snapshot” information about PNC used by way of
illustration. It is not intended as a full business or financial review and should
be viewed in the context of all of the information made available by PNC in its SEC
filings. The presentation also contains forward-looking statements regarding
our outlook for earnings, revenues, expenses, capital levels and ratios, liquidity levels, asset levels, asset quality, financial position, and other
matters regarding or affecting PNC and its future business and operations.
Forward-looking statements are necessarily subject to numerous assumptions, risks
and uncertainties, which change over time. The forward-looking statements in this presentation are qualified by the factors affecting forward-looking
statements identified in the more detailed Cautionary Statement included in the Appendix,
which is included in the version of the presentation materials posted on our corporate
website at www.pnc.com/investorevents, and in our SEC filings. We provide greater detail regarding these as well as other factors in
our 2011 Form 10-K, as amended by Amendment No. 1 thereto, and 2012 Form 10-Qs,
including in the Risk Factors and Risk Management sections and in the Legal Proceedings
and Commitments and Guarantees Notes of the Notes to Consolidated Financial Statements in those reports, and in our subsequent
SEC filings. Our forward-looking statements may also be subject to other risks and
uncertainties, including those we may discuss in this presentation or in SEC filings,
accessible on the SEC’s website at www.sec.gov and on PNC’s corporate website at www.pnc.com/secfilings. We have included web addresses in
this presentation as inactive textual references only. Information on these websites is
not part of this presentation. Future events or circumstances may change our outlook
and may also affect the nature of the assumptions, risks and uncertainties to which our forward-looking statements are subject.
Forward-looking statements in this presentation speak only as of the date of this
presentation. We do not assume any duty and do not undertake to update those
statements. Actual results or future events could differ, possibly materially, from those anticipated in forward-looking statements, as well as from
historical performance.
In this presentation, we may sometimes refer to adjusted results to help illustrate the impact
of certain types of items, such as provisions for residential mortgage repurchase
obligations, non-cash charges related to redemptions of trust preferred securities, expenses for residential mortgage foreclosure-related
matters, integration costs, and legal, mortgage foreclosure-related and OREO costs.
This information supplements our results as reported in accordance with GAAP and should
not be viewed in isolation from, or as a substitute for, our GAAP results. We believe that this additional information and the reconciliations
we provide may be useful to investors, analysts, regulators and others as they evaluate the
impact of these respective items on our results for the periods presented due to the
extent to which the items may not be indicative of our ongoing operations. We may also provide information on the components of net
interest income (purchase accounting accretion and the core remainder) and the impact of
purchase accounting accretion on net interest margin, and information on return on
average tangible common equity. We believe that core net interest margin (net interest margin less (annualized purchase
accounting accretion divided by average interest-earning assets)), a non-GAAP measure,
is useful as a tool to help evaluate the impact of purchase accounting accretion on net
interest margin. And we believe that return on average tangible common equity (calculated as annualized net income
attributable to common shareholders divided by (average common shareholders’ equity less
total intangible assets, other than servicing rights)), a non-GAAP measure, is
useful as a tool to help measure and assess a company’s use of common equity. And we believe that tangible book value per share, a non-GAAP
measure, is useful as a tool to help to better evaluate growth of the company’s business
apart from the amount, on a per share basis, of intangible assets other than servicing
rights included in book value. Where applicable, we provide GAAP reconciliations for such additional information, including in the slides,
the Appendix and/or other slides and materials on our corporate website at
www.pnc.com/investorevents and in our SEC filings. In certain discussions, we may also
provide information on yields and margins for all interest-earning assets calculated using net interest income on a taxable-equivalent basis by
increasing the interest income earned on tax-exempt assets to make it fully equivalent to
interest income earned on taxable investments. We believe this adjustment may be
useful when comparing yields and margins for all earning assets. We may also use annualized, proforma, estimated or third party
numbers for illustrative or comparative purposes only. These may not reflect actual
results. This presentation may also include discussion of other non-GAAP financial measures, which,
to the extent not so qualified therein or in the Appendix, is qualified by GAAP
reconciliation information available on our corporate website at www.pnc.com under “About PNC–Investor Relations.”
|
 DRAFT
Achieving in the Current Environment
Tepid revenue
growth
PNC’s opportunities and challenges
Low interest
rates
Manage risks and
capital
Slow U.S.
economic growth
Control expenses
while investing for
growth
Regulatory
implementation
Grow profitable
customers and
quality revenues
3
The “new normal” |
 4
DRAFT
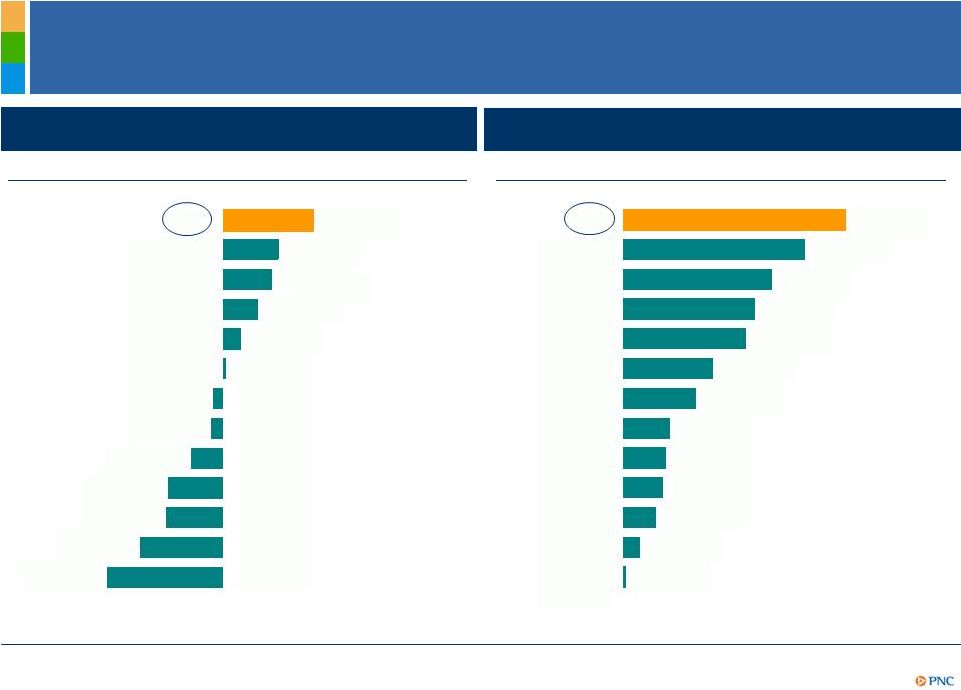
Value Creation Throughout the Changing Environment
Peer Source: SNL Database. (1) Tangible book value per share calculated as book value per
share less goodwill and certain other intangible assets. Further information is
provided in the Appendix. %
change
in
TBV/Share
1
12/31/2007
to
12/31/2009
%
change
in
TBV/Share
1
12/31/2009
to
9/30/2012
COF
CMA
BAC
FITB
STI
RF
KEY
Financial crisis
“New normal”
40%
25%
22%
15%
8%
1%
-5%
-6%
-14%
-24%
-25%
-37%
-52%
PNC
WFC
JPM
USB
BBT
MTB
94%
77%
63%
56%
52%
38%
31%
20%
18%
17%
14%
7%
1%
PNC
USB
WFC
COF
MTB
JPM
FITB
KEY
BBT
BAC
STI
CMA
RF |
 5
DRAFT
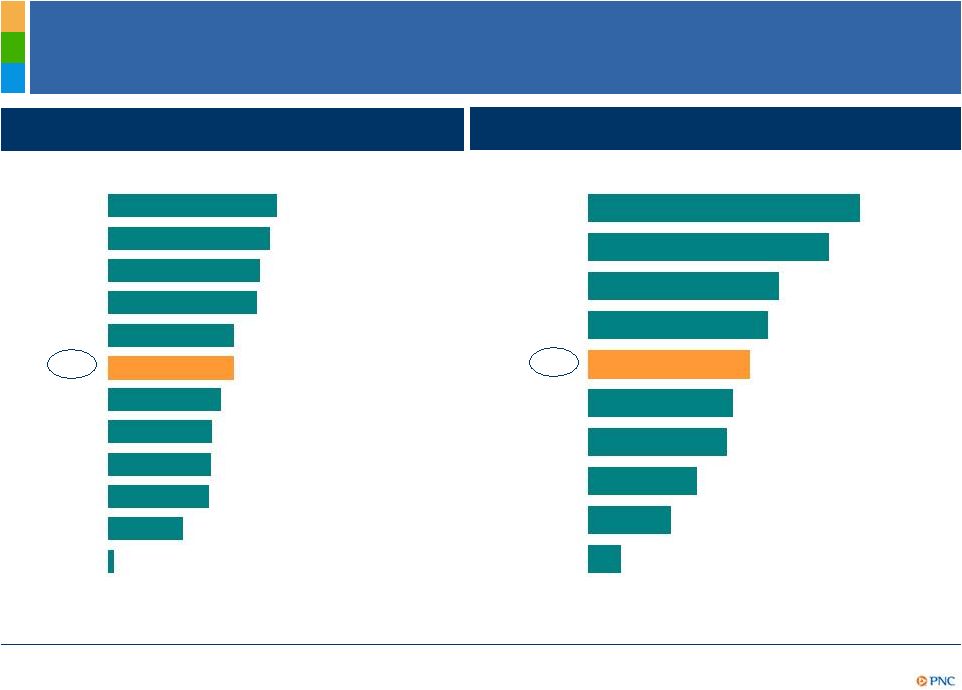
Delivering Solid Returns
3Q12 return on average assets
1.66%
1.59%
1.49%
1.46%
1.24%
1.23%
1.11%
1.02%
1.01%
0.99%
0.74%
0.06%
USB
COF
WFC
MTB
FITB
PNC
BBT
KEY
JPM
RF
CMA
BAC
24.3%
21.5%
17.0%
16.0%
14.3%
12.9%
12.4%
9.7%
7.4%
2.9%
USB
COF
BBT
JPM
PNC
FITB
RF
KEY
CMA
BAC
3Q12 return on average tangible common equity
1
Peer Source: SNL Database. STI 3Q12 return on average assets not meaningful for the peer
comparison as it includes their net gain from sale of Coca-Cola shares. Return on
average tangible common equity not disclosed by WFC, STI and MTB. (1) Return on average tangible
common equity is calculated as annualized net income attributable to common shareholders
divided by average tangible common equity (average common shareholders’ equity
less goodwill and other intangible assets other than servicing rights). Further information is
provided in the Appendix. |
 6
DRAFT
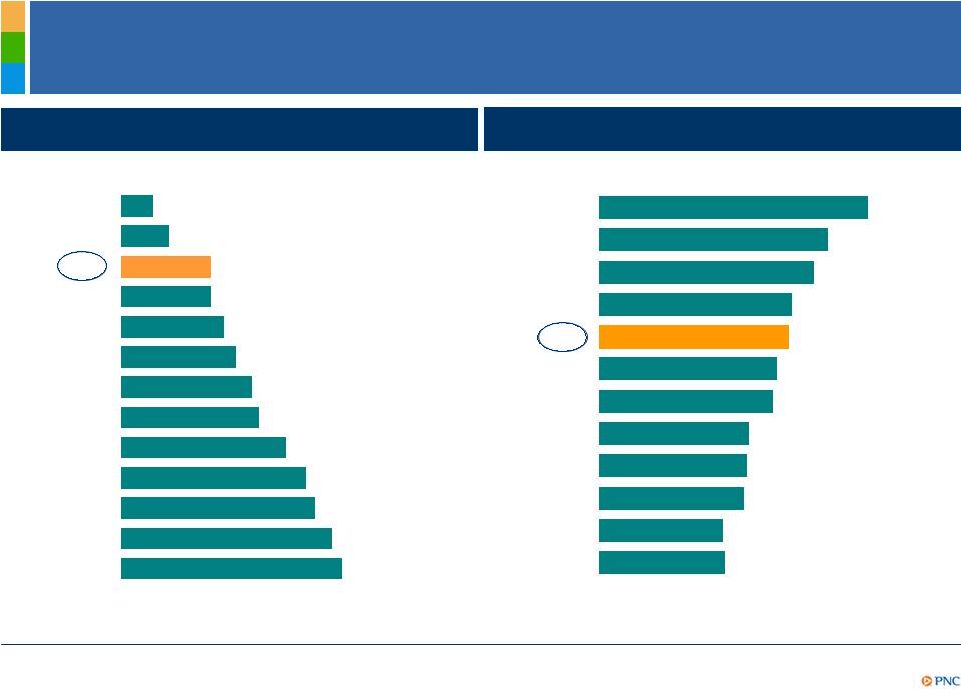
Effectively Managing Credit Risk
3Q12 net charge-offs to average loans
3Q12
loan
loss
reserves¹
to
total
loans
0.26%
0.39%
0.73%
0.74%
0.85%
0.95%
1.08%
1.14%
1.36%
1.53%
1.60%
1.74%
1.82%
MTB
CMA
PNC
FITB
KEY
USB
BBT
WFC
RF
JPM
STI
COF
BAC
3.16%
2.69%
2.53%
2.27%
2.22%
2.09%
2.05%
1.76%
1.74%
1.71%
1.46%
1.48%
JPM
RF
COF
FITB
PNC
WFC
USB
STI
BBT
KEY
CMA
BAC
Reflects company data for 3Q12 as of quarter-end except net charge-offs, which are for
the quarter and annualized, and average loans, which are for the quarter. Peer source:
SNL Database. (1) The allowance for loan and leases losses includes impairment reserves attributable to
purchased impaired loans. 3Q12 reserves/loans for PNC would have been 2.84% if both reserves
and loans had been adjusted to include the remaining marks on purchased impaired loans.
Further information is provided in the Appendix. Other peers have made acquisitions and have
marks on purchased impaired loans; however, adjusted information is not being provided for
those peers.
|
 7
DRAFT
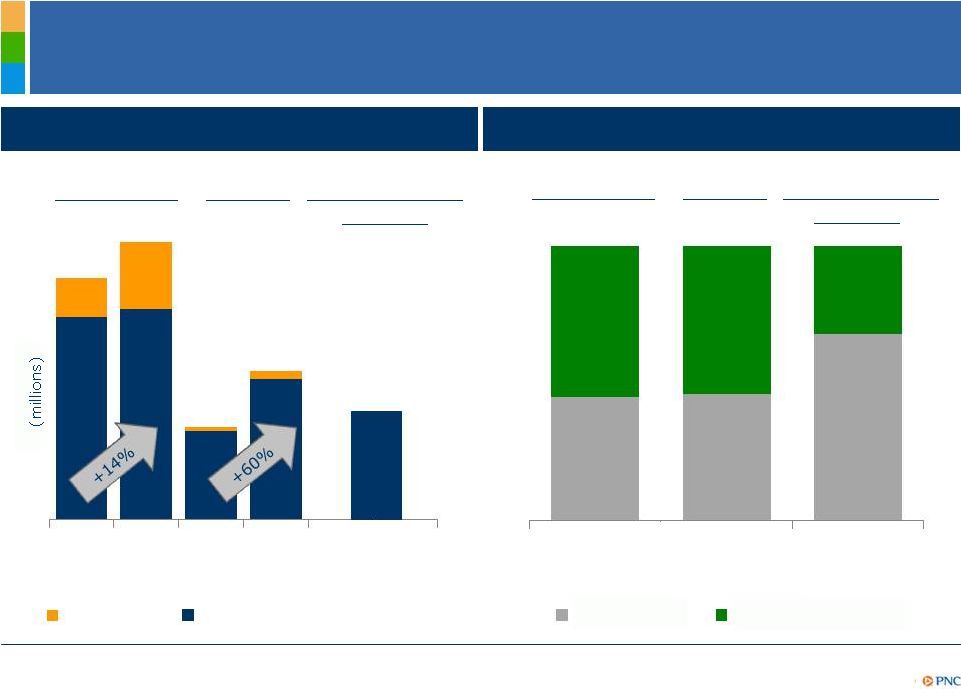
Growing Customers Creates Revenue Potential
Asset Management Group
Residential Mortgage
Retail Banking
Corporate Banking
Purchase
Net
new
organic
checking
relationships
New
primary
clients
New
primary
clients
Refinancing
Total loan originations
$7.0
$8.4
$10.8
HARP refinancing
48
225
230
YTD10
YTD11
YTD12
694
869
773
YTD10
YTD11
YTD12
809
1,084
1,355
YTD10
YTD11
YTD12
$3.3
$4.3
$5.0
$1.5
$2.0
$3.2
$2.2
$2.1
$2.6
YTD10
YTD11
YTD12
1
2
3
4
YTD defined as nine months ended September 30 of the respective year. (1) Net new organic
checking relationships refers to net new consumer and small business relationships
exclusive of relationships acquired through acquisition. (2) A Corporate Banking primary client is defined as a corporate
banking relationship with annual revenue generation of $50,000 or more or, within corporate
banking, a commercial banking client relationship with annual revenue generation of
$10,000 or more. (3) Asset Management Group primary client is defined as a client relationship with annual revenue
generation of $10,000 or more. (4) Purchase is defined as a mortgage with a borrower as part
of a residential real estate purchase transaction.
|
 DRAFT
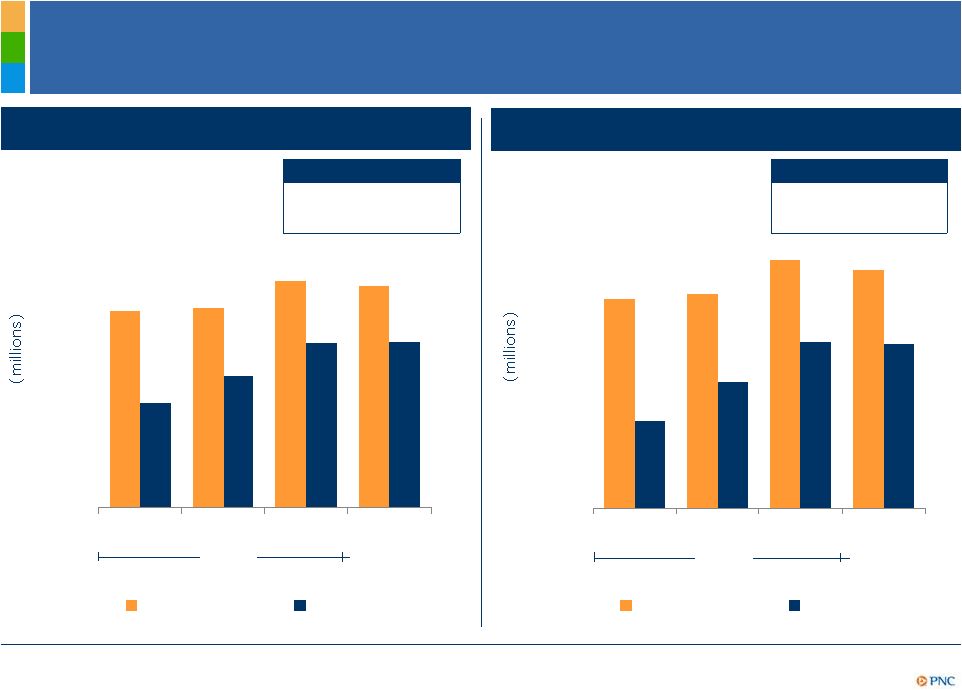
3Q11-3Q12 revenue
3Q11-3Q12
commercial
loans¹
Balance Sheet Growth Driving Revenue
RF
BAC
-3Q12 noninterest-bearing
deposits
BAC
(12%) w/o Coca-Cola gain²
2
25%
18%
17%
17%
17%
16%
14%
14%
14%
13%
12%
12%
7%
BBT
COF
PNC
WFC
MTB
STI
USB
KEY
CMA
BAC
FITB
JPM
STI
24%
15%
15%
12%
9%
7%
6%
6%
5%
5%
4%
4%
-5%
PNC
JPM
COF
USB
CMA
KEY
FITB
MTB
STI
BBT
BAC
WFC
76%
39%
16%
15%
13%
8%
8%
8%
6%
0%
0%
-1%
28%
STI
COF
BBT
PNC
MTB
USB
WFC
KEY
JPM
FITB
CMA
-
8
Peer
Source:
SNL
Database.
Deposit
and
loan
growth
based
on
spot
balances
at
September
30
,
2011
and
2012,
respectively.
Revenue growth based on change for 3Q12 vs. 3Q11. (1) PNC’s commercial loans balance
includes commercial, commercial real estate and equipment lease financing. JPM and COF
loan growth reflects commercial banking segment reported in company financials. Peer
Source: SNL Database. (2) The negative 12% revenue growth also noted reflects the exclusion of the net
securities gain from sale of Coca-Cola shares from STI 3Q12 revenues. Source: STI company
reports. th |
 DRAFT
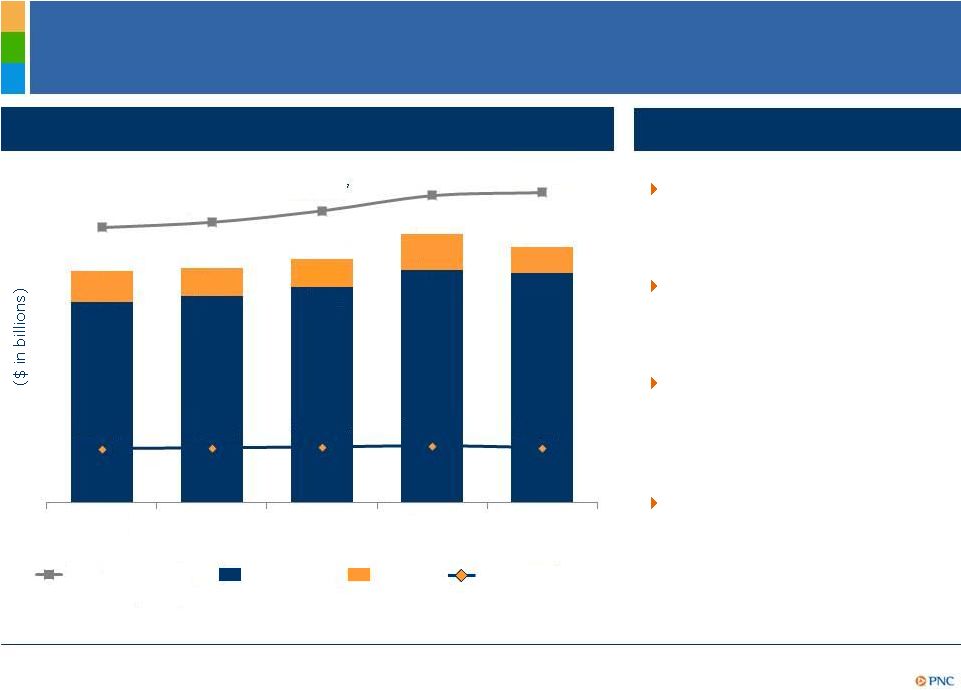
Loan Growth has Delivered Net Interest Income
Growth
Highlights
Increase in interest earning
assets driven by Southeast
expansion and organic loan
growth
Core NII growth driven by
Southeast expansion, organic
loan growth and lower
funding costs
Recently stable PAA declined
in 3Q12 due to maturities of
purchased performing loans,
maturing CDs, and lower cash
recoveries on impaired loans
Fourth quarter net interest
income expected to be flat to
down modestly compared to
linked quarter
Five quarter trend
$2.2
$2.2
$2.3
$2.5
$2.4
Core NII
1
PAA
2
Core net
interest margin
3
$1.9
$1.9
$2.0
$2.2
$2.2
$0.3
$0.3
$0.3
$0.3
$0.2
$224.1
$228.4
$237.7
$250.1
$252.6
Avg. interest
earning assets
3Q11
4Q11
1Q12
2Q12
3Q12
3.37%
3.42%
3.46%
3.53%
3.43%
9
4
(1) Core net interest income is total net interest income, as reported, less related purchase
accounting accretion (scheduled and cash recoveries). (2) Purchase accounting accretion
(PAA) includes scheduled purchase accounting accretion and cash recoveries. Cash recoveries reflect cash received in excess of recorded
investment from sales or payoffs of impaired commercial loans. (3) Core net interest margin
(Core NIM) is net interest margin less (annualized purchase accounting
accretion/average interest-earning assets). Further information is provided in the Appendix. Net interest margin for 3Q11, 4Q11, 1Q12, 2Q12
and 3Q12 was 3.89%, 3.86%, 3.90%, 4.08% and 3.82%, respectively. (4) Refer to Cautionary
Statement in the Appendix, including assumptions. |
 10
DRAFT
Expanding the Successful PNC Business Model into
Underpenetrated Markets
Philadelphia
3
Philadelphia
1
Chicago
1
$xx
$105
$120
$40
$64
AMG sales
Corporate Banking sales
RBC Bank (USA)
Chicago
3
Total Corporate Banking and AMG sales
Corporate Banking cross-sales by type
YTD12
$48
RBC Bank (USA)
Apr-Sep
2012
2010
2012
4
2010
2012
4
2012
5
45%
46%
68%
55%
54%
32%
Credit sales
Non-Credit sales
markets
2
markets
2
AMG refers to Asset Management Group. (1) Total market sales for 2010 vs. 2012 sales through
Sept. 30, 2012 annualized. (2) RBC Bank (USA) markets defined as Eastern Carolina,
Western Carolina, Greater Georgia, Northern Alabama and Gulf Coast. AMG sales not yet significant
to RBC Bank (USA) markets as we are in the build-out phase. (3) For September YTD 2012.
(4) 12-month annualized sales calculated based on sales through Sept. 30, 2012. (5)
12-month annualized sales calculated based on April-September 2012 sales. |
 11
DRAFT
Our Sales Momentum is Strong
Total Corporate Banking and AMG sales
Total Corporate Banking and AMG cross-sales
Actual
Annualized
Actual
Annualized
3-year CAGR
Northeast
4%
Midwest
16%
AMG refers to Asset Management Group. (1) 2012 sales through September 30, 2012 annualized.
3-year CAGR
Northeast
4%
Midwest
24%
1
1
$0
$100
$200
$300
$400
$500
$600
2009
2010
2011
YTD12
Northeast
Midwest
$0
$50
$100
$150
$200
$250
$300
2009
2010
2011
YTD12
Northeast
Midwest |
 12
DRAFT
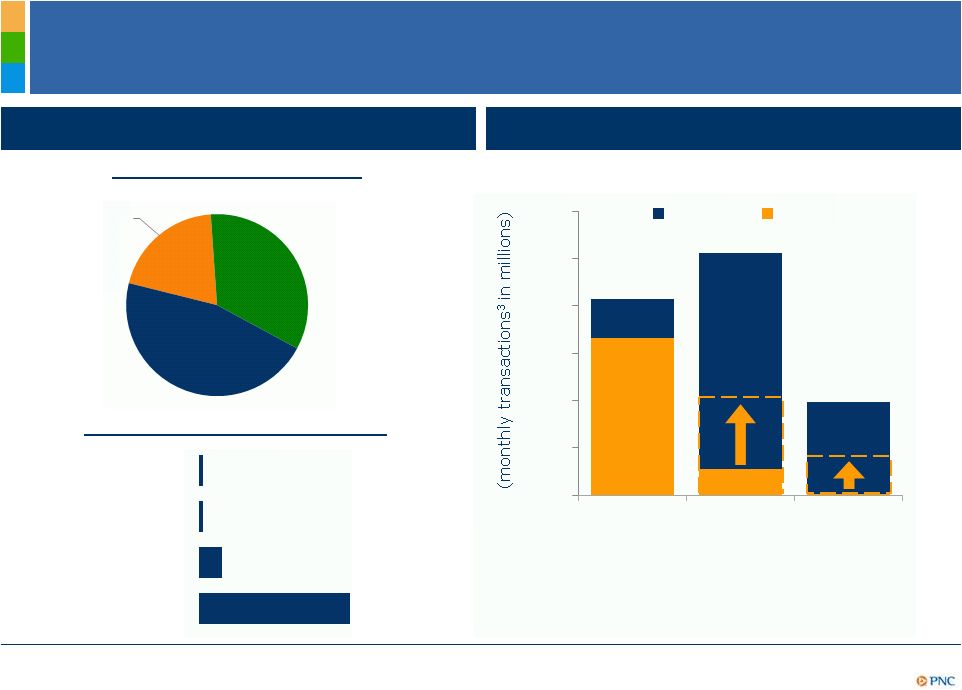
Serving Customers Tomorrow –
Changing the Retail
Branch Model
ATM channel migration strategy
PNC customers’
changing preferences
Withdrawals
Deposits
Check
cashing
40%
potential
20%
potential
Transaction
behavior mix
1
Cost
per
consumer
interaction
2
Traditional
Branch
20%
Primary
Virtual
34%
Multi-
channel
46%
Call center –
Interactive
voice response
Online/Mobile
ATM
Branch
$0.10
$0.09
$0.59
$3.97
0
2
4
6
8
10
12
Teller
ATM
(1) Percentages reflect the proportion of PNC customers considered to be traditional branch,
primary virtual usage or multi-channel customers based upon channels utilized for
transactions. Transactions refer to service transactions, which include deposits, withdrawals
and payments. Traditional branch customer is a customer who conducts greater than 80% of
monthly transactions in a branch. Primary virtual customer is a customer who conducts the majority of monthly transactions at non-branch channels (i.e., ATM, Online,
Call Center, Mobile). (2) A customer interaction includes any time the customer makes an
inquiry, accesses account information, reports a problem, makes a deposit or withdrawal
cashes a check, makes a transfer, or does another type of transaction. (3) Monthly transactions
reflect the monthly average for transactions conducted from October 2010- November
2011. Potential in chart represents potential for ATM channel percentage if transactions were to migrate from Teller to ATM channel.
|
 13
DRAFT
Capturing More Investable Assets in Underpenetrated
Customer Segments
Asset Management Group
A Top 10 bank-held wealth manager in U.S.
Significant opportunity to grow
personal investable assets
Customers (in thousands)
Investment & Wealth
households
400+
Assets
(in
billions)
1
AUA
2
$260
AUM
$112
Distribution
Employees
3,000+
Relationship Managers
200+
Banking Advisors
800+
Brokers
700+
Referrals from Retail & C&IB
+21% YTD
4%
>6%
4%
6%
$43B
3
$490B
3
$1,356B
3
>12%
>8%
Mass Market
Affluent
HNW/Wealth
2012 Penetration (9/30/12)
2016 Penetration (Goal)
Potential
–
across
footprint
$43
$490
$1,356
$1,900
2016 goal
>6%
>12%
>8%
$170+
4
(billions)
+
+
=
(1) Balances as of September 30, 2012. AUA defined as client assets under administration; and
AUM defined as discretionary assets under management. (2) AUA includes brokerage assets
of approximately $38 billion from Retail Banking business. (3) Personal investable assets -
PNC households (HH) definition: Mass Market is defined as HHs with assets < $100K;
Affluent is defined as HHs with assets between $100K - $1MM; High net worth/wealth
(HNW) is defined as HHs with assets > than $1MM. (4) Represents the targeted total AUA/AUM balance
projected for the personal investments business and is not incremental. |
 14
DRAFT
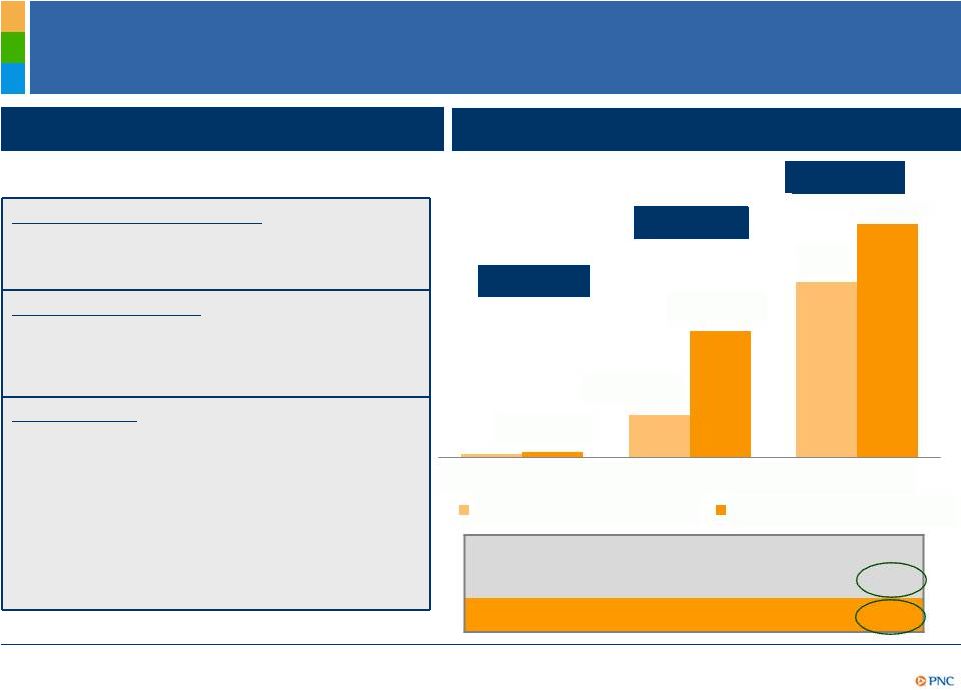
PNC’s Efficiency Ratio
YTD
9/30/12
Adjusted
9/30/12
Integration
costs and
Trust
Preferred
Securities
charges
Residential
Mortgage
repurchase
provision
2013
highlights
2
Expect positive operating
leverage
3
No integration and minimal
trust preferred securities
redemption charges expected
relative to 2012
Expect lower provision for
residential mortgage
repurchase obligations
Mortgage foreclosure-related
compliance and OREO
4
should
begin to decline in the second
half
More than $500 million of
Continuous Improvement
initiatives should fund
capacity to invest in future
growth
Focused on improving
customer margins in the
Retail Bank
Sensitivity
to
adjustments
1
68%
4%
3%
61%
Efficiency ratio is calculated as noninterest expense divided by total revenue. (1) Further
information is provided in the Appendix. (2) Refer to the Cautionary Statement in the
Appendix, including assumptions. (3) Subject to the effect of legal contingencies in 2013. (4) Mortgage
foreclosure-related compliance represents costs to comply with regulatory consent decrees.
OREO costs consist of gains/losses on sales of OREO assets, write-downs on the
assets and operating expenses.
|
 15
DRAFT
Strong Capital Position
Basel I Tier 1 common ratio of 9.5%
Basel III Tier 1 common pro forma ratio is 7.2% as of September 30, 2012
without
benefit
of
phase-ins
1
Basel III Tier 1 common ratio goal is 8.0-8.5% by year-end 2013 without
benefit
of
phase-ins
1
Capital priorities:
3Q12 highlights
–
Build capital to support client growth and business investment
–
Improve the quality of capital
–
Maintain appropriate capital in light of economic uncertainty
–
Return excess capital to shareholders
–
Lower cost of equity by effectively managing risk and capital
(1) Based on current understanding of Basel III NPRs and estimates of Basel II (with proposed
modifications) risk-weighted assets. Includes application of Basel II.5. Subject to
further regulatory clarity and development, validation and regulatory approval of Basel models.
|
 16
DRAFT
Cautionary Statement Regarding Forward-Looking
Information
Appendix
This presentation includes “snapshot” information about PNC used by way of
illustration and is not intended as a full business or financial review. It should not
be viewed in isolation but rather in the context of all of the information made available by PNC in its SEC filings.
We also make statements in this presentation, and we may from time to time make other
statements, regarding our outlook for earnings, revenues, expenses, capital levels and
ratios, liquidity levels, asset levels, asset quality, financial position, and other matters regarding or affecting PNC and its
future business and operations that are forward-looking statements within the meaning of
the Private Securities Litigation Reform Act Forward- looking statements are
typically identified by words such as “believe,” “plan,” “expect,” “anticipate,” “see,” “look,” “intend,” “outlook,” “project,”
“forecast,” “estimate,” “goal,” “will,”
“should” and other similar words and expressions. Forward-looking statements are subject to numerous
assumptions, risks and uncertainties, which change over time.
Forward-looking statements speak only as of the date made. We do not assume any duty
and do not undertake to update forward-looking statements. Actual results or future
events could differ, possibly materially, from those anticipated in forward-looking statements, as well as from
historical performance.
Our forward-looking statements are subject to the following principal risks and
uncertainties. Our businesses, financial results and balance sheet values are affected by business and
economic conditions, including the following:
o
Changes in interest rates and valuations in debt, equity and other financial markets.
o
Disruptions in the liquidity and other functioning of U.S. and global financial markets.
o
The impact on financial markets and the economy of any changes in the credit ratings of U.S.
Treasury obligations and other U.S. government- backed debt, as well as issues
surrounding the level of U.S. and European government debt and concerns regarding the creditworthiness of
certain sovereign governments, supranationals and financial institutions in Europe.
o
Actions by Federal Reserve, U.S. Treasury and other government agencies, including those that
impact money supply and market interest rates.
o
Changes in customers’, suppliers’ and other counterparties’ performance and
creditworthiness.
o
Slowing or failure of the current moderate economic expansion.
o
Continued effects of aftermath of recessionary conditions and uneven spread of positive
impacts of recovery on the economy and our counterparties, including adverse impacts on
levels of unemployment, loan utilization rates, delinquencies, defaults and counterparty ability to
meet credit and other obligations.
o
Changes in customer preferences and behavior, whether due to changing business and economic
conditions, legislative and regulatory initiatives, or other factors. Our forward-looking financial statements are subject to the risk that
economic and financial market conditions will be substantially different than we are
currently expecting. These statements are based on our current view that the moderate economic expansion will persist and interest rates
will remain very low for the remainder of 2012 and in 2013, despite downside risks from the
“fiscal cliff” and European recession.
PNC’s regulatory capital ratios in the future will depend on, among other
things, the company’s financial performance, the scope and terms of final capital
regulations then in effect (particularly those implementing the Basel Capital Accords), and management actions affecting the composition of
PNC’s balance sheet. In addition, PNC’s ability to determine, evaluate and forecast
regulatory capital ratios, and to take actions (such as capital distributions) based on
actual or forecasted capital ratios, will be dependent on the ongoing development, validation and regulatory approval of
related models.
|
 17
DRAFT
Cautionary Statement Regarding Forward-Looking
Information (continued)
•
Legal and regulatory developments could have an impact on our ability to operate our
businesses, financial condition, results of operations, competitive position,
reputation, or pursuit of attractive acquisition opportunities. Reputational impacts could affect matters such as business generation and retention,
liquidity, funding, and ability to attract and retain management. These developments
could include:
o
Changes resulting from legislative and regulatory reforms, including major reform of the
regulatory oversight structure of the financial services industry and changes to laws
and regulations involving tax, pension, bankruptcy, consumer protection, and other industry aspects, and changes
in accounting policies and principles. We will be impacted by extensive reforms provided
for in the Dodd-Frank Wall Street Reform and Consumer Protection Act (the
“Dodd-Frank Act”) and otherwise growing out of the recent financial crisis, the precise nature, extent and timing of which, and
their impact on us, remains uncertain.
o
Changes to regulations governing bank capital and liquidity standards, including due to the
Dodd-Frank Act and to Basel-related initiatives.
o
Unfavorable resolution of legal proceedings or other claims and regulatory and other
governmental investigations or other inquiries. In addition to matters relating
to PNC’s business and activities, such matters may include proceedings, claims, investigations, or inquiries relating to pre-
acquisition business and activities of acquired companies, such as National City. These
matters may result in monetary judgments or settlements or other remedies, including
fines, penalties, restitution or alterations in our business practices and in additional expenses and collateral costs,
and may cause reputational harm to PNC.
o
Results of the regulatory examination and supervision process, including our failure to
satisfy requirements of agreements with governmental agencies.
o
Impact on business and operating results of any costs associated with obtaining rights in
intellectual property claimed by others and of adequacy of our intellectual property
protection in general.
•
Business and operating results are affected by our ability to identify and effectively manage
risks inherent in our businesses, including, where appropriate, through effective use of
third-party insurance, derivatives, and capital management techniques, and to meet evolving regulatory capital standards. In
particular, our results currently depend on our ability to manage elevated levels of impaired
assets.
•
Business and operating results also include impacts relating to our equity interest in
BlackRock, Inc. and rely to a significant extent on information provided to us by
BlackRock. Risks and uncertainties that could affect BlackRock are discussed in more detail by BlackRock in its SEC filings.
•
Our acquisition of RBC Bank (USA) presents us with risks and uncertainties related to the
integration of the acquired businesses into PNC, including:
o
Anticipated benefits of the transaction, including cost savings and strategic gains, may be
significantly harder or take longer to achieve than expected or may not be achieved in
their entirety as a result of unexpected factors or events.
o
Our ability to achieve anticipated results from this transaction is dependent also on the
extent of credit losses in the acquired loan portfolios and the extent of deposit
attrition, in part related to the state of economic and financial markets. Also, litigation and regulatory and other
governmental investigations that may be filed or commenced relating to the pre-acquisition
business and activities of RBC Bank (USA) could impact the timing or realization of
anticipated benefits to PNC.
o
Integration of RBC Bank (USA)’s business and operations into PNC may take longer than
anticipated or be substantially more costly than anticipated or have unanticipated
adverse results relating to RBC Bank (USA)’s or PNC’s existing businesses. PNC’s ability to integrate RBC Bank
(USA) successfully may be adversely affected by the fact that this transaction results in PNC
entering several geographic markets where PNC did not previously have any meaningful
retail presence.
Appendix |
 18
DRAFT
Cautionary Statement Regarding Forward-Looking
Information (continued)
Appendix
•
In addition to the RBC Bank (USA) transaction, we grow our business in part by acquiring from
time to time other financial services companies, financial services assets and related
deposits and other liabilities. These other acquisitions often present risks and uncertainties analogous to those
presented by the RBC Bank (USA) transaction. Acquisition risks include those presented
by the nature of the business acquired as well as risks and uncertainties related to
the acquisition transactions themselves, regulatory issues, and the integration of the acquired businesses into PNC after
closing.
•
Competition can have an impact on customer acquisition, growth and retention and on credit
spreads and product pricing, which can affect market share, deposits and
revenues. Industry restructuring in the current environment could also impact our business and financial performance through
changes in counterparty creditworthiness and performance and in the competitive and regulatory
landscape. Our ability to anticipate and respond to technological changes can also
impact our ability to respond to customer needs and meet competitive demands.
•
Business and operating results can also be affected by widespread disasters, dislocations,
terrorist activities or international hostilities through impacts on the economy and
financial markets generally or on us or our counterparties specifically.
We provide greater detail regarding these as well as other factors in our 2011 Form 10-K,
as amended by Amendment No. 1 thereto, and 2012 Form 10-Qs, including in the Risk
Factors and Risk Management sections and the Legal Proceedings and Commitments and Guarantees Notes of the Notes
to Consolidated Financial Statements in those reports, and in our subsequent SEC
filings. Our forward-looking statements may also be subject to other risks
and uncertainties, including those we may discuss elsewhere in this presentation or in SEC filings, accessible on the SEC’s website at
www.sec.gov and on our corporate website at www.pnc.com/secfilings. We have included
these web addresses as inactive textual references only. Information on these
websites is not part of this document.
Any annualized, proforma, estimated, third party or consensus numbers in this presentation are
used for illustrative or comparative purposes only and may not reflect actual
results. Any consensus earnings estimates are calculated based on the earnings projections made by analysts who cover
that company. The analysts’ opinions, estimates or forecasts (and therefore the
consensus earnings estimates) are theirs alone, are not those of PNC or its management,
and may not reflect PNC’s or other company’s actual or anticipated results. |
 19
DRAFT
Non-GAAP to GAAP Reconcilement
As of
In millions except per share data
Dec. 31, 2007
Dec. 31, 2009
% Change
Common shareholders' equity
$14,847
$22,011
Common shares outstanding
341
462
Book value per common share
$43.60
$47.68
Goodwill and other intangible assets other than servicing rights (1)
$8,850
$10,650
Common shareholders' equity less intangible assets
$5,997
$11,361
Common shares outstanding
341
462
Tangible book value per common share
$17.59
$24.59
40%
As of
In millions except per share data
Dec. 31, 2009
Sep. 30, 2012
% Change
Common shareholders' equity
$22,011
$35,124
Common shares outstanding
462
529
Book value per common share
$47.68
$66.41
Goodwill and other intangible assets other than servicing rights (1)
$10,650
$9,944
Common shareholders' equity less intangible assets
$11,361
$25,180
Common shares outstanding
462
529
Tangible book value per common share
$24.59
$47.60
94%
PNC
believes
that
tangible
book
value
per
common
share,
a
non-GAAP
measure,
is
useful
as
a
tool
to
help
to
better
evaluate
growth
of
the
company's
business
apart
from
the
amount,
on
a
per
share
basis,
of
intangible
assets other than servicing rights included in book value per common share.
(1)
Servicing
rights
were
$701
million,
$2,259
million
and
$997
million
at
December
31,
2007,
December
31,
2009 and September 30, 2012, respectively.
Appendix |
 20
DRAFT
Non-GAAP to GAAP Reconcilement
As of
In millions
Sep. 30, 2012
Allowance for loan and lease losses
$4,039
Remaining mark on purchased impaired loans
$1,164
Allowance for loan and lease losses, adjusted to include remaining mark
$5,203
Loans, as reported
$181,864
Loans, adjusted to include remaining mark on purchased impaired loans
$183,028
Allowance for loan and lease losses to loans
2.22%
Allowance for loan and lease losses plus remaining mark to loans plus remaining mark
2.84%
Appendix
As of or for the three months ended
In millions
Sep. 30, 2012
Average common shareholders' equity
$34,323
Average goodwill and other intangible assets other than servicing rights
9,956
Average tangible common equity
$24,367
Net income attributable to common shareholders
876
Net income attributable to common shareholders, if annualized
3,485
Return on average tangible common equity
14.3%
PNC
believes
that
return
on
average
tangible
common
equity
is
useful
as
a
tool
to
help
measure
and
assess
a
company's use of common equity. |
 21
DRAFT
Non-GAAP to GAAP Reconcilement
$ in millions
Sept. 30, 2012
Jun. 30, 2012
Mar. 31, 2012
Dec. 31, 2011
Sep. 30, 2011
Net interest margin, as reported
3.82%
4.08%
3.90%
3.86%
3.89%
Purchase accounting accretion (1)
$245
$343
$263
$256
$291
Purchase accounting accretion, if annualized
$975
$1,380
$1,058
$1,016
$1,155
Avg. interest earning assets
$252,606
$250,132
$237,734
$228,406
$224,072
Annualized purchase accounting accretion/Avg. interest-earning assets
0.39%
0.55%
0.44%
0.44%
0.52%
Core net interest margin (2)
3.43%
3.53%
3.46%
3.42%
3.37%
For the three months ended
(1) Purchase accounting accretion is scheduled purchase accounting accretion plus cash
recoveries. (2)
PNC
believes
that
core
net
interest
margin,
a
non-GAAP
measure,
is
useful
as
a
tool
to
help
evaluate
the
impact
of
purchase
accounting
accretion
on
net interest margin. The adjustment represents annualized purchase accounting accretion
divided by average interest-earning assets. in millions
Net interest
income
Noninterest
income
Total revenue
Noninterest
expense
Efficiency ratio
As reported
$7,216
$4,227
$11,443
$7,753
68%
Adjustments:
Integration costs and trust preferred securities redemption charges
-
-
-
($457)
Provision for residential mortgage repurchase obligations
-
$507
$507
-
As adjusted
$7,216
$4,734
$11,950
$7,296
61%
PNC believes that information adjusted for the impact of certain items may be useful to help
evaluate the impact of those items on our operations. For the nine months ended Sep.
30, 2012 Appendix |
 DRAFT
Peer Group of Banks
Appendix
The PNC Financial Services Group, Inc.
PNC
BB&T Corporation
BBT
Bank of America Corporation
BAC
Capital One Financial, Inc.
COF
Comerica Inc.
CMA
Fifth Third Bancorp
FITB
JPMorgan Chase
JPM
KeyCorp
KEY
M&T Bank
MTB
Regions Financial Corporation
RF
SunTrust Banks, Inc.
STI
U.S. Bancorp
USB
Wells Fargo & Co.
WFC
Ticker
22 |