Attached files
| file | filename |
|---|---|
| 8-K - 8-K - LRR Energy, L.P. | a12-28314_28k.htm |
Exhibit 99.1
|
|
LRR Energy, L.P. December 2012 |
|
|
This presentation contains "forward-looking statements" — that is, statements related to future events. Forward-looking statements are based on the current expectations of LRR Energy and include any statement that does not directly relate to a current or historical fact. In this context, forward-looking statements often address expected future business and financial performance, and often contain words such as "may," "predict," "pursue," "expect," "estimate," "project," "plan," "believe," "intend," "achievable," "anticipate," "target," "continue," "potential," "should," "could" and other similar words. Forward-looking statements in this presentation relate to, among other things, LRR Energy’s expectations regarding future results, production volumes, lease operating expenses and capital expenditures. Actual results and future events could differ materially from those anticipated or implied in such statements. Forward-looking statements involve certain risks and uncertainties, and ultimately may not prove to be accurate. These risks and uncertainties include, among other things, a decline in oil, natural gas or NGL prices, the risk and uncertainties involved in producing oil and natural gas, competition in the oil and natural gas industry, governmental regulations and other factors. Actual results could differ materially from those anticipated or implied in the forward-looking statements due to the factors described under the captions "Risk Factors" in LRR Energy's Annual Report on Form 10-K for the year ended December 31, 2011 and LRR Energy's subsequent filings with the Securities and Exchange Commission. All forward-looking statements speak only as of the date of this presentation. Other than required under the securities laws, LRR Energy does not intend to update or revise any forward-looking statements, whether as a result of new information, future events or circumstances, changes in expectations or otherwise. All forward-looking statements are qualified in their entirety by this cautionary statement. Forward Looking Statements LRR Energy, L.P. |
|
|
Lime Rock Management "Lime Rock" Who is Lime Rock? LRR Energy, L.P. Formed in 2005 Consists of two funds, raising third fund ~$1.3 billion invested in 15 major acquisitions $235 million of additional acquisition capacity 29.8 MMBoe of proved reserves1 Owns 52% of LRE's LP interests Mature producing oil and natural gas properties 30.6 MMBoe of proved reserves2 Three operating regions $3.0 billion capital under management Consists of five funds Founded in 1998 Manages $3.9 billion of private capital LRR Energy, L.P. "LRE" Lime Rock Resources "LRR" Lime Rock Partners "LRP" Estimated proved reserves as of 6/30/2012 based on strip pricing. LRE properties based on third party reserve reports as of 12/31/11 using 12/31/11 SEC pricing. June 2012 Acquisition reserves based on third party reserve reports as of 3/1/12 using 1/31/12 pricing. Does not include recently announced acquisition. |
|
|
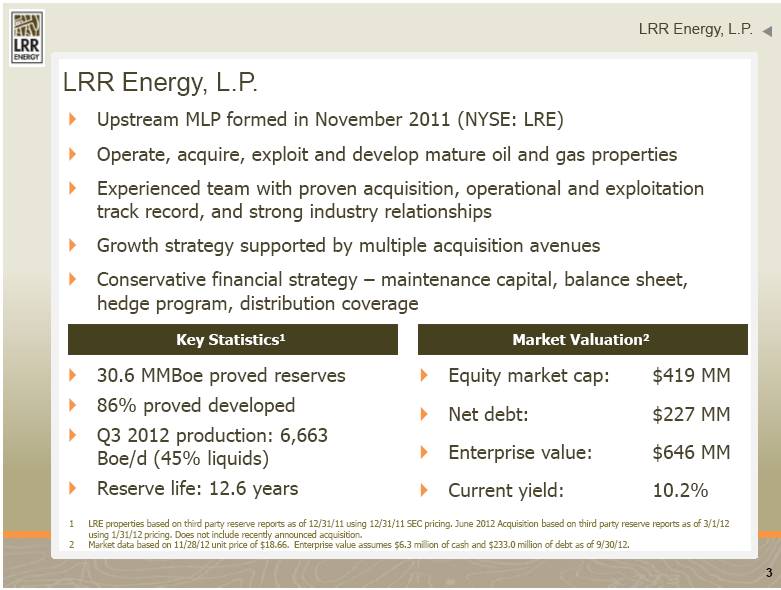
LRR Energy, L.P. LRR Energy, L.P. Upstream MLP formed in November 2011 (NYSE: LRE) Operate, acquire, exploit and develop mature oil and gas properties Experienced team with proven acquisition, operational and exploitation track record, and strong industry relationships Growth strategy supported by multiple acquisition avenues Conservative financial strategy – maintenance capital, balance sheet, hedge program, distribution coverage Market Valuation2 30.6 MMBoe proved reserves 86% proved developed Q3 2012 production: 6,663 Boe/d (45% liquids) Reserve life: 12.6 years Equity market cap: $419 MM Net debt: $227 MM Enterprise value: $646 MM Current yield: 10.2% Key Statistics1 LRE properties based on third party reserve reports as of 12/31/11 using 12/31/11 SEC pricing. June 2012 Acquisition based on third party reserve reports as of 3/1/12 using 1/31/12 pricing. Does not include recently announced acquisition. Market data based on 11/28/12 unit price of $18.66. Enterprise value assumes $6.3 million of cash and $233.0 million of debt as of 9/30/12. |
|
|
Property Summary Note: LRE properties based on third party reserve reports as of 12/31/11 using 12/31/11 SEC pricing. June 2012 Acquisition reserves based on third party reserve reports as of 3/1/12 using 1/31/12 pricing. Does not include recently announced acquisition. Approximately 71% of total estimated proved reserves were proved developed producing and approximately 15% were proved developed non-producing. LRR Energy, L.P. Mid Continent Gulf Coast Q3 2012 Production (Boe/d) 1,837 Proved Reserves (MMBoe) 10.0 % Proved Developed 94% % Liquids 0% Total Proved Reserve Life (R/P) 15.0 Permian Q3 2012 Production (Boe/d) 3,833 Proved Reserves (MMBoe) 16.8 % Proved Developed 80% % Liquids 63% Total Proved Reserve Life (R/P) 12.0 LRE Total Q3 2012 Production (Boe/d) 6,663 Proved Reserves (MMBoe) 30.6 % Proved Developed (1) 86% % Liquids 39% Total Proved Reserve Life (R/P) 12.6 Q3 2012 Production (Boe/d) Proved Reserves (MMBoe) Proved Developed % Liquids Total Proved Reserve Life (R/P) 993 3.8 89% 31% 10.4 |
|
|
Recent Events Acquisition from Lime Rock Resources Expected close of January 3, 2013 $21 mm purchase of Mid-Continent assets Immediately accretive to distributable cash flow per unit Bolt-on acquisition of concentrated, low-risk, and primarily operated assets Proved reserves of 1,987 Mboe 53% PDP, 55% liquids Production of 350 Boe/d 15.6 year reserve life 3rd Quarter results and distribution Production of 6,663 Boe/d EBITDA of $19.5 million Increased quarterly distribution to $0.4775 per unit Distribution coverage of 1.14x Commodity hedges Added oil and gas hedges through 2017 LRR Energy, L.P. |
|
|
Quality Assets Low Risk, Mature Assets Focused Portfolio Control Development Low-Cost Operator Developmental Inventory Shallow production decline 86% proved developed reserves 12.6 R/P Focused operations and diversified geographically Three operating areas with scale Operate 93% of proved reserves Nearly all acreage is held by production Control project selection, timing and costs All major fields in primary production 3Q 2012 field level cash costs of $14.53/Boe1 Low-risk, balanced proved inventory – 422 total projects 207 gross development projects 215 gross drilling locations LRR Energy, L.P. 3Q 2012 field level cash cost per Boe based on expenses of $8.906 million divided by 613 MBoe (see page 21 of the 9/30/2012 10-Q SEC filing). Expenses include Lease Operating Expenses of $6.919 million, and Production and Ad Valorem Taxes of $1.987 million. |
|
|
Permian Basin Region1 Key fields: Red Lake, Pecos Slope, Corral Canyon Proved reserves: 16.8 MMBoe (55% of total) R/P Ratio: 12.0 years LRE operated: 93% of value 703 gross (582 net) producing wells 152 gross development projects & 174 gross drilling locations ~$29 mm capital budget (over 90% of total budget) Red Lake Field Oil-weighted field located in Eddy County, New Mexico 2012 Development Plans ~$24 mm capital budget (over 75% of total budget) Drill 15 wells, refrac 3 wells, recomplete 8 wells, deepen 2 wells, 1 SWD well Initial well performance significantly above expectations Fifteen 2012 drill wells have established 30-day initial production rates equal to 150% of our forecasted rates LRR Energy, L.P. LRE properties based on third party reserve reports as of 12/31/11 using 12/31/11 SEC pricing. June 2012 Acquisition reserves based on third party reserve reports as of 3/1/12 using 1/31/12 pricing. Does not include recently announced acquisition. |
|
|
Mid-Continent & Gulf Coast Regions Mid-Continent Summary Overview1 Key fields: Potato Hills Proved reserves: 10.0 MMBoe (33% of total) Q3 2012 Net production: 1,837 Boe/d (28% of total) R/P Ratio: 15.0 years LRE operated: 92% of value 44 gross development projects & 40 gross drilling locations Gulf Coast Summary Overview1 Key fields: New Years Ridge, GW-Stratton Proved reserves: 3.8 MMBoe (12% of total) Q3 2012 Net production: 993 Boe/d (15% of total) R/P Ratio: 10.4 years LRE operated: 92% of value 11 gross development projects & 1 gross drilling location LRR Energy, L.P. LRE properties based on third party reserve reports as of 12/31/11 using 12/31/11 SEC pricing. June 2012 Acquisition reserves based on third party reserve reports as of 3/1/12 using 1/31/12 pricing. Does not include recently announced acquisition. |

|
|
2012 Capital Budget LRR Energy, L.P. 2012 capital budget of $31 million ~85% production related, ~15% other Over 95% of production related budget is focused on liquids projects Q3 2012 Production Q4 2011 Production 5,761 Boe/d 6,663 Boe/d 25% 65% 10% Oil Gas NGL 31% 55% 14% Oil Gas NGL |
|
|
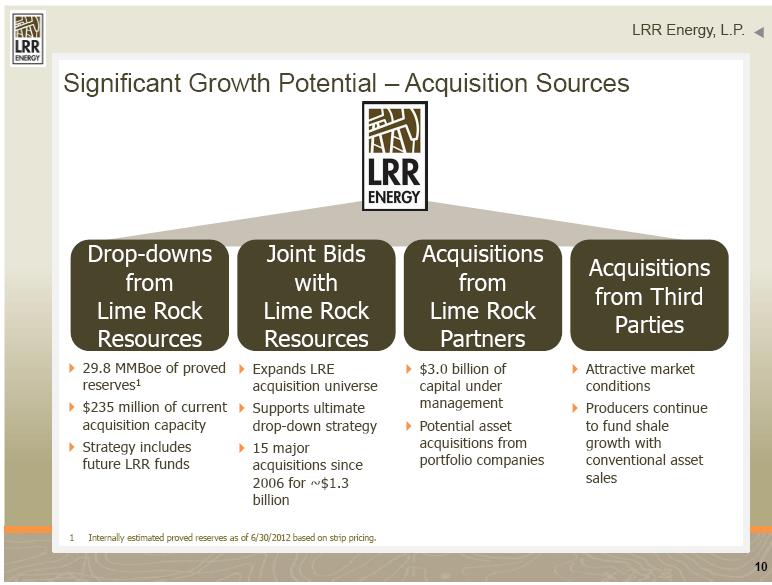
LRR Energy, L.P. Significant Growth Potential – Acquisition Sources 29.8 MMBoe of proved reserves1 $235 million of current acquisition capacity Strategy includes future LRR funds $3.0 billion of capital under management Potential asset acquisitions from portfolio companies Attractive market conditions Producers continue to fund shale growth with conventional asset sales Drop-downs from Lime Rock Resources Joint Bids with Lime Rock Resources Acquisitions from Lime Rock Partners Acquisitions from Third Parties Expands LRE acquisition universe Supports ultimate drop-down strategy 15 major acquisitions since 2006 for ~$1.3 billion Internally estimated proved reserves as of 6/30/2012 based on strip pricing. |
|
|
LRR Energy, L.P. Lime Rock Resources – Growing Inventory of Assets 21% Gas 79% Liquids 5% Gas 95% Liquids 1 Annualized first six months of 2012. Excludes hedge gains and losses during the period. Estimated annualized September 2012 revenue. Based on assumed NYMEX prices of $96.01 for oil and $2.72 for natural gas. Excludes hedge gains and losses during the period. Annual Revenue 2 $92.9 $163.2 $0 $20 $40 $60 $80 $100 $120 $140 $160 $180 $MM 1 |
|
|
Conservative Financial Strategy Maintain Strong Balance Sheet Active Hedge Program Maintenance Capital Reduces cash flow volatility, and protects distributions, borrowing base and capital program General hedge target of 85% of estimated PDP production for 3-5 years Layer on additional hedges with future acquisitions Strategy includes regional basis and interest rate hedges Target debt/Adjusted EBITDA of <3.0x (pro forma ~3.0x) Maintain adequate liquidity Fund acquisitions with prudent leverage Capital required to maintain production Estimated $21 million per year Estimate based on internal development inventory LRR Energy, L.P. |
|
|
Hedge Portfolio LRR Energy, L.P. ~88% of current PDP is hedged through 2017 Assuming flat production1, total production is hedged 88% in 2012, 87% in 2013, 62% in 2014, 56% in 2015, 52% in 2016 and 42% in 2017 Average prices: $5.09 per MMBtu, $93.69 per oil barrel and $50.68 per NGL barrel Natural Gas Hedges NGL Hedges Crude Oil Hedges Note: Hedge prices based on weighted-average of swap prices, collar floor prices and put strike prices. Assumes production through 2017 remains constant at midpoint of 2012 guidance (6,325 Boe/d) and production mix of gas 55%, oil 33% and NGL 12%. ($/Bbl) 4Q 2012 2013 2014 2015 2016 Hedged Price $51.29 $50.49 NA NA NA 0 50 100 150 200 250 300 4Q 2012 2013 2014 2015 2016 Production (MBbl) Hedged Volumes Production 52% 65% ($/Bbl) 4Q 2012 2013 2014 2015 2016 2017 Hedged Price $97.57 $95.19 $96.29 $94.49 $86.02 $85.75 0 200 400 600 800 4Q 2012 2013 2014 2015 2016 2017 Production (MBbl) Hedged Volumes Production 81% 81% 61% 52% 52% 26% ($/Mcf) 4Q 2012 2013 2014 2015 2016 2017 Hedged Price $5.15 $5.10 $5.52 $5.71 $4.28 $4.61 0 2 4 6 8 10 4Q 2012 2013 2014 2015 2016 2017 Production (Bcf) Hedged Volumes Production 97% 98% 77% 60% 70% 64% |
|
|
2012 Guidance and Capitalization LRR Energy, L.P. Capitalization As Of September 30, 2012 Cash $6.3 Senior Credit Facility $183.0 2nd Lien Term Loan $50.0 Total Debt $233.0 Unitholders' Equity $241.0 Liquidity $73.3 2012 Guidance Daily Production (Boe/d) 6,250 - 6,400 Lease Operating Expenses ($/Boe) $10.50 - $11.00 Maintenance Capital ($ MM) $21.0 Other Capital ($ MM) $10.0 Total Capital ($ MM) $31.0 |
|
|
Why LRE MLP? Experienced and incentivized management team with track record of: Successful acquisitions Skilled exploitation Distributions Capital management Proven Management Stable, low-risk and predictable properties Primary production and low cost asset portfolio Large internal project inventory 93% of properties operated Quality Assets Multiple avenues for growth Large inventory of suitable assets at LRR Potential acquisitions from LRP Attractive acquisition market Growth Potential Distributions supported by: Maintenance capital Substantial hedges through 2016 Strong balance sheet Distribution coverage Subordinated units Conservative Financial Strategy LRR Energy, L.P. |
|
|
Appendix Appendix |

|
|
Management Team & Board of Directors Executive Leadership Non-Management Directors Appendix Jonathan Farber Townes Pressler, Jr. John Bailey Milton Carroll Robert O'Connell Managing Director of Lime Rock Partners Managing Director of Lime Rock Partners Independent Director Independent Director Independent Director Years of Name and Position Experience Select Prior Experience Eric Mullins Co-CEO and Chairman 21 Lime Rock Resources; Goldman Sachs Charles Adcock Co-CEO and Director 35 Lime Rock Resources; Houston Exploration; Operational roles with various E&P companies Chris Butta VP and Chief Engineer 28 Lime Rock Resources; Miller and Lents, Ltd.; ARCO Oil and Gas Company Jaime Casas VP, CFO 15 Laredo Energy; Credit Suisse; Donaldson, Lufkin & Jenrette; Accenture Tim Miller VP and COO 29 Lime Rock Resources; El Paso Corporation; Petroleum Engineer |
|
|
Lime Rock Management LP LRR Energy, L.P. (NYSE: LRE) LRE GP, LLC Incentive Distribution Rights Public Common Units Summary Organization Lime Rock Resources ("LRR") Fund I Common Units Subordinated Units LRE Operating, LLC 100% Class A Member Interest 0.1% GP Interest 100% Interest 47.5% LP Interest 52.4% LP Interest Appendix |
|
|
Commodity Hedges Appendix 1 Hedge prices based on weighted-average of swap prices, collar floor prices and put strike prices. Current Hedge Position (Swaps, Collars & Puts) 4Q 2012 2013 2014 2015 2016 2017 NYMEX HH GAS Swaps Gas (MMBtu) 1,067,511 7,267,590 5,876,099 5,326,561 4,878,990 4,605,396 Wt Avg Price $5.70 $5.15 $5.52 $5.71 $4.28 $4.61 Collars Gas (MMBtu) 697,429 Wt Avg Price $4.75/$7.31 Puts Gas (MMBtu) 96,635 178,710 Strike Price $2.00 $3.00 Total (Swaps, Collars & Puts) Gas (MMBtu) 1,861,575 7,446,300 5,876,099 5,326,561 4,878,990 4,605,396 Wt Avg Price (1) $5.15 $5.10 $5.52 $5.71 $4.28 $4.61 NYMEX WTI OIL Swaps Oil (Bbl) 151,045 620,772 460,926 398,253 397,486 198,744 Wt Avg Price $98.31 $95.19 $96.29 $94.49 $86.02 $85.75 Puts Oil (Bbl) 4,085 Strike Price $70.00 Total (Swaps & Puts) Oil (Bbl) 155,130 620,772 460,926 398,253 397,486 198,744 Wt Avg Price (1) $97.57 $95.19 $96.29 $94.49 $86.02 $85.75 NGLs Swaps OPIS MB NGLs (Bbl) 45,598 144,323 Wt Avg Price $51.29 $50.49 |
|
|
Appendix Adjusted EBITDA Calculation Adjusted EBITDA is used as a supplement financial measure by our management and by external users of our financial statements, such as investors, commercial banks and others, to assess: our operating performance as compared to that of other companies and partnerships in our industry, without regard to financing methods, capital structure or historical cost basis; and the ability of our assets to generate sufficient cash flow to make distributions to our unitholders Note: We define Adjusted EBTIDA as net income (loss), Plus: income tax expense (benefit); interest expense-net, including realized and unrealized losses on interest rate derivative contracts; depletion and depreciation; accretion of asset retirement obligations; amortization of equity awards; gain (loss) on settlement of asset retirement obligations; unrealized losses on commodity derivative contracts; impairment of oil and natural gas properties; and other non-recurring items that we deem appropriate, Less interest income; unrealized gains on commodity derivative contracts; and other non-recurring items that we deem appropriate. Adjusted EBITDA should not be considered an alternative to net income, operating income, cash flow from operating activities or any other measure of financial performance presented in accordance with GAAP. Our Adjusted EBITDA may not be comparable to similarly titled measures of another company because all companies may not calculate Adjusted EBITDA in the same manner. Adjusted EBITDA Calculation ($ in thousands) Three Months Ended Nine Months Ended September 30, 2012 September 30, 2012 Net Income ($15,558) $2,761 Income Tax Expense 20 170 Interest Expense, Net Including Unrealized Gain/Loss on Derivatives 4,358 9,006 Depletion and Depreciation 8,267 28,126 Accretion of Asset Retirement Obligations 369 1,086 Amortization of Equity Awards 81 231 Gain on Settlement of Asset Retirement Obligation 94 (14) Unrealized Losses on Commodity Derivative Instruments 21,463 10,455 Impairment of Oil and Natural Gas Properties 451 3,544 Interest Income - - Unrealized Gain on Commodity Derivative Instruments - - Adjusted EBITDA $19,545 $55,365 |
|
|
Appendix Distributable Cash Flow and Distribution Coverage Calculation Amount represents pro-rated capital for the period outstanding. Note: Distributable Cash Flow should not be considered an alternative to net income, operating income, cash flow from operating activities or any other measure of financial performance or liquidity presented in accordance with GAAP. Our Distributable Cash Flow may not be comparable to similarly titled measures of another company because all companies may not calculate Adjusted EBITDA in the same manner. The following table presents a reconciliation of Distributable Cash Flow and Distribution Coverage Ratio to Adjusted EBITDA. Adjusted EBITDA is reconciled to net income, our most directly comparable GAAP financial performance measure, on the previous slide We define Distributable Cash Flow as Adjusted EBITDA less income tax expense; cash interest expense, net of realized losses on interest rate swaps; and estimated maintenance capital expenditures. Distribution Coverage Ratio is defined as the ratio of Distributable Cash Flow to total quarterly distributions payable on all of our outstanding common subordinated and general partner units Distributable Cash Flow and Distribution Coverage Table ($ in thousands) Three Months Ended Nine Months Ended September 30, 2012 September 30, 2012 Adjusted EBITDA $19,545 $55,365 Income Tax Expense (20) (170) Cash Interest Expense (2,080) (4,570) Estimated Maintenance Capital 1 (5,250) (15,750) Distributable Cash Flow $12,195 $34,875 Cash Distribution $10,720 $32,049 Distributable Coverage Ratio 1.14x 1.09x |