Attached files
| file | filename |
|---|---|
| 8-K - HINES REIT SHAREHOLDER PRESENTATION 8-K - HINES REAL ESTATE INVESTMENT TRUST INC | hinesreitq3shareholderpres.htm |
Ryan Sims, CFO Shea Morgenroth, CAO Hines REIT Third Quarter Update and Share Valuation News Hines REIT is closed to new investors. Hines Securities, Inc., Member FINRA/SIPC, is the dealer/manager. 11/12

FOR BROKER/DEALER USE ONLY. This material may not be quoted, reproduced nor shown to members of the public, nor used as sales material for public use. Hines Securities, Inc., Member FINRA/SIPC. 8/12 Hines EIT is closed to new investors. Hines Securities, Inc., M mber FINRA/SIPC. 11/12 Agenda 2 Overview and Market Update Portfolio Update Share Valuation News Management Focus and Priorities
FOR BROKER/DEALER USE ONLY. This material may not be quoted, reproduced nor shown to members of the public, nor used as sales material for public use. Hines Securities, Inc., Member FINRA/SIPC. 8/12 Hines EIT is closed to new investors. Hines Securities, Inc., M mber FINRA/SIPC. 11/12 Hines REIT Overview 3 Commenced capital raising in 2004 Raised and invested significant capital in 2006 and 2007 which represented a peak in the overall economic cycle and real estate cycle In 2008 and 2009, amidst the global financial crisis, we experienced significant declines in capital raising and significant increases in redemption requests At the end of 2009, capital raising ceased and we suspended our redemption plan to prudently preserve liquidity and protect the company’s financial position

FOR BROKER/DEALER USE ONLY. This material may not be quoted, reproduced nor shown to members of the public, nor used as sales material for public use. Hines Securities, Inc., Member FINRA/SIPC. 8/12 Hines EIT is closed to new investors. Hines Securities, Inc., M mber FINRA/SIPC. 11/12 Hines REIT Overview 4 Since 2009, management has been keenly focused on: – Leasing: Preserving and maintaining operating income and values – Strategic asset sales: Identifying opportunities to harvest liquidity and attractive profits • Atrium on Bay, One and Two Shell Plaza, One North Wacker, Three First National Plaza, Brazil Industrial and 600 Lexington – Liquidity: Ensuring funding for operating expenses, leasing capital, and debt refinancings, while maintaining shareholder distributions We continue to be patient and disciplined in managing our portfolio in order to benefit from the slow but steady economic U.S. office market recovery

FOR BROKER/DEALER USE ONLY. This material may not be quoted, reproduced nor shown to members of the public, nor used as sales material for public use. Hines Securities, Inc., Member FINRA/SIPC. 8/12 Hines EIT is closed to new investors. Hines Securities, Inc., M mber FINRA/SIPC. 11/12 Global Economic Update 5 Economic recovery continues, but slowly • GDP up 2.0% in Q3 of 20121 Unemployment is still high • Hovering just below 8%2 • 5.0M private sector jobs have been added to the U.S. economy since March 2010 (1 out of 3 jobs have been office-using) • Offset by more than half a million cuts in public sector Uncertainty in global economy causing instability in U.S. markets • U.S. debt ceiling and budget concerns • Ongoing fiscal and debt crisis in Europe 1Bureau of Economic Analysis. 2Bureau of Labor Statistics and Hines.

FOR BROKER/DEALER USE ONLY. This material may not be quoted, reproduced nor shown to members of the public, nor used as sales material for public use. Hines Securities, Inc., Member FINRA/SIPC. 8/12 Hines EIT is closed to new investors. Hines Securities, Inc., M mber FINRA/SIPC. 11/12 U.S. Real Estate Market Update 6 Moderate growth in office markets • Growth has been reasonably good over past two years • Growth is tempered as many tenants still have excess space left over from job cuts during the downturn • Moderate demand coupled with limited supply is beginning to put upward pressure on rents in many markets Recovery varies by market • New York, Chicago, Houston and San Francisco continue to show signs of rental growth • Some secondary markets such as Phoenix, Sacramento and Charlotte continue to struggle

FOR BROKER/DEALER USE ONLY. This material may not be quoted, reproduced nor shown to members of the public, nor used as sales material for public use. Hines Securities, Inc., Member FINRA/SIPC. 8/12 Hines EIT is closed to new investors. Hines Securities, Inc., M mber FINRA/SIPC. 11/12 Portfolio Summary 7 Total real estate assets of approximately $3.4 billion1 Interests in 55 properties totaling approximately 25 million square feet Weighted average occupancy of 87% Current leverage percentage of 49% with weighted average interest rate of 5.6%1 1 Data as of September 30, 2012 and based on Hines REIT’s pro rata ownership.

FOR BROKER/DEALER USE ONLY. This material may not be quoted, reproduced nor shown to members of the public, nor used as sales material for public use. Hines Securities, Inc., Member FINRA/SIPC. 8/12 Hines EIT is closed to new investors. Hines Securities, Inc., M mber FINRA/SIPC. 11/12 Occupancy Trends 8 Source: NCREIF 80% 82% 84% 86% 88% 90% 92% 94% 96% 2004 2005 2006 2007 2008 2009 2010 1Q11 2Q11 3Q11 4Q11 1Q12 2Q12 3Q12 NCREIF US Office Leased Hines REIT Portfolio Leased
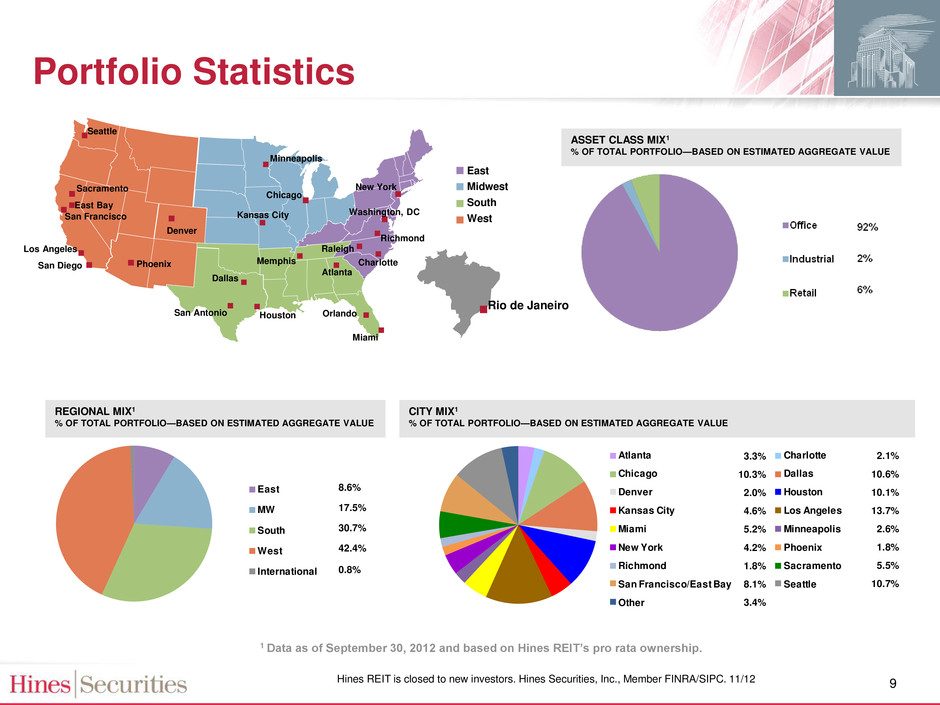
FOR BROKER/DEALER USE ONLY. This material may not be quoted, reproduced nor shown to members of the public, nor used as sales material for public use. Hines Securities, Inc., Member FINRA/SIPC. 8/12 Hines EIT is closed to new investors. Hines Securities, Inc., M mber FINRA/SIPC. 11/12 REGIONAL MIX1 % OF TOTAL PORTFOLIO—BASED ON ESTIMATED AGGREGATE VALUE CITY MIX1 % OF TOTAL PORTFOLIO—BASED ON ESTIMATED AGGREGATE VALUE East Midwest South West San Francisco Houston Chicago Seattle Atlanta San Diego Los Angeles Washington, DC New York Dallas Sacramento Miami Richmond East Bay Charlotte Minneapolis Rio de Janeiro Phoenix Kansas City San Antonio Orlando Memphis Denver ASSET CLASS MIX1 % OF TOTAL PORTFOLIO—BASED ON ESTIMATED AGGREGATE VALUE East MW South West International 8.6% 17.5% 30.7% 42.4% 0.8% Atlanta Charlotte Chicago Dallas Denver Houston Kansas City Los Angeles Miami Minneapolis New York Phoenix Richmond Sacramento San Francisco/East Bay Seattle Other 3.3% 10.3% 2.0% 4.6% 5.2% 4.2% 1.8% 8.1% 3.4% 2.1% 10.6% 10.1% 13.7% 2.6% 1.8% 5.5% 10.7% Portfolio Statistics 9 1 Data as of September 30, 2012 and based on Hines REIT’s pro rata ownership. Raleigh
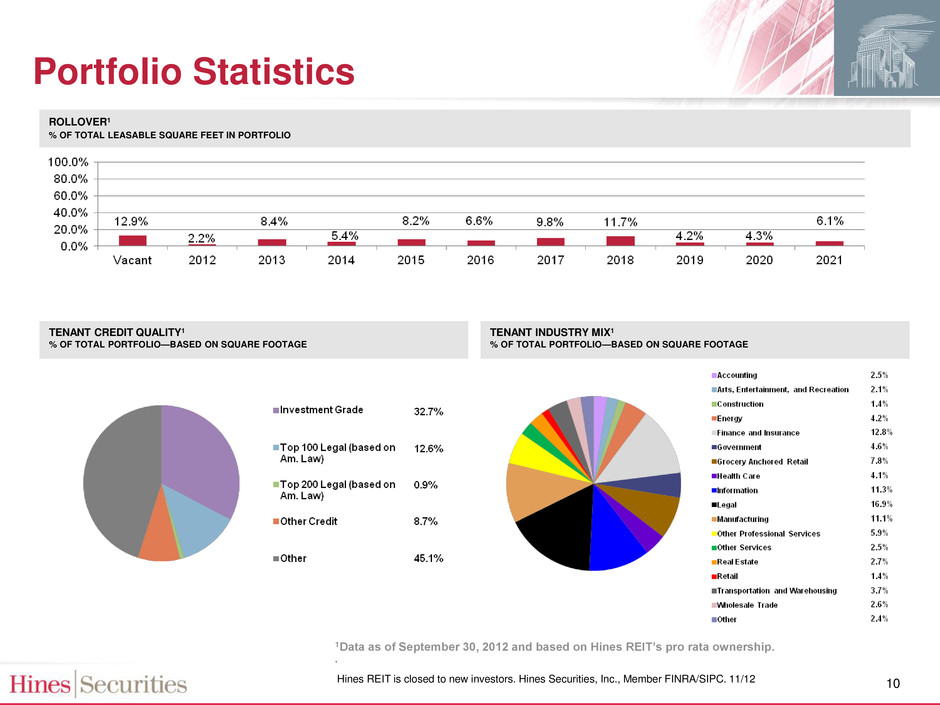
FOR BROKER/DEALER USE ONLY. This material may not be quoted, reproduced nor shown to members of the public, nor used as sales material for public use. Hines Securities, Inc., Member FINRA/SIPC. 8/12 Hines EIT is closed to new investors. Hines Securities, Inc., M mber FINRA/SIPC. 11/12 ROLLOVER1 % OF TOTAL LEASABLE SQUARE FEET IN PORTFOLIO TENANT CREDIT QUALITY1 % OF TOTAL PORTFOLIO—BASED ON SQUARE FOOTAGE TENANT INDUSTRY MIX1 % OF TOTAL PORTFOLIO—BASED ON SQUARE FOOTAGE 1Data as of September 30, 2012 and based on Hines REIT’s pro rata ownership. . Portfolio Statistics 10

FOR BROKER/DEALER USE ONLY. This material may not be quoted, reproduced nor shown to members of the public, nor used as sales material for public use. Hines Securities, Inc., Member FINRA/SIPC. 8/12 Hines EIT is closed to new investors. Hines Securities, Inc., M mber FINRA/SIPC. 11/12 Debt Maturities as of September 30, 2012 11 $159,500 $456,000 $0 $18,462 $281,154 $335,000 $0 $0 $0 $68,046 $0 $100,000 $200,000 $300,000 $400,000 $500,000 $600,000 $700,000 $800,000 $900,000 $1,000,000 2012 2013 2014 2015 2016 2017 2018 2019 2020 2021 Ba la nc e a t M a tu rit y (0 0 0 s ) Portfolio Average Weighted Interest Rate: 5.64% % Maturing 12% 35% 0% 1% 21% 25% 0% 0% 0% 5% # Loans 1 5 0 2 6 7 0 0 0 1
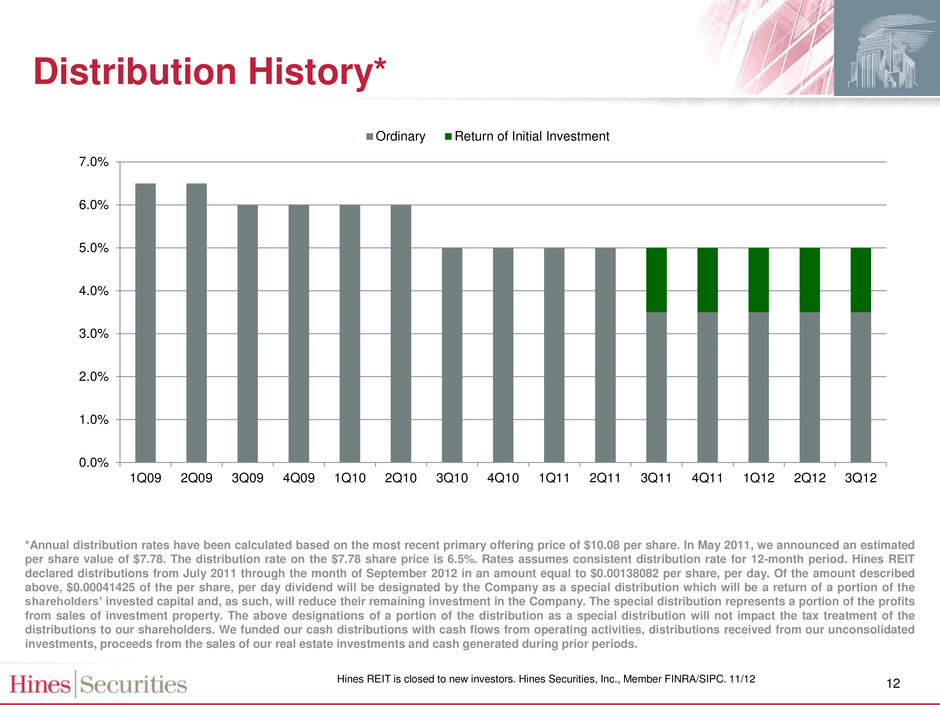
FOR BROKER/DEALER USE ONLY. This material may not be quoted, reproduced nor shown to members of the public, nor used as sales material for public use. Hines Securities, Inc., Member FINRA/SIPC. 8/12 Hines EIT is closed to new investors. Hines Securities, Inc., M mber FINRA/SIPC. 11/12 Distribution History* 12 *Annual distribution rates have been calculated based on the most recent primary offering price of $10.08 per share. In May 2011, we announced an estimated per share value of $7.78. The distribution rate on the $7.78 share price is 6.5%. Rates assumes consistent distribution rate for 12-month period. Hines REIT declared distributions from July 2011 through the month of September 2012 in an amount equal to $0.00138082 per share, per day. Of the amount described above, $0.00041425 of the per share, per day dividend will be designated by the Company as a special distribution which will be a return of a portion of the shareholders’ invested capital and, as such, will reduce their remaining investment in the Company. The special distribution represents a portion of the profits from sales of investment property. The above designations of a portion of the distribution as a special distribution will not impact the tax treatment of the distributions to our shareholders. We funded our cash distributions with cash flows from operating activities, distributions received from our unconsolidated investments, proceeds from the sales of our real estate investments and cash generated during prior periods. 0.0% 1.0% 2.0% 3.0% 4.0% 5.0% 6.0% 7.0% 1Q09 2Q09 3Q09 4Q09 1Q10 2Q10 3Q10 4Q10 1Q11 2Q11 3Q11 4Q11 1Q12 2Q12 3Q12 Ordinary Return of Initial Investment

FOR BROKER/DEALER USE ONLY. This material may not be quoted, reproduced nor shown to members of the public, nor used as sales material for public use. Hines Securities, Inc., Member FINRA/SIPC. 8/12 Hines EIT is closed to new investors. Hines Securities, Inc., M mber FINRA/SIPC. 11/12 Share Valuation Methodology 13 WeiserMazars, LLP, an independent third party real estate advisory and consulting services firm, reviewed the real estate portfolio values as of September 30, 2012 – Review was performed in accordance with Uniform Standards of Professional Appraisal Practice – Reported the basic assumptions and the individual market value estimates of our real estate investments to be fair and reasonable Jones Lang LaSalle, an independent third party real estate advisory and consulting services firm, provided values of the Company's debt obligations as of September 30, 2012 Cash and other assets and liabilities were valued at current carrying value NAV determined by netting all assets and liabilities and dividing by shares outstanding
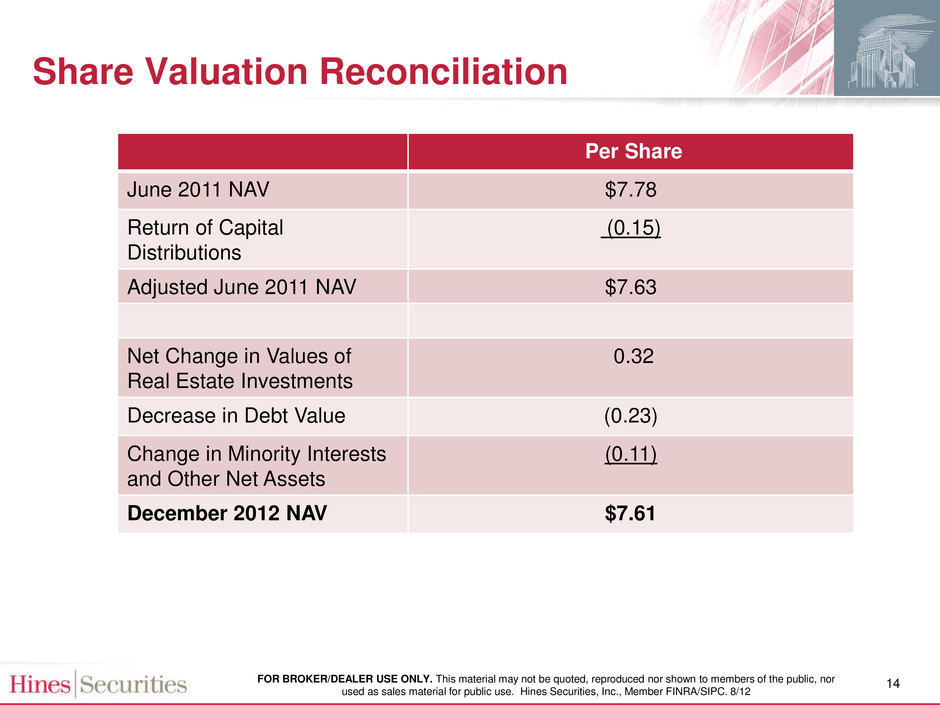
FOR BROKER/DEALER USE ONLY. This material may not be quoted, reproduced nor shown to members of the public, nor used as sales material for public use. Hines Securities, Inc., Member FINRA/SIPC. 8/12 Share Valuation Reconciliation Per Share June 2011 NAV $7.78 Return of Capital Distributions (0.15) Adjusted June 2011 NAV $7.63 Net Change in Values of Real Estate Investments 0.32 Decrease in Debt Value (0.23) Change in Minority Interests and Other Net Assets (0.11) December 2012 NAV $7.61 14
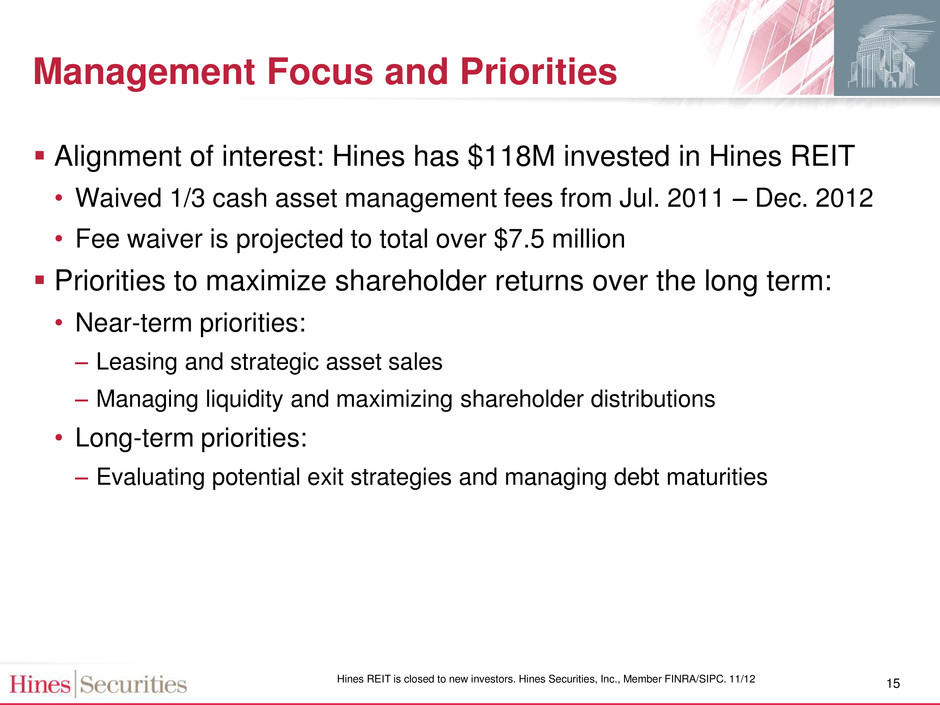
FOR BROKER/DEALER USE ONLY. This material may not be quoted, reproduced nor shown to members of the public, nor used as sales material for public use. Hines Securities, Inc., Member FINRA/SIPC. 8/12 Hines EIT is closed to new investors. Hines Securities, Inc., M mber FINRA/SIPC. 11/12 Management Focus and Priorities 15 Alignment of interest: Hines has $118M invested in Hines REIT • Waived 1/3 cash asset management fees from Jul. 2011 – Dec. 2012 • Fee waiver is projected to total over $7.5 million Priorities to maximize shareholder returns over the long term: • Near-term priorities: – Leasing and strategic asset sales – Managing liquidity and maximizing shareholder distributions • Long-term priorities: – Evaluating potential exit strategies and managing debt maturities

FOR BROKER/DEALER USE ONLY. This material may not be quoted, reproduced nor shown to members of the public, nor used as sales material for public use. Hines Securities, Inc., Member FINRA/SIPC. 8/12 THANK YOU 16 FOR BROKER/DEALER USE ONLY. This material may not be quoted, reproduced nor show to members of the public, nor used as sale mate ial for public use. Hines Securities, Inc., Member FINRA/SIPC. 11/12
