Attached files
| file | filename |
|---|---|
| 8-K - 8-K - CLECO POWER LLC | clecocorp8k_120412.htm |
| EX-99.1 - EXHIBIT 99.1 - CLECO POWER LLC | exhibit991_120412.htm |
2012 Wells Fargo Securities 11th Annual Pipeline, MLP and Energy Symposium December 4 – 5, 2012 Bruce A. Williamson President & CEO EXHIBIT 99.2

Forward-Looking Statements 2 This presentation contains forward-looking statements about future results and circumstances, including, without limitation, statements regarding future earnings, capital expenditures, project completion dates, future dividends and total shareholder return, with respect to which there are many risks and uncertainties. Although the company believes that expectations reflected in such forward-looking statements are based on reasonable assumptions, we can give no assurances that these expectations will prove to be correct or that other benefits anticipated in the forward-looking statements will be achieved. For a discussion of risk factors and other factors that may cause the company’s actual results to differ materially from those contemplated in its forward-looking statements, please refer to the company’s filings with the Securities and Exchange Commission, including its 2011 Annual Report on Form 10-K and Quarterly Reports on Form 10-Q.

Corporate Structure 3 Retail Formula Rate Plan • Effective 2010 –2014 • Target ROE of 10.7%; 51% Equity • Up to 11.3% ROE before customer sharing • 11.7% maximum for retail • Riders allow for inclusion of identified projects into rate base • 2012 EPS Guidance: $2.40 - $2.46A • Assets: $4.1 billion as of 9/30/12 • LT Debt: $1.3 billion as of 9/30/12 • Credit Rating: BBB- B/Baa3 • 2011 Peak Demand: 2,355 MW • Owned Generation: 2,524 MWC • Retail Customers: 281,000 • Wholesale end-use customers: 98,000 • Credit Rating: BBBB/Baa2 • Owned Generation: 775 MWC • PPA to Cleco Power until 04/2015 • Winner of Cleco Power 2012 RFP C Nameplate capacity B S&P gives positive outlook A Revised operational earnings guidance as of 10/30/12. B S&P gives positive outlook C Nameplate capacity Regulated Generation Wholesale Generation Retail Service Territory DEMCO Service Territory Shreveport Monroe Pineville Lake Charles Baton Rouge New Orleans
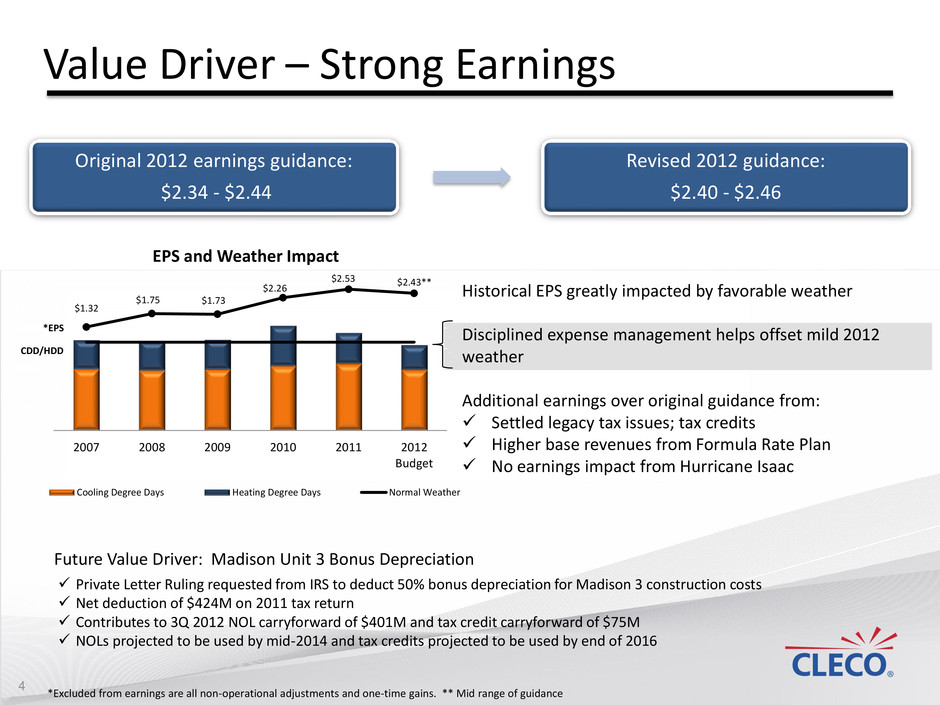
Value Driver – Strong Earnings Original 2012 earnings guidance: $2.34 - $2.44 Revised 2012 guidance: $2.40 - $2.46 *Excluded from earnings are all non-operational adjustments and one-time gains. ** Mid range of guidance Private Letter Ruling requested from IRS to deduct 50% bonus depreciation for Madison 3 construction costs Net deduction of $424M on 2011 tax return Contributes to 3Q 2012 NOL carryforward of $401M and tax credit carryforward of $75M NOLs projected to be used by mid-2014 and tax credits projected to be used by end of 2016 Future Value Driver: Madison Unit 3 Bonus Depreciation 4 $1.32 $1.75 $1.73 $2.26 $2.53 $2.43** $(2.00) $(1.50) $(1.00) $(0.50) $- $0.5 0 $1.0 0 $1.5 0 $2.0 0 $2.5 0 0 1000 2000 3000 4000 5000 6000 7000 2007 2008 2009 2010 2011 2012 Budget EPS and Weather Impact Cooling Degree Days Heating Degree Days Normal Weather *EPS CDD/HDD Historical EPS greatly impacted by favorable weather Disciplined expense management helps offset mild 2012 weather Additional earnings over original guidance from: Settled legacy tax issues; tax credits Higher base revenues from Formula Rate Plan No earnings impact from Hurricane Isaac

Earnings Guidance 2012 Original $2.34 - $2.44 2013 $2.45 - $2.55 5 2012 2013 Original Earnings Guidance Assumption Normal weather No to minimal earnings contribution from Midstream No impact included for Cleco Power intermediate-term RFP; results were made public Jan 23, 2012 Excludes adjustments related to life insurance policies ~28% ~32% Effective tax rate* Initial guidance for 2013 is 4.6% higher than initial guidance for 2012 *Estimated annual effective tax rate
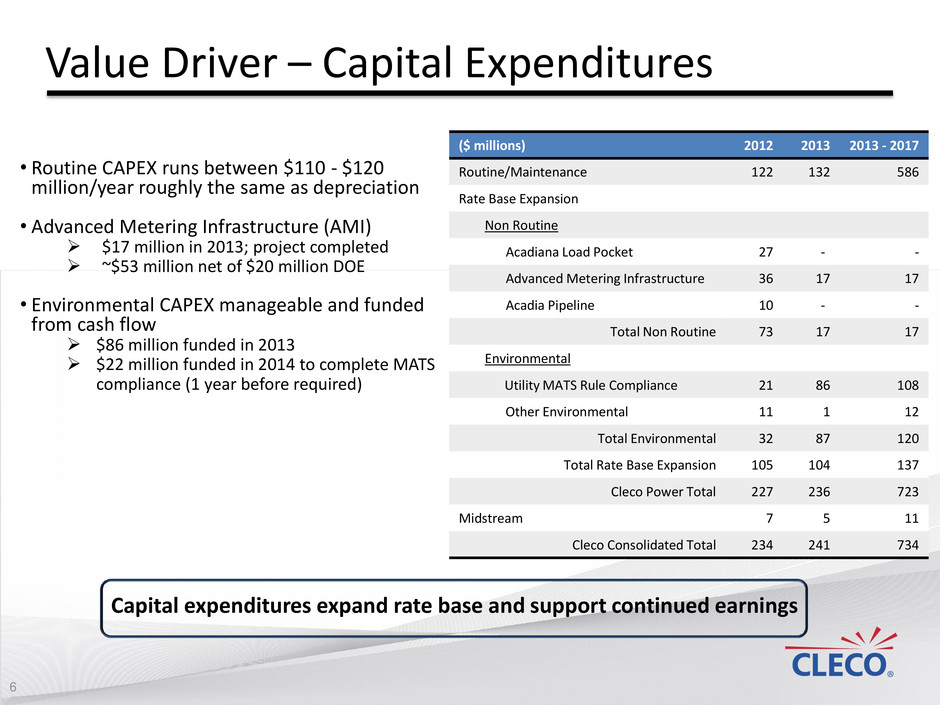
6 Value Driver – Capital Expenditures ($ millions) 2012 2013 2013 - 2017 Routine/Maintenance 122 132 586 Rate Base Expansion Non Routine Acadiana Load Pocket 27 - - Advanced Metering Infrastructure 36 17 17 Acadia Pipeline 10 - - Total Non Routine 73 17 17 Environmental Utility MATS Rule Compliance 21 86 108 Other Environmental 11 1 12 Total Environmental 32 87 120 Total Rate Base Expansion 105 104 137 Cleco Power Total 227 236 723 Midstream 7 5 11 Cleco Consolidated Total 234 241 734 • Routine CAPEX runs between $110 - $120 million/year roughly the same as depreciation • Advanced Metering Infrastructure (AMI) $17 million in 2013; project completed ~$53 million net of $20 million DOE • Environmental CAPEX manageable and funded from cash flow $86 million funded in 2013 $22 million funded in 2014 to complete MATS compliance (1 year before required) Capital expenditures expand rate base and support continued earnings

7 Value Driver – Rate Base Growth • Before 2010, rate base was $1.1 billion ⁻ Madison Unit 3, efficient CFB solid fuel unit - $1 billion ⁻ Acadia Unit 1, CCGT $304 million ⁻ Acadiana Load Pocket, transmission upgrade - $125 million ⁻ Environmental upgrades, solid fuel plants - $120 million ⁻ Advanced Metering Infrastructure, meter upgrade - $53 million • Retired $200 million of debt in 2011 • Strong liquidity position of $618 million at September 30, 2012 ⁻ Available credit facilities of $550 million ⁻ Cash on balance sheet • Free Cash Flow1 - With the completion of MATS, Cleco expected to generate $70 million to $100 million annually after payment of capital expenditures and dividends R at e B as e G ro wt h Rate Base $1.1B Madison Unit 3 $1.0B Acadia Unit 1 $304M ALP $125M AMI $53M Environmental $120M ~$2.6M Cleco provides a platform for creating value today and low-risk growth in the future 1 Free Cash Flow defined as Operating Cash Flow less Routine/Maintenance CAPEX less Dividends
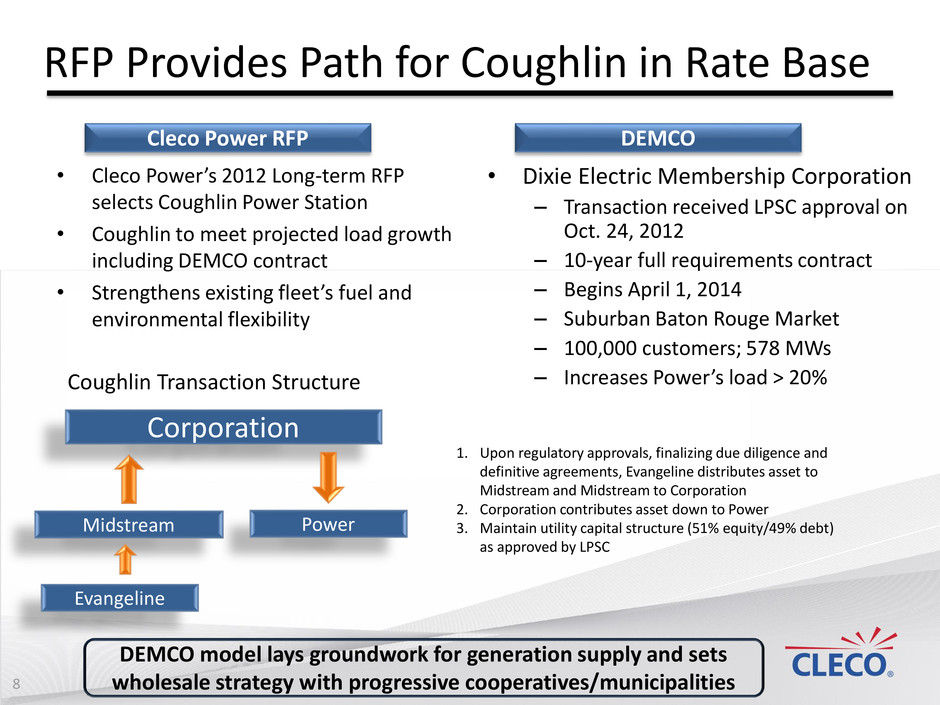
RFP Provides Path for Coughlin in Rate Base • Cleco Power’s 2012 Long-term RFP selects Coughlin Power Station • Coughlin to meet projected load growth including DEMCO contract • Strengthens existing fleet’s fuel and environmental flexibility • Dixie Electric Membership Corporation – Transaction received LPSC approval on Oct. 24, 2012 – 10-year full requirements contract – Begins April 1, 2014 – Suburban Baton Rouge Market – 100,000 customers; 578 MWs – Increases Power’s load > 20% Corporation Midstream Power DEMCO Cleco Power RFP DEMCO model lays groundwork for generation supply and sets wholesale strategy with progressive cooperatives/municipalities 8 Coughlin Transaction Structure 1. Upon regulatory approvals, finalizing due diligence and definitive agreements, Evangeline distributes asset to Midstream and Midstream to Corporation 2. Corporation contributes asset down to Power 3. Maintain utility capital structure (51% equity/49% debt) as approved by LPSC Evangeline
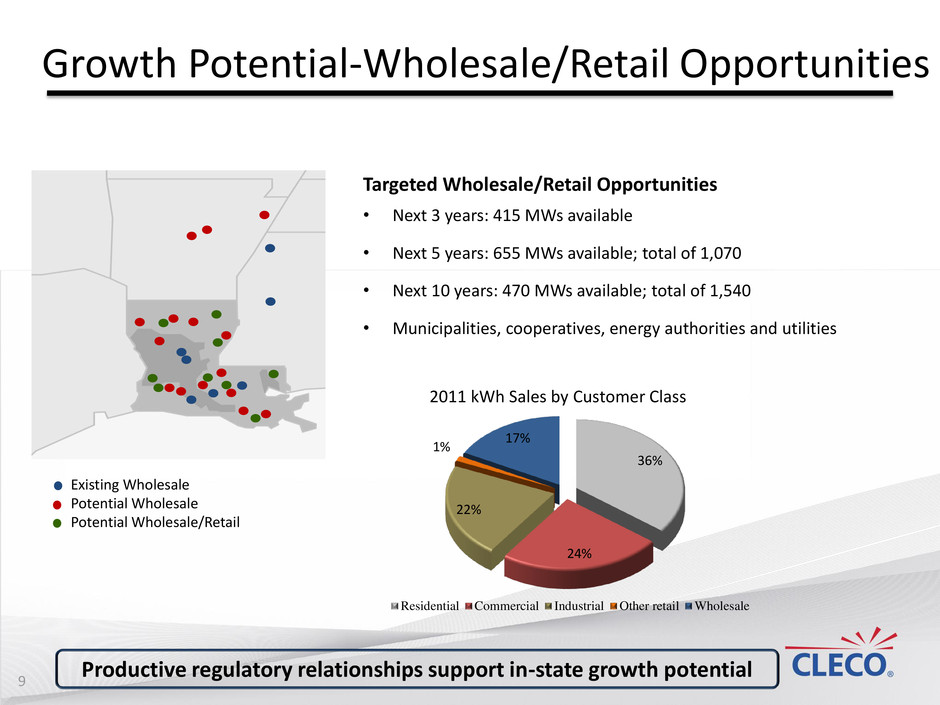
Existing Wholesale Potential Wholesale Potential Wholesale/Retail Targeted Wholesale/Retail Opportunities • Next 3 years: 415 MWs available • Next 5 years: 655 MWs available; total of 1,070 • Next 10 years: 470 MWs available; total of 1,540 • Municipalities, cooperatives, energy authorities and utilities Growth Potential-Wholesale/Retail Opportunities Productive regulatory relationships support in-state growth potential 9 36% 24% 22% 1% 17% Residential Commercial Industrial Other retail Wholesale 2011 kWh Sales by Customer Class
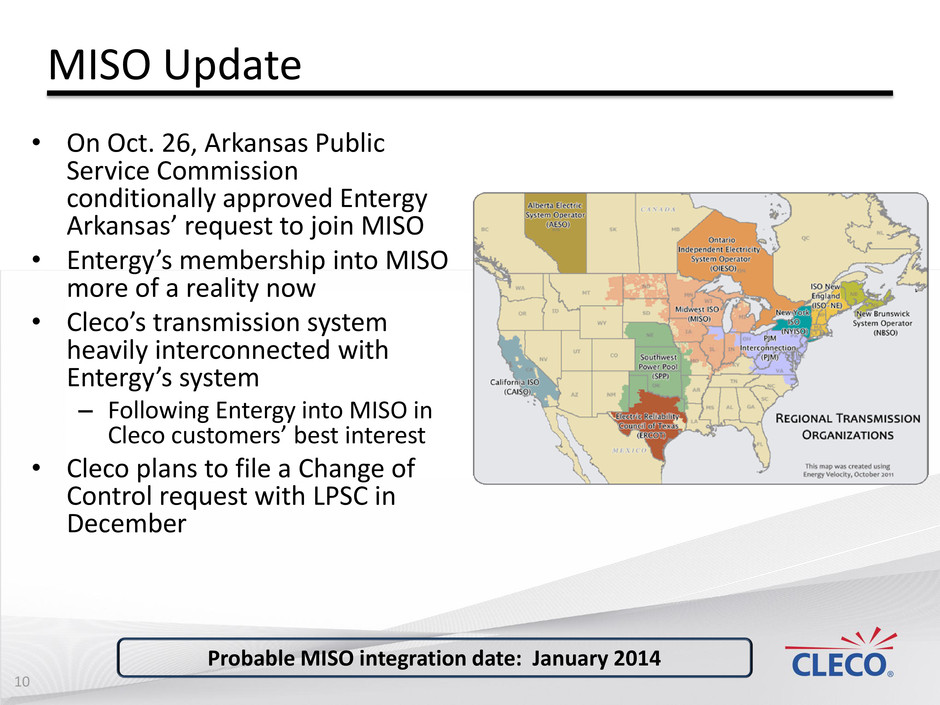
MISO Update • On Oct. 26, Arkansas Public Service Commission conditionally approved Entergy Arkansas’ request to join MISO • Entergy’s membership into MISO more of a reality now • Cleco’s transmission system heavily interconnected with Entergy’s system – Following Entergy into MISO in Cleco customers’ best interest • Cleco plans to file a Change of Control request with LPSC in December 10 Probable MISO integration date: January 2014
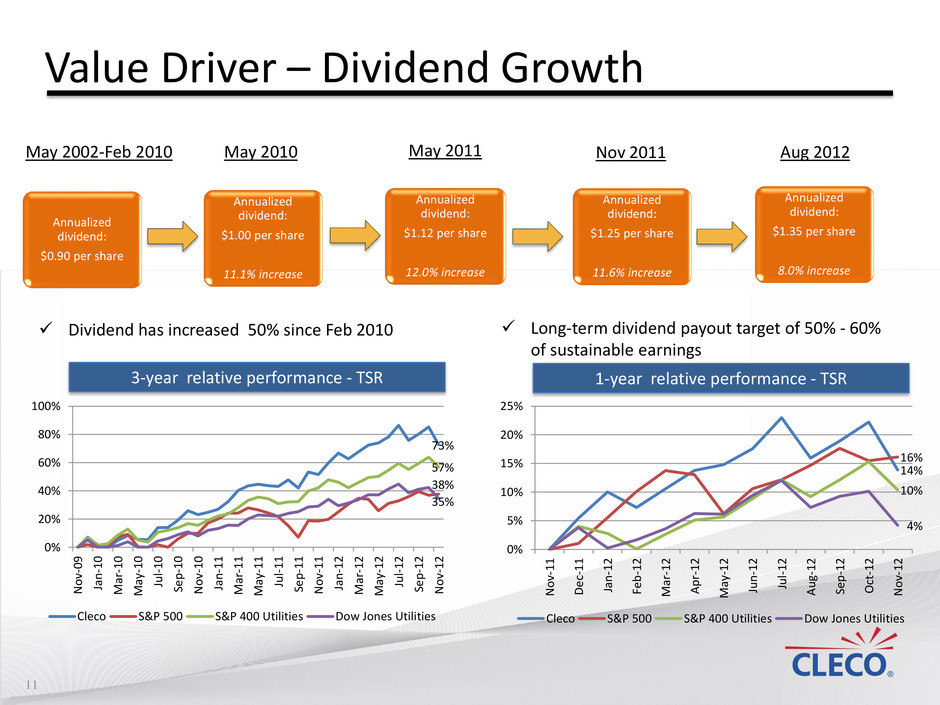
11 Value Driver – Dividend Growth Annualized dividend: $1.12 per share 12.0% increase May 2010 May 2011 Nov 2011 Aug 2012 3-year relative performance - TSR 1-year relative performance - TSR Annualized dividend: $1.25 per share 11.6% increase Annualized dividend: $1.35 per share 8.0% increase Annualized dividend: $1.00 per share 11.1% increase Annualized dividend: $0.90 per share May 2002-Feb 2010 Dividend has increased 50% since Feb 2010 Long-term dividend payout target of 50% - 60% of sustainable earnings 73% 38% 57% 35% 0% 20% 40% 60% 80% 100% N o v- 0 9 Ja n -1 0 M ar -1 0 M ay -1 0 Ju l- 1 0 Se p -1 0 N o v- 1 0 Ja n -1 1 M ar -1 1 M ay -1 1 Ju l- 1 1 Se p -1 1 N o v- 1 1 Ja n -1 2 M ar -1 2 M ay -1 2 Ju l- 1 2 Se p -1 2 N o v- 1 2 Cleco S&P 500 S&P 400 Utilities Dow Jones Utilities 14% 16% 10% 4% 0% 5% 10% 15% 20% 25% N o v- 1 1 D e c- 1 1 Ja n -1 2 Fe b -1 2 M ar -1 2 A p r- 1 2 M ay -1 2 Ju n -1 2 Ju l- 1 2 A u g- 1 2 Se p -1 2 Oct -1 2 N o v- 1 2 Cleco S&P 500 S&P 400 Utilities Dow Jones Utilities
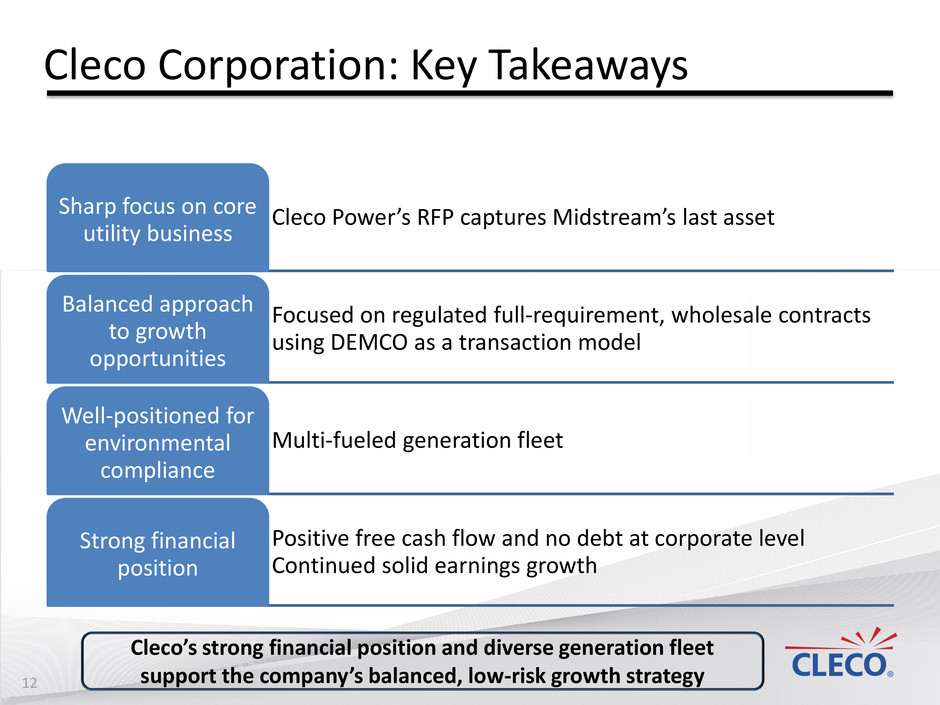
Cleco Corporation: Key Takeaways 12 Cleco Power’s RFP captures Midstream’s last asset Sharp focus on core utility business Focused on regulated full-requirement, wholesale contracts using DEMCO as a transaction model Balanced approach to growth opportunities Multi-fueled generation fleet Well-positioned for environmental compliance Positive free cash flow and no debt at corporate level Continued solid earnings growth Strong financial position Cleco’s strong financial position and diverse generation fleet support the company’s balanced, low-risk growth strategy

Appendix
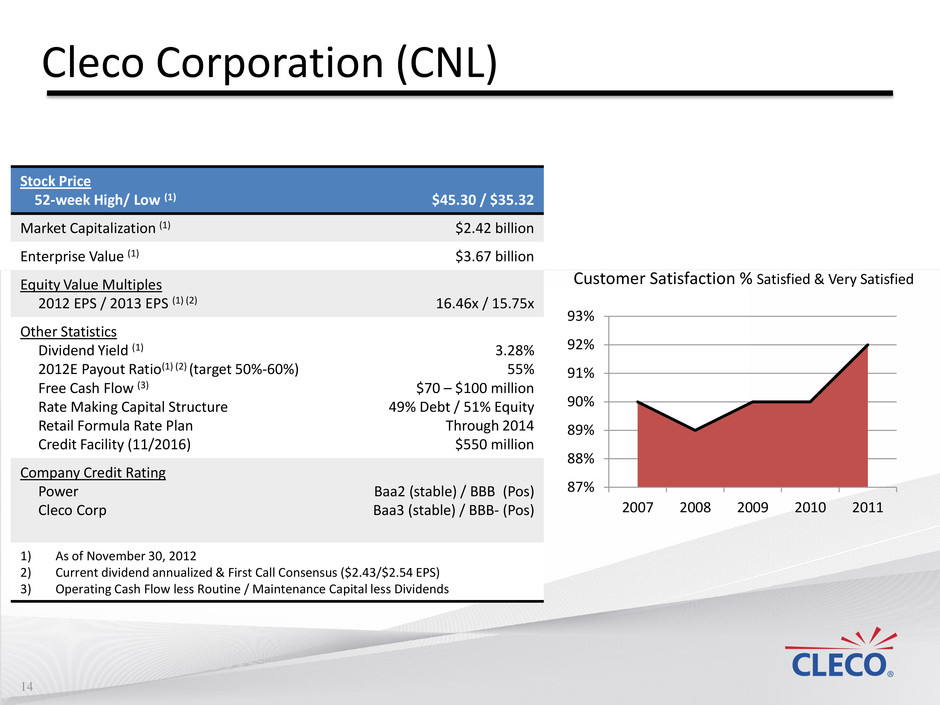
14 Cleco Corporation (CNL) 87% 88% 89% 90% 91% 92% 93% 2007 2008 2009 2010 2011 Customer Satisfaction % Satisfied & Very Satisfied Stock Price 52-week High/ Low (1) $45.30 / $35.32 Market Capitalization (1) $2.42 billion Enterprise Value (1) $3.67 billion Equity Value Multiples 2012 EPS / 2013 EPS (1) (2) 16.46x / 15.75x Other Statistics Dividend Yield (1) 2012E Payout Ratio(1) (2) (target 50%-60%) Free Cash Flow (3) Rate Making Capital Structure Retail Formula Rate Plan Credit Facility (11/2016) 3.28% 55% $70 – $100 million 49% Debt / 51% Equity Through 2014 $550 million Company Credit Rating Power Cleco Corp Baa2 (stable) / BBB (Pos) Baa3 (stable) / BBB- (Pos) 1) As of November 30, 2012 2) Current dividend annualized & First Call Consensus ($2.43/$2.54 EPS) 3) Operating Cash Flow less Routine / Maintenance Capital less Dividends
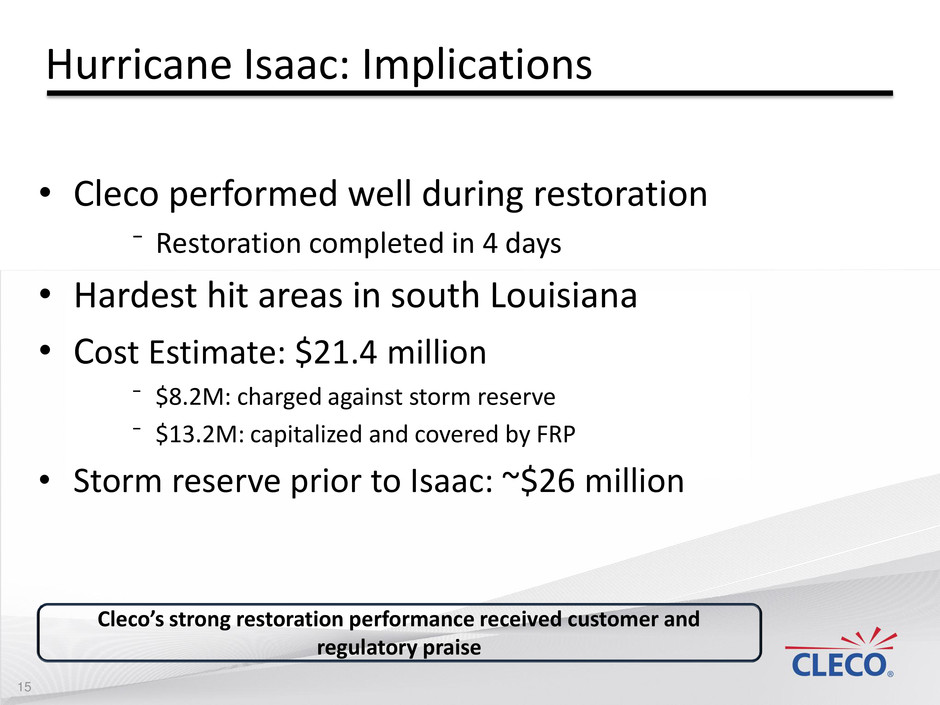
Hurricane Isaac: Implications • Cleco performed well during restoration ⁻ Restoration completed in 4 days • Hardest hit areas in south Louisiana • Cost Estimate: $21.4 million ⁻ $8.2M: charged against storm reserve ⁻ $13.2M: capitalized and covered by FRP • Storm reserve prior to Isaac: ~$26 million Cleco’s strong restoration performance received customer and regulatory praise 15
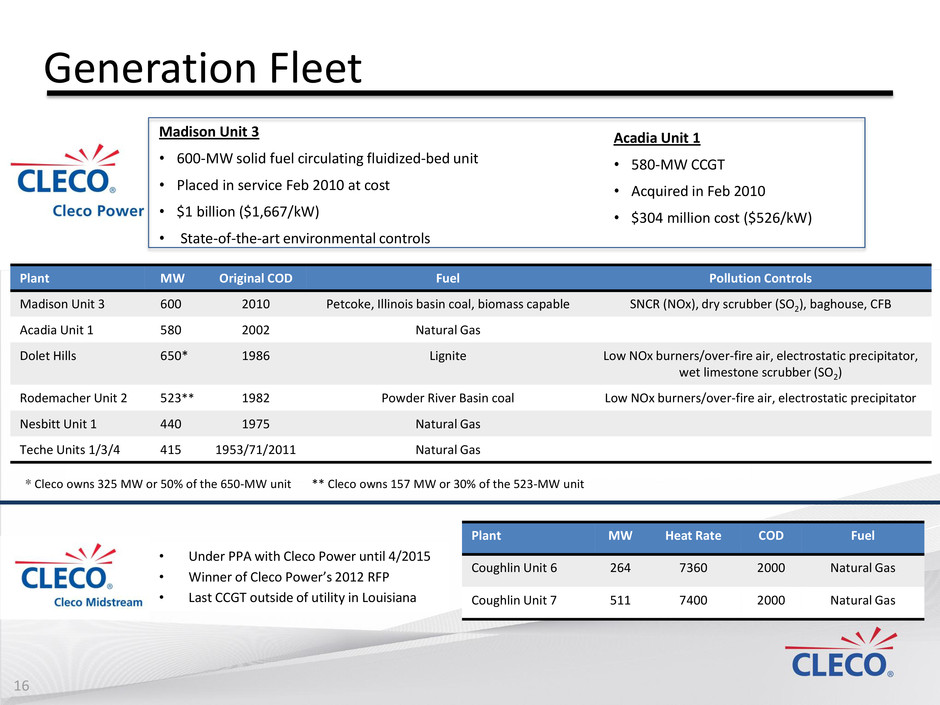
Plant MW Heat Rate COD Fuel Coughlin Unit 6 264 7360 2000 Natural Gas Coughlin Unit 7 511 7400 2000 Natural Gas Generation Fleet Plant MW Original COD Fuel Pollution Controls Madison Unit 3 600 2010 Petcoke, Illinois basin coal, biomass capable SNCR (NOx), dry scrubber (SO2), baghouse, CFB Acadia Unit 1 580 2002 Natural Gas Dolet Hills 650* 1986 Lignite Low NOx burners/over-fire air, electrostatic precipitator, wet limestone scrubber (SO2) Rodemacher Unit 2 523** 1982 Powder River Basin coal Low NOx burners/over-fire air, electrostatic precipitator Nesbitt Unit 1 440 1975 Natural Gas Teche Units 1/3/4 415 1953/71/2011 Natural Gas * Cleco owns 325 MW or 50% of the 650-MW unit ** Cleco owns 157 MW or 30% of the 523-MW unit Madison Unit 3 • 600-MW solid fuel circulating fluidized-bed unit • Placed in service Feb 2010 at cost • $1 billion ($1,667/kW) • State-of-the-art environmental controls Acadia Unit 1 • 580-MW CCGT • Acquired in Feb 2010 • $304 million cost ($526/kW) 16 • Under PPA with Cleco Power until 4/2015 • Winner of Cleco Power’s 2012 RFP • Last CCGT outside of utility in Louisiana

Cleco Corporation Credit Facility $250M Cleco Power Credit Facility $300M Cash and Equivalents $68.4M • Expires 10/2016 • Facility Fee = 0.25% • LIBOR + 1.5% • As of 09/30/2012 • Expires 10/2016 • Facility Fee = 0.225% • LIBOR + 1.275% • As of 09/30/2012 Debt and Liquidity Strong liquidity and manageable debt maturity profile $- $50 $100 $150 $200 $250 $300 $350 20 13 20 14 20 15 20 16 20 17 20 18 20 19 20 20 20 21 20 22 20 23 20 24 20 25 20 26 20 27 20 28 20 29 20 30 20 31 20 32 20 33 20 34 20 35 20 36 20 37 20 38 20 39 20 40 20 41 Taxable Tax-Exempt Liquidity Bond Maturities $1.3 billion outstanding (09/30/2012) 17
