Attached files
| file | filename |
|---|---|
| 8-K - FORM 8-K - NEW JERSEY RESOURCES CORP | d446119d8k.htm |
| EX-99.1 - EXHIBIT 99.1 - NEW JERSEY RESOURCES CORP | d446119dex991.htm |
 New Jersey
Resources 4
th
Quarter Fiscal 2012 Update
November 29,2012
Exhibit 99.2 |
 Regarding
Forward-Looking Statements Certain statements contained in this presentation are
forward-looking statements within the meaning of the Private Securities Litigation Reform Act of 1995. Forward-
looking
statements
can
also
be
identified
by
the
use
of
forward-looking
terminology
such
as
“may,”
"will",
“intend,”
“expect,”
"believe,"
or
“continue”
or
comparable
terminology and are made based upon management’s current expectations and beliefs as of
this date concerning future developments and their potential effect upon New
Jersey
Resources
(NJR
or
the
Company).
There
can
be
no
assurance
that
future
developments
will
be
in
accordance
with
management’s
expectations
or
that
the
effect
of
future developments on the Company will be those anticipated by management. NJR cautions
persons reading or hearing this presentation that the assumptions that form the
basis
for
forward-looking
statements
regarding
expected
contribution
by
new
customers
of
New
Jersey
Natural
Gas
Company
(NJNG)
to
utility
gross
margin,
expected
number of new customers of NJNG, the completion of NJRCEV's planned solar projects in fiscal
2013, estimated capital expenditures in fiscal 2013, by NJNG and NJRCEV, and
the
potential
impact
of
post-tropical
cyclone
Sandy,
(commonly
referred
to
as
“Hurricane”
or
“Superstorm”
Sandy)
The
factors
that
could
cause
actual
results
to
differ
materially
from
NJR’s
expectations
include,
but
are
not
limited
to,
weather
and
economic
conditions;
demographic
changes
in
the
NJNG
service
territory
and
their
effect
on
NJNG's
customer
growth;
volatility
of
natural
gas
and
other
commodity
prices
and
their
impact
on
NJNG
customer
usage, NJNG's Basic Gas Supply Service incentive programs, NJRES' operations and on the
Company's risk management efforts; changes in rating agency requirements and/or credit
ratings and their effect on availability and cost of capital to the Company; the impact of volatility in the credit markets; the ability to comply with debt
covenants;
the
impact
to
the
asset
values
and
resulting
higher
costs
and
funding
obligations
of
NJR's
pension
and
postemployment
benefit
plans
as
a
result
of
downturns
in
the financial markets, a lower discount rate, and impacts associated with the Patient
Protection and Affordable Care Act; accounting effects and other risks associated with
hedging activities and use of derivatives contracts; commercial and wholesale credit risks,
including the availability of creditworthy customers and counterparties and
liquidity
in
the
wholesale
energy
trading
market;
the
ability
to
obtain
governmental
approvals
and/or
financing
for
the
construction,
development
and
operation
of
certain
non-regulated energy investments; risks associated with the management of the Company's
joint ventures and partnerships; risks associated with our investments in renewable
energy projects and our investment in an on-shore wind developer, including the availability of regulatory and tax incentives, logistical risks and potential delays
related
to
construction,
permitting,
regulatory
approvals
and
electric
grid
interconnection,
the
availability
of
viable
projects
and
NJR's
eligibility
for
federal
investment
tax
credits
(ITC),
the
future
market
for
Solar
Renewable
Energy
Certificates,
the
potential
expiration
of
the
federal
Production
Tax
Credit
(PTC)
and
operational
risks
related
to
projects
in
service;
timing
of
qualifying
for
ITCs
due
to
delays
or
failures
to
complete
planned
solar
energy
projects
and
the
resulting
effect
on
our
effective
tax
rate
and
earnings;
the
level
and
rate
at
which
NJNG's
costs
and
expenses
are
incurred
and
the
extent
to
which
they
are
allowed
to
be
recovered
from
customers
through
the
regulatory process; access to adequate supplies of natural gas and dependence on
third-party storage and transportation facilities for natural gas supply; operating risks
incidental
to
handling,
storing,
transporting
and
providing
customers
with
natural
gas;
risks
related
to
our
employee
workforce,
including
a
work
stoppage;
the
regulatory
and pricing policies of federal and state regulatory agencies; the possible expiration of the
NJNG Conservation Incentive Program (CIP), the costs of compliance with the proposed
regulatory framework for over-the-counter derivatives; the costs of compliance with present and future environmental laws, including potential climate change-
related legislation; risks related to changes in accounting standards; the disallowance of
recovery of environmental-related expenditures and other regulatory changes;
environmental-related and other litigation and other uncertainties; and the impact of
natural disasters, terrorist activities, and other extreme events on our operations and
customers,
including
the
impacts
associated
with
Superstorm
Sandy.
The
aforementioned
factors
are
detailed
in
the
“Risk
Factors”
sections
of
our
Annual
Report
on
Form
10-K
filed
on
November
28,
2012,
as
filed
with
the
Securities
and
Exchange
Commission
(SEC)
and
which
is
available
on
the
SEC’s
website
at
sec.gov.
NJR
disclaims any obligation to update and revise statements contained in these materials
based on new information or otherwise. 2 |
 Disclaimer
Regarding Non-GAAP Financial Measures 3
This presentation includes the non-GAAP measures net financial earnings (losses), financial
margin and utility gross margin. As an indicator of
the
company’s
operating
performance,
these
measures
should
not
be
considered
an
alternative
to,
or
more
meaningful
than,
GAAP
measures such as cash flow, net income, operating income or earnings per share. Net financial
earnings (losses) and financial margin exclude unrealized gains or losses on derivative
instruments related to the company’s unregulated subsidiaries and certain realized gains and losses
on derivative instruments related to natural gas that has been placed into storage at NJRES.
Volatility associated with the change in value of these financial and physical commodity
contracts is reported in the income statement in the current period. In order to manage its business,
NJR views its results without the impacts of the unrealized gains and losses, and certain
realized gains and losses, caused by changes in value
of
these
financial
instruments
and
physical
commodity
contracts
prior
to
the
completion
of
the
planned
transaction
because
it
shows
changes in value currently as opposed to when the planned transaction ultimately is settled.
NJNG’s utility gross margin represents the results
of
revenues
less
natural
gas
costs,
sales
and
other
taxes
and
regulatory
rider
expenses,
which
are
key
components
of
the
company’s
operations that move in relation to each other.
Management uses net financial earnings (NFE), financial margin and utility gross margin as
supplemental measures to other GAAP results to provide a more complete understanding of
the company’s performance. Management believes these non-GAAP measures are more
reflective of the company’s business model, provide transparency to investors and
enable period-to-period comparability of financial performance.
For
a
full
discussion
of
our
non-GAAP
financial
measures,
please
see
Item
7
of
our
Annual
Report
on
Form
10-K
for
the
fiscal
year
ended
September
30,
2012,
filed
on
November
28,
2012. |
    Delivering
Results 4
($MM)
Company
2012
2011
Change
New Jersey Natural Gas
$73.2
$71.3
$1.9
NJR Clean Energy
19.5
6.8
12.7
NJR Energy Services
10.8
18.6
(7.8)
NJR Energy Holdings
6.7
6.8
(0.1)
NJR Home Services
2.5
2.4
0.1
Other
(0.3)
0.6
(0.9)
Total
$112.4
$106.5
$5.9
NFE per basic share
$2.71
$2.58
$.13
September 30, |
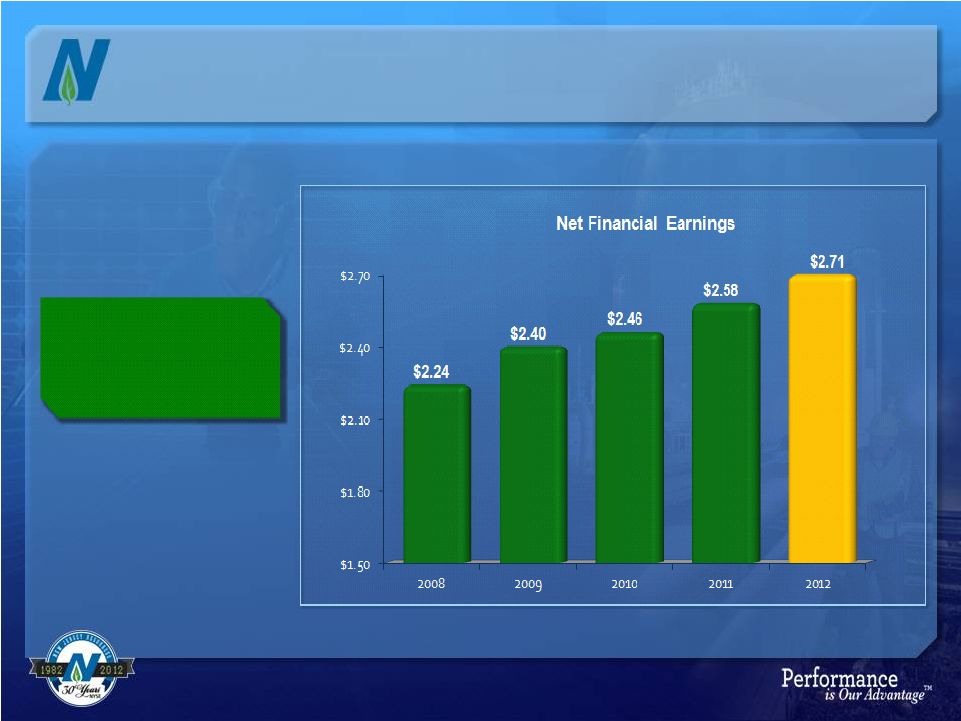 Consistent
Performance 5
Five year CAGR of
5.1 percent |
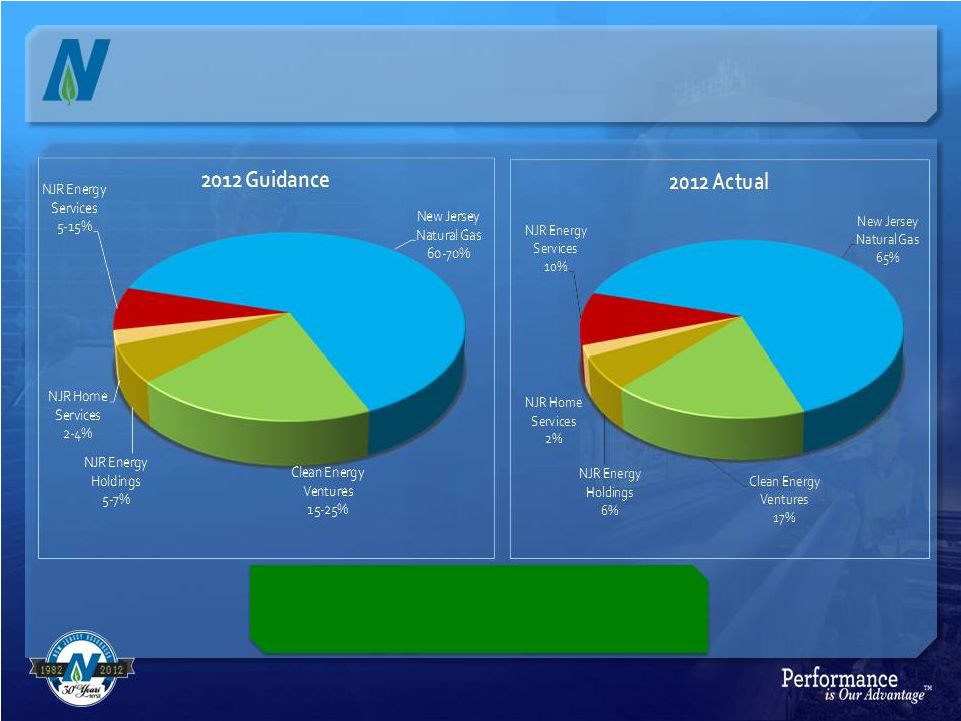 Fiscal 2012
Earnings: Comparison to Guidance 6
Infrastructure-based businesses contributed
90 percent of fiscal 2012 NFE |
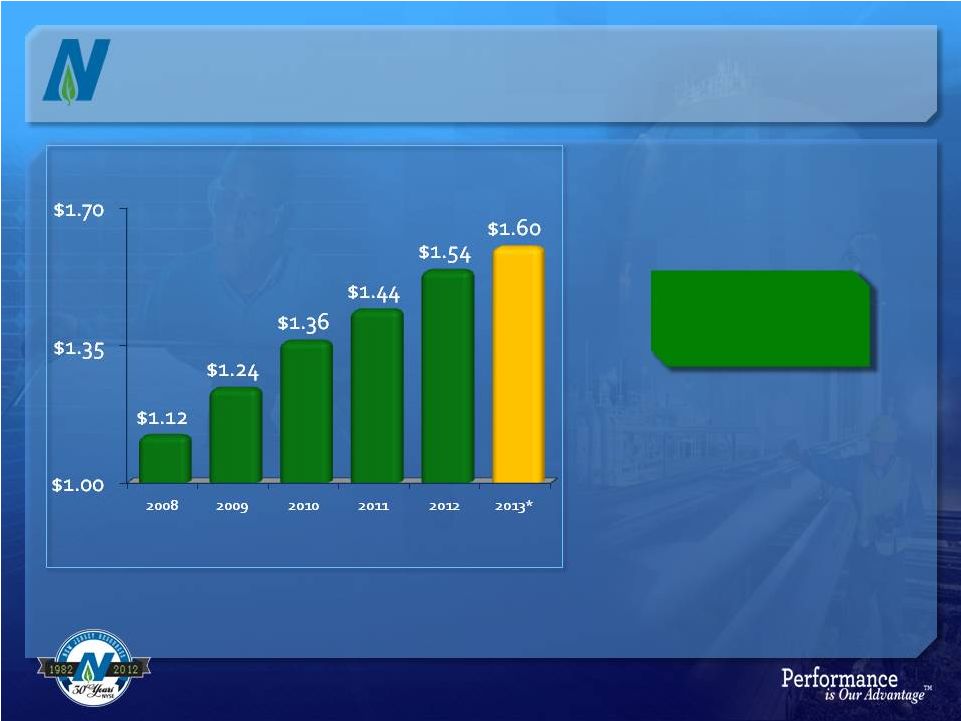 Dividend
Growth 19 dividend
increase in 17 years
* Current annual rate
7
th |
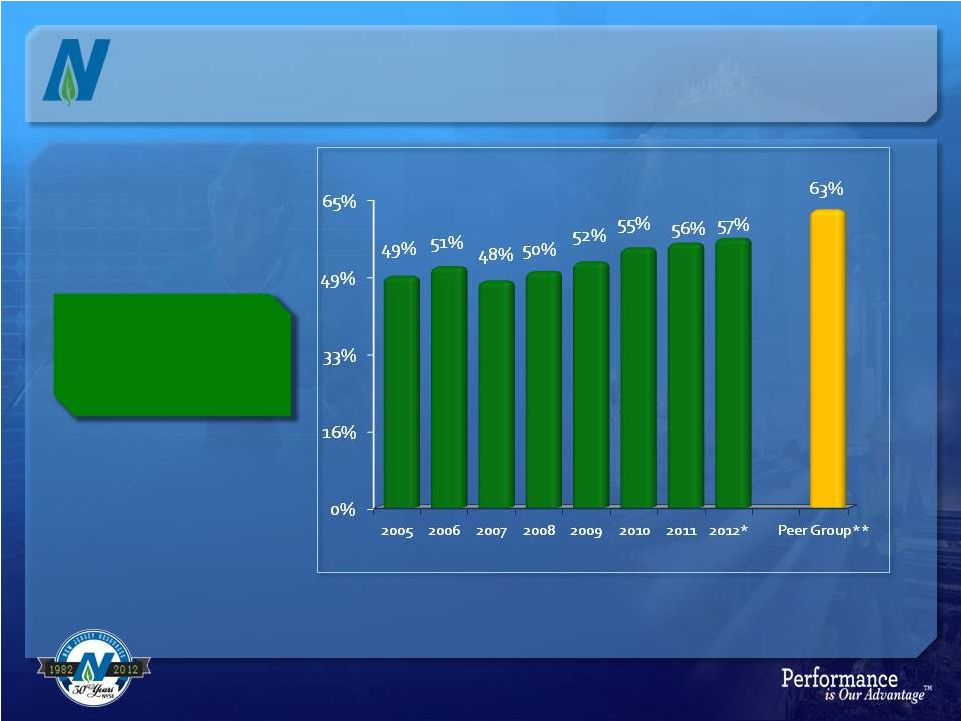 Payout
Ratio* Strong reinvestment to
support future NFE
growth
* Based on NJR Net Financial Earnings
** Peer group average based on 2012 earnings estimates and indicated
dividend from Bloomberg. Peer group: ATO, GAS, LG, NWN,
PNY, SJI, SWX, VVC and WGL 8 |
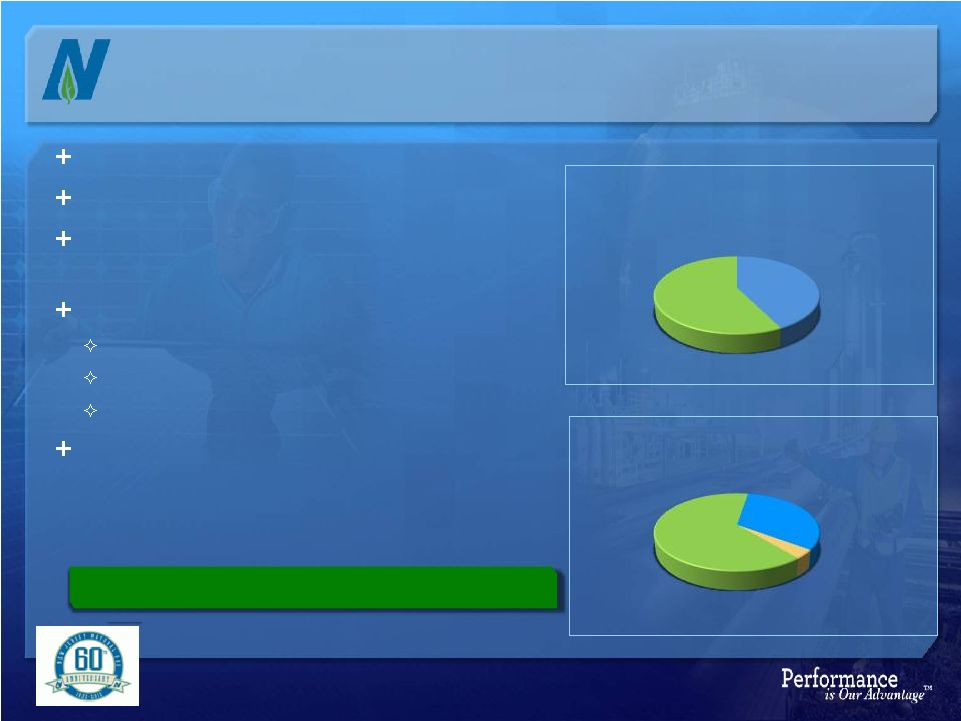 Strong Customer
Growth Strong demographics to support customer growth
9
6,704 new customers in fiscal 2012
539 existing customer heat conversions
Customer growth expected to add about $3.7
million of utility gross margin annually
Conversion breakdown:
65 percent oil
23 percent electric
12 percent propane
Estimate 12,000 to 14,000 new customers over the
next two years
New Customer
Breakdown
Gross Margin
Contribution
Conversions
57%
New
Construction
43%
Commercial
32%
Existing
4%
Residential
64% |
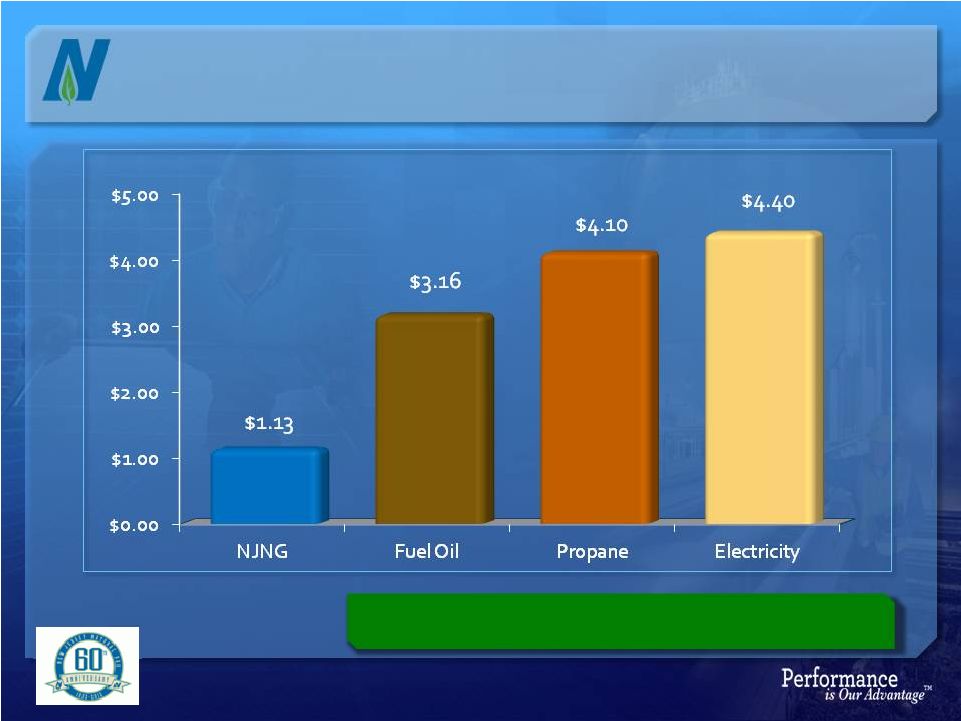 Value for
Customers Source: US Energy Information Administration
Data as of October 2012. Based on 100,000 comparable
BTUs
10
We have a strong price advantage in our service territory |
 Approved by
the BPU on October 23, 2012 Four-year program -
$130 million
Replace approximately 276 miles of unprotected steel and cast iron distribution
main
Cost recovery at a weighted average cost of capital of 6.9 percent
Common Equity component 9.75 percent with a 53.5 percent equity ratio
Should create approximately 1,325 jobs*
Infrastructure Investment Opportunities
NJNG will file a rate case no later than November 2015 for
recovery of revenue
11
* According to a study by the Rutgers Bloutstein School of Planning and
Public Policy Safety Acceleration and Facility Enhancement (SAFE) Program
|
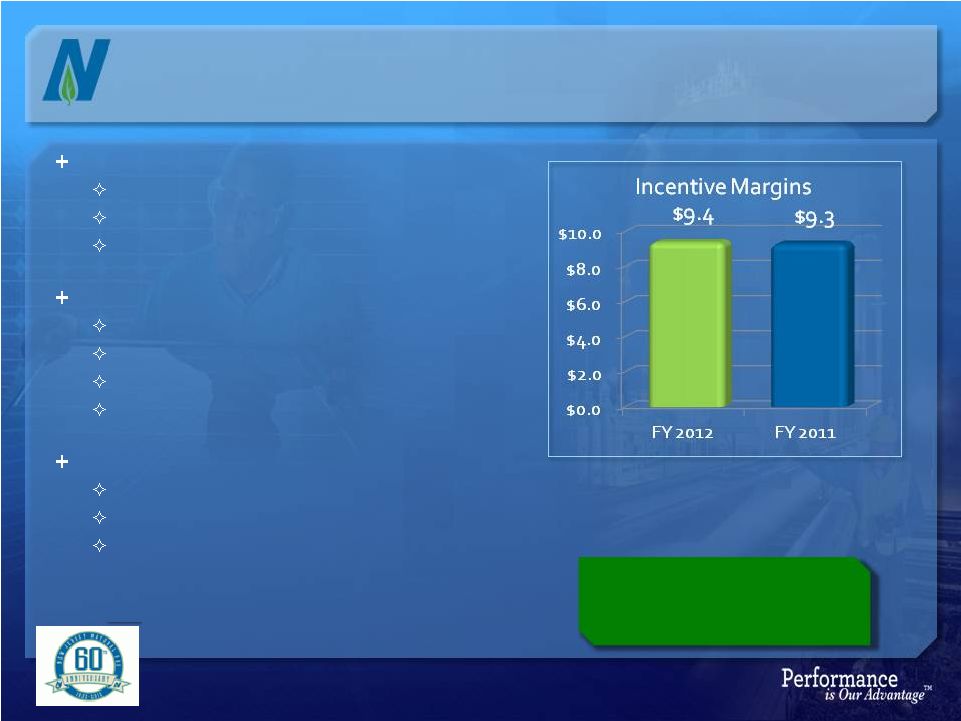 Off-system
sales and capacity release In place since 1992
Optimization of capacity and supply contracts
Sharing formula of 85 percent customer; 15 percent
NJNG
Storage Incentive (SI)
In place since 2004
Promotes long-term price stability
Promotes efficient contract utilization
Sharing formula of 80 percent customer; 20 percent
NJNG
Financial Risk Management (FRM)
In place since 1997
Promote application of risk management tools
Sharing formula of 85 percent customer; 15 percent
NJNG
Regulatory Incentives
Since inception customers have saved nearly $600
million with total earnings of $1.90 per share,
an average of $.09 annually
Incentive programs in place
through October 2015
12 |
 NJR Clean
Energy Ventures New legislation signed by
Governor Christie in July
13
Clean energy investments contributed $19.5 million to NFE in fiscal 2012
35.7MW of installed capacity; over 45,000 SRECs generated annually
Meaningful earnings growth opportunities
Competitively-priced electricity for customers
Strong legislative commitment to solar in NJ |
 Fiscal
2012 results: 778 homes added in fiscal 2012
Average size: 7.5 kilowatts
$20.5 million of capital deployed
Customers are expected to save
over $630,000 in electric costs
after lease payments annually at
current electric rates
The Sunlight Advantage®
1,000
th
customer signed in
August 2012
14 |
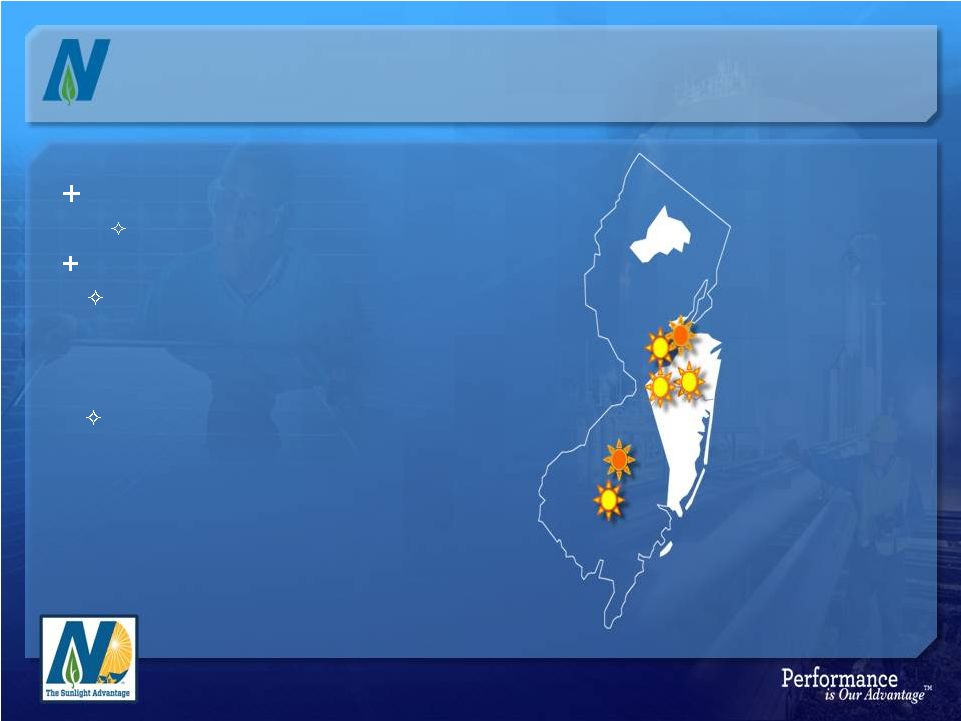 The
Commercial Sunlight Advantage Completed projects in place totaling 27.6MW
Capital of more than $127 million
Fiscal 2013 projects:
•
Ground-mounted system
•
$20 million; 6.7 MW project
•
In-service as of October 15, 2012
•
Rooftop system
•
$6.9 million; 2.4 MW project
•
In-service date planned for Q1 fiscal 2013
15
Medford
Wakefern |
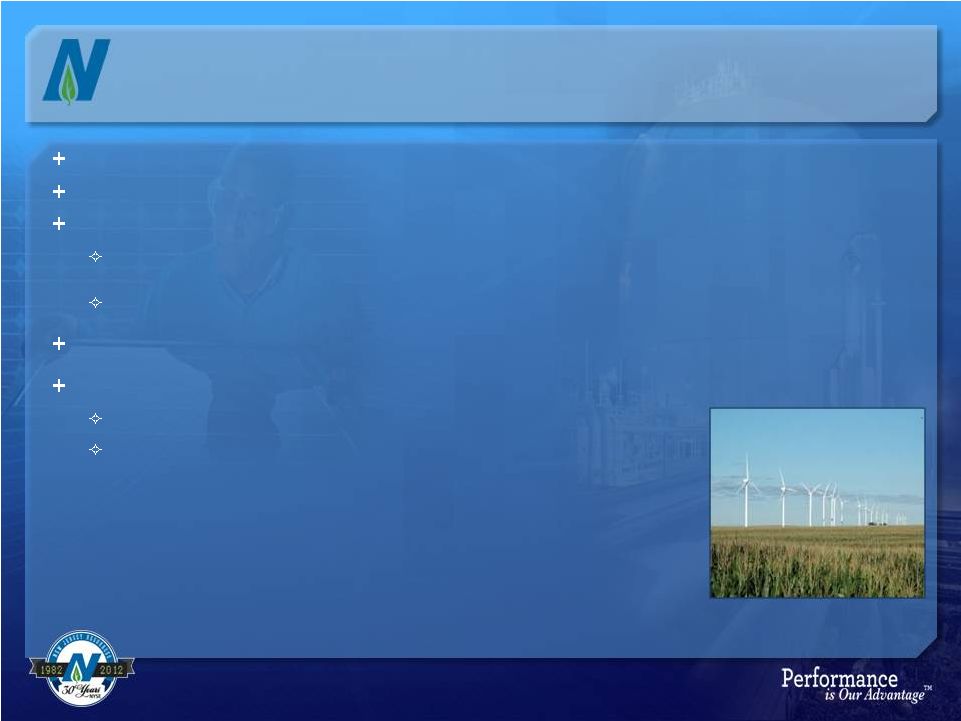 OwnEnergy
Investment 16
Announced on September 11, 2012
$8.8 million investment to acquire an approximate 20 percent equity interest
OwnEnergy manages the process for on-shore wind projects to make them
“shovel-ready” Provides NJR Clean Energy Ventures (CEV) with effective,
first-hand knowledge of the wind energy business
The potential opportunity to invest capital in a viable renewable long-term earnings
stream CEV has the option, but not the obligation, to purchase shovel-ready projects
for development CEV’s potential investments would:
Diversify its renewable energy portfolio and risk profile
Reduce reliance on New Jersey Solar Renewable Energy Certificates and
investment tax credits |
 NJR Energy
Services contributed $10.8 million to NFE in fiscal 2012 Focusing on long-option
strategy and disciplined risk management Providing customized energy solutions to its
customers Producers, Utilities, Power Generators, Pipelines and Industrials
Holds 1.1 Bcf/day of firm transportation and over 33 Bcf of storage diversified throughout
North America
Other Non-Regulated Businesses
17
NJR Energy Holdings
NJR Energy Services
Contributed $6.7 million to NFE in fiscal 2012
Steckman Ridge
Iroquois
50 percent joint venture with Spectra Energy
Contributed $4.3 million to 2012 NFE
5.53 percent ownership in pipeline from Canada to the northeast
Contributed $2.4 million to 2012 NFE |
 Contributed
$2.5 million to NFE in fiscal 2012
Pursuing geographic expansion
Currently marketing in Sussex, Warren and
Hunterdon counties
Expanded services now offered
Whole house electric and plumbing contracts
Standby generator contracts
18
NJR Home Services |
 19
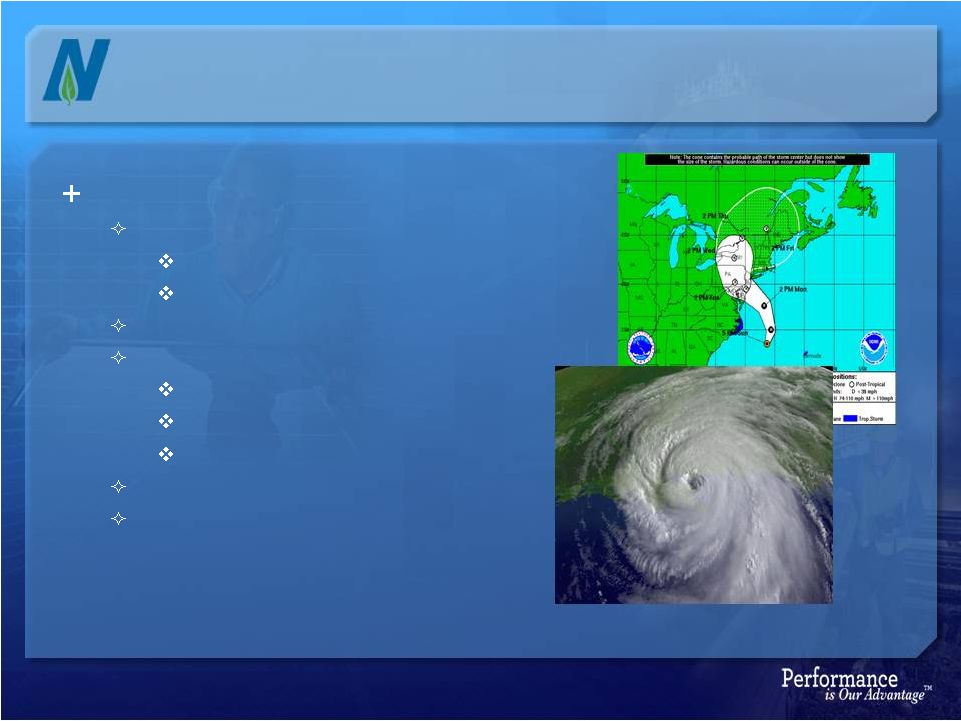
Superstorm Sandy
Facts:
Landfall just south of Atlantic City, NJ
Same time as high tide and a full moon
Added an additional six feet to the storm surge
Winds: 90+ miles per hour
970 miles wide. By contrast:
Andrew 180 miles wide
Katrina 460 miles wide
Irene 520 miles wide
943mb –
lowest pressure ever recorded at NJ latitudes
24 states affected by the storm |
 20
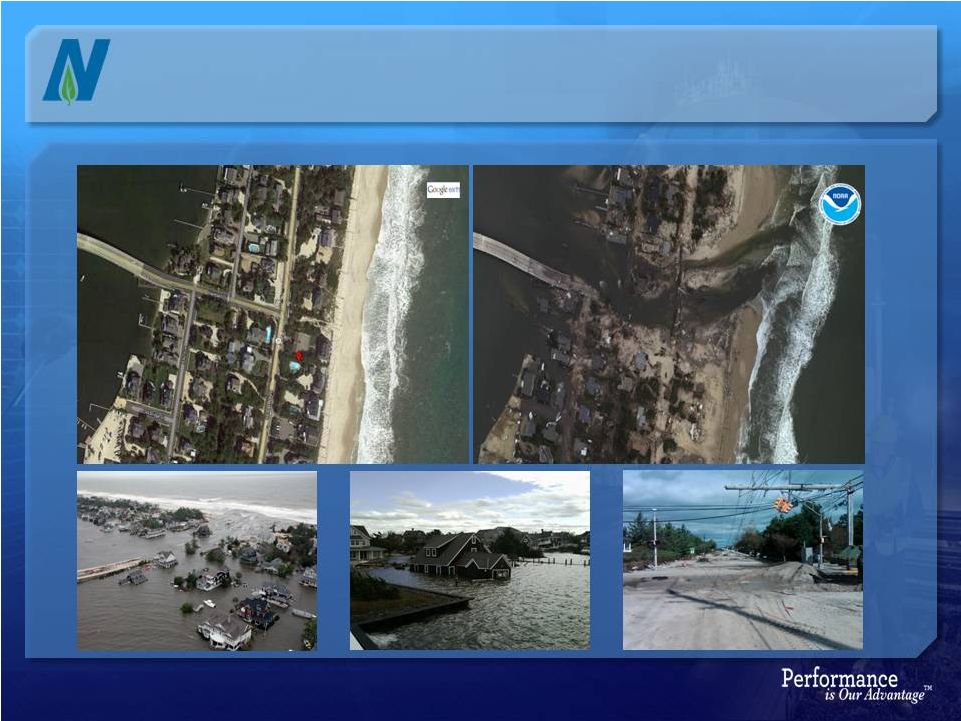
Mantoloking, NJ (Seaside Peninsula)
Before
After |
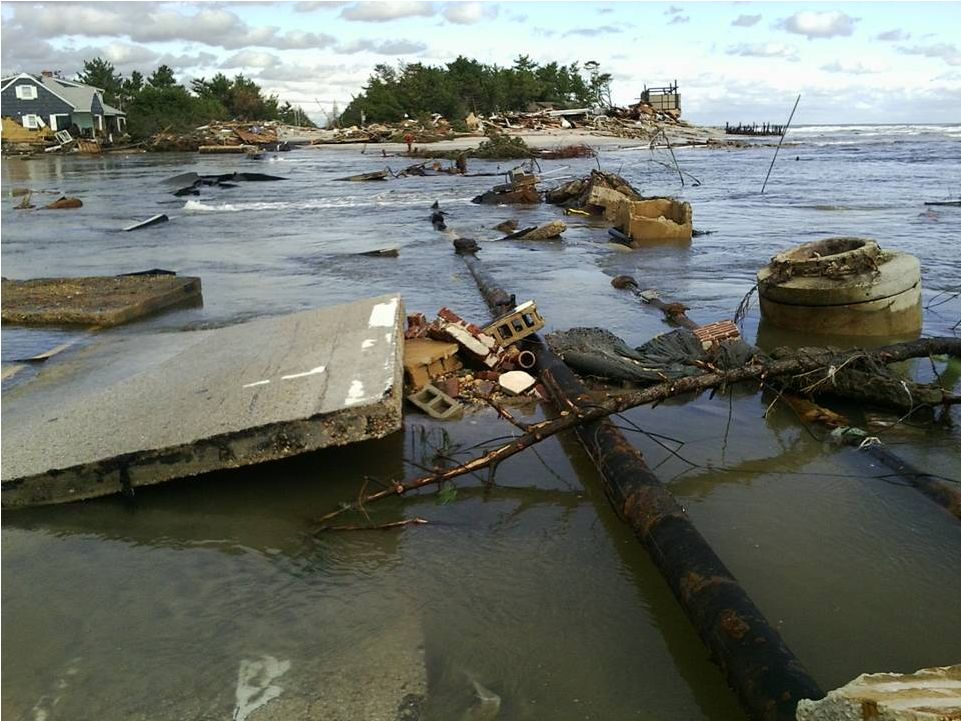 NJNG Natural
Gas Exposed Main, Route 35 Mantoloking, NJ
21 |
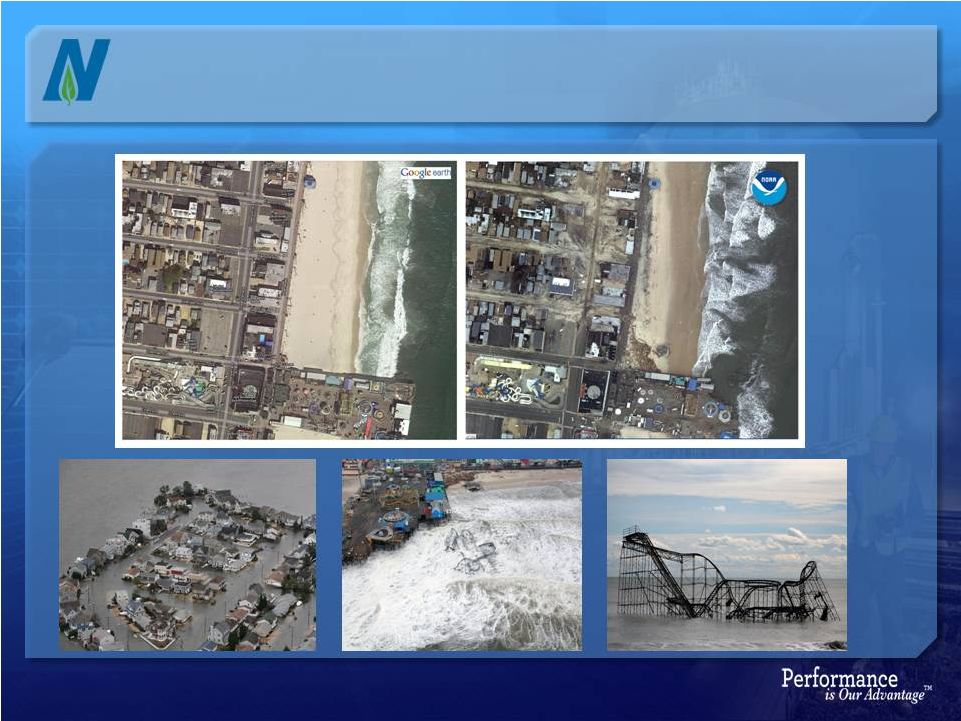 22
Seaside Heights, NJ (Seaside Peninsula)
Before
After |
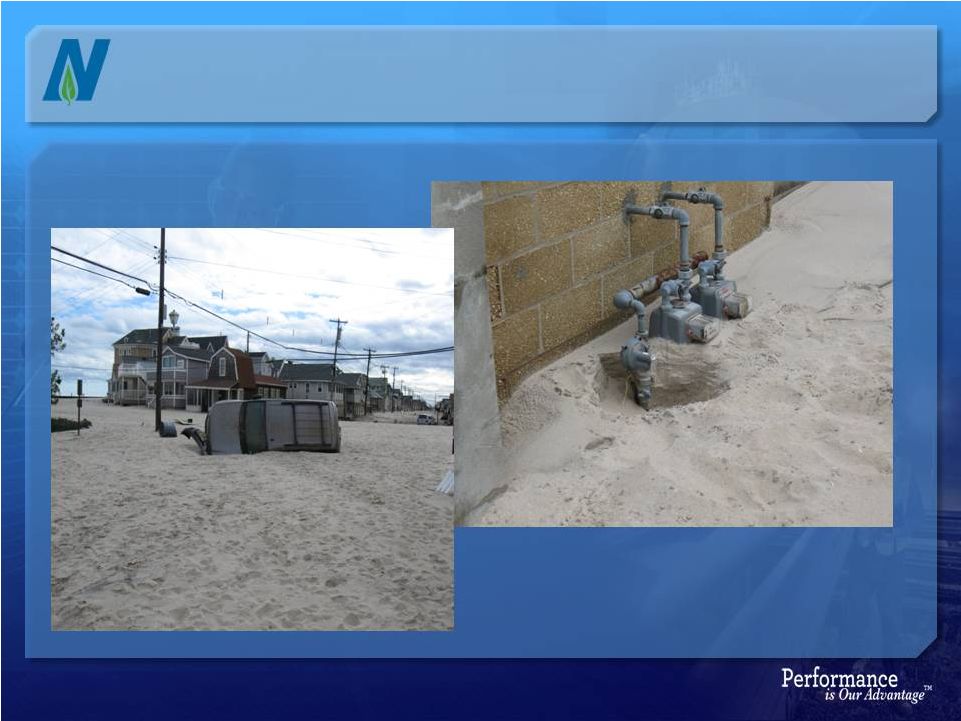 Manasquan, NJ
(Monmouth County Mainland) |
 In the first
three days following the storm, NJNG crews responded to over 1,300 leaks and made them
all safe Over 400 individuals on the ground in affected areas
Crews from other east coast utilities worked alongside NJNG
personnel
Safety #1 Priority
Decision made to shut down system on the Seaside peninsula and all
of Long Beach Island
Approximately 30,000 customers affected
Expected water to infiltrate pipes due to no pressure
Other
mainland
towns
such
as
Sea
Bright
and
Manasquan
also
shut
down
24
Superstorm Sandy –
Initial Assessment |
 25
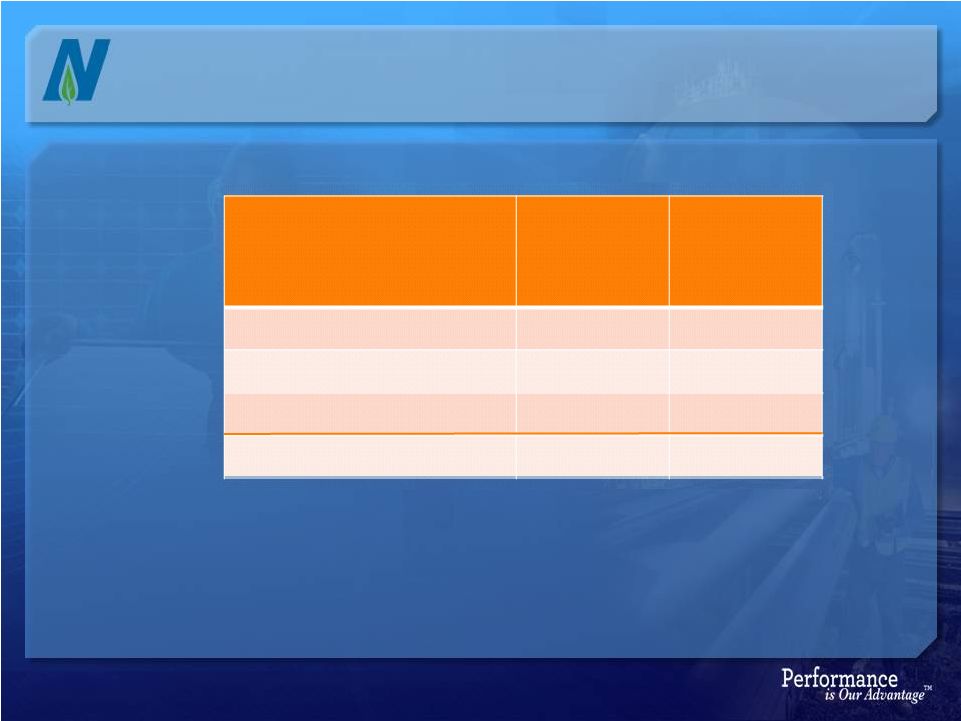
Superstorm Sandy –
Scope of Curtailments
Area
Miles of
Pipe
Curtailed
Number of
Customers
Affected
Seaside Peninsula
116
15,207
Long Beach Island
150
13,756
Other affected areas
6
1,104
Total
272
30,067 |
 Long
Beach Island Assessment of pipe revealed less damage than expected (no
water)
Majority of main and services salvageable
Restoration Plan implemented in three phases
Reintroduce natural gas into the main
Repair
and
replace
meters
to
bring
natural
gas
to
the
meter
with
leak
surveys done at incremental pressure levels to ensure safety
Customer becomes “gas ready”
and gets turned on following
certification from qualified technician
As of November 26, natural gas currently available to all accessible
meters except those with the most severe damage
26
Superstorm Sandy –
Restoration Plans |
 Seaside
Peninsula More debris than LBI which has slowed assessments
Assessment of pipe revealed more damage than LBI (but again, no water)
Much of main salvageable
Expect to begin restoration process by December 3, 2012
NJNG
is
installing
approximately
one
mile
of
12
inch
main
-
the
backbone
of
the system that serves the Seaside peninsula, due to three breeches in
Mantoloking
Restoration similar to LBI, Plan includes three phases
Reintroduce natural gas into the main
Repair
and
replace
meters
to
bring
natural
gas
to
the
meter
with
leak
surveys
done
at incremental pressure levels to ensure safety
Customer becomes “gas ready”
and gets turned on following certification from
qualified technician
Currently expect natural gas to all meters that can take gas safely by
December 31, 2012
27
Superstorm Sandy –
Restoration Plans |
 28
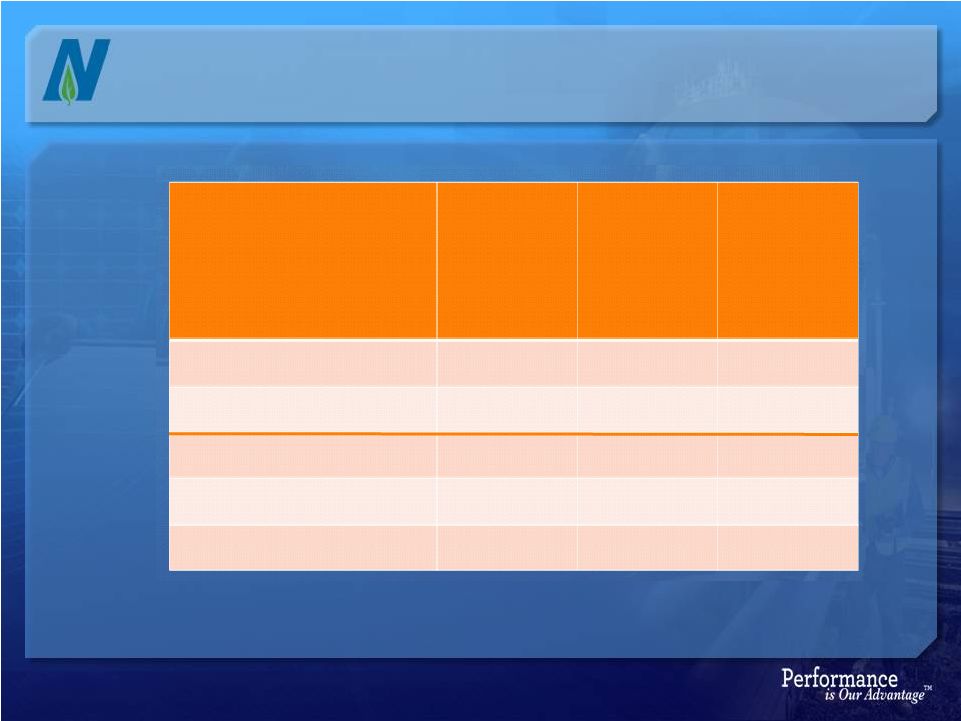
Superstorm Sandy –
Restoration Summary
Area
Miles of
Pipe
Curtailed
Number of
Customers
Affected
Pct. of
Customers
with Gas
Available*
Seaside Peninsula
116
15,207
-
Long Beach Island
150
13,756
99%
Other
6
1,104
98%
Total
272
30,067
* As of November 26 |
 NJNG Capital
Spending Currently estimated at $40-$60 million*
Mains, services and predominately meter assemblies at
customer’s premise
As with normal operations, storm-related capital costs will be
treated as additions to rate base
Options
Seek regulatory approval to use a portion of SAFE monies for storm-
related capital costs
Re-evaluate our normal budgets, both utility and non-utility
File base rate case before required by SAFE settlement
29
Superstorm Sandy –
Financial Impacts
* Preliminary and subject to change |
 Incremental
O&M Costs Currently estimated at $$12-$20 million*
Assessment, leak survey and leak repair
Petition filed with the NJ BPU seeking deferred accounting
treatment for incremental storm-related costs
Precedent exists in New Jersey for incremental O&M costs to be
deferred and recovered subsequently in a base rate case
30
Superstorm Sandy –
Financial Impacts
* Preliminary and subject to change |
 Lost Utility
Gross Margin Lost gross margin is estimated at about $1.5 -$2 million per month
during the winter*
Total utility gross margin in fiscal 2012 was nearly $276 million
Expect all customers who can have service safely restored to be
completed by December 31
Some customers with severe damage may be lost for an extended
period of time
For every 1,000 residential and 50 small commercial customers lost as
a
result
of
the
storm,
through
total
loss
or
condemnation,
the
annual
loss
in utility gross margin would be $407,000 and $32,000,
respectively
31
Superstorm Sandy –
Financial Impacts
* Monthly impact is seasonal |
 NJNG has
adequate liquidity to cover storm expenses $200 million syndicated credit facility in
place Accordion feature of $50 million has been exercised
Long-term debt
BPU approval in place for up to $200 million
2013 plan included $50 million, but may be upsized, if needed
Additional lines have been offered by lenders, if needed
Re-evaluate normal capital budgets
Flexibility with DRP/Repurchase Plan
32
Superstorm Sandy –
Liquidity |
 Earnings
guidance will be given as usual with our first quarter fiscal 2013 earnings
We will continue to provide updates on our system restoration
progress
http://www.njng.com/safety/hurricane-sandy-updates/index.asp
33
As We Look Ahead |
 New Jersey
Resources 4
th
Quarter Fiscal 2012 Update
November 29,2012 |
