Attached files
| file | filename |
|---|---|
| 8-K - FORM 8-K - LOCAL Corp | d445872d8k.htm |
 CORPORATE OVERVIEW | 4Q2012
1
…………………………..…………………………………….
Local Corporation
We connect local businesses with online consumers
Corporate Overview: 4Q2012
1
CORPORATE OVERVIEW | 4Q2012
Exhibit 99.1 |
 2
………………..…………………………………….
Forward looking statements
CORPORATE OVERVIEW | 4Q2012
2
Certain matters being discussed by Local Corporation’s management today
include forward looking statements which are made pursuant to the Safe
Harbor provisions of section 21-E of the Securities Exchange Act of 1934.
Investors are cautioned that statements which are not strictly historical
statements, including statements concerning future expected financial
performance, management objectives and plans for future operations, our
relationships with strategic or other partners, the release of new products or
services or enhancements to existing products or services, our expectations
regarding potential acquisitions and the future performance of past
acquisitions including our ability to realize expected synergies, trends in the
market for our current or planned products or services, and market
acceptance of our products or services, constitute forward looking
statements. The forward looking statements include, but are not limited to,
any statements containing the words “expect”,
“anticipate”, “estimates”, “believes”, “should”,
“could”, “may”, “possibly”, and similar expressions
and the negatives thereof. These forward looking statements involve a number
of risks and uncertainties that could cause actual results to differ
materially from the forward looking statements. Those risks and
uncertainties are detailed in the company’s filings from time to time
with the Securities and Exchange Commission. The information contained in
the forward looking statements is provided as of the date of such oral
statements and the company disclaims any obligation to update such
statements. This
document
includes
the
non-GAAP
financial
measure
of
“Adjusted
Net
Income/Loss”
which
we
define
as
net
income/loss
excluding:
provision
for
income taxes, interest and other income (expense), net; depreciation;
amortization; stock-based compensation charges; gain or loss on warrant
revaluation; net income (loss) from discontinued operations; impairment
and severance charges and non-recurring items.
Adjusted
Net
Income/Loss,
as
defined
above,
is
not
a
measurement
under
GAAP. Adjusted Net Income/Loss is reconciled to net loss and loss per share,
which we believe are the most comparable GAAP measures, at the end of this
presentation. Management believes that Adjusted Net Income/Loss provides
useful information to investors about the company’s performance
because it eliminates the effects of period-to-period changes in
income from interest on the company’s cash and marketable securities,
expense from the company’s financing transactions and the costs
associated with income tax expense, capital investments, stock-based
compensation expense, warrant revaluation charges, and non-recurring
charges which are not directly attributable to the underlying performance
of the company’s business operations. Management uses Adjusted Net
Income/Loss in evaluating the overall performance of the company’s
business operations. A limitation of non-GAAP Adjusted Net Income/Loss
is that it excludes items that often have a material effect on the
company’s net income and earnings per common share calculated in
accordance with GAAP. Therefore, management compensates for this limitation
by using Adjusted Net Income/Loss
in
conjunction
with
GAAP
net
loss
and
loss
per
share
measures.
The company believes that Adjusted Net Income/Loss provides investors with
an additional tool for evaluating the company’s core performance, which
management uses in its own evaluation of overall performance, and as a
base-line
for
assessing
the
future
earnings
potential
of
the
company.
While
the
GAAP results are more complete, the company prefers to allow investors to
have
this
supplemental
metric
since,
with
reconciliation
to
GAAP
(as
noted
above), it may provide greater insight into the company’s financial results.
The non-GAAP measures should be viewed as a supplement to, and not as a
substitute for, or superior to, GAAP net income or earnings per
share. |
 ………………………………………………..
Local Corporation Overview
Founded
IPO Date
Ticker
Reach
Flagship Site
Network
Direct Customers
Patents
Headquarters
Employees
1999
2004
LOCM (NASDAQ)
~1 million consumers/day
Local.com –
Top 100 US Site
Over 1,000 local sites
Over 900 subscribers
10 issued + 11 pending
Irvine, CA
~160
KEY FACTS
REVENUE IN MILLIONS
3
CORPORATE OVERVIEW | 4Q2012
We connect consumers searching for goods & services locally
with advertisers who want to sell them those items.
We generate revenue from advertising. |
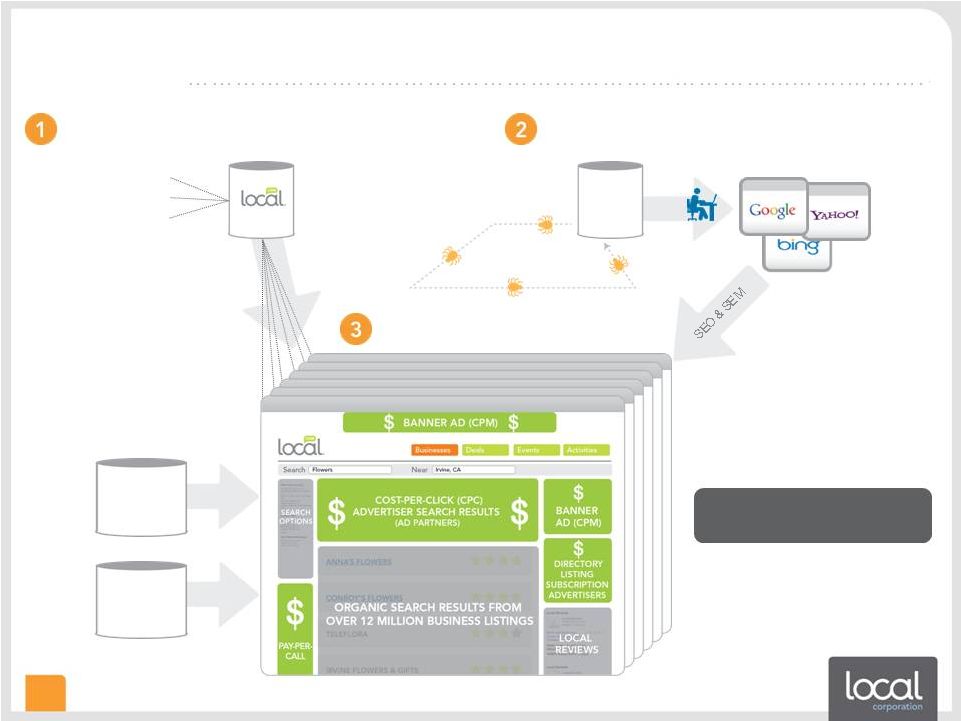 Our
Model LOCAL BUSINESS DATA
(may include deals, coupons,
product info, business content,
events, activities, ratings &
reviews and more)
WE AGGREGATE & PUBLISH LOCAL CONTENT
THAT CONTENT IS INDEXED BY SEARCH ENGINES
WE MONETIZE TRAFFIC
FROM THOSE ENGINES
MAJOR
SEARCH
ENGINES
OUR
PARTNERS’
ADVERTISERS
PROPRIETARY NETWORK OF
1,000+ SITES
PROPRIETARY NETWORK OF
1,000+ SITES
OVER 30MM
CONSUMERS
PER MONTH
DIRECT
CUSTOMERS
4
CORPORATE OVERVIEW | 4Q2012
Traffic x Monetization = Revenue
|
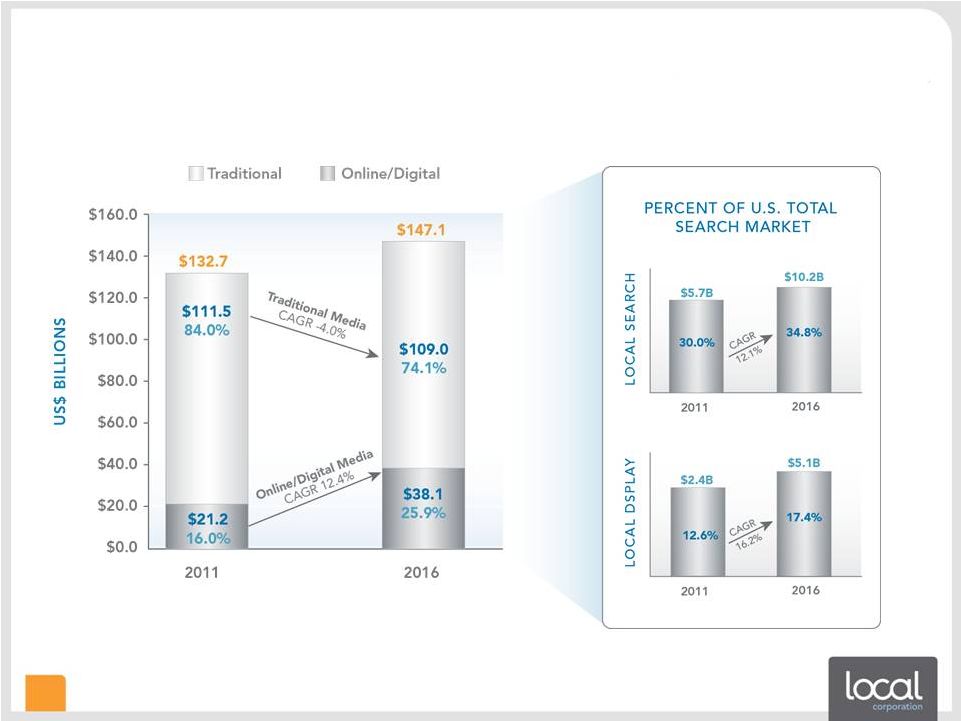 …………………………...………………………………………….
The Opportunity
Digital media is going local....
…& we have assets in all areas
Source: BIA/Kelsey, November 2012
CORPORATE OVERVIEW | 4Q2012
5 |
 The Challenge for Small
Businesses Only 33.4%
Only 22%
Just 6.7%
Only 6%
SMBs spend thousands
and need multiple vendors
to solve for their most basic marketing and advertising needs
*Research by Vsplash and BIA/Kelsey: SMB Digital Scope and Audit
Study
...……………..…………………….….
CORPORATE OVERVIEW | 4Q2012
6
have a local phone number on their home page
have an email address on their website
of SMB websites are mobile-compatible
have a Facebook business page |
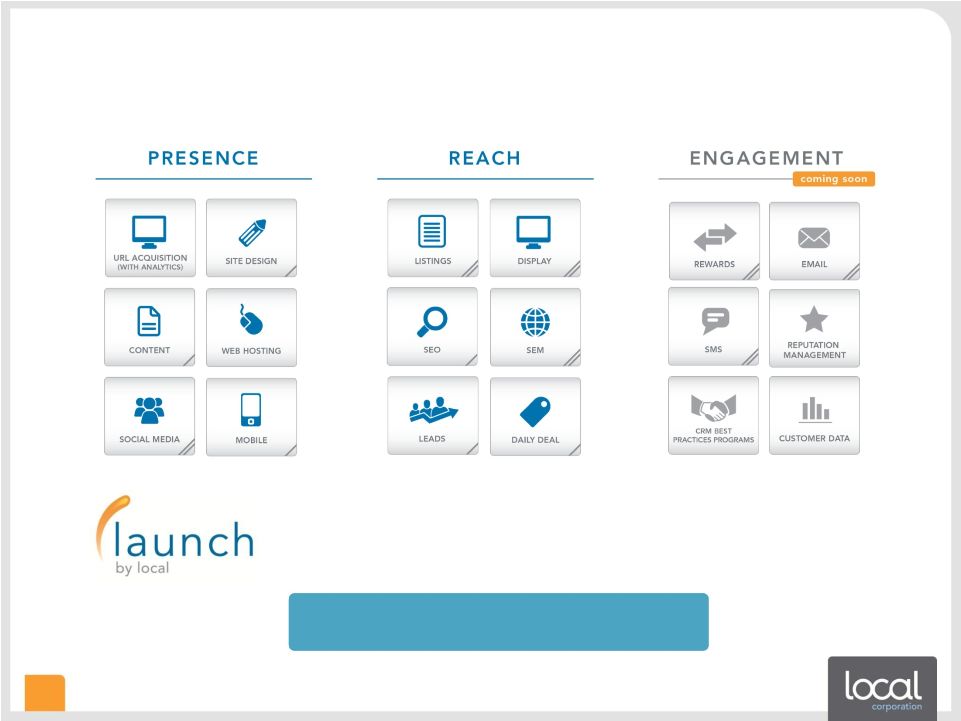 Our Solution –
Launch by Local
•
Released August 2012
•
A complete digital media package starting at $249 per
month •
Powered by our own proprietary technology
SMBs could spend over $1,000/month with other providers to get
everything that is already included in our one solution.
7
CORPORATE OVERVIEW | 4Q2012
...………………………………………….….
|
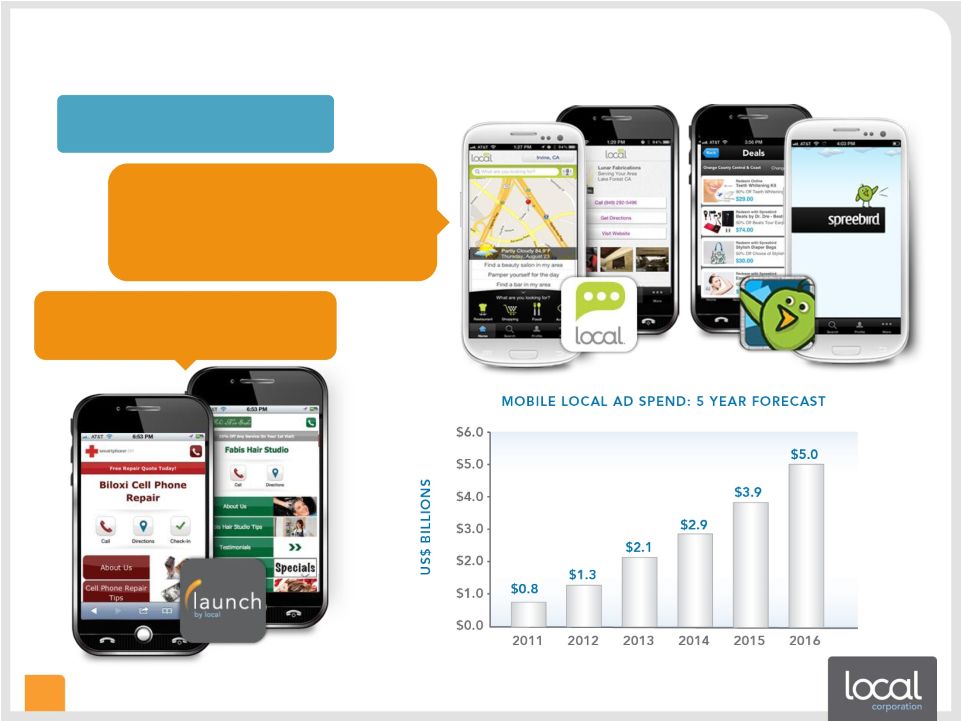 Mobile
Source: BIA/Kelsey
*Source: Borrell Associates
Within 5 years, 80% of local searches
will be done on a mobile device*
Mobile Apps and mobile-enabled available
for consumer sites:
Launch by Local solution offers a
mobile-optimized website for SMBs
CORPORATE OVERVIEW | 4Q2012
8
•
Local.com
•
Spreebird.com
…………………………………………….…………….………………………..
|
 Local customers are
worth more! Search Term
Click Bids*
Premium
Plumber
$9.55
282%
Plumber
Los
Angeles
$26.91
Credit Union
$0.91
235%
Seattle
Credit Union
$2.14
Restaurant
$1.39
139%
San
Francisco
Restaurant
$1.93
Moving Company
$10.82
114%
Denver
Moving Company
$12.38
Wedding Florist
$1.92
147%
Orlando
Wedding
Florist
$2.82
Hotel
$1.80
200%
New
York
City
Hotel
$3.60
Pay-per-click
rates
for
local
versus
national
keyword
terms
…
Why Local Consumers Matter
* Bids as of June 25, 2012
9
CORPORATE OVERVIEW | 4Q2012
………….…………………..….
|
 Simple Growth Strategy
•
Number of sites
•
Volume of traffic per site
•
Mobile
..……………………………………………….………….
Grow Traffic
Increase Monetization
Direct customers
10
CORPORATE OVERVIEW | 4Q2012 |
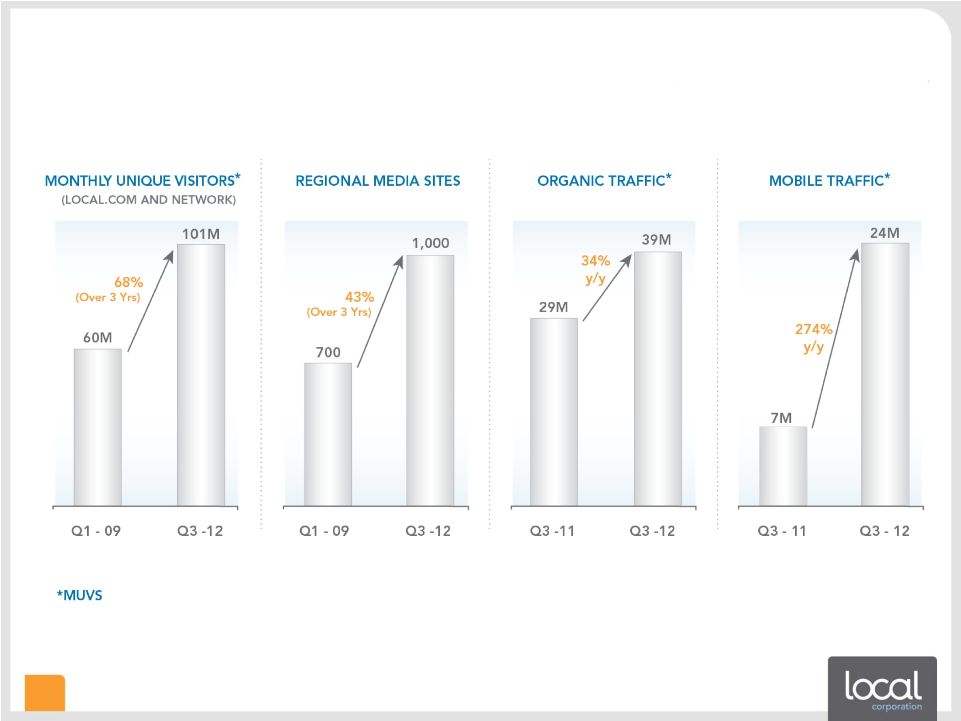 ..……………..…………………………………….
Strategy Momentum: Traffic
11
CORPORATE OVERVIEW | 4Q2012 |
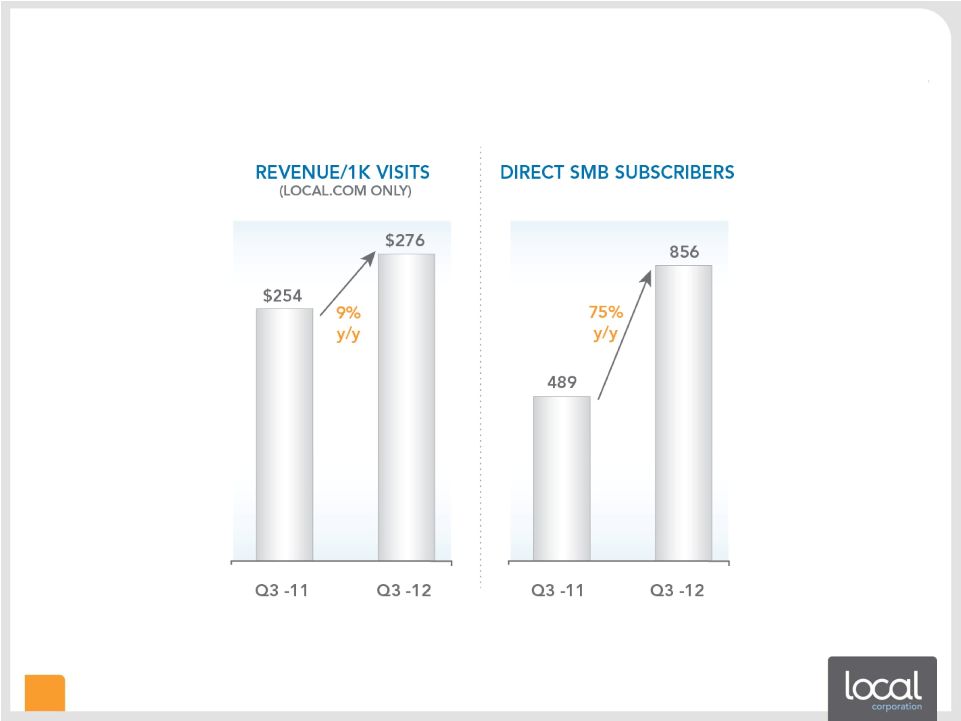 ..…..…………………………………….
Strategy Momentum: Monetization
12
CORPORATE OVERVIEW | 4Q2012 |
 ……………...........………..…………………………….
Organic/direct
revenue
includes
revenue
from
organic
traffic and direct advertiser relationships
•
More defensible
•
Higher margin
•
More predictable
•
Greater shareholder value
Long Term Goals –
50/50
180M
160M
140M
120M
100M
80M
60M
40M
0
20M
2010
2011
2012E
$35M
$30M
$25M
$20M
$15M
$10M
$5M
$0
2010
2011
2012E
ORGANIC
TRAFFIC
ORGANIC
REVENUE
Monthly Unique Visitors (MUVs)
(in
Millions)
ORGANIC
AS % OF TOTAL
13
CORPORATE OVERVIEW | 4Q2012 |
 …………………………………….....…..……….
Leverage Example with 50/50
•
Expected to be high-margin revenue
•
Expected to improve gross margins significantly
Note: Actual results could differ materially from these projections.
14
CORPORATE OVERVIEW | 4Q2012
Current
mix
Long-term goal
50%
30%
GROWTH IN ORGANIC/DIRECT REVENUE
* Search Engine Marketing
ESTIMATED PROFORMA MARGIN IMPACT
70/30 MIX
PROJECTED %
OF REVENUE
(in Thousands)
(in Thousands)
50/50 MIX
OF REVENUE
PROJECTED
%
Organic/Direct revenue
SEM*/Third-Party advertiser revenue
Total revenue
Gross margin
Adjusted Net Income
Incremental Adjusted Net Income
$7,500
$17,500
$25,000
$7,500
$1,000
30%
70%
100%
30%
4%
$17,500
$17,500
$35,000
$15,500
$6,000
$5,000
50%
50%
100%
44%
17%
Organic/direct
revenue
includes
revenue
from
organic
traffic
and
direct
advertiser
relationships |
 Assets
•
10 Patents issued/11 pending
•
Aggregate & publish local
content
•
Proprietary platform
•
Local.com Top 100 Site
•
Over 20MM Uniques/Month
•
1,000 Channel Partners
•
Over 8MM Uniques/Month
•
~ 300K daily emails
•
Google
•
Yahoo!
•
SuperMedia
•
ATTi
•
~ 900 Direct Subscribers
15
CORPORATE OVERVIEW | 4Q2012
TRAFFIC
TECHNOLOGY
ADVERTISERS |
 CORPORATE OVERVIEW | 4Q2012
16
……………………..……….……….
Experienced with Strategy Discipline
Heath Clarke
Founder, Chairman & CEO
20+ yrs exp
Founded Local in ’99
VP eCommerce LanguageForce
CEO/Founder AFP (Australia)
Ken Cragun
CFO
20+ yrs exp
CFO Modtech
SVP MIVA
CFO ImproveNet
CFO NetCharge.com
CPA; Big 4 Exp.
Mike Sawtell
President & COO
20+ yrs exp
Chairman & CEO, DigitalPost Interactive
Pres. & COO , Interchange Corp. (now
Local Corporation)
COO & VP of Sales, Informative Research
Peter Hutto
SVP, Corporate Development
Co-Founder, ZeroDegrees
Managing Director, EDS & MCI
SystemhouseG
Erick Herring
SVP Technology
Founder Townloop
CTO Feedback.com
CTO, VP Product Webvisible
CTO Adapt Technologies
Rob Luskey
VP, Business Development
Director, Business Development,
go2 Systems, Inc.
Senior Manager, Internet Products and
Services, United Yellow Pages
Owner & Publisher, Local Impact
Publishing
16
CORPORATE OVERVIEW | 4Q2012 |
 17
…………………………………..………….…….……….
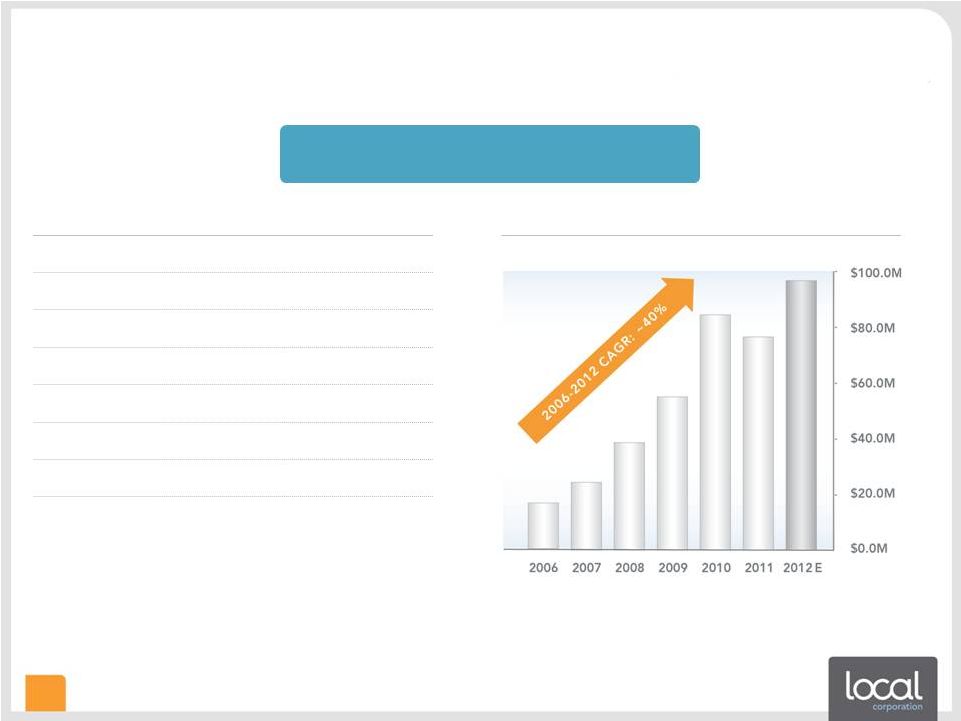
Track Record of Growth
•
~37% CAGR 2006-2012
•
20% YoY revenue growth (Q3’12 over Q3’11)
•
FY12 Guidance: ~$100M revenues: ~27% YOY growth and ~$750K Adjusted Net Income
•
Forward-Looking:
Increased organic revenue = higher margins and improved bottom line
Note: See reconciliation of Adjusted Net Income to GAAP net income at presentation end.
$60.0M
$80.0M
$100.0M
$40.0M
$20.0M
2006
2007
2008
2009
2010
2011
2012 E
$0.0M
17
CORPORATE OVERVIEW | 4Q2012 |
 CORPORATE OVERVIEW | 4Q2012
18
3Q12 Balance Sheet & Cap. Table
Key Balance Sheet Items
(in thousands)
September 30, 2012
Cash
$3,706*
Accounts Receivable
13,954
Total Assets
58,784
Total Debt
7,627
Total Liabilities
23,234
Shareholders Equity
$35,550
September 30, 2012
Common stock
22,095
Options
4,448
Warrants
1,239
RSUs
367
PSUs
257
Fully Diluted
28,406
Additional
Data:
I.
$12 million credit facility. Interest rate approximately 5%
II.
Total authorized shares 65,000,000 common and 10,000,000 preferred
*
Received $3.5 million proceeds from Rovion sale on October 19,
2012
18
Capitalization
(in thousands)
(Avg. Strike $4.27)
1
(Avg. Strike $8.37) |
 CORPORATE OVERVIEW | 4Q2012
19
…………………………..…….……….
Why Invest in Local Corporation?
•
Track record of growth
•
Strong management team with proven skills in a rapidly changing market
•
Model has leverage with 50/50 strategy and momentum towards 50/50 goals
•
Proprietary platform and patents
•
Assets being deployed in emerging mobile markets |
 CORPORATE OVERVIEW | 4Q2012
20
Heath Clarke
Founder, Chairman & Chief Executive Officer
hclarke
local.com
Ken Cragun
Chief Financial Officer
kcragun
local.com
949.784.0800
http://www.localcorporation.com
@
@
Thank You |
 CORPORATE OVERVIEW | 4Q2012
21
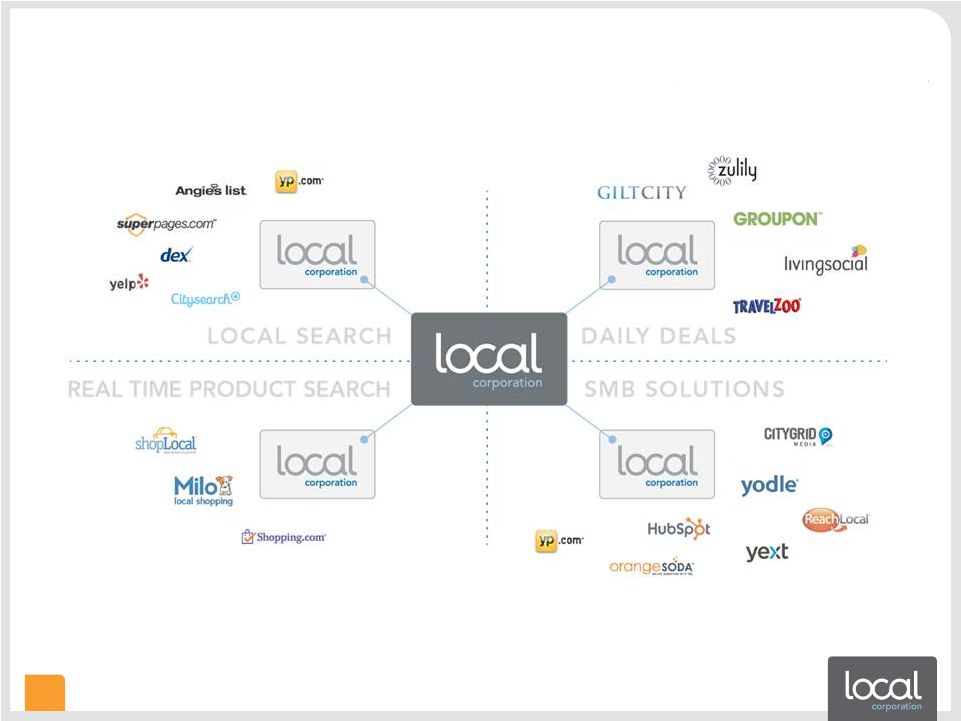
………………………………………………………
Digital Media Landscape |
 CORPORATE OVERVIEW | 4Q2012
22
……………………………………………………………….……….……….
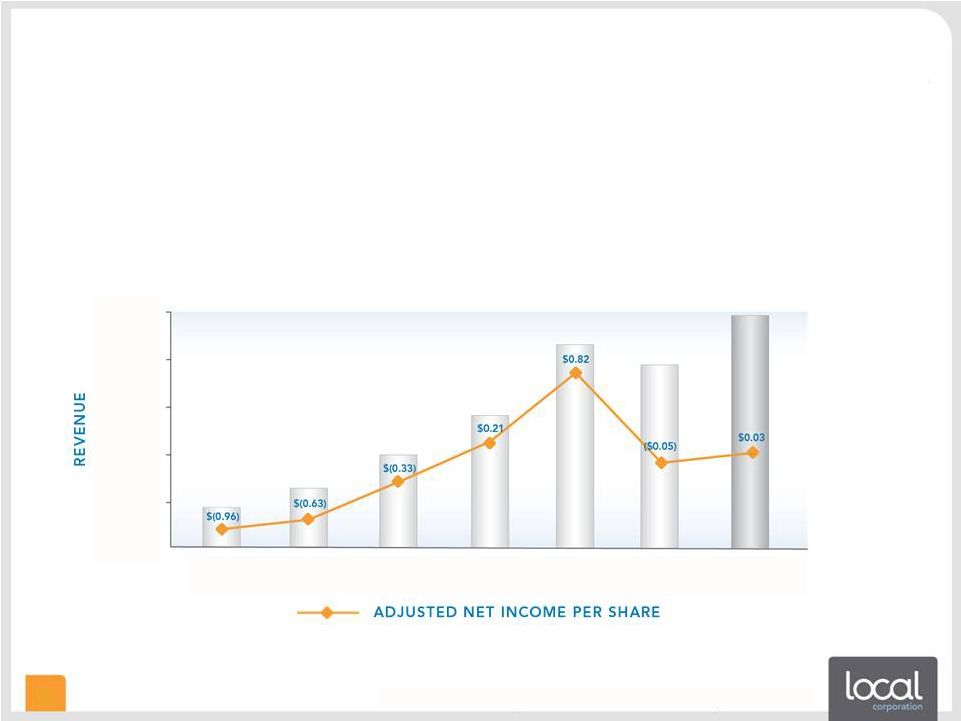
P&L Trend
Actual
Actual
Forecast
Description
FY-10
FY-11
FY-12
Revenue
$ 84,137
$ 78,259
$99,000-100,000
Sequential revenue growth
49%
-8%
27%
Gross Margin
37,620
29,001
Gross Margin %
45%
37%
Other Operating Expenses
33,908
43,629
Operating income (loss)
3,712
(14,628)
Interest and other income (expense)
(275)
(413)
Change in fair value of warrant liability
887
2,633
Income (Loss) before income taxes
4,324
(12,408)
Provision for income taxes
102
178
Net income (loss) from continuing operations
$ 4,222
$ (12,586)
Income (loss) from discontinued operations
(1,972)
Net income (loss)
$ 4,222
$ (14,558)
Adjusted Net Income (Loss)
$ 13,775
$ (1,090)
$ 750
Weighted average shares
16,788
21,384
23,000
Net income (loss) per share from discontinued operations
$ 0.25
$ (0.68)
Adjusted Net Income (Loss) per share
$ 0.82
$ (0.05)
$ 0.03
Note: See reconciliation of Adjusted Net Income to GAAP net income slide
(in thousands, except per share amounts)
|
 CORPORATE OVERVIEW | 4Q2012
23
……..……….
Reconciliation: Adjusted Net Income to GAAP Net Inc
Actual
Actual
Forecast
Description
FY-10
FY-11
FY-12
Adjusted Net Income (Loss)
$ 13,775
$ (1,090)
$ 750
Plus interest and other income (expense), net
(275)
(413)
(400)
Less provision for income taxes
(102)
(178)
(200)
Less amortization of intangibles
(5,734)
(5,136)
(3,700)
Less depreciation
(1,418)
(3,277)
(4,400)
Less stock-based compensation
(2,911)
(3,663)
(3,000)
Less revaluation of warrants
887
2,633
unknown
Less non-recurring charges
-
(1,461)
(750)
Less impairment charge
(6,500)
Less Rovion assets held for sale
(1,972)
(1,600)
Gain on Sale of Rovion Assets
1,400
GAAP Net income (loss)
$ 4,222
$(14,558)
unknown
Weighted Avg Shares
-
Adjusted Net income (loss)
16,788
21,384
23,000
Weighted Avg Shares
-
GAAP Net income (loss)
16,788
21,384
23,000
Adjusted Net Income (Loss) per share
$ 0.82
$ (0.05)
$ 0.03
GAAP Net income (loss) per share
$ 0.25
$ (0.68)
unknown
(in thousands, except per share amounts)
|
 Facebook and Twitter pages engage
customers and increase awareness
Mobile-optimized site
features directions and
click-to-call
Beautiful site design and web
hosting with geo-targeted URL
and custom content
A consistent brand
and user experience
across multiple channels
add to business credibility
CORPORATE OVERVIEW | 4Q2012
24
..…..…….……….
Local SMB Customer: Fabi’s Hair Studio
(Murray Hill Hair Salon) |
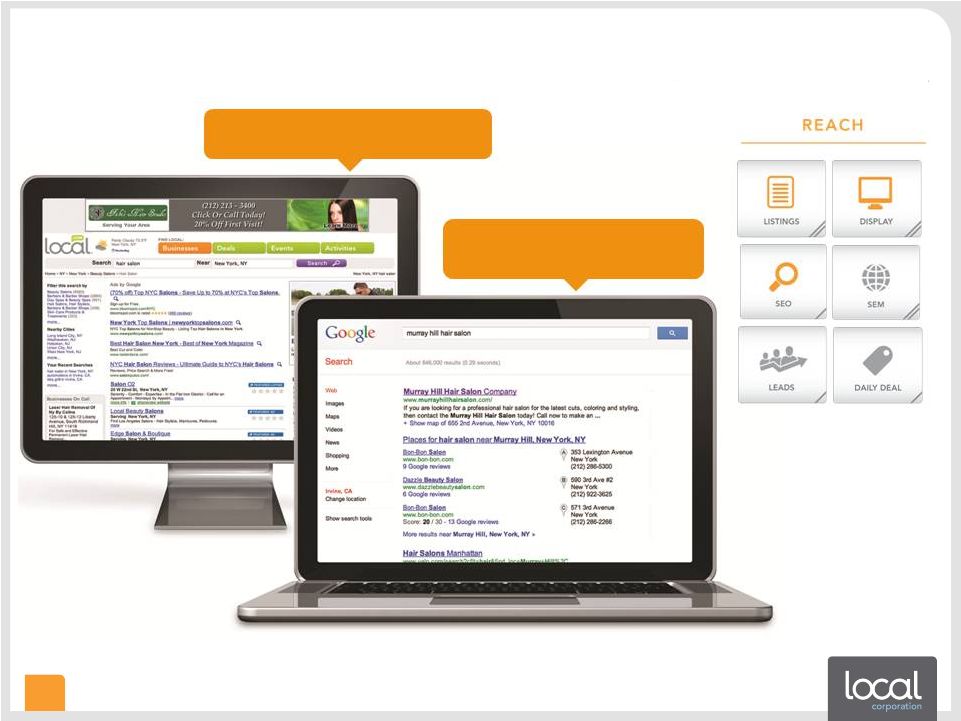 CORPORATE OVERVIEW | 4Q2012
25
.…..…….……….
Display ad and enhanced listing on
Local.com raise awareness in local markets
Search engine optimization ensures
page 1 placement by business category
and keyword on a major search engine
•
More direct customers =
»
Better monetization
»
Greater margins
»
Greater defensibility
»
More visibility
Local SMB Customer: Fabi’s Hair Studio
(Murray Hill Hair Salon) |