Attached files
| file | filename |
|---|---|
| 8-K - FORM 8-K - C&J Energy Services, Inc. | d446249d8k.htm |
| EX-99.1 - PRESS RELEASE DATED NOVEMBER 29, 2012 - C&J Energy Services, Inc. | d446249dex991.htm |
 C&J Energy
Services, Inc. JP Morgan Oil and Gas
Corporate Access Day
November 2012
Exhibit 99.2 |
 C&J Energy
Services, Inc. Disclaimer
Forward-Looking
Statements
Certain
statements
and
information
in
this
presentation
may
constitute
“forward-looking
statements”
within
the
meaning
of
Section 27A of the Securities Act of 1933, as amended, Section 21E of the Securities Exchange
Act of 1934, as amended, and
the
Private
Securities
Litigation
Reform
Act
of
1995.
The
words
“believe,”
“expect,”
“anticipate,”
“plan,”
“intend,”
“foresee,”
“should,”
“would,”
“could”
or other similar expressions are intended to identify forward-looking statements, which
are generally not historical in nature. These forward-looking statements are based
on our current expectations and beliefs concerning
future
developments
and
their
potential
effect
on
us.
While
management
believes
that
these
forward-looking
statements are reasonable as and when made, there can be no assurance that future developments
affecting us will be those that we anticipate. All comments concerning our expectations
for future revenues and operating results are based on our
forecasts
for
our
existing
operations
and
do
not
include
the
potential
impact
of
any
future
acquisitions.
Our
forward-
looking statements involve significant risks and uncertainties (some of which are beyond our
control) and assumptions that could cause actual results to differ materially from our
historical experience and our present expectations or projections. Known material
factors that could cause our actual results to differ from our projected results are described in our filings
with the Securities and Exchange Commission (“SEC”), including but not limited to
our Annual Report on Form 10-K for the fiscal year
ended December 31, 2011 and subsequent Quarterly Reports on Form 10-Q and the Current Reports on Form 8-K. All readers are
cautioned not to place undue reliance on forward-looking statements, which speak only as of the date hereof.
We undertake no obligation to publicly update or revise any forward-looking statements
after the date they are made, whether as a result of new information, future events or
otherwise. Non-GAAP
Financial
Measures
We use both GAAP and certain non-GAAP financial measures to assess performance. Generally,
a non-GAAP financial measure is a numerical measure of a company's performance,
financial position or cash flows that either excludes or includes amounts that are not
normally excluded or included in the most directly comparable measure calculated and
presented in accordance with GAAP. C&J management believes that these non-GAAP
measures provide useful supplemental information to investors in order that they may
evaluate our financial performance using the same measures as management.
These
non-GAAP
financial
measures
should
not
be
considered
as
a
substitute
for,
or
superior
to,
measures
of
financial performance prepared in accordance with GAAP. In evaluating these measures,
investors should consider that the methodology applied in calculating such measures may
differ among companies and analysts. Reconciliation of non-GAAP results to GAAP
results for historical periods can be found on slide 23 of this presentation and in our filings with the SEC,
as applicable. |
  PAGE
3
Focus on the most complex projects in the most challenging basins
C&J Energy Services Profile
Demonstrated efficiencies allow for premium pricing
Engineering staff offers extensive front-end technical
evaluation
Hydraulic
Fracturing
Ability to handle heavy-duty jobs across a wide spectrum of
environments
Leverage to expand into additional fracturing opportunities
Coiled
Tubing
Wireline
and related
services
Casedhole provides wireline perforation, logging, pressure
pumping, and pipe recovery services as well as wellsite
makeup and pressure testing in most of the major US basins
Diversified provider of premium, technologically-advanced completion services |
 PAGE
4
Efficiencies Provide Cost Savings for Customers, Favorable Margins for C&J
In-house
Manufacturing
Enhances product development and R&D activities
Mitigates supply constraints, reduces manufacturing and repair
costs
Operational Model Drives
Best-In-Class Performance
Experience &
Expertise
Maintenance
Logistics
Management with in-depth, basin-level expertise gained
through decades of field experience
Empowering employees and promoting best practices produces
a proud and highly motivated workforce
Extensive front-end technical planning and active management
of raw materials, equipment and spare parts drives efficiency
Dedicated logistics team for each fracturing fleet
Regimented fleet maintenance program
Real-time monitoring of critical equipment components, on-site
pump unit maintenance and proactive replacement of wear items
New, high performance equipment enables us to perform the
most demanding, technically complex completions
Focus on long lateral segments and multiple fracturing stages
Modern,
High-Spec
Fleet |
  PAGE
5
Equipment Overview
Our 7 premium hydraulic fracturing fleets have a total capacity of over
240,000 HP
We will take delivery of 2 new fleets with combined capacity of 64,000
HP by first quarter 2013
18 coiled tubing units, majority with 2-inch dimension. Additional six
new coiled tubing units scheduled for deployment to new basins by
first quarter 2013
33 pressure pumping units, primarily double pump
Casedhole acquisition added 58 wireline units and 15 pumpdown units
with 7 additional wireline units scheduled to be deployed by first
quarter 2013
Almost all equipment built within the past 5 years
Vertical integration of Total’s manufacturing capabilities
Invested in Modern, High-Spec Equipment to Grow |
 PAGE
6
Strategy for Continued Growth
Broaden geographic presence
•
Focus on emerging domestic developments and building customer
relationships
•
Evaluate opportunities to expand internationally and build
infrastructure to capitalize on growth in Middle East
•
Leverage reputation for excellence
•
Demonstrate superior execution with new customers in the spot
market
Emphasize R&D across service lines and in manufacturing
Grow completion service offerings
Generate cost efficiencies through further vertical integration and
supply chain extension
•
Significant manufacturing savings (~20%) from Total
•
Expansion into drilling, completion and production fluids
Expand customer base |
 PAGE
7
Hydraulic Fracturing: Expanding our
Customer Base
Contracted
Spot
Over 120,000 HP currently on
“take-or-pay”
contracts with
high minimum hours
Enhances visibility, margins
and revenue
Currently working in the Eagle
Ford and Permian
Contracts with leading
providers:
Demonstrates our significant
efficiencies to new customers
History of successfully
converting spot customers to
contracted customers
Generates opportunities to
expand our customer base
Currently operating in the
Eagle Ford and Permian
New fleets to be to deployed
to the Bakken and to Western
Oklahoma |
  PAGE
8
A leading multi-regional provider of a broad range of high quality
casedhole wireline services with superior track record for efficiency
New, custom-built equipment, including 58 wireline units and
15 pumpdown units
Industry leading EBITDA margins and will be accretive to C&J’s year-
end 2012 earnings and cash flow
Generated third quarter of 2012 revenue of $61.6 million
Acquisition closed June 7, 2012 for a total consideration of ~$273
million
Complementary services, similar operating model and growth
strategy make Casedhole an excellent fit for C&J
Expansion into Wireline Services
with Casedhole Acquisition |
  PAGE
9
Operational Overview
Casedhole Provides Significant Geographic Expansion
C&J leveraging Casedhole’s
foothold in the
most active U.S. shale plays and basins |
 PAGE
10
Capitalizing on Casedhole Acquisition
In addition to providing entry into key target plays (Bakken, Utica)
and strengthening C&J’s position in current operating areas, the
acquisition has had a number of other positive impacts:
•
Wireline services are an important addition for competing with larger
firms
•
Casedhole sales team has extensive domestic and international
experience
•
Bundled completion services have been well-received across our
combined customer base
Enhances product bundling, cross-selling and geographic
expansion opportunities |
  PAGE
11
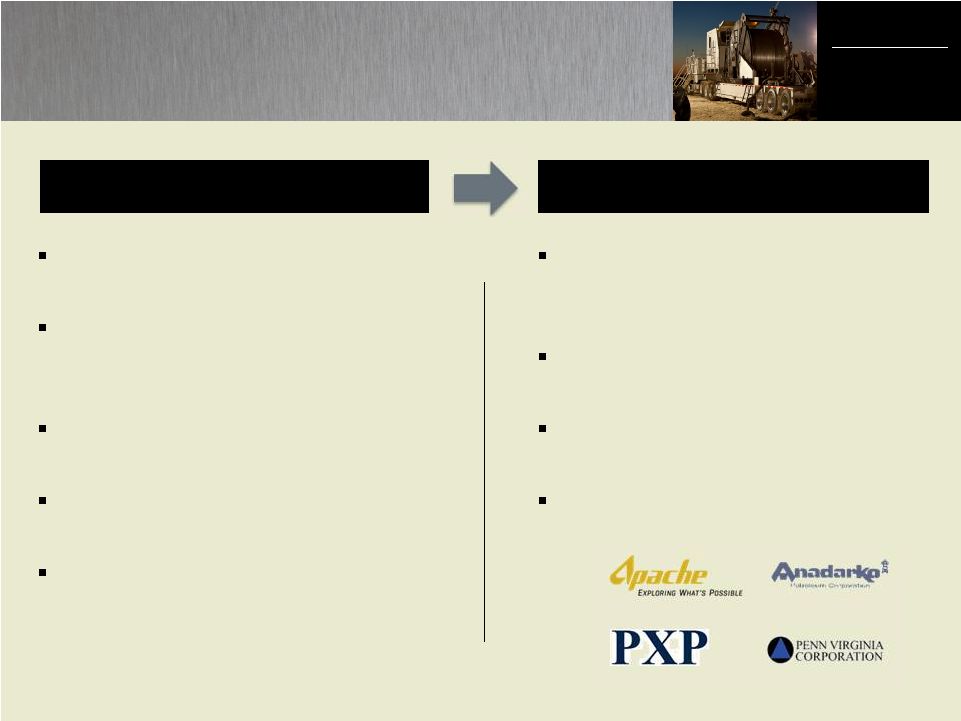
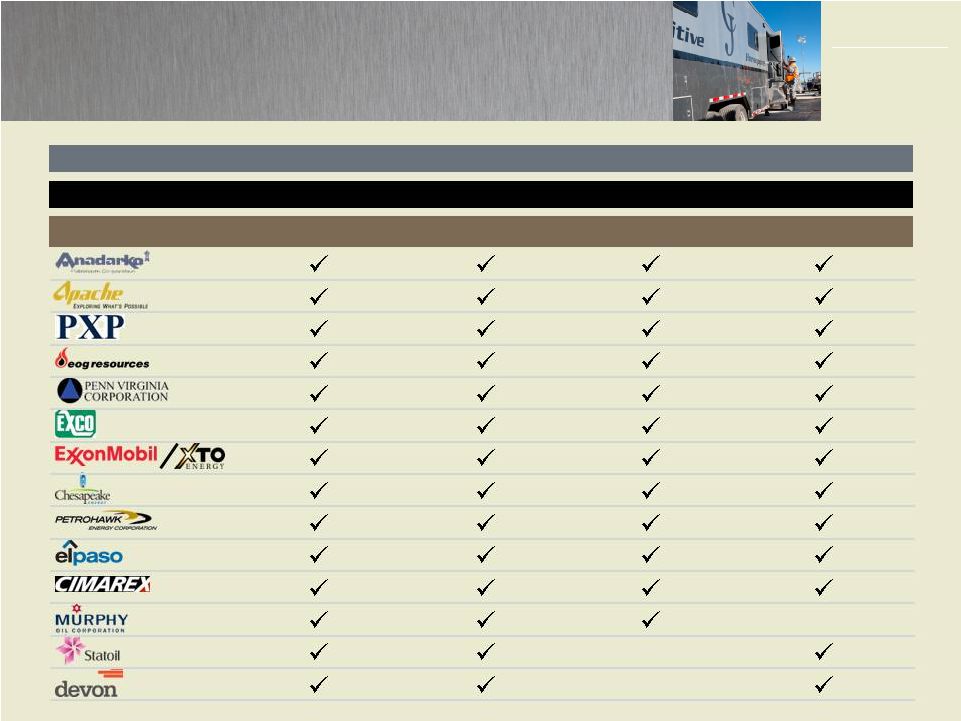
Relationships with Industry Leaders
Service Offerings
Customer
Stand Alone
Pressure Pumping
Coiled Tubing
Hydraulic
Fracturing
Wireline
Large operators have embraced C&J’s
technical capabilities |
  PAGE
12
Demonstrated shorter time per completion permits negotiation of
premium rates with customers
Complex projects with demanding wells drive higher hourly rates
and increased revenues from fluids and proppants
More frac stages per well keep fleets onsite longer, allowing more
pumping hours per month
Less redundant pumping capacity boosts utilization
ROCE
of
42%
in
2010,
57%
in
2011
and
48%
TTM
Q3
2012
(1)
Operating efficiencies generate
higher revenues per unit of horsepower
Operational Strategy Drives Strong
Financial Performance
(1)
TTM Q3 2012 ROCE does not include Casedhole |
  PAGE
13
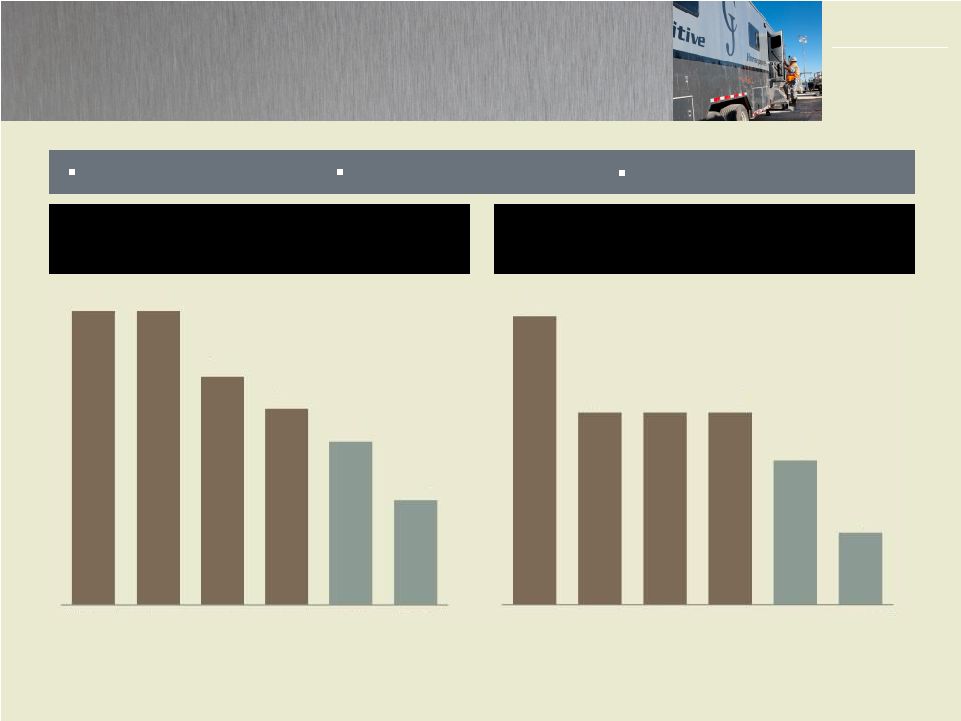
Advances in Completion Techniques
Driving Demand
Source: Goldman Sachs Equity Research
Approximate Horsepower Per Job
(000s of HP)
Typical Number of Fracturing
Stages Per Well
24
16
16
16
12
6
Bakken
Eagle Ford
Granite
Wash
Permian
Other
Unconvent.
Conventional
45
45
35
30
25
16
Eagle Ford
Granite
Wash
Bakken
Permian
Other
Unconvent.
Conventional
Longer laterals
More frac stages
Higher pressure wells |
  PAGE
14
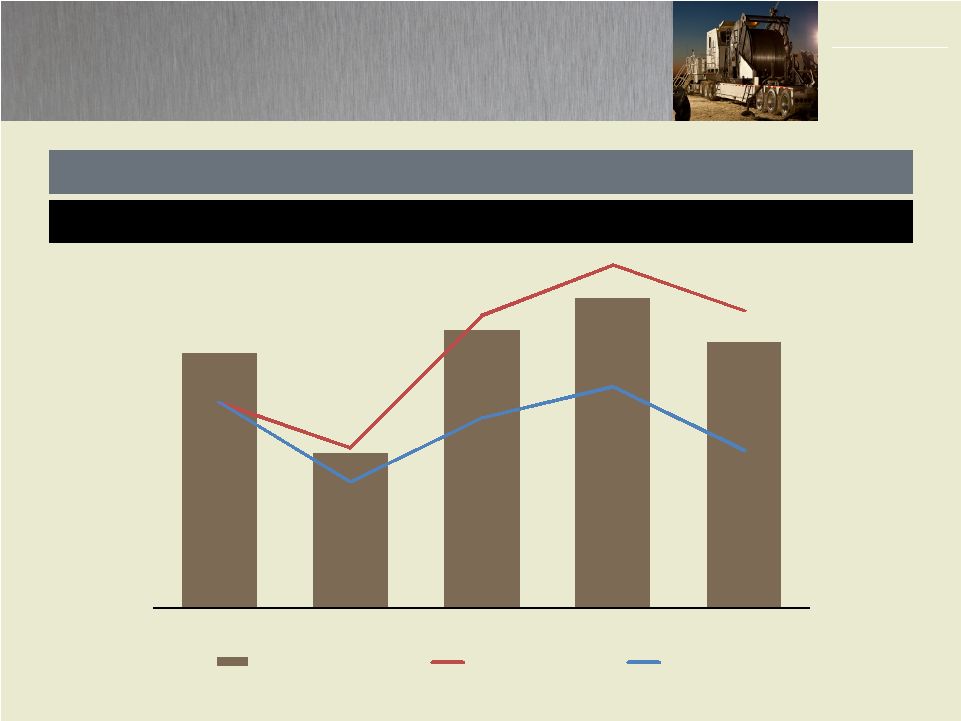
Margins driven by superior execution & utilization, not price
Leading Margin Profile
Adjusted EBITDA Margin
31%
19%
34%
38%
32%
2008
2009
2010
2011
YTD 9/30/12
Adjusted EBITDA
Frac Utilization
Frac Pricing
(2)
(1)
(1)
Average utilization figures indexed for presentation purposes; 2008 reflects Q4
annualized (2)
Reflects an index of selected jobs that management believes are representative of historical
market contract pricing |
 PAGE
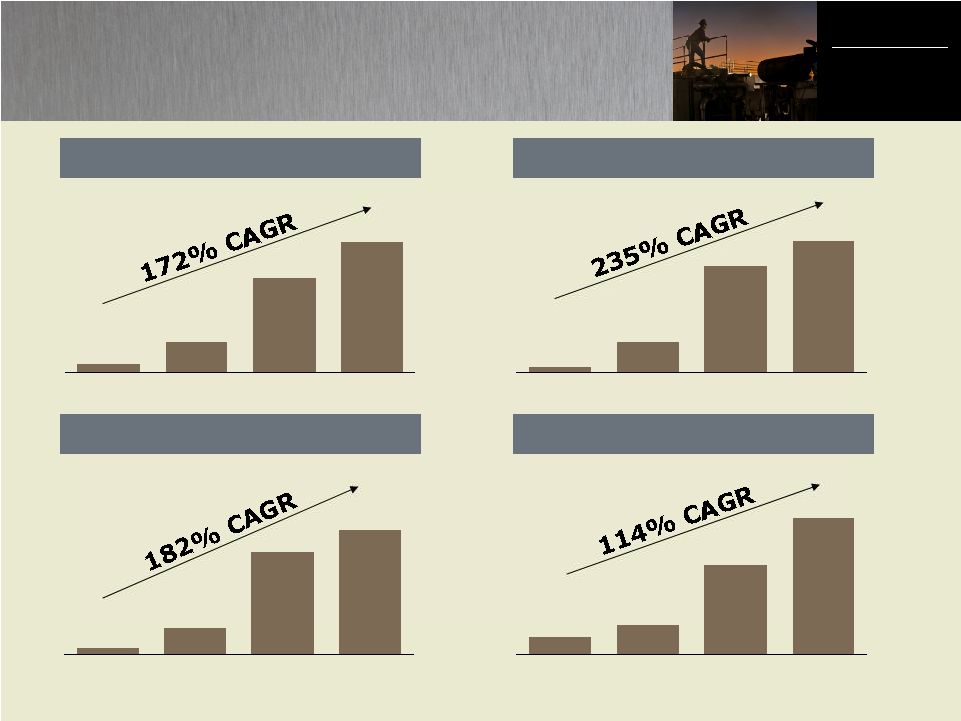
15
$12.1
$44.7
$171.7
$207.9
2009
2010
2011
TTM Q3
34,000
58,000
178,000
274,000
2009
2010
2011
2012E
$67.0
$244.2
$758.5
$1,045.3
2009
2010
2011
TTM Q3
Significant Historical Growth
Growth in HHP
Operating Cash Flow ($MM)
Adjusted EBITDA ($MM)
Revenue ($MM)
$12.6
$82.3
$285.4
$352.0
2009
2010
2011
TTM Q3 |
 PAGE
16
Strong Cash Flow Generation,
Flexible Balance Sheet
$400 million revolving credit facility recently expanded from $200
million with $100 million accordion
$220 million drawn to partially fund Casedhole acquisition
% Growth
Revenue
$758,454
$1,045,288
38%
Adjusted EBITDA
285,388
352,028
23%
Operating Cash Flow
$171,702
$207,863
21%
12/31/2011
6/30/2012
9/30/2012
Cash and Cash Equivalents
$ 46,780
$ 8,278
$ 14,102
Long Term Debt and Capital Lease Obligations
-
224,765
204,225
Shareholder Equity
395,055
505,623
561,059
Total Capitalization
$ 395,055
$ 730,388
$ 765,284
Conservative Balance Sheet
($ in thousands)
Cash Flow Generation
($ in thousands)
Q3 TTM
12/31/2011 |
 PAGE
17
Strategic Overview
Broaden Geographic Presence
Expand Customer Base
Increase Service Offerings
Focus on Research and Technological Developments
Vertical Integration around In-house Manufacturing
and Fluids Development
Generate High Financial Returns for Shareholders |
 C&J Energy
Services, Inc. Appendix |
 PAGE
19
Detailed Historical Financials –
Income Statement
YTD
($ in thousands, except per share amounts)
2008
2009
2010
2011
9/30/2012
Statement of Operations Data
(Unaudited)
Revenue
$62,441
$67,030
$244,157
$758,454
$825,237
Cost of sales
42,401
54,242
154,297
443,556
523,196
Gross profit
20,040
12,788
89,860
314,898
302,041
Selling, general and admin. expenses
8,950
9,533
17,998
52,737
68,467
Loss (gain) on disposal of assets
397
920
1,571
(25)
623
Operating income
10,693
2,335
70,291
262,186
232,951
Other income (expense):
Interest expense, net
(7,419)
(5,099)
(17,663)
(4,221)
(3,191)
Loss on early extinguishment of debt
–
–
–
(7,605)
–
Other income (expense)
(68)
(52)
13
(40)
(120)
Total other expense
(7,487)
(5,151)
(17,650)
(11,866)
(3,311)
Income (loss) before income tax
3,206
(2,816)
52,641
250,320
229,640
Provision (benefit) for income tax
2,085
(386)
20,369
88,341
77,720
Net income (loss)
$1,121
($2,430)
$32,272
$161,979
$151,920
Basic net income (loss) per share
$0.02
-$0.05
$0.70
$3.28
$2.92
Diluted net income (loss) per share
$0.02
-$0.05
$0.67
$3.19
$2.82
Year Ended December 31, |
  PAGE
20
Detailed Historical Financials –
Cash Flow
($ in thousands)
2007
2008
2009
2010
2011
YTD
9/30/12
(Unaudited)
Capital expenditures
$30,152
$21,526
$4,301
$44,473
$140,723
$135,887
Cash flow provided by (used in)
Operating activities
8,377
8,611
12,056
44,723
171,702
177,351
Investing activities
(30,054)
(20,673)
(4,254)
(43,818)
(165,545)
(408,854)
Financing activities
$21,305
$11,921
($6,733)
$734
$37,806
$198,825
Year Ended December 31, |
 PAGE
21
Detailed Historical Financials –
Balance Sheet
($ in thousands)
2007
2008
2009
2010
2011
9/30/12
(Unaudited)
Cash and Cash Equivalents
$250
$109
$1,178
$2,817
$46,780
$14,102
Accounts Receivable, Net
4,409
13,362
12,668
44,354
122,169
189,284
Inventories, Net
581
861
2,463
8,182
45,440
73,587
Property Plant and Equipment, Net
57,991
71,441
65,404
88,395
213,697
398,884
Total Assets
$133,711
$155,212
$150,231
$266,088
$537,849
$1,020,798
Accounts Payable
1,705
6,519
10,598
13,084
57,564
90,604
Long-term Debt and Capital Lease
Obligations
56,773
25,041
60,668
44,817
–
204,225
Total
Stockholders’
Equity
$66,767
$68,099
$65,799
$109,446
$395,055
$561,059
Year Ended December 31, |
  PAGE
22
Adjusted EBITDA Reconciliation
Note: EBITDA and Adjusted EBITDA are
non-GAAP financial measures, and when analyzing C&J’s operating performance,
investors should use EBITDA and Adjusted EBITDA in addition to, and not as an alternative for,
operating income and net income (loss)(each as determined in accordance with GAAP).
C&J uses EBITDA and Adjusted EBITDA as supplemental financial
measures
because
we
believe
they
are
useful
indicators
of
our
performance.
EBITDA
is
defined
as
net
income
(loss)
before interest expense (net), income taxes, depreciation and amortization. Adjusted EBITDA is
EBITDA further adjusted for certain other items which are not indicative of future
performance or cash flow, including loss on early extinguishment of debt and loss
(gain) on sale/disposal of property, plant and equipment. EBITDA and Adjusted EBITDA, as used and defined
by C&J, may not be comparable to similarly titled measures employed by other companies and
are not measures of performance calculated in accordance with GAAP.
($ in thousands)
2008
2009
2010
2011
(Unaudited)
Net income (loss)
$1,121
($2,430)
$32,272
$161,979
$151,920
Interest expense, net
6,908
4,708
17,341
4,221
3,191
Provision (benefit) for income tax
2,085
(386)
20,369
88,341
77,720
Depreciation and amortization
8,836
9,828
10,711
22,919
31,517
EBITDA
$18,950
$11,720
$80,693
$277,460
$264,348
Adjustment to EBITDA
Loss on early extinguishment of debt
–
–
–
7,605
–
Loss (gain) on disposal of assets
397
920
1,571
(25)
623
Cost of Acquisitions
–
–
–
348
853
Adjusted EBITDA
$19,347
$12,640
$82,264
$285,388
$265,824
Year Ended December 31,
YTD
9/30/12 |