Attached files
| file | filename |
|---|---|
| 8-K - CURRENT REPORT OF MATERIAL EVENTS OR CORPORATE CHANGES - Monogram Residential Trust, Inc. | a12-28147_18k.htm |
Exhibit 99.1
|
|
Behringer Harvard Multifamily REIT I, Inc. Update Call 55 Hundred in Arlington, VA |
|
|
Forward-Looking Statements This presentation contains forward-looking statements, including discussion and analysis of the financial condition of Behringer Harvard Multifamily REIT I, Inc. (the “REIT”) and its subsidiaries and other matters. These forward-looking statements are not historical facts but are the intent, belief or current expectations of the REIT’s management based on their knowledge and understanding of the REIT’s business and industry. Words such as “may,” “anticipates,” “expects,” “intends,” “plans,” “believes,” “seeks,” “estimates,” “would,” “could,” “should” and variations of these words and similar expressions are intended to identify forward-looking statements. We intend that such forward-looking statements be subject to the safe harbor provisions created by Section 27A of the Securities Act of 1933, as amended (the “Securities Act”), and Section 21E of the Securities Exchange Act of 1934, as amended (the “Exchange Act”). These statements are not guarantees of future performance and are subject to risks, uncertainties and other factors, some of which are beyond our control, are difficult to predict and could cause actual results to differ materially from those expressed or forecasted in the forward-looking statements. Forward-looking statements that were true at the time made may ultimately prove to be incorrect or false. We caution you not to place undue reliance on forward-looking statements, which reflect the REIT’s management's view only as of the date of this presentation. We undertake no obligation to update or revise forward-looking statements to reflect changed assumptions the occurrence of unanticipated events or changes to future operating results. |
|
|
Forward-Looking Statements Factors that could cause actual results to vary materially from any forward-looking statements made in this presentation include, but are not limited to: absence of a public market for the REIT’s securities; limited operating history; limited transferability and lack of liquidity; risks associated with lending activities ; no assurance that distributions will continue to be made or that any particular rate of distribution will be maintained; until the proceeds from an offering are invested and generating cash flow from operating activities, some or all of the distributions will be paid from other sources, which may be deemed a return of capital, such as from the proceeds of an offering, cash advances by the advisor, cash resulting from a waiver of asset management fees, proceeds from the sales of assets, and borrowings in anticipation of future cash flow from operating activities, which could result in less proceeds to make investments in real estate; reliance on the program’s advisor; payment of significant fees to the advisor and their affiliates ; potential conflicts of interest; lack of diversification in property holdings; Market and economic challenges experienced by the U.S. economy or real estate industry as a whole and the local economic conditions in the markets in which our properties are located; the REIT’s ability to make accretive investments in a diversified portfolio of assets; Availability of cash flow from operating activities for distribution; the REIT’s level of debt and the terms and limitations imposed on the REIT by its debt agreements; the availability of credit generally, and any failure to obtain debt financing at favorable terms or a failure to satisfy the conditions and requirements of that debt; the ability to secure resident leases at favorable rental rates; the ability to raise future capital through equity and debt security offerings and through joint venture arrangements; the ability to retain our executive officers and other key personnel of our advisor, our property manager and their affiliates; conflicts of interest arising out of our relationships with our advisor and its affiliates; unfavorable changes in laws or regulations impacting our business, our assets or our key relationships; factors that could affect our ability to qualify as a real estate investment trust; potential development risks and construction delays; the potential inability to retain current tenants and attract new tenants due to a competitive real estate market; risk that a program’s operating results will be affected by economic and regulatory changes that have an adverse impact on a program’s investments; risks related to investments in distressed properties or debt include possible default under the original loan; unforeseen increases in operating and capital expenses; declines in real estate values; and, lack of availability of due diligence information. These risks may impact the REIT’s financial condition, operating results, returns to its shareholders, and ability to make distributions as stated in the REIT’s offering. Investment in securities of Behringer Harvard real estate programs is subject to substantial risks and may result in the loss of principal invested. Real Estate programs are not suitable for all investors. The forward looking statements should be read in light of these and other risk factors identified in the “Risk Factors” section of the REIT’s Quarterly Report on Form 10-Q for the quarter ended June 30, 2012 and our Annual Report on Form 10-K for the year ended December 31, 2011, as filed with the Securities and Exchange Commission. |
|
|
Questions? During the call, please e-mail questions to: bhreit@behringerharvard.com |

|
|
Today’s Presenters Robert S. Aisner Chief Executive Officer Mark T. Alfieri Chief Operating Officer Howard S. Garfield Chief Financial Officer |

|
|
The Economy: October 2012 Sources: Bureau of Economic Analysis, Bureau of Labor Statistics, Thomson Reuters/University of Michigan Surveys of Consumers Third Quarter 2012 Private sector employment increased by 425,000 jobs in the third quarter 1.4 million private sector jobs added in first 9 months of 2012 Increases in consumer spending, government expenditures and residential investment lead to improved GDP in the third quarter U.S. Q3 2012, GDP +2.0% (advance estimate) up from Q2 revised GDP +1.3% U.S. September Unemployment Rate: 7.8% (October: 7.9% preliminary estimate) Multifamily fundamentals remained strong although rental rate increases began to moderate The Consumer Thomson Reuters/University of Michigan consumer sentiment index: 83.1 (October 2012) - the highest index since September 2007 and up from 78.3 in September 2012 |
|
|
Consumer Sentiment Improving Source: Bloomberg, Thomson-Reuters/University of Michigan Surveys of Consumers Consumer Sentiment (Index) |
|
|
Post-Recession Employment Continues a Slow Recovery |
|
|
Leading Indicators Continue to Signal Slow Improvement Source: Conference Board, National Bureau of Economic Research, Bloomberg Index (2004=100) Recessions The Conference Board Leading Economic Index® The Conference Board Coincident Economic Index® ® Registered Trademark of The Conference Board Inc. |
|
|
Occupancy, Effective Rent Growth Remain Strong But Acceleration Slowing Used with permission from Witten Advisors LLC. Source: Witten Advisors 85% 90% 95% 100% 1Q 1995 1Q 1996 1Q 1997 1Q 1998 1Q 1999 1Q 2000 1Q 2001 1Q 2002 1Q 2003 1Q 2004 1Q 2005 1Q 2006 1Q 2007 1Q 2008 1Q 2009 1Q 2010 1Q 2011 1Q 2012 Occupancy -5% 0% 5% 10% Year-Year Effective Rent Growth Occupancy Rent Growth +4.2% (+4.1% forecast) 95.2% (95.0% forecast) |
|
|
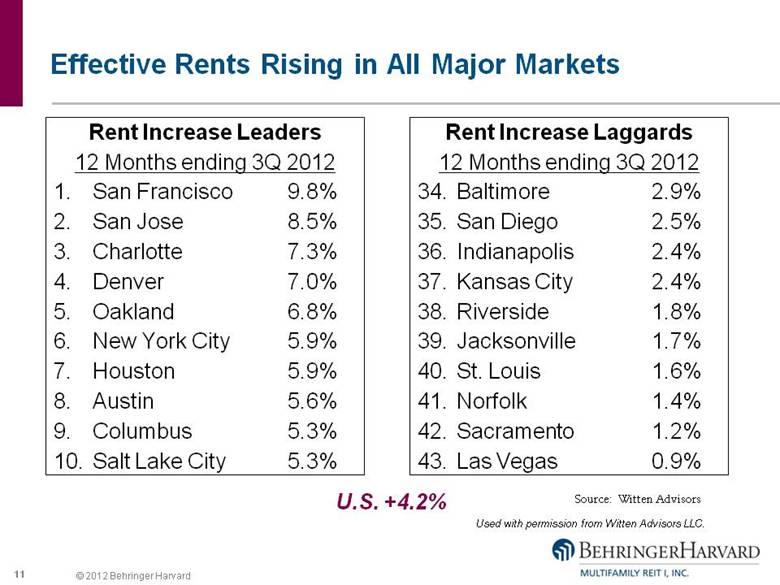
Effective Rents Rising in All Major Markets Used with permission from Witten Advisors LLC. Source: Witten Advisors Rent Increase Leaders 12 Months ending 3Q 2012 San Francisco 9.8% San Jose 8.5% Charlotte 7.3% Denver 7.0% Oakland 6.8% New York City 5.9% Houston 5.9% Austin 5.6% Columbus 5.3% Salt Lake City 5.3% Rent Increase Laggards 12 Months ending 3Q 2012 Baltimore 2.9% San Diego 2.5% Indianapolis 2.4% Kansas City 2.4% Riverside 1.8% Jacksonville 1.7% St. Louis 1.6% Norfolk 1.4% Sacramento 1.2% Las Vegas 0.9% U.S. +4.2% |
|
|
Multifamily Starts Still Moderate and Below Historical Averages Source: calculatedriskblog.com |
|
|
Our Strategy Grow revenues and NOI through proactive property management Continuing to optimize rents and occupancy to grow revenues and NOI Keep focus on reduction or containment of operating costs Deploy additional capital in development program Acquire new investments at cost Higher going-in yield than many stabilized acquisitions Make selective multifamily-related loans Take advantage of good interest rates and funding gaps from traditional sources Make opportunistic acquisitions of multifamily assets Emphasis on urban locations, highly amenitized |
|
|
Continued Favorable Spreads Between Class A Cap Rates and New Development Yields Source: Witten Advisors, Real Capital Analytics, NCREIF Used with permission from Witten Advisors LLC. Estimated New Development Yield (nationwide average) Class A Cap Rate (est.) 4% 5% 6% 7% 8% 9% 1Q01 1Q02 1Q03 1Q04 1Q05 1Q06 1Q07 1Q08 1Q09 1Q10 1Q11 1Q12 Class A Cap Rate Spread over Return on Development Cost |
|
|
Development Pipeline – Equity Investments Property Name Investment Type Location Units Total Costs Incurred as of September 30, 2012 Our Share of Total Estimated Costs (1) Estimated Completion Date The Franklin Delray Wholly owned Delray Beach, FL 180 $17.1 $32.5 Q4 2013 Allegro Phase II Wholly owned Addison, TX 121 $6.0 $16.1 Q2 2013 Renaissance Phase II Joint venture Concord, CA 163 $8.6 $21.0 Q4 2015 Seven Rio Joint venture(2) Austin, TX 221 $7.7 $59.7 Q1 2015 Allusion West University Joint venture(2) Houston, TX 231 $13.3 $41.6 Q2 2014 4110 Fairmount Joint venture(2) Dallas, TX 299 $9.5 $45.3 Q3 2014 Arpeggio Victory Park Joint venture(2) Dallas, TX 377 $16.5 $58.9 Q3 2014 The Muse Museum District Joint venture(2) Houston, TX 270 $12.4 $48.7 Q4 2014 Total 1,862 $91.1 $323.8 (1) We may obtain construction financing. (2) If the development achieves certain milestones primarily related to approved budgets less than maximum amounts, we will reimburse the JV partner for their equity ownership and we will be responsible for all of the development costs. The JV partner would then be entitled to back end interests based on the development achieving certain total returns. Note: These are estimates as of September 30, 2012 and are subject to change. ($ millions) |
|
|
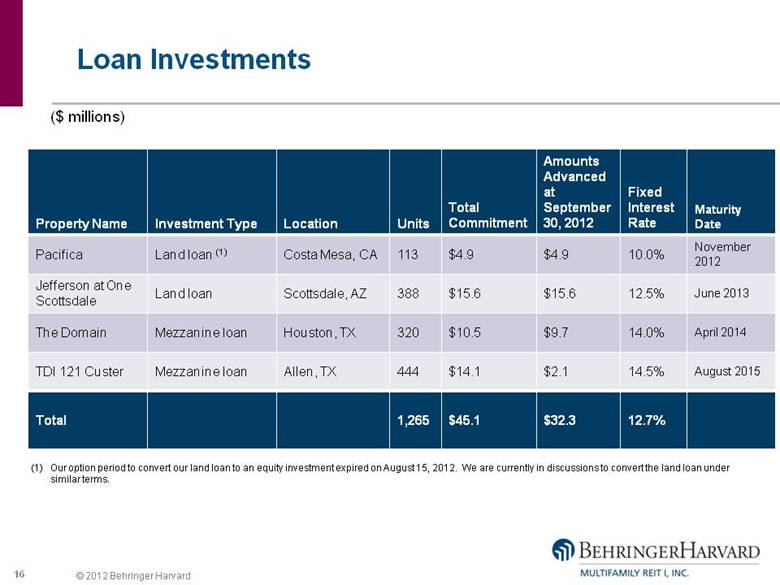
Loan Investments Property Name Investment Type Location Units Total Commitment Amounts Advanced at September 30, 2012 Fixed Interest Rate Maturity Date Pacifica Land loan (1) Costa Mesa, CA 113 $4.9 $4.9 10.0% November 2012 Jefferson at One Scottsdale Land loan Scottsdale, AZ 388 $15.6 $15.6 12.5% June 2013 The Domain Mezzanine loan Houston, TX 320 $10.5 $9.7 14.0% April 2014 TDI 121 Custer Mezzanine loan Allen, TX 444 $14.1 $2.1 14.5% August 2015 Total 1,265 $45.1 $32.3 12.7% (1) Our option period to convert our land loan to an equity investment expired on August 15, 2012. We are currently in discussions to convert the land loan under similar terms. ($ millions) |
|
|
Portfolio Characteristics 48 Investments 36 Operating Properties 8 Developments 4 Mezzanine and Land Loans Data is as of September 30, 2012. Gross GAAP costs reflect 100% of the properties regardless of the Company’s ownership and represent total property costs before depreciation or amortization. |
|
|
Rental Income Growth – YTD 2011 vs 2012 |
|
|
Same Store Revenue Trends There were 31 stabilized comparable properties in the 3rd quarter year over year comparison. There were 35 stabilized comparable properties in the quarterly comparison between 2nd and 3rd quarter 2012. 2.7% Increase |
|
|
Same Store Occupancy Trends There were 31 stabilized comparable properties in the 3rd quarter year over year comparison. There were 35 stabilized comparable properties in the quarterly comparison between 2nd and 3rd quarter 2012. |
|
|
Same Store Net Operating Income* Trends 1% Increase *Reconciliations of Loss from continuing operations to same store Combined Net Operating Income can be found in the Current Report on Form 8-K filed on November 29, 2012 with the Securities and Exchange Commission. A copy of this filing is available on our website www.behringerharvard.com There were 31 stabilized comparable properties in the 3rd quarter year over year comparison. There were 35 stabilized comparable properties in the quarterly comparison between 2nd and 3rd quarter 2012. |
|
|
Performance Comparison with Exchange Listed Apartment REITs Same Store Q3 2012 vs Q2 2012 Q3 2012 vs Q3 2011 Company Name Ticker SS Revenue Change (%) SS Expense Change (%) SS NOI Change (%) SS Revenue Change (%) SS Expense Change (%) SS NOI Change (%) Associated Estates AEC 2.2 3.2 1.5 5.9 5.8 6.0 AIMCO* AIV 1.7 2.8 1.0 4.9 0.5 7.4 Avalon Bay AVB 2.4 4.5 1.5 5.6 2.6 7.1 BRE Properties BRE 2.0 1.9 2.0 5.3 2.4 6.6 Camden CPT 2.6 2.4 2.8 6.6 0.4 10.7 Equity Residential EQR 2.4 3.0 2.0 5.8 2.9 7.4 Essex ESS 2.0 5.4 0.3 7.2 3.0 9.5 Home Properties HME 0.5 -0.7 1.1 4.3 -2.1 8.3 Mid-America MAA 1.5 3.5 0.1 4.2 1.0 6.7 Post Properties PPS 2.7 3.6 2.1 6.7 3.2 9.0 UDR UDR 1.8 3.6 0.9 5.5 3.6 6.4 Lowest 0.5 -0.7 0.1 4.2 -2.1 6.0 Average 2.0 3.0 1.4 5.6 2.1 7.7 Highest 2.7 5.4 2.8 7.2 5.8 10.7 Behringer Harvard Multifamily REIT I 2.7 5.4 1.0 8.8 1.0 14.7 * Reflects AIV’s conventional same store change (excludes affordable component) Source: SNL |
|
|
Total Rental Revenue Note: Includes consolidated and unconsolidated joint venture properties. |
|
|
GAAP Net Loss |
|
|
MFFO* Trends *Reconciliations of Net Loss to FFO to MFFO can be found in the Current Report on Form 8-K filed on November 29, 2012 with the Securities and Exchange Commission. A copy of this filing is available on our website www.behringerharvard.com. **Weighted average number of common shares outstanding were 166.4 million and 155.9 million for the three months ended September 30, 2012 and 2011, respectively, and 165.8 million and 129.1 million for the nine months ended September 30, 2012 and 2011, respectively. |
|
|
MFFO* Year-to-Date 2011 vs. 2012 Comparison Total MFFO (millions) YTD 2011 $24.8 Increases/(decreases) in NOI from: Comparable properties 3.8 Lease ups and new acquisitions 7.7 Dispositions and partial sales (5.8) Mezzanine and land loan interest 1.6 Finance, net including capitalized interest 1.4 G&A, including strategic review (4.9) YTD 2012 $28.6 *Reconciliations of Net Loss to FFO to MFFO can be found in the Current Report on Form 8-K filed on November 29, 2012 with the Securities and Exchange Commission. A copy of this filing is available on our website www.behringerharvard.com. |
|
|
Cash Flow from Operations Year-over-year growth due to: Improvements in operations Consolidation of most properties Excludes proceeds from sales |
|
|
Investment Activity Invested approximately $175 million of equity during first 9 months of 2012 Third quarter activity: $21.0 million in developments $2.1 million in advances on mezzanine and land loans |
|
|
Distributions Declared per Share The regular distribution rate for 2011 through Q1 2012 was 6%, based on a $10 share. Effective April 1, 2012, the regular distribution rate was reduced to 3.5%. A special cash distribution of $0.06 per share was declared in the first quarter of 2012 and was paid on July 11, 2012 to shareholders of record on July 6, 2012. |
|
|
Balance Sheet GAAP Assets of $2.8 billion Liabilities of $1 billion Ratio of total liabilities to assets of 38% Mortgage debt (including the credit facility) of $991 million Leverage ratio (to GAAP gross property cost) of 45% Cash and short-term investments balance at September 30, 2012 of $508 million |
|
|
Debt Financing Refinanced loans West Village: 7 year term Fixed interest at 2.48% Veritas: (1) 7 year term Fixed interest at 2.77% Note: Includes 100% of property debt balances regardless of our ownership. (1) Refinancing occurred subsequent to September 30, 2012. |
|
|
Multifamily REIT I, Inc. Investments Burnham Pointe– Chicago, IL Argenta – San Francisco, CA Uptown Post Oak – Houston, TX The Cameron – Silver Springs, MD Burnham Pointe, Uptown Post Oak, and Grand Reserve Orange are wholly owned communities. Argenta, The Cameron, and Skye 2905 Urban Flats are joint venture owned communities. Grand Reserve Orange– Orange, CT Skye 2905 Urban Flats– Denver, CO |
|
|
Questions? During the call, please e-mail questions to: bhreit@behringerharvard.com |
|
|
Playback Information Representatives may log on to the password protected portion of the Behringer Harvard website (www.behringerharvard.com) for a playback of today’s call Investors may dial toll free (855) 859-2056 and use conference ID 56582693 to access a playback of today’s call Replays will be available until Friday, December 28 |