Attached files
| file | filename |
|---|---|
| 8-K - FORM 8-K - PEABODY ENERGY CORP | btu_8k20121128.htm |
Exhibit 99.1

Energizing The World One BTU At A Time
Goldman Sachs Annual Global Metals & Mining, Steel Conference
Vic Svec Senior Vice President Investor Relations and Corporate Communications
November 28, 2012
Peabody Energy

Statement on Forward-Looking Information Peabody Energy
The use of the words “Peabody,” “the company,” “our” and “we” relate to Peabody Energy Corporation, its subsidiaries and majority-owned affiliates. Certain statements in this presentation are forward-looking within the meaning of Section 27A of the Securities Act of 1933 and Section 21E of the Securities Exchange Act of 1934, as amended, and are intended to come within the safe harbor protection provided by those sections. These forward-looking statements are based on numerous assumptions that the company believes are reasonable, but they are open to a wide range of uncertainties and business risks that may cause actual results to differ materially from expectations as of November 28, 2012. These factors are difficult to accurately predict and may be beyond the company's control. The company does not undertake to update its forward-looking statements. Factors that could affect the company's results include, but are not limited to: global demand for coal, including the seaborne thermal and metallurgical coal markets; price volatility, particularly in higher-margin products and in our trading and brokerage businesses; impact of alternative energy sources, including natural gas and renewables; impact of weather and natural disasters on demand, production and transportation; reductions and/or deferrals of purchases by major customers and ability to renew sales contracts; credit and performance risks associated with customers, suppliers, contract miners, co-shippers, and trading, banks and other financial counterparties; geologic, equipment, permitting and operational risks related to mining; transportation availability, performance and costs; availability, timing of delivery and costs of key supplies, capital equipment or commodities such as diesel fuel, steel, explosives and tires; integration of the acquired Macarthur Coal (PEA-PCI) operations; successful implementation of business strategies; negotiation of labor contracts, employee relations and workforce availability; changes in postretirement benefit and pension obligations and funding requirements; replacement and development of coal reserves; availability, access to and related cost of capital and financial markets; effects of changes in interest rates and currency exchange rates (primarily the Australian dollar); effects of acquisitions or divestitures; economic strength and political stability of countries in which we have operations or serve customers; legislation, regulations and court decisions or other government actions, including, but not limited to, new environmental and mine safety requirements; changes in income tax regulations, sales-related royalties or other regulatory taxes; litigation, including claims not yet asserted; terrorist attacks or threats, impacts of pandemic illness; and other risks detailed in the company's reports filed with the Securities and Exchange Commission (SEC).
Adjusted EBITDA is defined as income from continuing operations before deducting net interest expense, income taxes, asset retirement obligation expense, depreciation, depletion and amortization, and amortization of basis difference associated with equity method investments. Adjusted EBITDA, which is not calculated identically by all companies, is not a substitute for operating income, net income or cash flow as determined in accordance with United States generally accepted accounting principles. Management uses Adjusted EBITDA as a key measure of operating performance and also believes it is a useful indicator of the company's ability to meet debt service and capital expenditure requirements.
11/28/12
2

Peabody Positioned for Success in Challenging Market Conditions Peabody Energy
Long-term coal market view remains favorable Strong growth projected for global met and thermal coal Solid growth expected for PRB and Illinois Basin regions
Near-term view is cautious due to decline in global commodity demand from recession in Europe, sluggish U.S. growth and decelerating growth in China
Peabody responding to macro conditions: Reduced capital spending targets Deferring early-stage expansion projects Aggressively managing costs; $100 million of annual cost savings identified
3

Global Coal Markets

Global Seaborne Demand Increasing, Multiple Countries Growing Imports Peabody Energy
Tonnes in Millions
China Net Coal Imports Thermal Met 0 20 40 60 80 100 120 140 160 180 200 2011 YTD 2012 YTD +43%
India Coal Imports 0 10 20 30 40 50 60 70 80 90 100 2011 YTD 2012 YTD +9%
Europe Coal Imports 0 20 40 60 80 100 2011 YTD 2012 YTD +20%
Source: Peabody Global Analytics, China customs data, India Coal Market Watch, McCloskey.
China net imports through September YTD; India imports through September YTD; Europe imports represent UK, Germany, Italy, Spain, France and Turkey through July YTD.
5

Annual World Coal Demand Expected to Grow ~1.3 Billion Tonnes in Five Years Peabody Energy
Expected Global Coal Demand (Tonnes in Millions) 0 2,000 4,000 6,000 8,000 10,000
2011 7,600 ROW 3,175 China 3,845 India 600
2012P 7,900 ROW 3,140 China 4,090 India 640
2016P 8,900 ROW 3,290 China 4,795 India 840
New coal-fueled generation of 395 GW expected by 2016
Steel production expected to grow 20%, requiring additional 200 MTPY of metallurgical coal
More than 85% of global demand growth in China/India
Seaborne demand expected to grow at 7% CAGR
Source: Peabody Global Analytics.
6

China, India and Brazil Have Large Upside to Steel Intensity Potential Peabody Energy
Emerging countries driving met coal demand through greater urbanization and higher steel consumption
Significant steel increases required to reach levels of developed Asia economies
Stable stage intensity may take 20 - 40 years to reach
Greater imports required to meet met coal needs
2011 Steel Consumption Per Capita Kg/Capita 0 200 400 600 800 1,000 1,200 1,400 India 59 Brazil 173 China 466 Japan 851 Taiwan 924 Korea 1,402 ~1.2 Billion Tonnes of Met Coal Required to Reach Stable Stage Steel Intensity of 900 Kg/Capita
Source: Peabody Global Analytics.
7

China Demand Expected to Grow ~1.0 Billion Tonnes by 2016 Peabody Energy
Imports Expected to Double From 2011 to 2016
~240 GW of coal-fueled generation expected to come on line by 2016 Much of buildout occurring in coastal areas Represents >800 MTPY of thermal coal use over time
China NDRC seeks coking coal production limits for “special and scarce” resource
China reducing domestic production; continuing to close small inefficient mines
China Gross Coal Imports Tonnes in Millions 0 50 100 150 200 250 300 350 400 450 500 2008 37 Met 3 Thermal 34 2009 125 Met 35 Thermal 90 2010 186 Met 47 Thermal 139 2011 223 Met 45 Thermal 178 2012P 280 Met 50 Thermal 230 2016P 400 - 450 Met 100 - 110 Thermal 300 - 350
Source: Peabody Global Analytics, China National Bureau of Statistics. 2008, 2009 imports exclude 'other lignite' product, now reported in total import figures. Projections assume 7.5% annual China GDP growth, as outlined in 12th Five-Year Plan.
8

India Likely to be World's Fastest Growing Coal Importer Peabody Energy
~75 GW of new coal generation expected to start over five years Requires additional ~250 MTPY of thermal coal use over time
Thermal demand expected to outpace production by >150 MTPY within five years Coal India ordered to increase coal imports to meet shortfalls
Recent blackouts highlight need for increased coal imports and improved power grid
Multiple new port projects under way to enable increased imports
India Coal Imports Tonnes in Millions 0 50 100 150 200
2009 74 Met 31 Thermal 43 2010 100 Met 37 Thermal 63 2011 118 Met 30 Thermal 88 2012P 130 Met 30 Thermal 100 2016P 200 - 220 Met 50 - 60 Thermal 150 - 160
Source: Peabody Global Analytics and other industry sources.
9

Global Seaborne Supply: Australia and Indonesia Expected to Lead Growth Peabody Energy
2011 Total Exports Metallurgical Thermal 0 50 100 150 200 250 300 350
Indonesia 319 Australia 281 U.S. 93 Russia 88 Colombia 77 South Africa 67 Canada 33 Mongolia 24 China 14 Other 44 Total 2011 Exports: 1,040 Million Tonnes
2011-2016 Growth 385 - 515 Indonesia 130 - 160 Australia 140 - 160 U.S. 30 - 50 Russia 15 - 25 Colombia 35 - 45 South Africa 10 - 15 Canada 0 - 5 Mongolia 35 - 50 China (15) - (5) Other 5 - 10
2016 Exports 1,425 - 1,555 Indonesia 450 - 480 Australia 420 - 440 U.S. 120 - 140 Russia 105 - 115 Colombia 110 - 120 South Africa 75 - 80 Canada 35 - 40 Mongolia 60 - 75 China 0 - 10 Other 50 - 55
Source: Peabody Global Analytics; McCloskey and Wood Mackenzie. Data shown in million tonnes. Excludes land-based exports, except Mongolia.
10

U.S. Coal Markets: Rising Natural Gas Prices and Strong Burn Driving Recovery Peabody Energy
Expect 2013 coal use to rebound by 40 - 60 million tons
PRB and ILB benefit as gas prices move above $2.50 - $2.75 and $3.25 - $3.50, respectively
CAPP coal requires gas prices of $4.50 or higher to be competitive
U.S. Natural Gas Prices ($/mmBtu)
$1 $2 $3 $4 $5 2011 2012 2013 2014 2015 2016 2017 Futures ILB Competitive PRB Competitive
U.S. Monthly Inventory Change (Tons in Millions) -25 -20 -15 -10 -5 0 5 10 15 20 25
5 - Year Average 2012 Q1 Q2 Q3
Source: Pricing per Bloomberg, CME Group; prices quoted as of 11/20/12. Inventory data per EIA, Peabody Global Analytics.
11

U.S. Coal Plant Retirements Largely Offset by New Plants, Capacity Utilization Peabody Energy
GW of Coal Capacity & Related Coal Burn Expected to Retire 2011 - 2016
1 GW 3 MT 2 GW 3 MT 3 GW 8 MT 2 GW 5 MT 5 GW 9 MT 10 GW 11 MT 5 GW 5 MT 11 GW 13 MT 1 GW 1 MT
Cumulative Generation Changes (Tons in Millions)
New Generation SPRB / ILB 30 Other 10 Total 40
Retirements SPRB / ILB (25) Other (35) Total (60)
Capacity Utilization & Switching SPRB / ILB 45 Other (45) Total -
Demand Changes SPRB / ILB 50 Other (70) Total (20)-
Majority of 40 GW of Expected Retirements in Eastern U.S.
Source: Peabody Global Analytics and Ventyx.
12

Significant Demand Shift Toward PRB and Illinois Basin Peabody Energy
PRB advantage Low end of cost curve Primary source for new plants Benefits from basin switching Asian export potential
Illinois Basin advantage Major source for new plants Benefits from new scrubbers and basin switching Transport advantage to Gulf
CAPP Challenged to compete with natural gas generation and PRB/Illinois Basin
Expected U.S. Production Change 2011 - 2016 (Tons in Millions)
ILB SPRB CO Other CAPP -80 -60 -40 -20 0 20 40
Source: Peabody Global Analytics and industry reports.
13
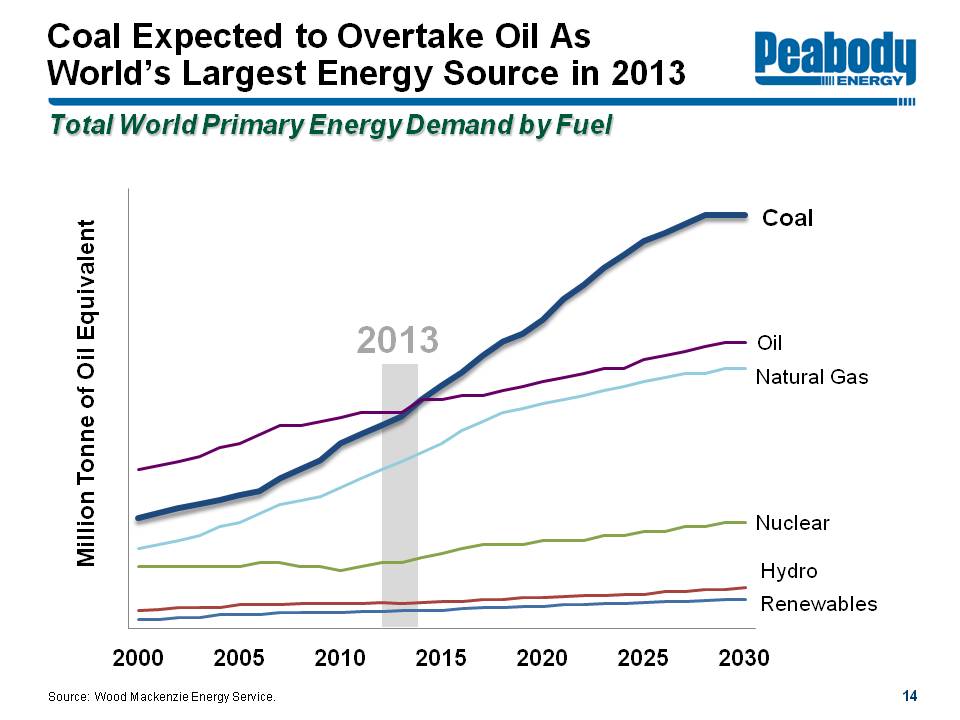
Coal Expected to Overtake Oil as World's Largest Energy Source in 2013 Peabody Energy
Total World Primary Energy Demand by Fuel
Million Tonne of Oil Equivalent
2000 2005 2010 2013 2015 2020 2025 2030
Coal Oil Natural Gas Nuclear Hydro Renewables
Source: Wood Mackenzie Energy Service.
14

Peabody's Global Platform

Peabody's Global Platform Provides Growth and Earnings Diversification Peabody Energy
World's Only Global Pure-Play Coal Investment
London Essen New Delhi Urumqi Ulaanbaatar Beijing Singapore Jakarta Balikpapan NCIG St. Louis DTA
International Offices Brisbane Newcastle London Ulaanbaatar Essen New Delhi Beijing Urumqi Singapore Jakarta Balikpapan
Mining Operations Position Sales Reserves
S. PRB #1 148 2.7 Midwest #1 30 3.6 Southwest #1 18 1.1 Colorado #1 8 0.2 Australia #5 25 1.2
Mining position and sales based on 2011 reported sales volumes in millions of tons. Reserves based on 2011 10-K filing in billions of tons.
16

Peabody Consistently Delivers Superior Margins Peabody Energy
Peabody's Gross Margins Average Nearly ~30% Above NYSE Peers
Gross Margins 2010 33% 25% 2011 32% 25% YTD 2012 29% 22%
Peabody Mining Operations U.S. Peer Average
Leading producer in low-cost regions in the U.S. with high-margin operations in Australia
Global expansion drives earnings diversification
Peabody Australia results include impact of PEA-PCI since acquisition. U.S. peers include ACI, ANR, CNX, CLD, PCX, WLT, ICO, and MEE in years of operation. YTD 2012 results shown through September 30, 2012.
17

Peabody U.S. Platform: Continued Focus on Success at Low End of Cost Curve Peabody Energy
Continued focus on cost containment: reducing overtime, use of contractors, discretionary spending
Lowering 2013 capital for Twentymile Sage Creek and Gateway North extensions while matching new volumes with current production profile
Maintaining prudent contracting strategy 80% - 85% priced for 2013 based on 2012 production levels
Focusing on expanding exports of PRB, Illinois Basin and Colorado coals through Canada, Gulf and East coasts Targeting 10 million tons of 2012 exports following ~6 million tons in 2011
Priced position as of October 22, 2012.
18

Peabody's Australia Platform Expanding to Meet Rising Asian Market Demand Peabody Energy
Met Thermal Port
Queensland Burton North Goonyella Eaglefield Coppabella Moorvale Millennium Middlemount Abbot Point Dalrymple Bay Gladstone Brisbane
New South Wales Wambo Underground Wilpinjong Wambo Open Cut Metropolitan PWCS NCIG Port Kembla
Targeted Australia Volumes Tons in Millions 0 10 20 30 40
2005 2.5 5.8 8.3 2011 5.9 10.1 9.3 25.3 2012P ~7 11 - 12 13 - 14 31 - 33 2015P 8 12 20 40
Domestic Thermal Seaborne Thermal Met
Peabody Targeting 40 Million Tons by 2015
Middlemount attributable ownership tonnages included in 2015 targets.
19

Peabody Advancing Late-Stage Projects to Completion Peabody Energy
Wilpinjong expansion completed on time and on budget Expanded BTU's lowest-cost Australia thermal mine capacity by 30% to ~13 MTPY
Millennium expansion near completion Doubling mine capacity to ~3 - 4 MTPY Includes SHCC/PCI and adding HCC to the mine mix
Burton widening/extension nearing completion Moving to new HCC mining area in Q4 Extends mine life and expands production
North Goonyella longwall top coal caving technology to add HQHCC volumes
Eaglefield co-development extending mine life, HQHCC production
20

Re-Evaluating Future Project Portfolio to Match Market Demand Peabody Energy
Metropolitan modernization under way; expansion being reassessed
Codrilla Mine development under review Mine to add 2 - 3 MTPY (attributable ownership) to LV PCI platform Undergoing drilling and added value engineering
Wambo Open-Cut expansion now outside of planning horizon
21

Acquisition Integration Remains on Track Peabody Energy
Upgrading operations to Peabody standards Increasing equipment utilization, efficiencies and prep plant yields Significant improvement in monthly overburden removal rates at Coppabella, Moorvale
Synergies on track: marketing, blending, logistics, operating, technical and financial areas $60 to $80 million per year on target to begin in 2013 Total synergy NPV target of $750 million to $1 billion over time
Exploration portfolio more robust than originally expected
22

Acquisition Significantly Strengthens Bowen Basin Position Peabody Energy
Peabody Energy Australia Bowen Basin Positioning Before Acquisition
Existing Mines: North Goonyella Eaglefield Burton Millennium
North Goonyella Mine Eaglefield Mine Burton Mine Coppabella Nebo Millenium Mine Saraji Norwich Park Middlemount
100km
23

Acquisition Significantly Strengthens Bowen Basin Position Peabody Energy
New Bowen Basin Portfolio
New mines include: Coppabella Moorvale Middlemount
Synergies between Moorvale and Millennium
Developmental complex with potential for centralized infrastructure
Additional projects with coking coal and PCI potential, including West Burton tenement
North Burton West Burton North Goonyella Mine Eaglefield Mine Burton Mine West Walker Cooper Creek Nebo Coppabella Mine Coppabella Moorvale West Moorvale Mine Millenium Mine Olive Downs North Olive Downs South Yeerun Codrilla Codrilla South Amaroo Vermont East Willunga Middlemount Mine Saraji Norwich Park Middlemount
100km
24

Peabody Focused on Strengthening the Balance Sheet Peabody Energy
Continued focus on deleveraging Debt-to-capital at 52% More than $380 million in debt repayments YTD No significant maturities until 2015 Best coal company credit rating
Significant liquidity of $2.2 billion at September 30
Capital spending discipline Reduced target capex to $1.0 billion - $1.1 billion for 2012 Low maintenance capex needs of $1.25 - $1.75 per ton Meaningfully lower capex expected for 2013
Total Debt-to-Capital % 20 30 40 50 60
2006* 57 2007 52 2008 47 2009 42 2010 37 2011 55 Q3 2012 52
*Ratio reflects post-Excel acquisition. Debt-to-capital ratio as of 9/30/2012. YTD repayments as of 11/19/2012.
25

Peabody Positioned for Success in All Market Conditions Peabody Energy
Rising metallurgical and thermal coal exports from Australia
Leading position in low-cost PRB and Illinois Basin
Managing through near-term headwinds and tempering growth projects
Aggressive focus on cost control across platform
Solid operating cash flows, low maintenance capex needs and focus on debt reduction
26

Energizing The World One BTU At A Time
Goldman Sachs Annual Global Metals & Mining, Steel Conference
Vic Svec Senior Vice President Investor Relations and Corporate Communications
November 28, 2012
Peabody Energy