Attached files
| file | filename |
|---|---|
| EX-23.2 - EXHIBIT 23.2 - PBF Energy Inc. | d430958dex232.htm |
| EX-23.4 - EXHIBIT 23.4 - PBF Energy Inc. | d430958dex234.htm |
| EX-23.1 - EXHIBIT 23.1 - PBF Energy Inc. | d430958dex231.htm |
| EX-23.3 - EXHIBIT 23.3 - PBF Energy Inc. | d430958dex233.htm |
| EX-10.28 - EXHIBIT 10.28 - PBF Energy Inc. | d430958dex1028.htm |
Table of Contents
As filed with the Securities and Exchange Commission on November 27, 2012
Registration Statement No. 333-177933
UNITED STATES
SECURITIES AND EXCHANGE COMMISSION
Washington, D.C. 20549
Amendment No. 6
to
FORM S-1
REGISTRATION STATEMENT
UNDER
THE SECURITIES ACT OF 1933
PBF ENERGY INC.
(Exact name of Registrant as specified in its charter)
| Delaware | 2911 | 45-3763855 | ||
| (State or other jurisdiction of incorporation or organization) |
(Primary Standard Industrial Classification Code Number) |
(I.R.S. Employer Identification Number) |
One Sylvan Way, Second Floor
Parsippany, New Jersey 07054
Telephone: (973) 455-7500
(Name, address, including zip code, and telephone number, including area code, of Registrant’s principal executive offices)
Michael D. Gayda
President
PBF Energy Inc.
One Sylvan Way, Second Floor
Parsippany, New Jersey 07054
Telephone: (973) 455-7500
(Name, address, including zip code, and telephone number, including area code, of agent for service)
Copies to:
| Todd E. Lenson, Esq. | Jeffrey Dill, Esq. | William M. Hartnett, Esq. | ||
| Jordan M. Rosenbaum, Esq. |
PBF Energy Inc. | Douglas S. Horowitz, Esq. | ||
| Stroock & Stroock & Lavan LLP 180 Maiden Lane New York, New York 10038 Telephone: (212) 806-5400 |
Senior Vice President, General Counsel One Sylvan Way, Second Floor Parsippany, New Jersey 07054 Telephone: (973) 455-7500 |
Cahill Gordon & Reindel LLP 80 Pine Street New York, New York 10005 Telephone: (212) 701-3000 |
Approximate date of commencement of proposed sale to the public: As soon as practicable after the effective date of this Registration Statement.
If any of the securities being registered on this Form are to be offered on a delayed or continuous basis pursuant to Rule 415 under the Securities Act of 1933, check the following box. ¨
If this Form is filed to register additional securities for an offering pursuant to Rule 462(b) under the Securities Act, check the following box and list the Securities Act registration statement number of the earlier effective registration statement for the same offering. ¨
If this Form is a post-effective amendment filed pursuant to Rule 462(c) under the Securities Act, check the following box and list the Securities Act registration statement number of the earlier effective registration statement for the same offering. ¨
If this Form is a post-effective amendment filed pursuant to Rule 462(d) under the Securities Act, check the following box and list the Securities Act registration statement number of the earlier effective registration statement for the same offering. ¨
Indicate by check mark whether the Registrant is a large accelerated filer, an accelerated filer, a non-accelerated filer, or a smaller reporting company. See definitions of “large accelerated filer,” “accelerated filer” and “smaller reporting company” in Rule 12b-2 of the Exchange Act. (Check one):
| Large Accelerated Filer ¨ | Accelerated Filer ¨ | Non-accelerated Filer þ | Smaller Reporting Company ¨ | |||
| (Do not check if a smaller reporting company) | ||||||
CALCULATION OF REGISTRATION FEE
|
| ||||
| Title of each class of securities to be registered |
Proposed maximum aggregate offering price (1)(2) |
Amount of registration fee | ||
| Class A common stock, par value $0.001 per share |
$100,000,000 | $11,460.00(3) | ||
|
| ||||
|
| ||||
| (1) | Estimated solely for the purpose of calculating the registration fee pursuant to Rule 457(o) under the Securities Act. |
| (2) | Includes shares of Class A common stock subject to underwriters’ option to purchase additional shares of Class A common stock. |
| (3) | Previously paid. |
The Registrant hereby amends this registration statement on such date as may be necessary to delay its effective date until the Registrant shall file a further amendment which specifically states that this registration statement shall thereafter become effective in accordance with Section 8(a) of the Securities Act, or until the registration statement shall become effective on such date as the Securities and Exchange Commission, acting pursuant to said Section 8(a), may determine.
Table of Contents
The information in this preliminary prospectus is not complete and may be changed. We may not sell these securities until the registration statement filed with the Securities and Exchange Commission is effective. This preliminary prospectus is not an offer to sell these securities and it is not soliciting an offer to buy these securities in any jurisdiction where the offer or sale is not permitted.
Prospectus (Subject to completion)
Issued November 27, 2012
Shares

Class A Common Stock
PBF Energy Inc. is offering shares of its Class A common stock. We intend to use a significant portion of the net proceeds from this offering to purchase equity interests in our business from certain of our existing owners. Prior to this offering, there has been no public market for our Class A common stock. The initial public offering price of our Class A common stock is expected to be between $ and $ per share.
Immediately following this offering, the holders of our Class A common stock will collectively own 100% of the economic interests in PBF Energy Inc., and have % of the voting power of PBF Energy Inc. The holders of our Class B common stock will have the remaining % of the voting power of PBF Energy Inc. As a result, we expect to be a “controlled company” within the meaning of the corporate governance standards of the New York Stock Exchange.
We have applied to list our Class A common stock on the New York Stock Exchange under the symbol “PBF”.
Investing in our Class A common stock involves risks. See “Risk Factors” beginning on page 17.
Price $ Per Share
| Price to Public |
Underwriting Discounts and Commissions |
Proceeds to Company | ||||
| Per Share |
$ | $ | $ | |||
| Total |
$ | $ | $ |
We have granted the underwriters a 30-day option to purchase up to additional shares of Class A common stock on the same terms as set forth above. See the section of this prospectus entitled “Use of Proceeds” and “Underwriting.”
Neither the Securities and Exchange Commission nor any state securities commission has approved or disapproved of these securities nor passed upon the accuracy or adequacy of this prospectus. Any representation to the contrary is a criminal offense.
The underwriters expect to deliver the shares on or about , 2012.
| Citigroup |
Morgan Stanley | |
| Credit Suisse |
Deutsche Bank Securities | |
| UBS Investment Bank | Barclays | |||
Table of Contents
Until , 2012 (25 days after the commencement of this offering), all dealers that buy, sell or trade shares of our Class A common stock, whether or not participating in this offering, may be required to deliver a prospectus. This delivery requirement is in addition to the obligation of dealers to deliver a prospectus when acting as underwriters and with respect to their unsold allotments or subscriptions.
We have not authorized anyone to provide any information other than that contained in this prospectus or in any free writing prospectus prepared by or on behalf of us. We take no responsibility for, and can provide no assurance as to the reliability of, any other information that others may give you. This prospectus is an offer to sell only the shares offered hereby, but only under circumstances and in jurisdictions where it is lawful to do so.
For investors outside the United States: we have not and the underwriters have not done anything that would permit this offering or possession or distribution of this prospectus in any jurisdiction where action for that purpose is required, other than in the United States. Persons outside the United States who come into possession of this prospectus must inform themselves about, and observe any restrictions relating to, the offering of the shares of Class A common stock and the distribution of this prospectus outside the United States.
Unless otherwise indicated or the context otherwise requires, all financial data presented in this prospectus reflects the consolidated business and operations of PBF Energy Inc. and its consolidated subsidiaries, and has been prepared in accordance with generally accepted accounting principles in the United States of America, or GAAP.
i
Table of Contents
Unless otherwise noted or indicated by context, the following terms used in this prospectus have the following meanings:
“API gravity” refers to American Petroleum Institute gravity.
“ASCI” refers to the Argus Sour Crude Index, a pricing index used to approximate market prices for sour, heavy crude oil.
“Bakken” refers to both a crude oil production region generally covering North Dakota, Montana and Western Canada, and the crude oil that is produced in that region.
“barrel” refers to a common unit of measure in the oil industry, which equates to 42 gallons.
“blendstocks” refers to various compounds that are combined with gasoline or diesel from the crude oil refining process to make finished gasoline and diesel; these may include natural gasoline, FCC unit gasoline, ethanol, reformate or butane, among others.
“bpd” refers to an abbreviation for barrels per day.
“CAPP” refers to the Canadian Association of Petroleum Producers.
“catalyst” refers to a substance that alters, accelerates, or instigates chemical changes, but is not produced as a product of the refining process.
“CBOB” refers to conventional blendstock for oxygenate blending.
“coke” refers to a coal-like substance that is produced from heavier crude oil fractions during the refining process.
“complexity” refers to the number, type and capacity of processing units at a refinery, measured by the Nelson Complexity Index, which is often used as a measure of a refinery’s ability to process lower quality crude in an economic manner.
“crack spread” refers to a simplified calculation that measures the difference between the price for light products and crude oil. For example, we reference (a) the 2-1-1 crack spread, which is a general industry standard that approximates the per barrel refining margin resulting from processing two barrels of crude oil to produce one barrel of gasoline and one barrel of heating oil or ULSD, and (b) the 4-3-1 crack spread, which is a benchmark utilized by our Toledo refinery that approximates the per barrel refining margin resulting from processing four barrels of crude oil to produce three barrels of gasoline and one-half barrel of jet fuel and one-half barrel of ULSD.
“Dated Brent” refers to Brent blend oil, a light, sweet North Sea crude oil, characterized by an API gravity of 38° and a sulfur content of approximately 0.4 weight percent that is used as a benchmark for other crude oils.
“distillates” refers primarily to diesel, heating oil, kerosene and jet fuel.
“downstream” refers to the downstream sector of the energy industry generally describing oil refineries, marketing and distribution companies that refine crude oil and sell and distribute refined products. The opposite of the downstream sector is the upstream sector, which refers to exploration and production companies that search for and/or produce crude oil and natural gas underground or through drilling or exploratory wells.
ii
Table of Contents
“EPA” refers to the United States Environmental Protection Agency.
“ethanol” refers to a clear, colorless, flammable oxygenated liquid. Ethanol is typically produced chemically from ethylene, or biologically from fermentation of various sugars from carbohydrates found in agricultural crops and cellulosic residues from crops or wood. It is used in the United States as a gasoline octane enhancer and oxygenate.
“feedstocks” refers to crude oil and partially refined petroleum products that are processed and blended into refined products.
“FCC” refers to fluid catalytic cracking.
“FCU” refers to fluid coking unit.
“FOB” refers to free on board, a transportation term that pertains to the port of loading. The buyer assumes responsibility for the goods at the port of loading and is responsible for freight transport, insurance, and any other costs associated with moving goods to their final destination port.
“GHG” refers to greenhouse gas.
“Group I base oils or lubricants” refers to conventionally refined products characterized by a sulfur content less than 0.03% with a viscosity index between 80 and 120. Typically, these products are used in a variety of automotive and industrial applications.
“heavy crude oil” refers to a relatively inexpensive crude oil with a low API gravity characterized by high relative density and viscosity. Heavy crude oils require greater levels of processing to produce high value products such as gasoline and diesel.
“KV” refers to Kilovolts.
“light crude oil” refers to a relatively expensive crude oil with a high API gravity characterized by low relative density and viscosity. Light crude oils require lower levels of processing to produce high value products such as gasoline and diesel.
“light products” refers to the group of refined products with lower boiling temperatures, including gasoline and distillates.
“light-heavy differential” refers to the price difference between light crude oil and heavy crude oil.
“LPG” refers to liquefied petroleum gas.
“Maya” refers to Maya crude oil, a heavy, sour crude oil characterized by an API gravity of approximately 22° and a sulfur content of approximately 3.3 weight percent that is used as a benchmark for other heavy crude oils.
“MLP” refers to master limited partnership.
“MMbbls” refers to an abbreviation for million barrels.
“MMBTU” refers to million British thermal units.
“MMSCFD” refers to million standard cubic feet per day.
“MSCG” refers to Morgan Stanley Capital Group Inc.
iii
Table of Contents
“MW” refers to Megawatt.
“Nelson Complexity Index” refers to the complexity of an oil refinery as measured by the Nelson Complexity Index, which is calculated on an annual basis by the Oil and Gas Journal. The Nelson Complexity Index assigns a complexity factor to each major piece of refinery equipment based on its complexity and cost in comparison to crude distillation, which is assigned a complexity factor of 1.0. The complexity of each piece of refinery equipment is then calculated by multiplying its complexity factor by its throughput ratio as a percentage of crude distillation capacity. Adding up the complexity values assigned to each piece of equipment, including crude distillation, determines a refinery’s complexity on the Nelson Complexity Index. A refinery with a complexity of 10.0 on the Nelson Complexity Index is considered ten times more complex than crude distillation for the same amount of throughput.
“NYH” refers to the New York Harbor market value of petroleum products.
“PADD 1” refers to the Petroleum Administration for Defense District 1 region of the United States, which covers the following states: Connecticut, Delaware, District of Columbia, Florida, Georgia, Maine, Maryland, Massachusetts, New Hampshire, New Jersey, New York, North Carolina, Pennsylvania, Rhode Island, South Carolina, Vermont, Virginia and West Virginia.
“PADD 2” refers to the Petroleum Administration for Defense District 2 region of the United States, which covers the following states: Illinois, Indiana, Iowa, Kansas, Kentucky, Michigan, Minnesota, Missouri, Nebraska, North Dakota, Ohio, Oklahoma, South Dakota, Tennessee and Wisconsin.
“Platts” refers to Platts, a division of The McGraw-Hill Companies.
“PPM” refers to parts per million.
“RBOB” refers to reformulated blendstock for oxygenate blending.
“refined products” refers to petroleum products, such as gasoline, diesel and jet fuel, that are produced by a refinery.
“sour crude oil” refers to a crude oil that is relatively high in sulfur content, requiring additional processing to remove the sulfur. Sour crude oil is typically less expensive than sweet crude oil.
“Sunoco” refers to Sunoco, Inc. (R&M).
“sweet crude oil” refers to a crude oil that is relatively low in sulfur content, requiring less processing to remove the sulfur than sour crude oil. Sweet crude oil is typically more expensive than sour crude oil.
“Syncrude” refers to a blend of Canadian synthetic oil, a light, sweet crude oil, typically characterized by an API gravity between 30° and 32° and a sulfur content of approximately 0.1-0.2 weight percent.
“throughput” refers to the volume processed through a unit or refinery.
“turnaround” refers to a periodically required shutdown and comprehensive maintenance event to refurbish and maintain a refinery unit or units that involves the inspection of such units and occurs generally on a periodic cycle.
“ULSD” refers to ultra-low-sulfur diesel.
iv
Table of Contents
“WCS” refers to Western Canadian Select, a heavy, sour crude oil blend typically characterized by an API gravity between 20° and 22° and a sulfur content of approximately 3.5 weight percent that is used as a benchmark for heavy Western Canadian crude oil.
“WTI” refers to West Texas Intermediate crude oil, a light, sweet crude oil, typically characterized by an API gravity between 38° and 40° and a sulfur content of approximately 0.3 weight percent that is used as a benchmark for other crude oils.
“WTS” refers to West Texas Sour crude oil, a sour crude oil characterized by an API gravity between 30° and 33° and a sulfur content of approximately 1.28 weight percent that is used as a benchmark for other sour crude oils.
“yield” refers to the percentage of refined products that is produced from crude oil and other feedstocks.
v
Table of Contents
This summary highlights selected information contained elsewhere in this prospectus and may not contain all of the information that may be important to you. You should read this entire prospectus carefully, including the information set forth in “Risk Factors” and our financial statements and related notes included elsewhere in this prospectus before making an investment decision. In this prospectus, unless the context otherwise requires, references to the “Company,” “we,” “our,” “us” or “PBF” refer (1) prior to the consummation of the Offering Transactions described under “Organizational Structure—Offering Transactions,” to PBF Energy Company LLC, or PBF LLC, and its consolidated subsidiaries, including PBF Holding Company LLC, or PBF Holding, and (2) after the Offering Transactions described under “Organizational Structure—Offering Transactions,” to PBF Energy Inc., or PBF Energy, and, in each case, unless the context otherwise requires, its consolidated subsidiaries, including PBF LLC, PBF Holding, PBF Investments LLC, or PBF Investments, Toledo Refining Company LLC, or Toledo Refining, Paulsboro Refining Company LLC, or Paulsboro Refining, and Delaware City Refining Company LLC, or Delaware City Refining.
Our Company
We are one of the largest independent petroleum refiners and suppliers of unbranded transportation fuels, heating oil, petrochemical feedstocks, lubricants and other petroleum products in the United States. We were formed in 2008 to pursue acquisitions of crude oil refineries and downstream assets in North America. We currently own and operate three domestic oil refineries and related assets, which we acquired in 2010 and 2011. Our refineries have a combined processing capacity, known as throughput, of approximately 540,000 bpd, and a weighted average Nelson Complexity Index of 11.3.
Our three refineries are located in Toledo, Ohio, Delaware City, Delaware and Paulsboro, New Jersey. Our Midcontinent refinery at Toledo processes light, sweet crude, has a throughput capacity of 170,000 bpd and a Nelson Complexity Index of 9.2. The majority of Toledo’s WTI based crude is delivered via pipelines that originate in both Canada and the United States. Since our acquisition of Toledo in 2011, we have added additional truck and rail crude unloading capabilities that provide feedstock sourcing flexibility for the refinery and enables Toledo to run a more cost-advantaged crude slate. Our East Coast refineries at Delaware City and Paulsboro have a combined refining capacity of 370,000 bpd and Nelson Complexity Indices of 11.3 and 13.2, respectively. These high conversion refineries process primarily medium and heavy, sour crudes and have historically received the bulk of their feedstock via ships and barges on the Delaware River. Importantly, in May 2012 we commenced crude shipments via rail into a newly developed crude rail unloading facility at our Delaware City refinery. Currently, crude delivered to this facility is consumed at our Delaware City refinery. In the future we plan to transport some of the crude delivered by rail from Delaware City via barge to our Paulsboro refinery. The Delaware City rail unloading facility allows our East Coast refineries to source WTI based crudes from Western Canada and the Midcontinent, which provides significant cost advantages versus traditional Brent based international crudes. We are in the process of expanding the rail crude unloading capacity at Delaware City from 40,000 bpd to more than 110,000 bpd by early 2013 and have entered into agreements to lease approximately 2,400 crude railcars (comprised of approximately 1,600 coiled and insulated railcars that are capable of transporting Western Canadian bitumen without diluent and approximately 800 general purpose railcars) that are currently scheduled to be delivered through the second quarter of 2014 and which will be utilized to transport crude by rail to Delaware City.
Our Business
We produce a variety of products at each of our refineries, including gasoline, ULSD, heating oil, jet fuel, lubricants, petrochemicals and asphalt. We sell our products throughout the Northeast and Midwest of the United States, as well as in other regions of the United States and Canada, and are able to ship products to other international destinations. The majority of our finished products are sold through long-term offtake and supply agreements. For example, we sell the bulk of our gasoline, diesel and heating oil through long-term offtake agreements with MSCG and Sunoco.
1
Table of Contents
The following table provides summary operating information concerning each of our three refineries:
| Refinery |
Approximate Throughput Capacity (bpd) |
Nelson Complexity Index |
Estimated Replacement Cost |
Benchmark Crack Spread |
||||||||||
| Toledo |
170,000 | 9.2 | $ | 2.4 billion | |
WTI |
| |||||||
| (Chicago) 4-3-1 | ||||||||||||||
| Delaware City |
190,000 | 11.3 | $ | 3.1 billion | |
Dated Brent |
| |||||||
| (NYH) 2-1-1 | ||||||||||||||
| Paulsboro |
180,000 | 13.2 | $ | 2.7 billion | |
Dated Brent |
| |||||||
| (NYH) 2-1-1 | ||||||||||||||
|
|
|
|
|
|
||||||||||
| Total |
540,000 | 11.3 | $ | 8.2 billion | ||||||||||
| (weighted average) | ||||||||||||||
For the year ended December 31, 2011 and the nine months ended September 30, 2012, we had (a) pro forma total revenues of $ billion and $ billion, respectively; (b) pro forma Adjusted EBITDA of $ million and $ million, respectively; and (c) pro forma net income of $ million and $ million, respectively. Our pro forma results for the year ended December 31, 2011 do not include any adjustments for Delaware City to reflect incremental revenue and operating expenses that we expect to generate in connection with the re-start because the refinery was not operational when it was acquired and the transaction was accounted for as an acquisition of assets, not a business combination. For a definition and reconciliation of pro forma Adjusted EBITDA to pro forma net income, see “—Summary Historical and Pro Forma Financial and Other Data.”
Our History and Acquisitions
| March 2008 |
PBF was formed. | |
| June 2010 |
The idle Delaware City refinery and its related assets were acquired from Valero Energy Corporation, or Valero, for approximately $220.0 million. | |
| December 2010 |
The Paulsboro refinery was acquired from Valero for approximately $357.7 million, excluding working capital. | |
| March 2011 |
The Toledo refinery was acquired from Sunoco for approximately $400.0 million, excluding working capital. | |
| October 2011 |
Delaware City became operational. | |
Delaware City Acquisition and Re-Start. We acquired the idle Delaware City refinery and its related assets, including a petroleum product terminal, a petroleum products pipeline and an electric generation facility, on June 1, 2010 from affiliates of Valero for approximately $220.0 million in cash. In the fourth quarter of 2009, due to, among other reasons, financial losses caused by one of the worst recessions in recent history, the prior owner shut down the refinery. We were therefore able to acquire the refinery at an attractive price. In addition, at the time of acquisition, we reached an agreement with the State of Delaware that provided for a five-year operating permit and up to approximately $45.0 million of economic support to re-start the facility, and negotiated a new long-term contract with the relevant union at the refinery. We believe that the refinery’s ability to process lower quality crudes will allow us to capture a higher margin as these lower quality crudes are typically priced at discounts to benchmark crudes, and to compete effectively in a region where product demand significantly exceeds refining capacity.
Since our acquisition, we have invested more than $500.0 million in turnaround and re-start projects at Delaware City, as well as in the recent strategic development of a crude rail unloading facility. The re-start process
2
Table of Contents
included the decommissioning of the gasifier unit located on the property which allowed us to decrease emissions and improve the reliability of the refinery. We made significant operating improvements in the first year of operations by modifying the crude slate and product yield, changing operations of the conversion units and re-starting certain units. Through these capital investments and by restructuring certain operations, we have lowered the annual operating expenses of the Delaware City refinery relative to its pre-acquisition operating expense levels by more than 40%. During the first years of the refinery’s operations we anticipate saving in excess of $100.0 million in capital expenditures we otherwise would have expected to make if not for our reconfiguration of the refinery and the terms of our environmental operating agreement issued by the State of Delaware. In 2012, we are spending approximately $57.0 million, $20.0 million of which has been spent as of September 30, 2012, to expand and upgrade the existing on-site rail infrastructure, including the expansion of the crude rail unloading facilities that will be capable of discharging approximately 110,000 bpd.
Paulsboro Acquisition. We acquired the Paulsboro refinery (including an associated natural gas pipeline) on December 17, 2010 from Valero for approximately $357.7 million, excluding working capital. The purchase price excludes inventory purchased on our behalf by MSCG and Statoil Marketing & Trading (US) Inc., or Statoil.
Toledo Acquisition. We acquired the Toledo refinery on March 1, 2011 from Sunoco for approximately $400.0 million, excluding working capital. We also purchased refined and certain intermediate products in inventory for approximately $299.6 million, and MSCG purchased the refinery’s crude oil inventory on our behalf. Additionally, included in the terms of the sale is a five-year participation payment of up to $125.0 million payable to Sunoco based upon post-acquisition earnings of the refinery, of which $103.6 million was paid in 2012. We currently anticipate paying the balance of the participation payment in April 2013. See “Management’s Discussion and Analysis of Financial Condition and Results of Operations—Pro Forma Contractual Obligations and Commitments” for additional information regarding the terms of the participation payment to Sunoco.
Industry Overview and Market Outlook
The United States has historically been the largest consumer of petroleum-based products in the world. According to the U.S. Energy Information Administration’s, or EIA’s, 2012 Refinery Capacity Report, there were 134 operating oil refineries in the United States in January 2012, with a total refining capacity of approximately 16.7 million bpd and a weighted average Nelson Complexity Index of approximately 10.9. Of the total operating refining capacity in the United States, approximately 55.2%, or 9.2 million bpd, is currently owned and operated by independent refining companies compared to 2002 when approximately 31.6%, or 5.1 million bpd, was owned by independent refining companies. The remaining capacity is controlled by integrated oil companies. Because of this trend, the refining industry increasingly must rely on its own operations for its profitability.
We believe our three refineries currently benefit from secular growth in North American crude production because of our ability to access lower cost WTI price based crudes. According to a recent EIA publication, average United States crude oil production in 2013 is expected to grow by approximately 1.5 million bpd, to 6.9 million bpd from 5.4 million bpd in 2009, an increase of approximately 28%. This level of United States crude oil production would represent the highest level since 1993. In addition, CAPP projects that Canadian crude oil production will increase by 800,000 bpd, from 3.0 million bpd in 2011 to 3.8 million bpd in 2015. As a result of the recent and projected growth in North American crude production, the United States has reduced its reliance on imported crude. The EIA estimates that crude imported from foreign sources (crude from outside North America) since 2008 has declined by approximately 1.3 million bpd or 13.3%, to 8.5 million bpd as of September 30, 2012 and is forecasted to decline by an additional 500,000 bpd by 2013. With the addition of our crude rail unloading facilities at Delaware City and our investment in a crude railcar fleet, we expect our East Coast refineries to capitalize on the growth in both Canadian and United States crude oil production, while maintaining the flexibility to source waterborne crude.
3
Table of Contents
Supply and demand dynamics can vary by region, creating differentiated margin opportunities at any given time for refiners depending on the location of their facilities. Our Toledo refinery is located in the Midcontinent (PADD 2) and our Delaware City and Paulsboro refineries are both located on the East Coast (PADD 1). In both of these regions, product demand exceeds refinery capacity. We expect that this demand/capacity imbalance may continue. For example, since 2009 16 refineries representing approximately 2.6 million bpd of refining capacity have been closed or idled in the Atlantic Basin (which includes PADD 1). This Atlantic Basin reduction has occurred across the United States, Europe and the Caribbean and directly affects our East Coast refineries because we compete with operating refineries in these markets. In addition, the supply reduction provides opportunities to export products to markets formerly served by refineries that are now closed or idled outside of the United States.
Refining is primarily a margin-based business where both the feedstock (primarily crude oil) and refined petroleum products are commodities with fluctuating prices. Refiners create value by selling refined petroleum products at prices higher than the costs of acquiring crude oil and other feedstocks, and by managing operating costs. Refining is an industry that historically has seasonal influences as a result of differentiated consumer demand for key refined products during certain months of the year. Most importantly, demand for gasoline is generally higher during the summer months than during the winter months due to seasonal increases in highway traffic and construction work. Decreased demand during the winter months can lower gasoline prices. Consequently, refining margins and profitability have historically generally been stronger in the second and third calendar quarters of each year relative to the first and fourth calendar quarters.
Our Competitive Strengths
We believe that we have the following competitive strengths:
Strategically located refineries with cost and supply advantages. Our Midcontinent Toledo refinery advantageously sources a substantial portion of its WTI based crude slate from sources in Canada and throughout the Midcontinent. The balance of the crude oil is delivered by truck from local sources and by rail to a nearby terminal. Recent increases in production volumes of crudes from Western Canada and the Midcontinent combined with limitations on takeaway capacity in the Midcontinent, including at Cushing, Oklahoma where WTI is priced, have resulted in a price discount for WTI based crudes compared to Brent based crudes. We believe that our access to WTI based crudes at Toledo provides us with a cost advantage versus facilities that do not have similar access to such crudes and must process Brent based feedstocks.
Our Delaware City and Paulsboro refineries have similar supply advantages given that they have the flexibility to source crudes from around the world via the Delaware River, and can source currently price advantaged WTI based crudes from Western Canada and the Midcontinent through our Delaware City crude rail unloading facility and through third party rail unloading terminals on the East Coast. The 2,400 crude railcars that we have entered into agreements to lease will enable us to transport this crude to each of our refineries. This transportation flexibility allows our East Coast refineries to process the most cost advantaged crude available.
Our three refineries currently have access to inexpensive natural gas, a primary component of a refinery’s operating costs. This access provides us with a competitive advantage versus other refineries, such as those located in Europe and the Caribbean, that are forced to purchase more expensive natural gas or run fuel oil in the refining process.
Future crude supply may emerge from the development of other crude oil producing basins, including the Utica Shale play (located in portions of the Appalachian Basin and Canada), which could potentially bring significant oil production online in regional proximity to all three of our refineries, providing an attractive feedstock source with low associated transportation cost.
Complex assets with a valuable product slate located in high-demand regions. Our refinery assets are located in regions where product demand exceeds refining capacity. Our refineries have a weighted average
4
Table of Contents
Nelson Complexity Index of 11.3, which allows us the flexibility to process a variety of crudes. Our East Coast refineries have the highest Nelson Complexity Indices on the East Coast, allowing them to process lower cost, heavier, more sour crude oils and giving us a cost advantage over other refineries in the same region. The complexity of our refining assets allows us to produce a higher percentage of more valuable light products. For example, our East Coast refineries produce a greater percentage of distillates versus gasoline than other East Coast refineries and have 100% of the East Coast’s heavy coking capacity. In addition, our Paulsboro refinery produces Group I base oils which are typically priced at a premium to both gasoline and distillates. Similarly, our Toledo refinery is a high conversion refinery with high gasoline and distillate yields and also produces high-value petrochemical products.
Significant scale and diversification. We currently operate three refineries with a combined crude throughput of 540,000 bpd making us the fifth largest independent refiner in the United States. Our refineries provide us diversification through crude slates, end products, customers and geographic locations. Our scale provides us buying power advantages, and we benefit from the cost efficiencies that result from operating three large refineries.
Recent capital investments and restructuring initiatives to improve financial returns. Since 2006, over $2.8 billion of capital has been invested in our three refineries to improve their operating performance, to meet environmental and regulatory standards, and to minimize the need for near-term capital expenditures. For example, since our acquisition of Delaware City, we have invested more than $500.0 million in turnaround and re-start projects that will improve the cost structure and profitability of the refinery, as well as in the recent strategic development of a crude rail unloading facility. In addition, we are spending approximately $57.0 million to expand and upgrade the rail unloading infrastructure that will allow us to discharge more than 110,000 bpd of cost advantaged, WTI based crudes for both our Delaware City and Paulsboro refineries by the first quarter of 2013. In conjunction with the re-start of Delaware City in 2011, we undertook a significant restructuring of the operations to improve its operating cost position, including reductions in labor costs compared to operations before shutdown by Valero, reductions in energy costs and reductions in other ongoing operating and maintenance expenses. Management estimates that the Delaware City restructuring has reduced the refinery’s annual operating expenses by over $200.0 million relative to pre-acquisition operating expense level (without including the rail upgrades). We made significant operating improvements in the first year of operations by modifying the crude slate and product yield, changing operations of the conversion units and re-starting certain units.
Experienced management team with a demonstrated track record of acquiring, integrating and operating refining assets. Our management team is led by our Executive Chairman of the Board of Directors, Thomas D. O’Malley, who has more than 30 years experience in the refining industry and has led the acquisition of more than 20 refineries during his career. In addition, our executive management team, including our Chief Executive Officer, Thomas J. Nimbley, our President, Michael D. Gayda, and our head of Commercial Operations, Donald F. Lucey, has a proven track record of successfully operating refining assets. Our core management team has significant experience working together, including while at Tosco Corporation and Premcor Inc. These executives have a long history of acquiring refineries at attractive prices and integrating these operations into a single, consolidated platform. For example, we believe we acquired the Paulsboro, Delaware City and Toledo refineries at or near the bottom of the refining cycle at a small fraction of replacement cost. These acquisitions were made at lower prices on a per barrel basis and significantly lower prices on a complexity barrel basis than other comparable acquisitions over the past five years.
Support from strong financial sponsors and management with a substantial investment. Our financial sponsors, funds affiliated with The Blackstone Group L.P., or Blackstone, and First Reserve Management, L.P., or First Reserve, have a long history of successful investments across the energy industry. Together, our financial sponsors and management have invested substantial equity in PBF LLC to date, with management investing over $23.5 million. In addition, Thomas D. O’Malley, our Executive Chairman of the Board of Directors, certain of his affiliates and family
5
Table of Contents
members, and certain of our other executives, purchased $25.5 million aggregate principal amount of senior secured notes in the notes offering described under “Management’s Discussion and Analysis of Financial Condition and Results of Operations—Factors Affecting Comparability—Senior Secured Notes Offering.”
Our Business Strategy
Our primary goal is to create stockholder value by improving our market position as one of the largest independent refiners and suppliers of petroleum products in the United States. We intend to execute the following strategies to achieve our goal:
Maintain efficient refinery operations. We intend to operate our refineries as reliably and efficiently as possible and further improve our operations by maintaining our costs at competitive levels, seeking to optimize utilization of our refinery asset base, and making focused high-return capital improvements designed to generate incremental profits.
We are continuously looking for ways to improve our overall operating efficiencies. For example, our refineries in Paulsboro and Delaware City are located approximately 30 miles apart from one another on the Delaware River. Both refineries have the capability to process heavy, sour crudes and have complementary operating units, and we exchange certain feedstocks and intermediates between the refineries in an effort to optimize profitability. We are able to recognize cost savings associated with the sharing of crude oil shipments for these refineries. In addition to allowing us to share crude cargoes transported to our East Coast refineries via water, the construction of our new crude rail unloading facility at Delaware City will also help us realize better crude economics, because we will be able to deliver crude via rail through our own facilities and process WTI based crudes at both Paulsboro and Delaware City. We employ a small, centralized corporate staff that provides capital control and oversight and have experienced managers making operational decisions at our refineries.
Continue to grow through acquisitions and internal projects. We believe that we will encounter attractive acquisition opportunities as a result of the continuing strategic divestitures by major integrated oil companies and the rationalization of specific refinery assets. In selecting future acquisitions and internal projects, we intend to consider, among other things, the following criteria: performance through the cycle, access to advantageous crude supplies, attractive refined product end market fundamentals, access to storage, distribution and logistics infrastructure, acquisition price and our ability to maintain a conservative capital structure, and synergies with existing assets. In addition, we own a number of energy-related logistical assets that qualify for the favorable tax treatment that is permitted through an MLP structure. We continue to evaluate our strategic alternatives for these assets.
Promote operational excellence in reliability and safety. We will continue to devote significant time and resources toward improving the reliability and safety of our operations. We will seek to improve operating performance through our commitment to our preventive maintenance program and to employee training and development programs. We will continue to emphasize safety in all aspects of our operations. We believe that a superior reliability record, which can be measured and managed like all other aspects of our business, is inherently tied to safety and profitability.
Create an organization highly motivated to maintain earnings and improve return on capital. We have created an organization in which employees are highly motivated to maintain earnings and improve return on capital. Our cash incentive compensation plan, which covers all non-unionized employees, is solely based on achieving earnings above designated levels. Our equity incentive plan provides participating employees with an equity stake in us and aligns their interests with our investors’ interests.
6
Table of Contents
Risk Factors
An investment in our Class A common stock involves a number of risks, including changes in industry-wide refining margins and crude oil price differentials, competition and other material factors, that could materially affect our business, financial condition and results of operations, and cause the trading price of our Class A common stock to decline. For a discussion of these risks and other considerations that could negatively affect us, including risks related to this offering and our Class A common stock, see “Risk Factors” and “Forward-Looking Statements.”
Corporate Structure and Financial Sponsors
Following this offering we will be a holding company and our sole asset will be an equity interest in PBF LLC. See “Organizational Structure” on page 39.
We will be the sole managing member of PBF LLC and operate and control all of the business and affairs and consolidate the financial results of PBF LLC and its subsidiaries. PBF LLC is a holding company for the companies that directly or indirectly own and operate our business. Prior to this offering, each of Blackstone and First Reserve owned approximately 48% of the outstanding capital interests in PBF LLC (which we refer to as the “PBF LLC Series A Units”), and Mr. O’Malley, our other executive officers and directors and certain employees beneficially owned the remaining outstanding PBF LLC Series A Units (we refer to all of the holders of the PBF LLC Series A Units as “our existing owners”). In addition, certain of our officers hold interests in PBF LLC, which are profits interests (which we refer to as the “PBF LLC Series B Units”) and certain of our existing owners and other employees hold options and warrants to purchase PBF LLC Series A Units.
Immediately prior to this offering, the limited liability company agreement of PBF LLC will be amended and restated to, among other things, designate PBF Energy as the sole managing member of PBF LLC and establish a new series of membership interests (which we refer to as the “PBF LLC Series C Units”) which will be held solely by PBF Energy. The PBF LLC Series A Units will be held solely by our existing owners (and their permitted transferees). The PBF LLC Series C Units rank on a parity with the PBF LLC Series A Units as to distribution rights, voting rights and rights upon liquidation, winding up or dissolution. Profits and losses of PBF LLC will be allocated, and all distributions generally will be made, pro rata to the holders of PBF LLC Series A Units and PBF LLC Series C Units.
The PBF LLC Series B Units are profits interests held by certain of our officers which had no taxable value at the date of issuance, have no voting rights and are designed to increase in value only after our financial sponsors achieve certain levels of return on their investment in PBF LLC Series A Units. Under the limited liability company agreement of PBF LLC, distributions initially are made to the holders of PBF LLC Series A Units and PBF LLC Series C Units in proportion to the number of units owned by them. Once the financial sponsors receive a full return of their capital contributions with respect to their PBF LLC Series A Units, distributions and other payments made on account of the PBF LLC Series A Units held by our financial sponsors will then be shared by our financial sponsors with the holders of PBF LLC Series B Units. Accordingly, the amounts paid to the holders of PBF LLC Series B Units will reduce only the amounts otherwise payable to the PBF LLC Series A Units held by our financial sponsors, and will not reduce or otherwise impact any amounts payable to PBF Energy (the holder of our PBF LLC Series C Units), the holders of our Class A common stock or any other holder of PBF LLC Series A Units. For a further discussion of the PBF LLC Series B Units, please see “Executive Compensation—Compensation Discussion and Analysis—Summary of PBF LLC Series B Units.”
We also will enter into an exchange agreement pursuant to which our existing owners will have the right to cause PBF LLC to exchange their PBF LLC Series A Units for shares of our Class A common stock on a one-for-one basis, subject to equitable adjustments for stock splits, stock dividends and reclassifications, and
7
Table of Contents
further subject to the rights of the holders of PBF LLC Series B Units to share in a portion of the profits realized by our financial sponsors upon the sale of the shares of Class A common stock received by them upon such exchange.
Blackstone. Blackstone is one of the world’s leading investment and advisory firms and is an experienced and active investor in the energy and natural resources sector. Blackstone has substantial prior experience as an acquiror and owner of petroleum refineries, having acquired Premcor in 1997 and overseen several acquisitions and capital projects to expand and upgrade refining capacity of that company until its acquisition by Valero in 2005 for total consideration of approximately $6.9 billion. Blackstone has a long-standing relationship with Thomas D. O’Malley, having recruited him to serve as Chairman and Chief Executive Officer of Premcor in early 2002. Blackstone seeks to create positive economic impact and long-term value for its investors, the companies it invests in, the companies it advises and the broader global economy. Blackstone does this through the commitment of its extraordinary people and flexible capital. Blackstone’s alternative asset management businesses include the management of private equity funds, real estate funds, hedge fund solutions, credit-oriented funds and closed-end mutual funds. Through its different investment businesses, as of September 30, 2012, Blackstone had total assets under management of approximately $204.6 billion. Blackstone also provides various financial advisory services, including financial and strategic advisory, restructuring and reorganization advisory and fund placement services.
First Reserve. Founded in 1983, First Reserve is a leading global investment firm dedicated to the energy industry with over $23 billion of raised capital since inception. With offices in North America, Europe and Asia, First Reserve is well positioned to make strategic investments on a global basis across the energy value chain. First Reserve seeks to create value for its investors by applying its deep industry knowledge, decades of investing and operational experience, highly talented management team and powerful network of global relationships to its investments and through active monitoring of its portfolio companies.
* * *
PBF Energy is a Delaware corporation incorporated on November 7, 2011 with its principal executive offices located at One Sylvan Way, Second Floor, Parsippany, NJ 07054 and our telephone number is (973) 455-7500. Our website address is http://www.pbfenergy.com. The information on our website is not part of this prospectus.
8
Table of Contents
The Offering
| Class A common stock to be offered by PBF Energy |
shares |
| Over-allotment option |
shares |
| Class A common stock outstanding after the offering |
shares (or shares if all outstanding PBF LLC Series A Units held by our existing owners were exchanged for newly-issued shares of Class A common stock on a one-for-one basis). |
| Class B common stock outstanding after the offering |
shares, or one share for each holder of PBF LLC Series A Units. |
| Voting power held by holders of Class A common stock after the offering |
% (or 100% if all outstanding PBF LLC Series A Units held by our existing owners were exchanged for newly-issued shares of Class A common stock on a one-for-one basis). |
| Voting power held by holder of Class B common stock after the offering |
% (or 0% if all outstanding PBF LLC Series A Units held by our existing owners were exchanged for newly issued shares of Class A common stock on a one-for-one basis). |
| Use of proceeds |
The proceeds to PBF Energy from this offering, before deducting underwriting discounts, will be approximately $ million (or $ million if the underwriters exercise in full their option to purchase additional shares of Class A common stock). |
| PBF Energy intends to use $ million of the proceeds from this offering to purchase PBF LLC Series A Units (which will be reclassified as PBF LLC Series C Units in connection with such acquisition) from Blackstone and First Reserve, as described under “Organizational Structure—Offering Transactions.” Accordingly, we will not retain any of these proceeds. See “Principal Stockholders” for further information. |
| PBF Energy intends to use all of the remaining proceeds from this offering, or $ million (or $ million if the underwriters exercise in full their option to purchase additional shares of Class A common stock), to purchase newly-issued PBF LLC Series C Units from PBF LLC, as described under “Organizational Structure—Offering Transactions.” We intend to cause PBF LLC to use these proceeds to |
9
Table of Contents
pay the expenses of this offering, including aggregate underwriting discounts of $ million (or $ million if the underwriters exercise in full their option to purchase additional shares of Class A common stock) and other offering expenses estimated at $ million. Any remaining proceeds, including proceeds from the exercise by the underwriters of their option to purchase additional shares of Class A common stock, will be used for general corporate purposes, including to potentially repay amounts outstanding under our ABL Revolving Credit Facility. See “Use of Proceeds.”
| Voting rights |
Each share of our Class A common stock entitles its holder to one vote on all matters to be voted on by stockholders generally. |
| Our existing owners hold all of the shares of Class B common stock. The shares of Class B common stock have no economic rights but entitle the holder, without regard to the number of shares of Class B common stock held, to a number of votes on matters presented to stockholders of PBF Energy that is equal to the aggregate number of PBF LLC Series A Units held by such holder. See “Description of Capital Stock—Class B Common Stock.” |
| Holders of our Class A common stock and Class B common stock vote together as a single class on all matters presented to our stockholders for their vote or approval, except as otherwise required by applicable law. |
| Dividend policy |
We currently intend to pay quarterly cash dividends of approximately $0.20 per share on our Class A common stock following this offering, commencing after the completion of the first quarter of 2013. The declaration, timing and amount of any such dividends will be at the sole discretion of our board of directors and will depend on a variety of factors, including general economic conditions, our financial condition and operating results, our available cash and current and anticipated cash needs, capital requirements, plans for expansion, tax, legal, regulatory and contractual restrictions and implications, including under our outstanding debt documents, and such other factors as our board of directors may deem relevant. |
| Because we are a holding company, our cash flow and ability to pay dividends depends upon the financial |
10
Table of Contents
| results and cash flows of our operating subsidiaries and the distribution or other payment of cash to us in the form of dividends or otherwise from PBF LLC. |
| Exchange rights of our existing owners |
Prior to this offering, we will enter into an exchange agreement pursuant to which our existing owners will have the right to cause PBF LLC to exchange their PBF LLC Series A Units for shares of Class A common stock of PBF Energy on a one-for-one basis, subject to equitable adjustment for stock splits, stock dividends and reclassifications, and further subject to the rights of the holders of PBF LLC Series B Units to share in a portion of the profits realized by our financial sponsors upon the sale of the shares of Class A common stock received by them upon such exchange. |
Under the amended and restated certificate of incorporation of PBF Energy, each holder of Class B common stock will be entitled, without regard to the number of shares of Class B common stock held by such holder, to one vote for each PBF LLC Series A Unit held by such holder. Accordingly, as our existing owners exchange their PBF LLC Series A Units for shares of Class A common stock pursuant to the exchange agreement, the voting power afforded to our existing owners by their shares of Class B common stock will be automatically and correspondingly reduced.
| Directed Share Program |
At our request, the underwriters have reserved up to shares of our Class A common stock offered hereby for sale to certain of our employees and certain other participants. We do not know if these persons will choose to purchase all or any portion of these reserved shares, but any purchases they do make will reduce the number of shares available to the general public. See “Risk Factors—Risks Related to This Offering and Ownership of Our Class A Common Stock—Certain participants in our directed share program must hold their shares for a minimum of 180 days following the date of the final prospectus related to this offering and accordingly will be subject to market risks not imposed on other investors in the offering” and “Underwriting.” |
|
|
| Risk factors |
For a discussion of factors you should consider before buying the shares, see “Risk Factors.” |
| New York Stock Exchange symbol |
“PBF” |
11
Table of Contents
Unless we specifically state otherwise, all information in this prospectus:
| • | assumes no exercise by the underwriters of their over-allotment option to purchase additional shares of our Class A common stock; |
| • | does not reflect shares of Class A common stock issuable upon exchange of PBF LLC Series A Units; and |
| • | excludes (a) outstanding options and warrants to purchase 4,774,630 PBF LLC Series A Units, at a weighted average exercise price of $10.26 per unit, 4,179,610 of which will be vested and exercisable as of the date of the closing of this offering, and (b) an additional 5,000,000 shares authorized and reserved for issuance under our equity incentive plan, including 675,000 shares issuable upon the exercise of stock options that we intend to grant to our officers and employees at the time of this offering. See “Executive Compensation — Compensation Discussion and Analysis — Equity Compensation,” “Executive Compensation — Compensation Discussion and Analysis — 2012 Equity Incentive Plan,” “Executive Compensation — Compensation Discussion and Analysis — IPO Date Stock Option Awards and Cash Bonus to Employees” and “Certain Relationships and Related Transactions — Investments in PBF LLC.” |
12
Table of Contents
Summary Historical and Pro Forma Financial and Other Data
The following table sets forth our summary historical and pro forma consolidated financial data at the dates and for the periods indicated. The historical financial data is that of PBF LLC. PBF LLC will be considered our predecessor for accounting purposes, and its consolidated financial statements will be our historical consolidated financial statements following this offering.
The summary historical consolidated financial data as of December 31, 2010 and 2011 and for the years ended December 31, 2009, 2010 and 2011 have been derived from audited financial statements of PBF LLC included elsewhere in this prospectus. The summary historical consolidated financial data as of December 31, 2009 has been derived from audited financial statements of PBF LLC not included in this prospectus. As a result of the Paulsboro and Toledo acquisitions, the historical consolidated financial results of PBF LLC only include the results of operations for Paulsboro and Toledo from December 17, 2010 and March 1, 2011, respectively. The information as of and for the nine months ended September 30, 2011 and 2012 was derived from the unaudited condensed consolidated financial statements of PBF LLC (included elsewhere in this prospectus) which include all adjustments, consisting of normal recurring adjustments, which management considers necessary for a fair presentation of the financial position and the results of operations for such periods. Results for the interim periods are not necessarily indicative of the results for the full year.
The summary unaudited pro forma consolidated financial data have been derived by the application of pro forma adjustments to the historical consolidated financial statements of PBF LLC included elsewhere in this prospectus. The summary unaudited pro forma consolidated statements of operations data for the year ended December 31, 2011 and for the nine months ended September 30, 2012 give effect to the acquisition of Toledo, the senior secured notes offering (as described under “Management’s Discussion and Analysis of Financial Condition and Results of Operations—Factors Affecting Comparability—Senior Secured Notes Offering”), the Offering Transactions (as described under “Organizational Structure”), and the use of the estimated net proceeds from this offering as if they had occurred on January 1, 2011. The summary unaudited pro forma consolidated balance sheet data as of September 30, 2012 gives effect to cash distributions to our existing owners made prior to the completion of this offering (as described under “Dividend Policy”), the Offering Transactions and the use of the estimated net proceeds from this offering as if they had occurred on September 30, 2012.
You should read this information in conjunction with the consolidated financial statements of PBF LLC and the related notes thereto, and the statements of assets acquired and liabilities assumed and the related statements of revenues and direct expenses of Toledo and the related notes thereto, included elsewhere in this prospectus, and the sections entitled “Organizational Structure,” “Unaudited Pro Forma Consolidated Financial Statements,” “Management’s Discussion and Analysis of Financial Condition and Results of Operations” and “Selected Financial Data.” Our summary unaudited pro forma consolidated financial information is presented for informational purposes only. The pro forma adjustments are based upon available information and certain assumptions that we believe are reasonable. Our summary unaudited pro forma consolidated financial information does not purport to represent what our results of operations or financial position would have been if we operated as a public company during the periods presented and may not be indicative of our future performance.
13
Table of Contents
| Year Ended December 31, 2009(3) |
Year Ended December 31, 2010 |
Pro Forma | Nine Months Ended September 30, 2011 |
Nine Months Ended September 30, 2012 |
Pro Forma | |||||||||||||||||||||||
| Year Ended December 31, 2011 |
Year Ended December 31, 2011 |
Nine Months Ended September 30, 2012 |
||||||||||||||||||||||||||
| (in thousands) | ||||||||||||||||||||||||||||
| Statement of operations data: |
||||||||||||||||||||||||||||
| Revenues(1) |
$ | 228 | $ | 210,671 | $ | 14,960,338 | $ | $ | 10,183,897 | $ | 15,188,327 | $ | ||||||||||||||||
| Cost and expenses |
||||||||||||||||||||||||||||
| Cost of sales, excluding depreciation |
— | 203,971 | 13,855,163 | 9,147,063 | 13,871,884 | |||||||||||||||||||||||
| Operating expenses, excluding depreciation |
— | 25,140 | 658,831 | 457,722 | 537,880 | |||||||||||||||||||||||
| General and administrative expenses |
6,294 | 15,859 | 86,183 | 71,533 | 78,042 | |||||||||||||||||||||||
| Acquisition related expenses(2) |
— | 6,051 | 728 | 684 | — | |||||||||||||||||||||||
| (Gain) on sale of asset |
— | (2,430 | ) | |||||||||||||||||||||||||
| Depreciation and amortization expense |
44 | 1,402 | 53,743 | 35,636 | 67,419 | |||||||||||||||||||||||
|
|
|
|
|
|
|
|
|
|
|
|
|
|
|
|||||||||||||||
| 6,338 | 252,423 | 14,654,648 | 9,712,638 | 14,552,795 | ||||||||||||||||||||||||
|
|
|
|
|
|
|
|
|
|
|
|
|
|
|
|||||||||||||||
| (Loss) income from operations |
(6,110 | ) | (41,752 | ) | 305,690 | 471,259 | 635,532 | |||||||||||||||||||||
| Other (expense) income |
||||||||||||||||||||||||||||
| Change in fair value of catalyst lease obligation |
— | (1,217 | ) | 7,316 | 4,848 | (6,929 | ) | |||||||||||||||||||||
| Change in fair value of contingent consideration |
— | — | (5,215 | ) | (4,829 | ) | (2,076 | ) | ||||||||||||||||||||
| Interest income (expense), net |
10 | (1,388 | ) | (65,120 | ) | (44,127 | ) | (86,753 | ) | |||||||||||||||||||
|
|
|
|
|
|
|
|
|
|
|
|
|
|
|
|||||||||||||||
| (Loss) income before taxes |
(6,100 | ) | (44,357 | ) | 242,671 | 427,151 | 539,774 | |||||||||||||||||||||
| Income taxes |
— | — | — | — | — | |||||||||||||||||||||||
|
|
|
|
|
|
|
|
|
|
|
|
|
|
|
|||||||||||||||
| Net (loss) income |
$ | (6,100 | ) | $ | (44,357 | ) | $ | 242,671 | $ | 427,151 | $ | 539,774 | ||||||||||||||||
|
|
|
|
|
|
|
|
|
|
|
|||||||||||||||||||
| Less—Net (loss) income attributable to noncontrolling interest |
||||||||||||||||||||||||||||
|
|
|
|
|
|||||||||||||||||||||||||
| Net (loss) income attributable to PBF Energy Inc. |
$ | $ | ||||||||||||||||||||||||||
|
|
|
|
|
|||||||||||||||||||||||||
| Balance sheet data (at end of period): |
||||||||||||||||||||||||||||
| Total assets |
$ | 19,150 | $ | 1,274,393 | $ | 3,621,109 | $ | $ | 3,872,150 | $ | 3,932,507 | $ | ||||||||||||||||
| Total long-term debt(4) |
— | 325,064 | 804,865 | 713,255 | 732,961 | |||||||||||||||||||||||
| Total equity |
18,694 | 456,739 | 1,107,615 | 1,296,131 | 1,633,326 | |||||||||||||||||||||||
| Selected financial data: |
||||||||||||||||||||||||||||
| Adjusted EBITDA(5) |
$ | (6,066 | ) | $ | (28,699 | ) | $ | 388,219 | $ | $ | 507,070 | $ | 732,603 | $ | ||||||||||||||
| Capital expenditures(6) |
$ | 70 | $ | 72,118 | $ | 551,544 | $ | $ | 504,034 | $ | 129,505 | $ | ||||||||||||||||
| (1) | Consulting services income provided to a related party was $10 and $221 for the years ended December 31, 2010 and 2009, respectively. No consulting services income was earned subsequent to 2010. |
| (2) | Acquisition related expenses consist of consulting and legal expenses related to the Paulsboro and Toledo acquisitions as well as non-consummated acquisitions. |
| (3) | December 31, 2009 balance sheet data is that of PBF Investment LLC. See footnote 1, Description of Business and Basis of Presentation, in the PBF LLC consolidated financial statements. |
| (4) | Total long-term debt includes current maturities and our Delaware Economic Development Authority loan of $20.0 million. |
| (5) | We believe Adjusted EBITDA is an important measure of operating performance and provides useful information to investors because it highlights trends in our business that may not otherwise be apparent when relying solely on GAAP measures and eliminates items that have less bearing on our operating performance. |
14
Table of Contents
| Adjusted EBITDA, as presented herein, is a supplemental measure of performance that is not required by, or presented in accordance with, GAAP. We use this non-GAAP financial measure as a supplement to our GAAP results in order to provide a more complete understanding of the factors and trends affecting our business. Adjusted EBITDA is a measure of operating performance that is not defined by GAAP and should not be considered a substitute for net income as determined in accordance with GAAP. |
| Also, because Adjusted EBITDA is not calculated in the same manner by all companies, it is not necessarily comparable to other similarly titled measures used by other companies. Adjusted EBITDA has its limitations as an analytical tool, and you should not consider it in isolation or as a substitute for analysis of our results as reported under GAAP. Some of the limitations of Adjusted EBITDA are: |
| • | Adjusted EBITDA does not reflect our cash expenditures, or future requirements, for capital expenditures or contractual commitments; |
| • | Although depreciation and amortization are non-cash charges, the asset being depreciated or amortized often will have to be replaced and Adjusted EBITDA does not reflect the cash requirements for such replacements; |
| • | Adjusted EBITDA does not reflect changes in, or cash requirements for, our working capital requirements; and |
| • | Adjusted EBITDA does not reflect the significant interest expense, or the cash requirements necessary to make payments of interest or principal on our indebtedness. |
The following table reconciles net income (loss) (or, on a pro forma basis, net income attributable to PBF Energy Inc.) to Adjusted EBITDA:
| Pro Forma | Pro Forma | |||||||||||||||||||||||||||
| Year Ended December 31, 2009 |
Year Ended December 31, 2010 |
Year Ended December 31, 2011 |
Year Ended December 31, 2011 |
Nine Months Ended September 30, 2011 |
Nine Months Ended September 30, 2012 |
Nine Months Ended September 30, 2012 |
||||||||||||||||||||||
| (in thousands) | ||||||||||||||||||||||||||||
| Net income (loss) |
$ | (6,100 | ) | $ | (44,357 | ) | $ | 242,671 | $ | $ | 427,151 | $ | 539,774 | $ | ||||||||||||||
| Interest (income) expense, net |
(10 | ) | 1,388 | 65,120 | 44,127 | 86,753 | ||||||||||||||||||||||
| Depreciation and amortization |
44 | 1,402 | 53,743 | 35,636 | 67,419 | |||||||||||||||||||||||
| Stock based compensation |
— | 2,300 | 2,516 | 1,911 | 1,707 | |||||||||||||||||||||||
| Acquisition related expense(a) |
— | 6,051 | 728 | 684 | — | |||||||||||||||||||||||
| Non-cash change in market value of inventory repurchase obligation(b) |
— | 2,043 | 18,771 | (4,932 | ) | 9,716 | ||||||||||||||||||||||
| Non-cash deferral of gross profit on finished product sales(c) |
— | 1,257 | 6,771 | 2,512 | 18,229 | |||||||||||||||||||||||
| Change in fair value of catalyst lease obligation(d) |
— | 1,217 | (7,316 | ) | (4,848 | ) | 6,929 | |||||||||||||||||||||
| Change in fair value of contingent consideration(e) |
— | — | 5,215 | 4,829 | 2,076 | |||||||||||||||||||||||
|
|
|
|
|
|
|
|
|
|
|
|
|
|
|
|||||||||||||||
| Adjusted EBITDA |
$ | (6,066 | ) | $ | (28,699 | ) | $ | 388,219 | $ | $ | 507,070 | $ | 732,603 | $ | ||||||||||||||
|
|
|
|
|
|
|
|
|
|
|
|
|
|
|
|||||||||||||||
| (a) | See footnote (2) above. |
| (b) | Certain of our crude and feedstock supply agreements require that we repurchase inventory held by our counterparties at a future date at the then fair market value. We are required to record these repurchase obligations at their fair market value at the end of each reporting period. The change in fair market value based on changes in commodity prices is a non-cash charge or benefit included in cost of sales. We add back the impact of the change in market value of these future inventory repurchase obligations in arriving at Adjusted EBITDA to better reflect Adjusted EBITDA on a cash-basis. |
| (c) | We sell our production of light finished products at our Paulsboro and Delaware City refineries to a single counterparty. On a daily basis, the counterparty purchases and pays for the products as they are produced, delivered to the refineries’ storage tanks, and legal title passes to the counterparty. Revenue and gross profit on these product sales are deferred until the products are shipped out of our storage facility, which typically occurs within an average of six days. We add back the non-cash deferral of the gross profit on these product sales in arriving at Adjusted EBITDA to better reflect Adjusted EBITDA on a cash-basis. |
15
Table of Contents
| (d) | We entered into agreements pursuant to which certain precious metals catalyst located at our Delaware City and Toledo refineries were sold and leased back for three one-year periods. We have recorded these transactions as capital leases as we are required to repurchase the precious metals catalyst at its market value at lease termination. We elected the fair value option for accounting for the catalyst repurchase obligations and the change in fair value of the underlying precious metals is recorded in the income statement as a non-cash charge or benefit each reporting period. We add back the impact of the change in fair value of these future precious metal catalyst repurchase obligations in arriving at Adjusted EBITDA to better reflect Adjusted EBITDA on a cash-basis. |
| (e) | In connection with the Toledo acquisition, the seller will be paid an amount equal to 25% of the amount by which the purchased assets’ EBITDA exceeds $125.0 million in a given calendar year through 2016 (pro-rated for 2011 and 2016). The aggregate amount of such payments cannot exceed $125.0 million. The purchased assets’ EBITDA is calculated using calendar year earnings we have earned solely from the purchase of Toledo including reasonable direct and allocated overhead expenses, less any significant extraordinary or non-recurring expenses, and any fees or expenses incurred by us in connection with the Toledo acquisition. A charge or benefit is recorded each reporting period reflecting the change in the estimated fair value of the contingent consideration we expect to pay in connection with our acquisition of the Toledo refinery. We add back the impact of the change in fair value of the contingent consideration in arriving at Adjusted EBITDA to better reflect Adjusted EBITDA on a cash-basis. |
| (6) | Includes expenditures for construction in progress, property, plant and equipment and deferred turnaround costs. |
16
Table of Contents
An investment in our Class A common stock involves a number of risks. You should carefully consider, in addition to the other information contained in this prospectus (including “Management’s Discussion and Analysis of Financial Condition and Results of Operations” and our financial statements and related notes), the following risks before investing in our Class A common stock. These risks could materially affect our business, financial condition and results of operations, and cause the trading price of our Class A common stock to decline. You could lose part or all of your investment. You should bear in mind, in reviewing this prospectus, that past experience is no indication of future performance. You should read the section titled “Forward-Looking Statements” immediately following these risk factors for a discussion of what types of statements are forward-looking statements, as well as the significance of such statements in the context of this prospectus.
Risks Relating to Our Business and Industry
We have incurred losses in the past and may incur losses in the future. If we incur losses over an extended period of time, the value of our Class A common stock could decline.
We experienced losses during our time as a development company. We may not be profitable in future periods. A lack of profitability could adversely affect the price of our Class A common stock. We may not continue to remain profitable, which could impair our ability to complete future financings and have a material adverse effect on our business.
Our limited operating history makes it difficult to evaluate our current business and future prospects. If we are unsuccessful in executing our business model, our business and operating results will be adversely affected.
We were formed in March 2008, we acquired our first oil refinery in June 2010 in an idle state and we acquired our first operating asset in December 2010. Therefore, we have a limited operating history and track record in executing our business model. Our future success depends on our ability to execute our business strategy effectively. Our limited operating history may make it difficult to evaluate our current business and future prospects. We may not be successful in operating any of our refineries or any other properties we may acquire in the future. In addition, we have encountered and will continue to encounter risks and difficulties frequently experienced by new companies, and specifically companies in the oil refining industry. If we do not manage these risks successfully, our business, results of operations and financial condition will be adversely affected.
The price volatility of crude oil, other feedstocks, blendstocks, refined products and fuel and utility services may have a material adverse effect on our revenues, profitability, cash flows and liquidity.
Our revenues, profitability, cash flows and liquidity from operations depend primarily on the margin above operating expenses (including the cost of refinery feedstocks, such as crude oil, intermediate partially refined petroleum products, and natural gas liquids that are processed and blended into refined products) at which we are able to sell refined products. Refining is primarily a margin-based business and, to increase profitability, it is important to maximize the yields of high value finished products while minimizing the costs of feedstock and operating expenses. When the margin between refined product prices and crude oil and other feedstock costs contracts, our earnings, profitability and cash flows are negatively affected. Refining margins historically have been volatile, and are likely to continue to be volatile, as a result of a variety of factors, including fluctuations in the prices of crude oil, other feedstocks, refined products and fuel and utility services. An increase or decrease in the price of crude oil will likely result in a similar increase or decrease in prices for refined products; however, there may be a time lag in the realization, or no such realization, of the similar increase or decrease in prices for refined products. The effect of changes in crude oil prices on our refining margins therefore depends in part on how quickly and how fully refined product prices adjust to reflect these changes.
17
Table of Contents
In addition, the nature of our business requires us to maintain substantial crude oil, feedstock and refined product inventories. Because crude oil, feedstock and refined products are commodities, we have no control over the changing market value of these inventories. Our crude oil, feedstock and refined product inventories are valued at the lower of cost or market value under the last-in-first-out (“LIFO”), inventory valuation methodology. If the market value of our crude oil, feedstock and refined product inventories were to decline to an amount less than our LIFO cost, we would record a write-down of inventory and a non-cash charge to cost of sales.
Prices of crude oil, other feedstocks, blendstocks, and refined products depend on numerous factors beyond our control, including the supply of and demand for crude oil, other feedstocks, gasoline, diesel, ethanol, asphalt and other refined products. Such supply and demand are affected by a variety of economic, market, environmental and political conditions.
Our direct operating expense structure also impacts our profitability. Our major direct operating expenses include employee and contract labor, maintenance and energy. Our predominant variable direct operating cost is energy, which is comprised primarily of fuel and other utility services. The volatility in costs of fuel, principally natural gas, and other utility services, principally electricity, used by our refineries and other operations affect our operating costs. Fuel and utility prices have been, and will continue to be, affected by factors outside our control, such as supply and demand for fuel and utility services in both local and regional markets. Natural gas prices have historically been volatile and, typically, electricity prices fluctuate with natural gas prices. Future increases in fuel and utility prices may have a negative effect on our revenues, profitability and cash flows.
Our historical financial statements may not be helpful in predicting our future performance.
We have grown rapidly since our inception and have not owned or operated our refineries for a substantial period of time. Accordingly, our historical financial information may not be useful either as a means of understanding our current financial situation or as an indicator of our future results. For the period from March 1, 2008 to December 16, 2010, we were considered to be in the development stage. Our historical financial information for that period reflects our activities principally in connection with identifying acquisition opportunities; acquiring the Delaware City refinery assets and commencing a reconfiguration of the refinery; and acquiring the Paulsboro refinery. As a result of the Paulsboro and Toledo acquisitions, our historical consolidated financial results include the results of operations for Paulsboro and Toledo from December 17, 2010 and March 1, 2011 forward, respectively. Certain information in our financial statements and certain other financial data included in this prospectus are based in part on financial data related to, and the operations of, those companies that previously owned and operated our refineries. For example, at the time of its acquisition, Paulsboro represented the major portion of our business and assets. As a result, we separately present the financial statements of Paulsboro for periods prior to the acquisition date of December 17, 2010 as PBF LLC’s “Predecessor” entity. Such information is not necessarily indicative of our future results of operations and financial performance. In addition, the financial statements presented in this prospectus for our Toledo refinery reflect a more limited “Statement of Revenues and Direct Expenses” and a “Statement of Net Assets Acquired and Liabilities Assumed” as opposed to full audited carve-out financial statements, which may not be indicative of the operating results and financial condition of the refinery had we been operating the refinery during the periods presented. As has been the case in our acquisitions to date, it is likely that, when we acquire refineries, we will not have access to the type of historical financial information that we will report regarding the prior operation of the refineries. As a result, it may be difficult for investors to evaluate the probable impact of major acquisitions on our financial performance until we have operated the acquired refineries for a substantial period of time.
Our profitability is affected by crude oil differentials, which fluctuate substantially.
A significant portion of our profitability is derived from the ability to purchase and process crude oil feedstocks that historically have been cheaper than benchmark crude oils, such as the heavy, sour crude oils processed at our Delaware City and Paulsboro refineries and the WTI based crude oils processed at our Toledo refinery. These crude oil differentials vary significantly from quarter to quarter depending on overall economic conditions and trends and conditions within the markets for crude oil and refined products. Any change in these
18
Table of Contents
crude oil differentials may have an impact on our earnings. Our rail investment and strategy to acquire cost advantaged Midcontinent and Canadian crude, which are priced based on WTI, could be adversely affected if the WTI-Brent differential narrows. For example, the WTI/WCS differential, a proxy for the difference between light U.S. and heavy Canadian crudes, has increased from $15.63 per barrel in 2011 to $20.40 for the nine month period ended September 30, 2012, however, this increase may not be indicative of the differential going forward. Conversely, a narrowing of the light-heavy differential may reduce our refining margins and adversely affect our recent profitability and earnings. In addition, while our Toledo refinery benefits from a widening of the Dated Brent/WTI differential, a narrowing of this differential may result in our Toledo refinery losing a portion of its crude price advantage over certain of our competitors, which negatively impacts our profitability. Any narrowing of these differentials could have a material adverse effect on our business and profitability.
A significant interruption or casualty loss at any of our refineries and related assets could reduce our production, particularly if not fully covered by our insurance. Failure by one or more insurers to honor its coverage commitments for an insured event could materially and adversely affect our future cash flows, operating results and financial condition.
Our business currently consists of owning and operating three refineries and related assets. As a result, our operations could be subject to significant interruption if any of our refineries were to experience a major accident, be damaged by severe weather or other natural disaster, or otherwise be forced to shut down or curtail production due to unforeseen events, such as acts of God, nature, power outages, acts of terrorism, fires, toxic emissions and maritime hazards. Any such shutdown would reduce the production from that refinery. There is also risk of mechanical failure and equipment shutdowns both general and following unforeseen events. Further, in such situations, undamaged refinery processing units may be dependent on or interact with damaged sections of our refineries and, accordingly, are also subject to being shut down. In the event any of our refineries is forced to shut down for a significant period of time, it would have a material adverse effect on our earnings, our other results of operations and our financial condition as a whole.
As protection against these hazards, we maintain insurance coverage against some, but not all, such potential losses and liabilities. We may not be able to maintain or obtain insurance of the type and amount we desire at reasonable rates. As a result of market conditions, premiums and deductibles for certain of our insurance policies may increase substantially. In some instances, certain insurance could become unavailable or available only for reduced amounts of coverage. For example, coverage for hurricane damage can be limited, and coverage for terrorism risks can include broad exclusions. If we were to incur a significant liability for which we were not fully insured, it could have a material adverse effect on our financial position.
Our insurance program includes a number of insurance carriers. Significant disruptions in financial markets could lead to a deterioration in the financial condition of many financial institutions, including insurance companies and, therefore, we may not be able to obtain the full amount of our insurance coverage for insured events.
Our Toledo refinery is subject to interruptions of supply and distribution as a result of our reliance on pipelines for transportation of crude oil and refined products.
Our Toledo refinery receives a substantial portion of its crude oil and delivers a portion of its refined products through pipelines. The Enbridge system is our primary supply route for crude oil from Canada, the Bakken region and Michigan, and supplies approximately 55% to 60% of the crude oil used at our Toledo refinery. In addition, we source domestic crude oil through our connections to the Capline and Mid-Valley pipelines. We also distribute a portion of our transportation fuels through pipelines owned and operated by Sunoco Logistics Partners L.P. and Buckeye Partners L.P. We could experience an interruption of supply or delivery, or an increased cost of receiving crude oil and delivering refined products to market, if the ability of these pipelines to transport crude oil or refined products is disrupted because of accidents, weather interruptions, governmental regulation, terrorism, other third party action or any of the types of events described in the preceding risk factor.
19
Table of Contents
In addition, due to the common carrier regulatory obligation applicable to interstate oil pipelines, capacity is prorated among shippers in accordance with the tariff then in effect in the event there are nominations in excess of capacity. Therefore, nominations by new shippers or increased nominations by existing shippers may reduce the capacity available to us. Any prolonged interruption in the operation or curtailment of available capacity of the pipelines that we rely upon for transportation of crude oil and refined products could have a further material adverse effect on our business, financial condition, results of operations and cash flows.
We may not be able to obtain funding on acceptable terms or at all because of volatility and uncertainty in the credit and capital markets. This may hinder or prevent us from meeting our future capital needs.
Global financial markets and economic conditions have been, and continue to be, disrupted and volatile due to a variety of factors, including uncertainty in the financial services sector, low consumer confidence, continued high unemployment, geopolitical issues and the current weak economic conditions. In addition, the fixed income markets have experienced periods of extreme volatility that have negatively impacted market liquidity conditions. As a result, the cost of raising money in the debt and equity capital markets has increased substantially at times while the availability of funds from those markets diminished significantly. In particular, as a result of concerns about the stability of financial markets generally and the solvency of lending counterparties specifically, the cost of obtaining money from the credit markets may increase as many lenders and institutional investors increase interest rates, enact tighter lending standards, refuse to refinance existing debt on similar terms or at all and reduce or, in some cases, cease to provide funding to borrowers. Due to these factors, we cannot be certain that new debt or equity financing will be available on acceptable terms. If funding is not available when needed, or is available only on unfavorable terms, we may be unable to meet our obligations as they come due. Moreover, without adequate funding, we may be unable to execute our growth strategy, complete future acquisitions, take advantage of other business opportunities or respond to competitive pressures, any of which could have a material adverse effect on our revenues and results of operations.
Competition from companies who produce their own supply feedstocks, have extensive retail outlets, make alternative fuels or have greater financial and other resources than we do could materially and adversely affect our business and results of operations.
Our refining operations compete with domestic refiners and marketers in regions of the United States in which we operate, as well as with domestic refiners in other regions and foreign refiners that import products into the United States. In addition, we compete with producers and marketers in other industries that supply alternative forms of energy and fuels to satisfy the requirements of our industrial, commercial and individual consumers. Certain of our competitors have larger and more complex refineries, and may be able to realize lower per-barrel costs or higher margins per barrel of throughput. Several of our principal competitors are integrated national or international oil companies that are larger and have substantially greater resources than we do and access to proprietary sources of controlled crude oil production. Unlike these competitors, we obtain substantially all of our feedstocks from unaffiliated sources. We are not engaged in the petroleum exploration and production business and therefore do not produce any of our crude oil feedstocks. We do not have a retail business and therefore are dependent upon others for outlets for our refined products. Because of their integrated operations and larger capitalization, these companies may be more flexible in responding to volatile industry or market conditions, such as shortages of crude oil supply and other feedstocks or intense price fluctuations.
Newer or upgraded refineries will often be more efficient than our refineries, which may put us at a competitive disadvantage. We have taken significant measures to maintain our refineries including the installation of new equipment and redesigning older equipment to improve our operations. However, these actions involve significant uncertainties, since upgraded equipment may not perform at expected throughput levels, the yield and product quality of new equipment may differ from design specifications and modifications may be needed to correct equipment that does not perform as expected. Any of these risks associated with new equipment, redesigned older equipment or repaired equipment could lead to lower revenues or higher costs or otherwise have an adverse effect on future results of operations and financial condition. Over time, our refineries may become obsolete, or be unable to compete, because of the construction of new, more efficient facilities by our competitors.
20
Table of Contents
Any political instability, military strikes, sustained military campaigns, terrorist activity, or changes in foreign policy could have a material adverse effect on our business, results of operations and financial condition.
Any political instability, military strikes, sustained military campaigns, terrorist activity, or changes in foreign policy in areas or regions of the world where we acquire crude oil and other raw materials or sell our refined petroleum products may affect our business in unpredictable ways, including forcing us to increase security measures and causing disruptions of supplies and distribution markets. We may also be subject to United States trade and economic sanctions laws, which change frequently as a result of foreign policy developments, and which may necessitate changes to our crude oil acquisition activities. Further, like other industrial companies, our facilities may be the target of terrorist activities. Any act of war or terrorism that resulted in damage to any of our refineries or third-party facilities upon which we are dependent for our business operations could have a material adverse effect on our business, results of operations and financial condition.
Continued economic turmoil in the global financial system has had and may continue to have an adverse impact on the refining industry.
Our business and profitability are affected by the overall level of demand for our products, which in turn is affected by factors such as overall levels of economic activity and business and consumer confidence and spending. Declines in global economic activity and consumer and business confidence and spending during the recent global downturn have significantly reduced the level of demand for our products. Reduced demand for our products has had and may continue to have an adverse impact on our business, financial condition, results of operations and cash flows. In addition, continued downturns in the economy impact the demand for refined fuels and, in turn, result in excess refining capacity. Refining margins are impacted by changes in domestic and global refining capacity, as increases in refining capacity can adversely impact refining margins, earnings and cash flows.
Our business is indirectly exposed to risks faced by our suppliers, customers and other business partners. The impact on these constituencies of the risks posed by the continued economic turmoil in the global financial system have included or could include interruptions or delays in the performance by counterparties to our contracts, reductions and delays in customer purchases, delays in or the inability of customers to obtain financing to purchase our products and the inability of customers to pay for our products. Any of these events may have an adverse impact on our business, financial condition, results of operations and cash flows.
The geographic concentration of our East Coast refineries creates a significant exposure to the risks of the local economy and other local adverse conditions.
Our East Coast refineries are both located in the mid-Atlantic region on the East Coast and therefore are vulnerable to economic downturns in that region. These refineries are located within a relatively limited geographic area and we primarily market our refined products in that area. As a result, we are more susceptible to regional conditions than the operations of more geographically diversified competitors and any unforeseen events or circumstances that affect the area could also materially adversely affect our revenues and profitability. These factors include, among other things, changes in the economy, damages to infrastructure, weather conditions, demographics and population.
We must make substantial capital expenditures on our operating facilities to maintain their reliability and efficiency. If we are unable to complete capital projects at their expected costs and/or in a timely manner, or if the market conditions assumed in our project economics deteriorate, our financial condition, results of operations or cash flows could be materially and adversely affected.
Delays or cost increases related to capital spending programs involving engineering, procurement and construction of new facilities (or improvements and repairs to our existing facilities and equipment) could adversely affect our ability to achieve targeted internal rates of return and operating results. Such delays or cost increases may arise as a result of unpredictable factors in the marketplace, many of which are beyond our control, including:
| • | denial or delay in issuing regulatory approvals and/or permits; |
21
Table of Contents
| • | unplanned increases in the cost of construction materials or labor; |
| • | disruptions in transportation of modular components and/or construction materials; |
| • | severe adverse weather conditions, natural disasters or other events (such as equipment malfunctions, explosions, fires or spills) affecting our facilities, or those of vendors and suppliers; |
| • | shortages of sufficiently skilled labor, or labor disagreements resulting in unplanned work stoppages; |
| • | market-related increases in a project’s debt or equity financing costs; and/or |
| • | non-performance or force majeure by, or disputes with, vendors, suppliers, contractors or sub-contractors involved with a project. |
Our refineries contain many processing units, a number of which have been in operation for many years. Equipment, even if properly maintained, may require significant capital expenditures and expenses to keep it operating at optimum efficiency. One or more of the units may require unscheduled downtime for unanticipated maintenance or repairs that are more frequent than our scheduled turnarounds for such units. Scheduled and unscheduled maintenance could reduce our revenues during the period of time that the units are not operating.
Our forecasted internal rates of return are also based upon our projections of future market fundamentals, which are not within our control, including changes in general economic conditions, available alternative supply and customer demand. Any one or more of these factors could have a significant impact on our business. If we were unable to make up the delays associated with such factors or to recover the related costs, or if market conditions change, it could materially and adversely affect our financial position, results of operations or cash flows.
Our operating results have generally been seasonal and generally lower in the first and fourth quarters of the year for our refining business.
Demand for gasoline is generally higher during the summer months than during the winter months due to seasonal increases in highway traffic and construction work. Decreased demand during the winter months can lower gasoline prices. As a result, our operating results for the first and fourth calendar quarters may be lower than those for the second and third calendar quarters of each year.
We may not be able to successfully execute our strategy of growth within the refining industry through acquisitions.
A component of our growth strategy is to selectively consider strategic acquisitions within the refining sector based on performance through the cycle, advantageous access to crude oil supplies, attractive refined products market fundamentals and access to distribution and logistics infrastructure. Our ability to do so will be dependent upon a number of factors, including our ability to identify acceptable acquisition candidates, consummate acquisitions on acceptable terms, successfully integrate acquired assets and obtain financing to fund acquisitions and to support our growth and many other factors beyond our control. Risks associated with acquisitions include those relating to the diversion of management time and attention from our existing business, liability for known or unknown environmental conditions or other contingent liabilities and greater than anticipated expenditures required for compliance with environmental, safety or other regulatory standards or for investments to improve operating results, and the incurrence of additional indebtedness to finance acquisitions or capital expenditures relating to acquired assets. We may also enter into transition services agreements in the future with sellers of any additional refineries we acquire. Such services may not be performed timely and effectively, and any significant disruption in such transition services or unanticipated costs related to such services could adversely affect our business and results of operations.
We may not be successful in acquiring additional assets, and any acquisitions that we do consummate may not produce the anticipated benefits or may have adverse effects on our business and operating results.
22
Table of Contents
Our business may suffer if any of our key senior executives or other key employees discontinues employment with us. Furthermore, a shortage of skilled labor or disruptions in our labor force may make it difficult for us to maintain labor productivity.
Our future success depends to a large extent on the services of our key senior executives and other key employees. Our business depends on our continuing ability to recruit, train and retain highly qualified employees in all areas of our operations, including engineering, accounting, business operations, finance and other key back-office and mid-office personnel. Furthermore, our operations require skilled and experienced employees with proficiency in multiple tasks. The competition for these employees is intense, and the loss of these executives or employees could harm our business. If any of these executives or other key personnel resigns or becomes unable to continue in his or her present role and is not adequately replaced, our business operations could be materially adversely affected.
A portion of our workforce is unionized, and we may face labor disruptions that would interfere with our operations.
As of September 30, 2012, approximately 289 of our 446 employees at Paulsboro are covered by a collective bargaining agreement that expires in March of 2015. In addition, 639 of our 986 employees at Delaware City and Toledo are covered by a collective bargaining agreement that is currently anticipated to expire in February of 2015. We may not be able to renegotiate our collective bargaining agreements on satisfactory terms or at all when such agreements expire. A failure to do so may increase our costs. Other employees of ours who are not presently represented by a union may become so represented in the future as well. In addition, our existing labor agreements may not prevent a strike or work stoppage at any of our facilities in the future, and any work stoppage could negatively affect our results of operations and financial condition.
Our hedging activities may limit our potential gains, exacerbate potential losses and involve other risks.
We may enter into commodity derivatives contracts to hedge our crack spread risk with respect to a portion of our expected gasoline and diesel production on a rolling basis. Consistent with that policy we, or MSCG at our request, may hedge some percentage of future gasoline and diesel production. We may enter into hedging arrangements with the intent to secure a minimum fixed cash flow stream on the volume of products hedged during the hedge term and to protect against volatility in commodity prices. Our hedging arrangements may fail to fully achieve these objectives for a variety of reasons, including our failure to have adequate hedging arrangements, if any, in effect at any particular time and the failure of our hedging arrangements to produce the anticipated results. We may not be able to procure adequate hedging arrangements due to a variety of factors. Moreover, such transactions may limit our ability to benefit from favorable changes in crude oil and refined product prices. In addition, our hedging activities may expose us to the risk of financial loss in certain circumstances, including instances in which:
| • | the volumes of our actual use of crude oil or production of the applicable refined products is less than the volumes subject to the hedging arrangement; |
| • | accidents, interruptions in feedstock transportation, inclement weather or other events cause unscheduled shutdowns or otherwise adversely affect our refineries, or those of our suppliers or customers; |
| • | changes in commodity prices have a material impact on collateral and margin requirements under our hedging arrangements, including resulting in our being subject to margin calls; |
| • | the counterparties to our futures contracts fail to perform under the contracts; or |
| • | a sudden, unexpected event materially impacts the commodity or crack spread subject to the hedging arrangement. |
As a result, the effectiveness of our hedging strategy could have material impact on our financial results. See “Management’s Discussion and Analysis of Financial Condition and Results of Operations—Quantitative and Qualitative Disclosures About Market Risk.”
23
Table of Contents
In addition, these hedging activities involve basis risk. Basis risk in a hedging arrangement occurs when the price of the commodity we hedge is more or less variable than the index upon which the hedged commodity is based, thereby making the hedge less effective. For example, a NYMEX index used for hedging certain volumes of crude oil or refined products may have more or less variability than the cost or price for such crude oil or refined products. We generally do not expect to hedge the basis risk inherent in our derivatives contracts.
Our commodity derivative activities could result in period-to-period earnings volatility.
We do not apply hedge accounting to all of our commodity derivative contracts and, as a result, unrealized gains and losses will be charged to our earnings based on the increase or decrease in the market value of the unsettled position. These gains and losses may be reflected in our income statement in periods that differ from when the underlying hedged items (i.e., gross margins) are reflected in our income statement. Such derivative gains or losses in earnings may produce significant period-to-period earnings volatility that is not necessarily reflective of our underlying operational performance.
The adoption of derivatives legislation by the United States Congress could have an adverse effect on our ability to use derivatives contracts to reduce the effect of commodity price, interest rate and other risks associated with our business.
The United States Congress in 2010 adopted the Dodd-Frank Wall Street Reform and Consumer Protection Act, or the Dodd-Frank Act, which, among other things, established federal oversight and regulation of the over-the-counter derivatives market and entities that participate in that market. In connection with the Dodd-Frank Act, the Commodity Futures Trading Commission, or the CFTC, adopted regulations to set position limits for certain futures and option contracts in the major energy markets. Although these regulations were recently vacated by the U.S. District Court for the District of Columbia, the court remanded the matter to the CFTC and the CFTC is currently exploring other ways to proceed. The legislation may also require us to comply with margin requirements, and with certain clearing and trade-execution requirements if we do not satisfy certain specific exceptions. The legislation may also require the counterparties to our derivatives contracts to transfer or assign some of their derivatives contracts to a separate entity, which may not be as creditworthy as the current counterparty. The legislation and any new regulations could significantly increase the cost of derivatives contracts (including through requirements to post collateral), materially alter the terms of derivatives contracts, reduce the availability of derivatives to protect against risks we encounter, reduce our ability to monetize or restructure our existing derivatives contracts, and increase our exposure to less creditworthy counterparties. If we reduce our use of derivatives as a result of the legislation and regulations, our results of operations may become more volatile and our cash flows may be less predictable, which could adversely affect our ability to plan for and fund capital expenditures. Any of these consequences could have a material adverse effect on us, our financial condition and our results of operations.
Our operations could be disrupted if our information systems fail, causing increased expenses and loss of sales.
Our business is highly dependent on financial, accounting and other data processing systems and other communications and information systems, including our enterprise resource planning tools. We process a large number of transactions on a daily basis and rely upon the proper functioning of computer systems. If a key system was to fail or experience unscheduled downtime for any reason, even if only for a short period, our operations and financial results could be affected adversely. Our systems could be damaged or interrupted by a security breach, fire, flood, power loss, telecommunications failure or similar event. We have a formal disaster recovery plan in place, but this plan may not prevent delays or other complications that could arise from an information systems failure. Further, our business interruption insurance may not compensate us adequately for losses that may occur.
24
Table of Contents
We may have difficulty implementing our enterprise-wide information systems.
We are making a substantial investment in new enterprise-wide information systems. The systems may not function as we expect when subjected to the demands of our operations and our employees may have problems adapting to the new processes and procedures necessary to operate the new systems. If these systems do not function as expected during the implementation period or our employees are not able to comply with the process and procedural demands of the new systems, we could have difficulty, for example, procuring products, scheduling deliveries to our customers, invoicing our customers, paying our suppliers, managing our inventories, analyzing our performance and preparing financial statements. In addition, we could incur substantial additional expense if the implementation takes longer than currently planned. If we experience difficulty implementing our new enterprise-wide information systems, it could have a material adverse impact on our financial condition and results of operations.
Product liability claims and litigation could adversely affect our business and results of operations.
Product liability is a significant commercial risk. Substantial damage awards have been made in certain jurisdictions against manufacturers and resellers based upon claims for injuries and property damage caused by the use of or exposure to various products. Failure of our products to meet required specifications or claims that a product is inherently defective could result in product liability claims from our shippers and customers, and also arise from contaminated or off-specification product in commingled pipelines and storage tanks and/or defective fuels. Product liability claims against us could have a material adverse effect on our business or results of operations.
We may incur significant liability under or costs and capital expenditures to comply with environmental, product specification, health and safety regulations, which are complex and change frequently.
Our refinery and pipeline operations are subject to federal, state and local laws regulating, among other things, the generation, storage, handling, use and transportation of petroleum and other regulated materials, the emission and discharge of materials into the environment, waste management, remediation of contaminated sites, characteristics and composition of gasoline and diesel and other matters otherwise relating to the protection of the environment. Our operations are also subject to various laws and regulations relating to occupational health and safety.
Compliance with the complex array of federal, state and local laws relating to the protection of the environment, product specification, health and safety is difficult. We may not be able to operate in compliance with all environmental, product specification, health and safety requirements at all times. Violations of applicable requirements could result in substantial fines and penalties, criminal sanctions, permit revocations, injunctions and/or facility shutdowns, or claims for alleged personal injury, property damage or damage to natural resources. Moreover, our business is subject to accidental spills, discharges or other releases of petroleum or other regulated materials into the environment including at neighboring areas or third party storage, treatment or disposal facilities. Certain environmental laws impose strict, and in certain circumstances, joint and several, liability for costs of investigation and cleanup of such spills, discharges or releases on owners and operators of, as well as persons who arrange for treatment or disposal of regulated materials at, contaminated sites. Under these laws, we may be required to pay more than our fair share of any required investigation or cleanup of such sites.
We cannot predict what additional environmental, product specification, health and safety legislation or regulations will be adopted in the future, or how existing or future laws or regulations will be administered or interpreted with respect to our operations. Many of these laws and regulations are becoming increasingly stringent, and the cost of compliance with these requirements can be expected to increase over time. For example, in 2010 New York State adopted a Low-Sulfur Heating Oil mandate that beginning July 1, 2012 requires all heating oil sold in New York State to contain no more than 15 PPM sulfur. Not all of the heating oil we produce meets this specification. In addition, on June 1, 2012, the EPA issued final amendments to the New Source Performance Standards (“NSPS”) for petroleum refineries, including standards for emissions of nitrogen
25
Table of Contents
oxides from process heaters and work practice standards and monitoring requirements for flares. We are evaluating the regulation and amended standards, as may be applicable to the flare, process heaters and operations at our refineries. We cannot currently predict the costs that we may have to incur, if any, to comply by July 1, 2015 with the amended NSPS, but these costs could be material. Furthermore, the EPA has announced that it plans to propose new “Tier 3” motor vehicle emission and fuel standards. It has been reported that these new Tier 3 regulations may, among other things, lower the maximum average sulfur content of gasoline from 30 PPM to 10 PPM. If the Tier 3 regulations are eventually implemented and lower the maximum allowable content of sulfur or other constituents in fuels that we produce, we may at some point in the future be required to make significant capital expenditures and/or incur materially increased operating costs to comply with the new standards. Expenditures or costs for environmental, product specification, health and safety compliance could have a material adverse effect on our results of operations, financial condition and profitability.
We may also incur liability or be required to pay penalties for past contamination, and third parties may assert claims against us for damages allegedly arising out of any past or future contamination. The potential penalties and clean-up costs for past or future releases or spills, the failure of prior owners of our facilities to complete their clean-up obligations, the liability to third parties for damage to their property, or the need to address newly-discovered information or conditions that may require a response could be significant, and the payment of these amounts could have a material adverse effect on our business, financial condition and results of operations.
Furthermore, we operate in environmentally sensitive coastal waters where tanker, pipeline and refined product transportation operations are closely regulated by federal, state and local agencies and monitored by environmental interest groups.
Finally, transportation of crude oil and refined products over water involves inherent risk and subjects us to the provisions of the Federal Oil Pollution Act of 1990 and the laws of various states. Among other things, these laws require us to demonstrate in some situations our capacity to respond to a “worst case discharge” to the maximum extent possible. There may be accidents involving tankers transporting crude oil or refined products, and response service companies that we have contracted with, in the areas in which we transport crude oil and refined products, may not respond to a “worst case discharge” in a manner that will adequately contain that discharge, and we may be subject to liability in connection with a discharge.
Environmental clean-up and remediation costs of our sites and environmental litigation could decrease our net cash flow, reduce our results of operations and impair our financial condition.
We are subject to liability for the investigation and clean-up of environmental contamination at each of the properties that we own or operate and at off-site locations where we arrange for the treatment or disposal of regulated materials. We may become involved in future litigation or other proceedings. If we were to be held responsible for damages in any litigation or proceedings, such costs may not be covered by insurance and may be material. Historical soil and groundwater contamination has been identified at each of our refineries. Currently remediation projects are underway in accordance with regulatory requirements at the Paulsboro and Delaware City refineries. In connection with the acquisitions of our refineries, the prior owners have retained certain liabilities or indemnified us for certain liabilities, including those relating to pre-acquisition soil and groundwater conditions, and in some instances we have assumed certain liabilities and environmental obligations, including certain remediation obligations at the Paulsboro refinery. If the prior owners fail to satisfy their obligations for any reason, or if significant liabilities arise in the areas in which we assumed liability, we may become responsible for remediation expenses and other environmental liabilities, which could have a material adverse effect on our financial condition. As a result, in addition to making capital expenditures or incurring other costs to comply with environmental laws, we also may be liable for significant environmental litigation or for investigation and remediation costs and other liabilities arising from the ownership or operation of these assets by prior owners, which could materially adversely affect our financial condition, results of operations and cash flow. See “Management’s Discussion and Analysis of Financial Condition and Results of Operations—Pro Forma Contractual Obligations and Commitments” and “Business—Environmental, Health and Safety Matters.”
26
Table of Contents
We may also face liability arising from current or future claims alleging personal injury or property damage due to exposure to chemicals or other regulated materials, such as asbestos, benzene, MTBE and petroleum hydrocarbons, at or from our facilities. We may also face liability for personal injury, property damage, natural resource damage or clean-up costs for the alleged migration of contamination from our properties. A significant increase in the number or success of these claims could materially adversely affect our financial condition, results of operations and cash flow.
Regulation of emissions of greenhouse gases could force us to incur increased capital and operating costs and could have a material adverse effect on our results of operations and financial condition.
Both houses of Congress have actively considered legislation to reduce emissions of GHGs, such as carbon dioxide and methane, including proposals to: (i) establish a cap and trade system, (ii) create a federal renewable energy or “clean” energy standard requiring electric utilities to provide a certain percentage of power from such sources, and (iii) create enhanced incentives for use of renewable energy and increased efficiency in energy supply and use. In addition, the EPA is taking steps to regulate GHGs under the existing federal Clean Air Act, or CAA. The EPA has already adopted regulations limiting emissions of GHGs from motor vehicles, addressing the permitting of GHG emissions from stationary sources, and requiring the reporting of GHG emissions from specified large GHG emission sources, including refineries. These and similar regulations could require us to incur costs to monitor and report GHG emissions or reduce emissions of GHGs associated with our operations. In addition, various states, individually as well as in some cases on a regional basis, have taken steps to control GHG emissions, including adoption of GHG reporting requirements, cap and trade systems and renewable portfolio standards. Efforts have also been undertaken to delay, limit or prohibit EPA and possibly state action to regulate GHG emissions, and it is not possible at this time to predict the ultimate form, timing or extent of federal or state regulation. In the event we do incur increased costs as a result of increased efforts to control GHG emissions, we may not be able to pass on any of these costs to our customers. Such requirements also could adversely affect demand for the refined petroleum products that we produce. Any increased costs or reduced demand could materially and adversely affect our business and results of operation.
Renewable fuels mandates may reduce demand for the refined fuels we produce, which could have a material adverse effect on our results of operations and financial condition.
Pursuant to the Energy Policy Act of 2005 and the Energy Independence and Security Act of 2007, the EPA has issued Renewable Fuel Standards, or RFS, implementing mandates to blend renewable fuels into the petroleum fuels produced and sold in the United States. Under RFS, the volume of renewable fuels that obligated refineries must blend into their finished petroleum fuels increases annually over time until 2022. In addition, certain states have passed legislation that requires minimum biodiesel blending in finished distillates. On October 13, 2010, the EPA raised the maximum amount of ethanol allowed under federal law from 10% to 15% for cars and light trucks manufactured since 2007. The maximum amount allowed under federal law currently remains at 10% ethanol for all other vehicles. Existing laws and regulations could change, and the minimum volumes of renewable fuels that must be blended with refined petroleum fuels may increase. Because we do not produce renewable fuels, increasing the volume of renewable fuels that must be blended into our products displaces an increasing volume of our refinery’s product pool, potentially resulting in lower earnings and profitability. In addition, in order to meet certain of these and future EPA requirements, we must purchase credits, known as “RINS,” which have fluctuating costs.
Our pipelines are subject to federal and/or state regulations, which could reduce the amount of cash we generate.
Our transportation activities are subject to regulation by multiple governmental agencies. The regulatory burden on the industry increases the cost of doing business and affects profitability. Additional proposals and proceedings that affect the oil industry are regularly considered by Congress, the states, the Federal Energy Regulatory Commission, the United States Department of Transportation, and the courts. We cannot predict when or whether any such proposals may become effective or what impact such proposals may have. Projected
27
Table of Contents
operating costs related to our pipelines reflect the recurring costs resulting from compliance with these regulations, and these costs may increase due to future acquisitions, changes in regulation, changes in use, or discovery of existing but unknown compliance issues.
We are subject to strict laws and regulations regarding employee and process safety, and failure to comply with these laws and regulations could have a material adverse effect on our results of operations, financial condition and profitability.
We are subject to the requirements of the Occupational Safety & Health Administration, or OSHA, and comparable state statutes that regulate the protection of the health and safety of workers. In addition, OSHA requires that we maintain information about hazardous materials used or produced in our operations and that we provide this information to employees, state and local governmental authorities, and local residents. Failure to comply with OSHA requirements, including general industry standards, process safety standards and control of occupational exposure to regulated substances, could have a material adverse effect on our results of operations, financial condition and the cash flows of the business if we are subjected to significant fines or compliance costs.
Compliance with and changes in tax laws could adversely affect our performance.
We are subject to extensive tax liabilities, including federal, state, local and foreign taxes such as income, excise, sales/use, payroll, franchise, property, gross receipts, withholding and ad valorem taxes. New tax laws and regulations and changes in existing tax laws and regulations are continuously being enacted or proposed that could result in increased expenditures for tax liabilities in the future. These liabilities are subject to periodic audits by the respective taxing authorities, which could increase our tax liabilities. Subsequent changes to our tax liabilities as a result of these audits may also subject us to interest and penalties. There can be no certainty that our federal, state, local or foreign taxes could be passed on to our customers.
Our rapid growth may strain our resources and divert management’s attention.
We were a development stage enterprise prior to our acquisition of Paulsboro on December 17, 2010. With the further acquisition of Toledo and the re-start of Delaware City, we have experienced rapid growth in a short period of time. Continued expansion may strain our resources and force management to focus attention from other business concerns to the development of incremental internal controls and procedures, which could harm our business and operating results. We may also need to hire more employees, which will increase our costs and expenses.
We rely on Statoil and MSCG, over whom we may have limited control, to provide us with certain volumetric and pricing data used in our inventory valuations.
We rely on Statoil and MSCG to provide us with certain volumetric and pricing data used in our inventory valuations. Our limited control over the accuracy and the timing of the receipt of this data could materially and adversely affect our ability to produce financial statements in a timely manner.
Changes in our credit profile could adversely affect our business.
Changes in our credit profile could affect the way crude oil suppliers view our ability to make payments and induce them to shorten the payment terms for our purchases or require us to post security or letters of credit prior to payment. Due to the large dollar amounts and volume of our crude oil and other feedstock purchases, any imposition by our suppliers of more burdensome payment terms on us may have a material adverse effect on our liquidity and our ability to make payments to our suppliers. This, in turn, could cause us to be unable to operate one or more of our refineries at full capacity.
28
Table of Contents
We could incur substantial costs or disruptions in our business if we cannot obtain or maintain necessary permits and authorizations.
Our operations require numerous permits and authorizations under various laws and regulations, including environmental and health and safety laws and regulations. These authorizations and permits are subject to revocation, renewal or modification and can require operational changes, which may involve significant costs, to limit impacts or potential impacts on the environment and/or health and safety. A violation of these authorizations or permit conditions or other legal or regulatory requirements could result in substantial fines, criminal sanctions, permit revocations, injunctions and/or refinery shutdowns. In addition, major modifications of our operations could require changes to our existing permits or expensive upgrades to our existing pollution control equipment, which could have a material adverse effect on our business, financial condition or results of operations.
Risks Related to Our Indebtedness
Our substantial indebtedness could adversely affect our financial condition and prevent us from fulfilling our obligations under our indebtedness.
Our substantial indebtedness may significantly affect our financial flexibility in the future. As of September 30, 2012, we have total long-term debt, including current maturities and the Delaware Economic Development Authority Loan, of $733.0 million, all of which is secured, and we could have incurred an additional $495.1 million of senior secured indebtedness under our existing debt agreements. We may incur additional indebtedness in the future. Our strategy includes executing future refinery acquisitions. Any significant acquisition would likely require us to incur additional indebtedness in order to finance all or a portion of such acquisition. The level of our indebtedness has several important consequences for our future operations, including that:
| • | a significant portion of our cash flow from operations will be dedicated to the payment of principal of, and interest on, our indebtedness and will not be available for other purposes; |
| • | covenants contained in our existing debt arrangements limit our ability to borrow additional funds, dispose of assets and make certain investments; |
| • | these covenants also require us to meet or maintain certain financial tests, which may affect our flexibility in planning for, and reacting to, changes in our industry, such as being able to take advantage of acquisition opportunities when they arise; |
| • | our ability to obtain additional financing for working capital, capital expenditures, acquisitions, general corporate and other purposes may be limited; and |
| • | we may be at a competitive disadvantage to those of our competitors that are less leveraged; and we may be more vulnerable to adverse economic and industry conditions. |
Our substantial indebtedness increases the risk that we may default on our debt obligations, certain of which contain cross-default and/or cross-acceleration provisions. We have significant principal payments due under our debt instruments. Our subsidiaries’ ability to meet their principal obligations will be dependent upon our future performance, which in turn will be subject to general economic conditions, industry cycles and financial, business and other factors affecting our operations, many of which are beyond our control. Our business may not continue to generate sufficient cash flow from operations to repay our substantial indebtedness. If we are unable to generate sufficient cash flow from operations, we may be required to sell assets, to refinance all or a portion of our indebtedness or to obtain additional financing. Refinancing may not be possible and additional financing may not be available on commercially acceptable terms, or at all.
Despite our level of indebtedness, we and our subsidiaries may be able to incur substantially more debt, which could exacerbate the risks described above.
We and our subsidiaries may be able to incur substantial additional indebtedness in the future including additional secured debt. Although our debt instruments and financing arrangements contain restrictions on the
29
Table of Contents
incurrence of additional indebtedness, these restrictions are subject to a number of qualifications and exceptions, and the indebtedness incurred in compliance with these restrictions could be substantial. To the extent new debt is added to our currently anticipated debt levels, the substantial leverage risks described above would increase. Also, these restrictions do not prevent us from incurring obligations that do not constitute indebtedness.
Restrictive Covenants in our debt instruments may limit our ability to undertake certain types of transactions.
Various covenants in our debt instruments and other financing arrangements may restrict our and our subsidiaries’ financial flexibility in a number of ways. Our indebtedness subjects us to significant financial and other restrictive covenants, including restrictions on our ability to incur additional indebtedness, place liens upon assets, pay dividends or make certain other restricted payments and investments, consummate certain asset sales or asset swaps, conduct businesses other than our current businesses, or sell, assign, transfer, lease, convey or otherwise dispose of all or substantially all of our assets. Some of these debt instruments also require our subsidiaries to satisfy or maintain certain financial condition tests in certain circumstances. Our subsidiaries’ ability to meet these financial condition tests can be affected by events beyond our control and they may not meet such tests.
We may have capital needs for which our internally generated cash flows and other sources of liquidity may not be adequate.
If we cannot generate sufficient cash flows or otherwise secure sufficient liquidity to support our short-term and long-term capital requirements, we may not be able to meet our payment obligations in connection with the acquisitions of our refineries (including any earn-outs), or our future debt obligations, comply with certain deadlines related to environmental regulations and standards, or pursue our business strategies, in which case our operations may not perform as we currently expect. We have substantial short-term capital needs and may have substantial long term capital needs. Our short-term working capital needs are primarily related to financing certain of our refined products inventory not covered by our various clean products offtake agreements. We have recently terminated our agreement with Statoil for our Paulsboro refinery effective March 31, 2013. If we cannot adequately handle our crude oil and feedstock requirements without the benefit of the Statoil arrangement at Paulsboro, or if we are required to obtain our crude oil supply at our other refineries without the benefit of the existing supply arrangements or the applicable counterparty defaults in its obligations, our crude oil pricing costs may increase as the number of days between when we pay for the crude oil and when the crude oil is delivered to us increases. Such increased exposure could negatively impact our liquidity due to our increased working capital needs as a result of the increase in the amount of crude oil inventory we would have to carry on our balance sheet. Our long-term needs for cash include those to support ongoing capital expenditures for equipment maintenance and upgrades during turnarounds at our refineries and to complete our routine and normally scheduled maintenance, regulatory and security expenditures. In addition, from time to time, we are required to spend significant amounts for repairs when one or more processing units experiences temporary shutdowns. We continue to utilize significant capital to upgrade equipment, improve facilities, and reduce operational, safety and environmental risks. In connection with the Paulsboro acquisition, we assumed certain significant environmental obligations, and may similarly do so in future acquisitions. We will likely incur substantial compliance costs in connection with new or changing environmental, health and safety regulations. See “Management’s Discussion and Analysis of Financial Condition and Results of Operations—Pro Forma Contractual Obligations and Commitments.” Our liquidity will affect our ability to satisfy any of these needs or obligations.
Risks Relating to This Offering and Ownership of Our Class A Common Stock
You will experience an immediate and substantial dilution in the net tangible book value of the Class A common stock you purchase in this offering.
The initial public offering price per share of our Class A common stock is substantially higher than the pro forma net tangible book value per share of our Class A common stock immediately after this offering. As a result, you may pay a price per share that substantially exceeds the book value of our assets after subtracting our
30
Table of Contents
liabilities. Investors who purchase Class A common stock in this offering will be diluted by $ per share after giving effect to the sale of shares of Class A common stock in this offering at an assumed initial public offering price of $ per share, the mid-point of the estimated price range set forth on the cover page of this prospectus. If we grant options in the future to our employees, and those options are exercised or other issuances of Class A common stock are made, there will be further dilution. See “Dilution.”
A significant portion of the proceeds from this offering will be used to purchase PBF LLC Series A Units from Blackstone and First Reserve.
We intend to use a significant portion of the proceeds from this offering to purchase PBF LLC Series A Units (which will be reclassified as PBF LLC Series C Units in connection with such acquisition) from Blackstone and First Reserve as described under “Organizational Structure—Offering Transactions.” Accordingly, we will not retain any of these proceeds. See “Use of Proceeds” included elsewhere in this prospectus.
There is no existing market for our Class A common stock, and we do not know if one will develop to provide you with adequate liquidity.
Prior to this offering, there has not been a public market for our Class A common stock. We have applied to list our Class A common stock on the NYSE. We cannot predict the extent to which investor interest in our company will lead to the development of a trading market on the NYSE or otherwise or how liquid that market might become. If an active trading market does not develop, you may have difficulty selling any of our Class A common stock that you buy. The initial public offering price for the shares was determined by negotiations between us and the representatives of the underwriters based on numerous factors that we discuss in the “Underwriting” section of this prospectus and may not be indicative of prices that will prevail in the open market following this offering.
Consequently, you may not be able to sell our Class A common stock at prices equal to or greater than the price you paid in this offering.
The initial public offering price of our Class A common stock may not be indicative of the market price of our Class A common stock after this offering and our stock price may be highly volatile.
The initial public offering price of our Class A common stock is based on numerous factors and may not be indicative of the market price of our Class A common stock after this offering. The market price may be affected by such factors as:
| • | variations in actual or anticipated operating results; |
| • | changes in, or failure to meet, earnings estimates of securities analysts; |
| • | market conditions in the oil refining industry; |
| • | regulatory actions; |
| • | general economic and stock market conditions; and |
| • | the availability for sale, or sales, of a significant number of shares of our Class A common stock in the public market. |
These and other factors may cause the market price of our Class A common stock to decline below the initial public offering price, which in turn would adversely affect the value of your investment.
In the past, following periods of volatility in the market price of a company’s securities, stockholders have often instituted class action securities litigation against those companies. Such litigation, if instituted, could result in substantial costs and a diversion of management’s attention and resources, which could significantly harm our profitability and reputation.
31
Table of Contents
We cannot assure you that we will declare dividends or have the available cash to make dividend payments. We are a holding company that depends upon cash from our subsidiaries to meet our obligations and/or to pay dividends in the future.
We currently intend to pay quarterly cash dividends in an amount equal to approximately $0.20 per share of Class A common stock following this offering, commencing after the completion of the first quarter of 2013. The declaration, amount and payment of this and any other future dividends on shares of Class A common stock will be at the sole discretion of our board of directors, and we are not obligated under any applicable laws, our governing documents or any contractual agreements with our existing owners or otherwise to declare or pay any dividends or other distributions (other than the obligations of PBF LLC to make tax distributions to its members). Our board of directors may take into account, among other things, general economic conditions, our financial condition and operating results, our available cash and current and anticipated cash needs, capital requirements, plans for expansion, tax, legal, regulatory and contractual restrictions and implications, including under our outstanding debt documents, and such other factors as our board of directors may deem relevant in determining whether to declare or pay any dividend. As a result, if we do not declare dividends you may not receive any return on an investment in our Class A common stock unless you sell our Class A common stock for a price greater than that which you paid for it. Any dividends that we may declare and pay will not be cumulative.
We are a holding company and all of our operations are conducted through subsidiaries of PBF Holding. We have no independent means of generating revenue and no material assets other than our ownership interest in PBF LLC. Therefore, we depend on the earnings and cash flow of our subsidiaries to meet our obligations, including our indebtedness, tax liabilities and obligations to make payments under the tax receivable agreement. If we or PBF LLC do not receive such cash distributions, dividends or other payments from our subsidiaries, we and PBF LLC may be unable to meet our obligations and/or pay dividends.
We intend to cause PBF LLC to make distributions to its members in an amount sufficient to enable us to cover all applicable taxes at assumed tax rates, make payments owed by us under the tax receivable agreement, and to pay other obligations and dividends, if any, declared by us. To the extent we need funds and PBF LLC or any of its subsidiaries is restricted from making such distributions under applicable law or regulation or under the terms of our financing or other contractual arrangements, or is otherwise unable to provide such funds, such restrictions could materially adversely affect our liquidity and financial condition.
Our ABL Revolving Credit Facility, senior secured notes and certain of our other outstanding debt arrangements include a restricted payment covenant, which restricts the ability of PBF Holding to make distributions to us, and we anticipate our future debt will contain a similar restriction. In addition, there may be restrictions on payments by our subsidiaries under applicable laws, including laws that require companies to maintain minimum amounts of capital and to make payments to stockholders only from profits. For example, PBF Holding is generally prohibited under Delaware law from making a distribution to a member to the extent that, at the time of the distribution, after giving effect to the distribution, liabilities of the limited liability company (with certain exceptions) exceed the fair value of its assets. As a result, we may be unable to obtain that cash to satisfy our obligations and make payments to our stockholders, if any.
Certain participants in our directed share program must hold their shares for a minimum of 180 days following the date of the final prospectus related to this offering and accordingly will be subject to market risks not imposed on other investors in the offering.
At our request, the underwriters have reserved up to shares of our Class A common stock offered hereby for sale to our employees and certain other participants through a directed share program. Purchasers of these shares who have entered into a lock-up agreement with the underwriters in connection with this offering, which include some of our directors, officers, employees and certain other persons who are otherwise associated with us, will be required to agree that they will not, subject to exceptions, offer, sell, contract to sell or otherwise dispose of or hedge any shares of Class A common stock for a period of 180 days after the date of the final prospectus relating to this offering, subject to certain specified extensions. As a result of such restriction, such purchasers may face risks not faced by other investors who have the right to sell their shares of Class A common stock at any time following this offering. These risks include the market risk of holding our shares of Class A common stock during the period that such restrictions are in effect. In addition, the price of our Class A
32
Table of Contents
common stock may be adversely affected following expiration of the lock-up period if there is an increase in the number of shares for sale in the market.
Future sales of our shares could depress the market price of our Class A common stock.
The market price of our Class A common stock could decline as a result of sales of a large number of shares of Class A common stock in the market after the offering or the perception that such sales could occur. These sales, or the possibility that these sales may occur, also might make it more difficult for us to sell equity securities in the future at a time and at a price that we deem appropriate.
The shares of Class A common stock we are offering will be freely tradable without restriction in the United States, unless purchased by one of our affiliates. In connection with this offering, we, our executive officers and directors and Blackstone and First Reserve have agreed with the underwriters, subject to certain exceptions, not to sell, dispose of or hedge any of our Class A common stock or securities convertible into or exchangeable for shares of Class A common stock, during the period ending 180 days after the date of this prospectus, except with the prior written consent of Citigroup Global Markets Inc. and Morgan Stanley & Co. LLC. See “Underwriting.” After the expiration of the 180-day lock-up period, we are required to register the issuance and resale of the shares of Class A common stock that may be issued to our existing owners pursuant to the exchange agreement. These shares also may be sold under Rule 144 under the Securities Act of 1933, as amended, depending on the holding period and subject to restrictions in the case of shares held by persons deemed to be our affiliates. As restrictions on resale end or if we register additional shares, the market price of our stock could decline if the holders of restricted shares sell them or are perceived by the market as intending to sell them.
If securities or industry analysts do not publish research or reports about our business, or if they downgrade their recommendations regarding our Class A common stock, our stock price and trading volume could decline.
The trading market for our Class A common stock will be influenced by the research and reports that industry or securities analysts publish about us or our business. If any of the analysts who cover us downgrade our Class A common stock or publish inaccurate or unfavorable research about our business, our Class A common stock price would likely decline. If analysts cease coverage of us or fail to regularly publish reports on us, we could lose visibility in the financial markets, which in turn could cause our Class A common stock price or trading volume to decline and our Class A common stock to be less liquid.
As a “controlled company” within the meaning of the NYSE rules, we will qualify for, and intend to rely on, exemptions from certain corporate governance requirements.
Upon completion of this offering Blackstone and First Reserve will continue to control a majority of the combined voting power of all classes of our voting stock. As a result, we will be a “controlled company” within the meaning of the NYSE corporate governance standards. Under the NYSE rules, a company of which more than 50% of the voting power is held by another company is a “controlled company” and may elect not to comply with certain NYSE corporate governance requirements, including (1) the requirement that a majority of the board of directors consist of independent directors, (2) the requirement that we have a corporate governance committee that is composed entirely of independent directors with a written charter addressing the committee’s purpose and responsibilities, (3) the requirement that we have a compensation committee that is composed entirely of independent directors with a written charter addressing the committee’s purpose and responsibilities and (4) the requirement that there be an annual performance evaluation of the corporate governance and compensation committees. If available, we intend to utilize some or all of these exemptions. As a result, we will not be required to have a majority of independent directors nor will our nominating and corporate governance and compensation committees be required to consist entirely of independent directors. We will rely on the phase-in rules of the SEC and NYSE with respect to the independence of our audit committee. These rules permit us to have an audit committee that has one member that is independent upon the effectiveness of the registration
33
Table of Contents
statement of which this prospectus forms a part, a majority of members that are independent within 90 days thereafter and all members that are independent within one year thereafter. Accordingly, you would not have the same protections afforded to stockholders of companies that are subject to all of the corporate governance requirements of the NYSE.
Our internal controls over financial reporting currently do not meet all of the standards contemplated by Section 404 of the Sarbanes-Oxley Act of 2002, and failure to achieve and maintain effective internal controls over financial reporting in accordance with Section 404 of the Sarbanes-Oxley Act could have a material adverse effect on our business and share price.
As a result of this offering, we will become subject to reporting and other obligations under the Securities Exchange Act of 1934, as amended. Beginning with the year ending December 31, 2013, pursuant to Section 404 of the Sarbanes-Oxley Act, we will be required to furnish a report by our management on our internal control over financial reporting, and our auditors will be required to deliver an attestation report on the operating effectiveness of our internal control over financial reporting. The report by our management must contain, among other things, an assessment of the effectiveness of our internal control over financial reporting as of the end of our fiscal year. This assessment must include disclosure of any material weaknesses in our internal control over financial reporting identified by management.
As an organization that recently exited the development stage and has grown rapidly through the acquisition of significant operations, we are currently in the process of developing our internal controls over financial reporting and establishing formal policies, processes and practices related to financial reporting and to the identification of key financial reporting risks, assessment of their potential impact and linkage of those risks to specific areas and activities within our organization. Our internal controls over financial reporting currently do not meet all of the standards contemplated by Section 404 of the Sarbanes-Oxley Act that we will eventually be required to meet.
In connection with the preparation of our financial statements during 2011, we identified a material weakness relating to controls over critical business and accounting functions performed by third party service providers and significant deficiencies regarding spreadsheet controls and the timely completion and review of account reconciliations and other analyses as part of our financial closing process. Management has taken the following steps to remediate these issues:
| • | In August 2011, we retained a nationally recognized certified public accounting firm to assist us with assessing, designing and documenting our internal control procedures to satisfy the requirements of Section 404 of the Sarbanes-Oxley Act; |
| • | We hired additional resources (and expect to continue to hire additional resources) to assist with completing the financial statement closing process on a more timely basis; |
| • | We are in the process of documenting our financial statement closing process, including establishing more comprehensive account reconciliation and review procedures and spreadsheet controls; |
| • | We developed and implemented information technology systems, accounting processes and procedures, and hired commercial, accounting and information technology personnel in order to bring in-house the business and accounting processes that were performed by third parties. We expect to continue to develop and improve these new systems and processes. |
We may not be able to successfully remediate these matters on or before December 31, 2013, the date by which we must comply with Section 404 of the Sarbanes-Oxley Act, and we may have additional deficiencies or material weaknesses in the future. We have not yet determined the costs directly associated with these remediation activities, but they could be substantial.
If we are not able to complete our initial assessment of our internal controls and otherwise implement the requirements of Section 404 of the Sarbanes-Oxley Act in a timely manner or with adequate compliance,
34
Table of Contents
management may not be able to certify as to the adequacy of our internal controls over financial reporting. Matters impacting our internal controls may cause us to be unable to report our financial information on a timely basis and thereby subject us to adverse regulatory consequences, including sanctions by the SEC or violations of applicable stock exchange listing rules, and result in a breach of the covenants under our debt agreements. There also could be a negative reaction in the financial markets due to a loss of investor confidence in us and the reliability of our financial statements. Confidence in the reliability of our financial statements also could suffer if our independent registered public accounting firm were to report a material weakness in our internal controls over financial reporting in the future. This could materially adversely affect us and lead to a decline in our Class A common stock price.
We are controlled by our existing owners, whose interests may differ from those of our public stockholders.
We are controlled, and after this offering will continue to be controlled, by Blackstone and First Reserve. After the completion of this offering, each of Blackstone and First Reserve will continue to beneficially own in the aggregate approximately % of the combined voting power of our common stock (or % if the underwriters exercise their option to purchase additional shares in full). As a result, Blackstone and First Reserve will have the ability to elect all of our directors and thereby control our policies and operations, including the appointment of management, future issuances of our Class A common stock or other securities, the payment of dividends, if any, on our Class A common stock, the incurrence of debt by us, amendments to our certificate of incorporation and bylaws and the entering into of extraordinary transactions, and their interests may not in all cases be aligned with your interests.
Our existing owners, including Blackstone and First Reserve, hold all of the outstanding PBF LLC Series A Units. Because our existing owners hold their economic interest in our business through PBF LLC, rather than through the public company, they may have conflicting interests with holders of shares of our Class A common stock. For example, our existing owners may have different tax positions from us which could influence their decisions regarding whether and when to dispose of assets, whether and when to incur new or refinance existing indebtedness, especially in light of the existence of the tax receivable agreement that we will enter into in connection with this offering, and whether and when we should undergo certain changes of control within the meaning of the tax receivable agreement or terminate the tax receivable agreement, which would accelerate our obligations thereunder. In addition, the structuring of future transactions may take into consideration these tax or other considerations even where no similar benefit would accrue to us. See “Certain Relationships and Related Transactions—Tax Receivable Agreement.”
Blackstone and First Reserve may have an interest in pursuing acquisitions, divestitures and other transactions that, in their judgment, could enhance their equity investment, even though such transactions might involve risks to you. For example, they could cause us to make acquisitions that increase our indebtedness or to sell revenue-generating assets. So long as they continue to beneficially own a majority of the combined voting power of our common stock, they will have the ability to control the vote in any election of directors. In addition, pursuant to a stockholders agreement entered into between us and Blackstone and First Reserve, following this offering Blackstone and First Reserve will also have the ability to nominate a number of our directors, including a majority of our directors, provided certain ownership thresholds are maintained. See “Management,” “Principal Stockholders” and “Certain Relationships and Related Transactions.” This concentration of ownership may have the effect of delaying, preventing or deterring a change of control of our company, could deprive stockholders of an opportunity to receive a premium for their Class A common stock as part of a sale of our company and might ultimately affect the market price of our Class A common stock. Lastly, Blackstone and First Reserve are in the business of making investments in companies and may from time to time acquire and hold interests in businesses that compete directly or indirectly with us. They may also pursue acquisition opportunities that are complementary to our business and, as a result, those acquisition opportunities may not be available to us.
35
Table of Contents
We will be required to pay the holders of PBF LLC Series A Units and PBF LLC Series B Units for certain tax benefits we may claim arising in connection with this offering and future exchanges of PBF LLC Series A Units for shares of our Class A Common Stock and related transactions, and the amounts we may pay could be significant.
As described in “Organizational Structure—Offering Transactions,” we intend to use a significant portion of the net proceeds from this offering to purchase PBF LLC Series A Units from certain of our existing owners, with the balance used to purchase newly issued PBF LLC Series C Units from PBF LLC. We will enter into a tax receivable agreement with the holders of PBF LLC Series A Units and PBF LLC Series B Units that will provide for the payment from time to time by PBF Energy to such persons of 85% of the benefits, if any, that PBF Energy is deemed to realize as a result of (i) the increases in tax basis resulting from its acquisitions of PBF LLC Series A Units as part of the Offering Transactions or in the future and (ii) certain other tax benefits related to our entering into the tax receivable agreement, including tax benefits attributable to payments under the tax receivable agreement. See “Certain Relationships and Related Transactions—Tax Receivable Agreement.”
We expect that the payments that we may make under the tax receivable agreement will be substantial. Assuming no material changes in the relevant tax law, and that we earn sufficient taxable income to realize all tax benefits that are subject to the tax receivable agreement, we expect future payments under the tax receivable agreement relating to the purchase by PBF Energy of PBF LLC Series A Units as part of the Offering Transactions to aggregate $ million (or $ million if the underwriters exercise their option to purchase additional shares) and to range over the next 15 years from approximately $ million to $ million per year (or approximately $ million to $ million per year if the underwriters exercise their option to purchase additional shares) and decline thereafter. Future payments by us in respect of subsequent exchanges of PBF LLC Series A Units would be in addition to these amounts and are expected to be substantial as well. The foregoing numbers are merely estimates—the actual payments could differ materially. It is possible that future transactions or events could increase or decrease the actual tax benefits realized and the corresponding tax receivable agreement payments. There may be a material negative effect on our liquidity if, as a result of timing discrepancies or otherwise, (i) the payments under the tax receivable agreement exceed the actual benefits we realize in respect of the tax attributes subject to the tax receivable agreement, and/or (ii) distributions to PBF Energy by PBF LLC are not sufficient to permit PBF Energy to make payments under the tax receivable agreement after it has paid its taxes and other obligations. The payments under the tax receivable agreement are not conditioned upon any recipient’s continued ownership of us.
In certain cases, payments by us under the tax receivable agreement may be accelerated and/or significantly exceed the actual benefits we realize in respect of the tax attributes subject to the tax receivable agreement.
The tax receivable agreement will provide that upon certain changes of control, or if, at any time, PBF Energy elects an early termination of the tax receivable agreement, PBF Energy’s (or its successor’s) obligations with respect to exchanged or acquired PBF LLC Series A Units (whether exchanged or acquired before or after such transaction) would be based on certain assumptions, including (i) that PBF Energy would have sufficient taxable income to fully utilize the deductions arising from the increased tax deductions and tax basis and other benefits related to entering into the tax receivable agreement and (ii) that the subsidiaries of PBF LLC will sell certain nonamortizable assets (and realize certain related tax benefits) no later than a specified date. Moreover, (i) if we elect to terminate the tax receivable agreement early or if we undergo certain changes of control, we would be required to make an immediate payment equal to the present value of the anticipated future tax benefits (based on the foregoing assumptions), which upfront payment may be made years in advance of the actual realization, if any, of such future tax benefits, and (ii) we could be required to make payments under the tax receivable agreement that are significantly greater than the actual benefits we realize in respect of the tax attributes subject to the tax receivable agreement. Assuming that the market value of a share of Class A common stock were to be equal to the initial public offering price per share of Class A common stock in this offering and that LIBOR were to be 1.86%, we estimate that the aggregate amount of these change of control payments would be approximately $ million if triggered immediately after this offering. In these situations, our obligations
36
Table of Contents
under the tax receivable agreement could have a substantial negative impact on our liquidity. We may not be able to finance our obligations under the tax receivable agreement and our existing indebtedness may limit our subsidiaries’ ability to make distributions to us to pay these obligations.
Moreover, payments under the tax receivable agreement will be based on the tax reporting positions that we determine in accordance with the tax receivable agreement. We will not be reimbursed for any payments previously made under the tax receivable agreement if the Internal Revenue Service subsequently disallows part or all of the tax benefits that gave rise to such prior payments. As a result, in certain circumstances, payments could be made under the tax receivable agreement that are significantly in excess of the benefits that we actually realize in respect of (a) the increases in tax basis resulting from our purchases or exchanges of PBF LLC Series A Units and (b) certain other tax benefits related to our entering into the tax receivable agreement, including tax benefits attributable to payments under the tax receivable agreement.
Anti-takeover and certain other provisions in our certificate of incorporation and bylaws and Delaware law may discourage or delay a change in control.
Our certificate of incorporation and bylaws contain provisions which could make it more difficult for stockholders to effect certain corporate actions. Among other things, these provisions:
| • | authorize the issuance of undesignated preferred stock, the terms of which may be established and the shares of which may be issued without stockholder approval; |
| • | prohibit stockholder action by written consent after the date on which Blackstone and First Reserve collectively cease to beneficially own at least a majority of all of the outstanding shares of our capital stock entitled to vote; |
| • | restrict certain business combinations with stockholders who obtain beneficial ownership of a certain percentage of our outstanding common stock after the date Blackstone and First Reserve and their affiliates collectively cease to beneficially own at least 5% of all of the outstanding shares of our capital stock entitled to vote; |
| • | provide that special meetings of stockholders may be called only by the chairman of the board of directors, the chief executive officer or the board of directors, or Blackstone or First Reserve, for so long as Blackstone or First Reserve, in its individual capacity as the party calling the meeting, continues to beneficially own at least 25% of the total voting power of all the then outstanding shares of our capital stock, and establish advance notice procedures for the nomination of candidates for election as directors or for proposing matters that can be acted upon at stockholder meetings; and |
| • | provide that on and after the date Blackstone and First Reserve collectively cease to beneficially own a majority of all of the outstanding shares of our capital stock entitled to vote, our stockholders may only amend our bylaws with the approval of 75% or more of all of the outstanding shares of our capital stock entitled to vote. |
These anti-takeover provisions and other provisions of Delaware law may have the effect of delaying or deterring a change of control of our company. Certain provisions could also discourage proxy contests and make it more difficult for you and other stockholders to elect directors of your choosing and to cause us to take other corporate actions you desire. These provisions could limit the price that certain investors might be willing to pay in the future for shares of our Class A common stock. See “Description of Capital Stock.”
In addition, in connection with this offering, we will be entering into a stockholders agreement with Blackstone and First Reserve pursuant to which they will each be entitled to nominate a number of directors so long as certain ownership thresholds are maintained. See “Certain Relationships and Related Party Transactions—Stockholders Agreement.”
37
Table of Contents
This prospectus contains “forward-looking statements” that involve risks and uncertainties. You can identify forward-looking statements because they contain words such as “believes,” “expects,” “may,” “should,” “seeks,” “approximately,” “intends,” “plans,” “estimates,” or “anticipates” or similar expressions that relate to our strategy, plans or intentions. All statements we make relating to our estimated and projected earnings, margins, costs, expenditures, cash flows, growth rates and financial results or to our expectations regarding future industry trends are forward-looking statements. In addition, we, through our senior management, from time to time make forward-looking public statements concerning our expected future operations and performance and other developments. These forward-looking statements are subject to risks and uncertainties that may change at any time, and, therefore, our actual results may differ materially from those that we expected. We derive many of our forward-looking statements from our operating budgets and forecasts, which are based upon many detailed assumptions. While we believe that our assumptions are reasonable, we caution that it is very difficult to predict the impact of known factors, and, of course, it is impossible for us to anticipate all factors that could affect our actual results.
Important factors that could cause actual results to differ materially from our expectations, which we refer to as “cautionary statements,” are disclosed under “Risk Factors” and elsewhere in this prospectus, including, without limitation, in conjunction with the forward-looking statements included in this prospectus. All forward-looking information in this prospectus and subsequent written and oral forward-looking statements attributable to us, or persons acting on our behalf, are expressly qualified in their entirety by the cautionary statements. Some of the factors that we believe could affect our results include:
| • | supply, demand, prices and other market conditions for our services; |
| • | the effects of competition in our markets; |
| • | changes in currency exchange rates, interest rates and capital costs; |
| • | adverse developments in our relationship with both our key employees and unionized employees; |
| • | our ability to operate our businesses efficiently, manage capital expenditures and costs (including general and administrative expenses) tightly and generate earnings and cash flow; |
| • | our substantial indebtedness described in this prospectus; |
| • | restrictive covenants in our indebtedness that may adversely affect our operational flexibility; |
| • | our expectations with respect to our acquisition activity; |
| • | our ability to retain key employees; and |
| • | the costs of being a public company, including Sarbanes-Oxley Act compliance. |
We caution you that the foregoing list of important factors may not contain all of the material factors that are important to you. In addition, in light of these risks and uncertainties, the matters referred to in the forward-looking statements contained in this prospectus may not in fact occur. Accordingly, investors should not place undue reliance on those statements.
Our forward-looking statements speak only as of the date of this prospectus or as of the date as of which they are made. Except as required by applicable law, including the securities laws of the United States, we do not intend to update or revise any forward-looking statements.
38
Table of Contents
This prospectus includes industry data and forecasts that we obtained from industry publications and surveys, public filings and internal company sources. Statements as to our ranking, market position and market estimates are based on independent industry publications, government publications, third party forecasts and management’s good faith estimates and assumptions about our markets and our internal research. Although industry publications, surveys and forecasts generally state that the information contained therein has been obtained from sources believed to be reliable, we have not independently verified such third party information. While we are not aware of any misstatements regarding our market, industry or similar data presented herein, such data involves risks and uncertainties and is subject to change based on various factors, including those discussed under the headings “Forward-Looking Statements” and “Risk Factors.”
This prospectus contains certain information regarding refinery complexity as measured by the Nelson Complexity Index, which is calculated on an annual basis by data from the Oil and Gas Journal. Certain data presented in this prospectus is from the Oil and Gas Journal Report dated December 5, 2011.
39
Table of Contents
The diagram below depicts our organizational structure immediately following this offering:
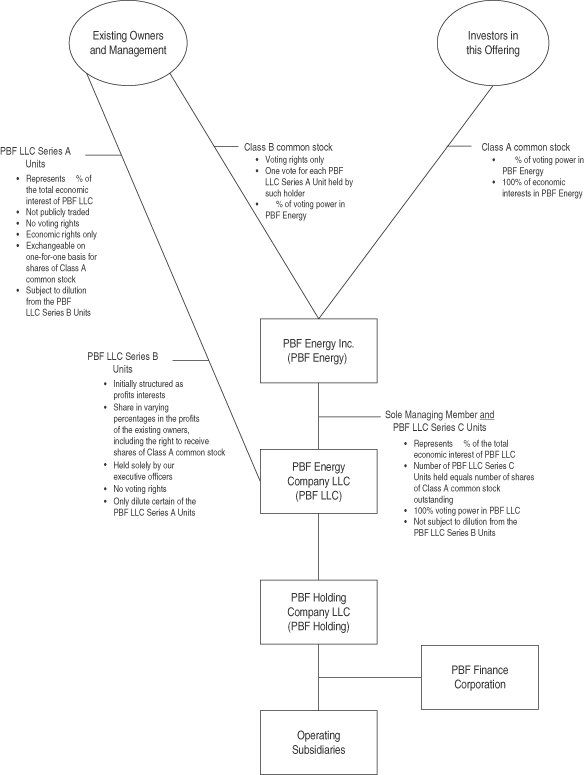
40
Table of Contents
Reorganization Transactions at PBF LLC
PBF LLC is a holding company for the companies that directly or indirectly own and operate our business. Prior to this offering, there were 92,281,716 PBF LLC Series A Units issued and outstanding, of which 44,861,169 units were owned by each of Blackstone and First Reserve, 2,535,473 units were owned by our remaining existing owners, including Mr. O’Malley, and 23,904 units were restricted Series A Units held by our independent directors. In addition, there are 1,000,000 PBF LLC Series B Units issued and outstanding, all of which are held by certain of our officers. The PBF LLC Series B Units are profits interests which entitle the holders to participate in the profits of PBF LLC after the date of issuance. Certain of our existing owners and other employees hold options and warrants to purchase an additional 4,774,630 PBF LLC Series A Units at a weighted average exercise price of $10.26 per unit, 4,179,610 of which will be vested and exercisable as of the date of the closing of this offering.
Immediately prior to this offering, PBF LLC’s limited liability company agreement will be amended and restated to, among other things, designate PBF Energy as the sole managing member of PBF LLC and establish the PBF LLC Series C Units which will be held solely by PBF Energy. The PBF LLC Series A Units will be held solely by our existing owners (and their permitted transferees). The PBF LLC Series C Units rank on a parity with the PBF LLC Series A Units as to distribution rights, voting rights and rights upon liquidation, winding up or dissolution. Following this offering, PBF Energy will have the right to determine the timing and amount of any distributions (other than tax distributions as described in “Holding Company Structure” below) to be made to holders of PBF LLC Series A Units and PBF LLC Series C Units. Profits and losses of PBF LLC will be allocated, and all distributions generally will be made, pro rata to the holders of PBF LLC Series A Units (subject, under certain circumstances, to the rights of the holders of PBF LLC Series B Units) and PBF LLC Series C Units. In addition, the amended and restated limited liability company agreement of PBF LLC provides that any PBF LLC Series A Units acquired by PBF Energy from our existing owners, whether at the time of this initial public offering or thereafter in accordance with the exchange agreement, will automatically, and without any further action, be reclassified as PBF LLC Series C Units in connection with such acquisition.
The PBF LLC Series B Units are profits interests held by certain of our officers which had no taxable value at the date of issuance, have no voting rights and are designed to increase in value only after our financial sponsors achieve certain levels of return on their investment in PBF LLC Series A Units. Under the limited liability company agreement of PBF LLC, distributions initially are made to the holders of PBF LLC Series A Units and PBF LLC Series C Units in proportion to the number of units owned by them. Once the financial sponsors receive a full return of their capital contributions with respect to their PBF LLC Series A Units, distributions and other payments made on account of the PBF LLC Series A Units held by our financial sponsors will then be shared by our financial sponsors with the holders of PBF LLC Series B Units. Accordingly, the amounts paid to the holders of PBF LLC Series B Units will reduce only the amounts otherwise payable to the PBF LLC Series A Units held by our financial sponsors, and will not reduce or otherwise impact any amounts payable to PBF Energy (the holder of our PBF LLC Series C Units), the holders of our Class A common stock or any other holder of PBF LLC Series A Units. For a further discussion of the PBF LLC Series B Units, please see “Executive Compensation—Compensation Discussion and Analysis—Summary of PBF LLC Series B Units.”
We refer to the foregoing transactions, collectively, as the “Reorganization Transactions.”
Incorporation of PBF Energy
PBF Energy was incorporated as a Delaware corporation on November 7, 2011. PBF Energy has not engaged in any business or other activities except in connection with its formation. The certificate of incorporation of PBF Energy at the time of the offering will authorize two classes of common stock, Class A common stock and Class B common stock, each having the terms described in “Description of Capital Stock.”
41
Table of Contents
Prior to completion of this offering, 37 shares of Class B common stock of PBF Energy will be issued to our existing owners, providing them with no economic rights but entitling them, without regard to the number of shares of Class B common stock held by such holder, to one vote on matters presented to stockholders of PBF Energy for each PBF LLC Series A Unit held by such holder, as described in “Description of Capital Stock—Class B Common Stock.” Holders of our Class A common stock and Class B common stock vote together as a single class on all matters presented to our stockholders for their vote or approval, except as otherwise required by applicable law.
We also will enter into an exchange agreement pursuant to which each of our existing owners (and certain of their permitted assignees and other holders who acquire PBF LLC Series A Units upon the exercise of certain warrants and options) will have the right to cause PBF LLC to exchange their PBF LLC Series A Units for shares of our Class A common stock on a one-for-one basis, subject to equitable adjustments for stock splits, stock dividends and reclassifications, and further subject to the rights of the holders of PBF LLC Series B Units to share in a portion of the profits realized by our financial sponsors upon the sale of the shares of Class A common stock received by them upon such exchange. See “Certain Relationships and Related Transactions—Exchange Agreement.”
Offering Transactions
At the time of this offering, PBF Energy intends to use the net proceeds from this offering to purchase PBF LLC Series A Units (which will be reclassified as PBF LLC Series C Units in connection with such acquisition) from Blackstone and First Reserve and newly-issued PBF LLC Series C Units from PBF LLC, at a purchase price per unit equal to the initial public offering price per share of Class A common stock in this offering. PBF Energy will purchase PBF LLC Series A Units from Blackstone and First Reserve for an aggregate of $ million, and will use the remaining net proceeds of this offering to purchase newly-issued PBF LLC Series C Units from PBF LLC in an amount equal to $ million (or $ million if the underwriters exercise in full their option to purchase additional shares of Class A common stock). PBF LLC will bear or reimburse PBF Energy for all of the expenses of this offering, including underwriting discounts. See “Use of Proceeds” and “Principal Stockholders” for further information regarding the proceeds from this offering that will be paid to Blackstone and First Reserve.
Following this offering, our existing owners may from time to time (subject to the terms of the exchange agreement) cause PBF LLC to exchange their remaining PBF LLC Series A Units for shares of Class A common stock of PBF Energy on a one-for-one basis, subject to equitable adjustments for stock splits, stock dividends and reclassifications, and further subject to the rights of the holders of PBF LLC Series B Units to share in a portion of the profits realized by our financial sponsors upon the sale of the shares of Class A common stock received by them upon such exchange. See “Certain Relationships and Related Transactions—Exchange Agreement.” Any PBF LLC Series A Units being exchanged will be reclassified as PBF LLC Series C Units in connection with such exchange. The purchase of PBF LLC Series A Units by PBF Energy from certain of our existing owners at the closing of this offering and exchanges of PBF LLC Series A Units for shares of Class A common stock are expected to result, with respect to PBF Energy, in increases in the tax basis of the assets of PBF LLC that otherwise would not have been available. These increases in tax basis may reduce the amount of tax that PBF Energy would otherwise be required to pay in the future. These increases in tax basis may also decrease gains (or increase losses) on future dispositions of certain assets to the extent tax basis is allocated to those assets.
We will enter into a tax receivable agreement with the holders of PBF LLC Series A Units and PBF LLC Series B Units (and certain permitted assignees thereof and other holders who acquire PBF LLC Series A Units upon the exercise of certain warrants) that will provide for the payment from time to time by PBF Energy to such persons of 85% of the amount of the benefits, if any, that PBF Energy is deemed to realize as a result of (i) these increases in tax basis and (ii) certain other tax benefits related to our entering into the tax receivable agreement, including tax benefits attributable to payments under the tax receivable agreement. These payment obligations are obligations of PBF Energy and not of PBF LLC. We estimate that the incremental tax basis of the assets of PBF LLC that will be attributable to
42
Table of Contents
PBF Energy at the time of this offering will be approximately $ million (or $ million if the underwriters exercise in full their option to purchase additional shares of Class A common stock). The tax receivable agreement also will provide that upon certain changes of control or if, at any time, PBF Energy elects an early termination of the tax receivable agreement, payments due under the tax receivable agreement may be accelerated and/or significantly exceed the actual benefits we realize in respect of the tax attributes subject to the tax receivable agreement. See “Risk Factors—Risks Related to This Offering and Ownership of Our Class A Common Stock—In certain cases, payments by us under the tax receivable agreement may be accelerated and/or significantly exceed the actual benefits we realize in respect of the tax attributes subject to the tax receivable agreement” and “Certain Relationships and Related Transactions—Tax Receivable Agreement.”
In connection with its acquisition of PBF LLC Series C Units, PBF Energy will become the sole managing member of PBF LLC at the closing of this offering. Accordingly, although PBF Energy will initially have a minority economic interest in PBF LLC, PBF Energy will have 100% of the voting power and control the management of PBF LLC.
We refer to the foregoing transactions as the “Offering Transactions.”
As a result of the transactions described above:
| • | the investors in this offering will collectively own shares of our Class A common stock (or shares of Class A common stock if the underwriters exercise in full their option to purchase additional shares of Class A common stock) and PBF Energy will hold PBF LLC Series C Units (or PBF LLC Series C Units if the underwriters exercise in full their over-allotment option to purchase additional shares of Class A common stock), representing % of the total economic interest of PBF LLC (or % of the total economic interest of PBF LLC if the underwriters exercise in full their over-allotment option); |
| • | our existing owners will hold PBF LLC Series A Units, representing % of the total economic interest of PBF LLC (or % if the underwriters exercise in full their option to purchase additional shares of Class A common stock); |
| • | the investors in this offering will collectively have % of the voting power in PBF Energy (or % if the underwriters exercise in full their option to purchase additional shares of Class A common stock); and |
| • | our existing owners, through their holdings of our Class B common stock, will have % of the voting power in PBF Energy (or % if the underwriters exercise in full their option to purchase additional shares of Class A common stock). |
Our post-offering organizational structure will allow our existing owners to retain their equity ownership in PBF LLC, an entity that is classified as a partnership for United States federal income tax purposes, in the form of PBF LLC Series A Units. Investors in this offering will, by contrast, hold their equity ownership in PBF Energy, a Delaware corporation that is a domestic corporation for United States federal income tax purposes, in the form of shares of Class A common stock. We believe that our existing owners generally find it advantageous to hold their equity interests in an entity that is not taxable as a corporation for United States federal income tax purposes.
Our existing owners also hold shares of Class B common stock of PBF Energy. Although the shares of Class B common stock have no economic rights, they allow our existing owners to exercise voting power at PBF Energy, the managing member of PBF LLC, at a level that is consistent with their overall equity ownership of the business of PBF LLC and its subsidiaries. Under the amended and restated certificate of incorporation of PBF Energy, following the offering, each holder of Class B common stock will be entitled, without regard to the number of shares of Class B common stock held by such holder, to one vote for each PBF LLC Series A Unit held by such holder. Accordingly, as our existing owners sell PBF LLC Series A Units to us as part of the
43
Table of Contents
Offering Transactions or subsequently cause PBF LLC to exchange PBF LLC Series A Units for shares of Class A common stock of PBF Energy pursuant to the exchange agreement, the voting power afforded to our existing owners by their shares of Class B common stock is automatically and correspondingly reduced.
Holding Company Structure
PBF Energy will be a holding company, and its sole material asset will be an equity interest in PBF LLC. As the sole managing member of PBF LLC, PBF Energy will control all of the business and affairs of PBF Holding and its subsidiaries.
PBF Energy will consolidate the financial results of PBF LLC and its subsidiaries, and the ownership interest of our existing owners in PBF LLC will be reflected as a noncontrolling interest in PBF Energy’s consolidated financial statements.
Pursuant to the limited liability company agreement of PBF LLC, PBF Energy has the right to determine when distributions (other than tax distributions) will be made to the members of PBF LLC and the amount of any such distributions. If PBF Energy authorizes a distribution, such distribution will be made to the members of PBF LLC pro rata in accordance with their respective percentage interests.
The holders of limited liability company interests in PBF LLC, including PBF Energy, will generally have to include for purposes of calculating their U.S. federal, state and local income taxes their share of any taxable income of PBF LLC. Taxable income of PBF LLC generally will be allocated to the holders of units (including PBF Energy) pro rata in accordance with their respective share of the net profits and net losses of PBF LLC. PBF LLC is obligated, subject to available cash and applicable law and contractual restrictions (including pursuant to our debt instruments), to make cash distributions, which we refer to as “tax distributions,” based on certain assumptions, to its members (including PBF Energy) pro rata in accordance with their respective percentage interests. Generally, these tax distributions will be an amount equal to our estimate of the taxable income of PBF LLC multiplied by an assumed tax rate equal to the highest effective marginal combined U.S. federal, state and local income tax rate prescribed for an individual or corporate resident in New York, New York (taking into account the nondeductibility of certain expenses).
See “Certain Relationships and Related Transactions—PBF LLC Limited Liability Company Agreement.”
44
Table of Contents
The proceeds to PBF Energy from this offering, before deducting underwriting discounts, will be approximately $ million (or $ million if the underwriters exercise in full their option to purchase additional shares of Class A common stock).
PBF Energy intends to use $ million of the proceeds from this offering to purchase PBF LLC Series A Units (which will be reclassified as PBF LLC Series C Units in connection with such acquisition) from Blackstone and First Reserve, as described under “Organizational Structure—Offering Transactions.” Accordingly, we will not retain any of these proceeds. See “Principal Stockholders” for further information regarding the proceeds from this offering.
PBF Energy intends to use all of the remaining proceeds from this offering, or $ million (or $ million if the underwriters exercise in full their option to purchase additional shares of Class A common stock), to purchase newly-issued PBF LLC Series C Units from PBF LLC, as described under “Organizational Structure—Offering Transactions.” We intend to cause PBF LLC to use these proceeds to pay the expenses of this offering, including aggregate underwriting discounts of $ million (or $ million if the underwriters exercise in full their option to purchase additional shares of Class A common stock) and other offering expenses estimated at $ million. Any remaining proceeds, including proceeds from the exercise by the underwriters of their option to purchase additional shares of Class A common stock, will be used by PBF LLC for general corporate purposes, including to potentially repay outstanding indebtedness under the ABL Revolving Credit Facility.
The ABL Revolving Credit Facility is scheduled to expire on October 26, 2017. As of September 30, 2012, there were no outstanding loans under the ABL Revolving Credit Facility.
A $1.00 increase (decrease) in the assumed initial public offering price of $ per share would increase (decrease) the net proceeds to PBF Energy from this offering by approximately $ million, assuming that the number of shares offered by PBF Energy, as set forth on the cover page of this prospectus, remains the same and after deducting the underwriting discounts and commissions and estimated offering expenses payable by PBF Energy.
Pending specific application of these proceeds, the proceeds will be invested primarily in cash.
45
Table of Contents
We currently intend to pay quarterly cash dividends of approximately $0.20 per share on our Class A common stock following this offering, commencing after the completion of the first quarter of 2013. The declaration, amount and payment of this and any other future dividends on shares of Class A common stock will be at the sole discretion of our board of directors, and we are not obligated under any applicable laws, our governing documents or any contractual agreements with our existing owners or otherwise to declare or pay any dividends or other distributions (other than the obligations of PBF LLC to make tax distributions to its members). Our board of directors may take into account, among other things, general economic conditions, our financial condition and operating results, our available cash and current and anticipated cash needs, capital requirements, plans for expansion, tax, legal, regulatory and contractual restrictions and implications, including under our outstanding debt documents, and such other factors as our board of directors may deem relevant in determining whether to declare or pay any dividend. In addition, we expect that to the extent we declare a dividend for a particular quarter, our cash flow from operations for that quarter will substantially exceed any dividend payment for such period. Because any future declaration or payment of dividends will be at the sole discretion of our board of directors, we do not expect that any such dividend payments will have a material adverse impact on our liquidity or otherwise limit our ability to fund capital expenditures or otherwise pursue our business strategy over the long-term. Although we have the ability to borrow funds and sell assets to pay future dividends (subject to certain limitations in our ABL Revolving Credit Facility and senior secured notes), we intend to fund any future dividends out of our cash flow from operations and, as a result, we do not expect to incur any indebtedness or to use the proceeds from this or other offerings to fund such payments.
PBF Energy is a holding company and has no material assets other than its ownership interests of PBF LLC. In order for us to pay any dividends, we will need to cause PBF LLC to make distributions to us and the holders of PBF LLC Series A Units, and PBF LLC will need to cause PBF Holding to make distributions to it, in an amount sufficient to cover cash dividends, if any, declared by us. PBF Holding is generally prohibited under Delaware law from making a distribution to a member to the extent that, at the time of the distribution, after giving effect to the distribution, liabilities of the limited liability company (with certain exceptions) exceed the fair value of its assets. As a result, PBF LLC may be unable to obtain cash from PBF Holding to satisfy our obligations and make payments to our stockholders, if any. If PBF LLC makes such distributions to us, the holders of PBF LLC Series A Units will also be entitled to receive distributions pro rata in accordance with the number of units held by them and us.
The ability of PBF Holding to pay dividends and make distributions to PBF LLC is and in the future may be limited by covenants in our ABL Revolving Credit Facility, the senior secured notes and other debt instruments. Subject to certain exceptions, our ABL Revolving Credit Facility and the indenture governing our senior secured notes prohibit PBF Holding from making distributions to PBF LLC if certain defaults exist. In addition, both the indenture and our ABL Revolving Credit Facility contain additional restrictions limiting PBF Holding’s ability to make distributions to PBF LLC. Subject to certain exceptions, the restricted payment covenant under the indenture governing our senior secured notes restricts PBF Holding from making cash distributions unless its fixed charge coverage ratio, as defined in the indenture, is at least 2.0 to 1.0 after giving pro forma effect to such distributions and such cash distributions do not exceed an amount equal to the aggregate net equity proceeds received by it (either as a result of certain capital contributions or from the sale of certain equity or debt securities) plus 50% of its consolidated net income (or less 100% of consolidated net loss) which is defined to exclude certain non-cash charges, such as impairment charges, plus certain other items. Two important exceptions to the foregoing are (i) a permission to pay up to the greater of $100.0 million and 1% of our total assets and (ii) a permission to pay an additional $200.0 million subject to compliance with a total debt ratio of 2 to 1. Our ABL Revolving Credit Facility generally restricts PBF Holding’s ability to make cash distributions if (x) the aggregate amount of such distributions exceeds the then existing available amount basket (as defined by the ABL Revolving Credit Facility) and (y) before and after giving effect to any such distribution, (a) it fails to have pro forma excess availability under the facility greater than an amount equal to 17.5% of the lesser of (1) the then existing borrowing base and (2) the then current aggregate revolving commitment amount, which as of October 26, 2012 was $1.375 billion or (b) it fails to maintain
46
Table of Contents
on a pro forma basis a fixed charge coverage ratio, as defined by the ABL Revolving Credit Facility, of at least 1.1 to 1.0. As a result, we cannot assure you that PBF Holding will be able to make distributions to PBF LLC in order for PBF LLC to make distributions to us. If that is the case, it is unlikely that we will be able to declare dividends as contemplated herein.
Based upon our operating results for the quarter ended September 30, 2012, we would have been permitted to pay a quarterly dividend at the rate specified above under our ABL Revolving Credit Facility and senior secured notes, assuming as of the beginning of such period that we had completed this offering at the initial public offering price of $ per share, after deducting underwriting discounts and commissions and estimated offering expenses payable by us. The ability of PBF Holding to comply with the foregoing limitations and restrictions is, to a significant degree, subject to its operating results, which is dependent on a number of factors outside of our control. As a result, we cannot assure you that we will be able to declare dividends as contemplated herein. See “Risk Factors—Risks Related to Our Indebtedness—Restrictive Covenants in our debt instruments may limit our ability to undertake certain types of transactions” and “Risk Factors—Risks Relating to This Offering and Ownership of Our Class A Common Stock. We cannot assure you that we will declare dividends or have the available cash to make dividend payments. We are a holding company that depends upon cash from our subsidiaries to meet our obligations and/or to pay dividends in the future.”
PBF LLC made cash distributions to our existing owners in the amount of $15.1 million during the nine months ended September 30, 2012, and prior to the completion of this offering, PBF LLC anticipates making additional cash distributions to our existing owners of approximately $142.8 million, substantially all of which will have constituted tax distributions.
Assuming approximately PBF LLC Series A Units and PBF LLC Series C Units outstanding immediately following the offering, the aggregate annual distributions which are anticipated to be required to be made by PBF LLC to its members (including PBF Energy) in order for PBF Energy to pay the anticipated $0.20 per quarter cash dividend would be approximately $ million. If we had paid an equivalent $0.20 per unit quarterly cash dividend during the nine months ended September 30, 2012, this would have represented the equivalent of approximately 8% of our Adjusted EBITDA for such period. As of September 30, 2012, our cash and cash equivalents totaled $170.0 million. Accordingly, as of September 30, 2012, there was sufficient cash and cash equivalents available to PBF Holding to make distributions to PBF LLC, which in turn will make pro rata distributions to its members, including PBF Energy, necessary to fund in excess of one year’s cash dividend payments by us, as well as approximately $495.1 million of unused borrowing availability under our ABL Revolving Credit Facility to fund our operations, if necessary. We believe our available cash and cash equivalents, other sources of liquidity to operate our business and operating performance provides us with a reasonable basis for our assessment that we can support our intended dividend policy.
47
Table of Contents
The following table sets forth our cash and cash equivalents and total capitalization as of September 30, 2012:
| • | on a historical basis for PBF LLC; |
| • | on an as adjusted basis to reflect the payment of cash distributions to our existing owners of $142.8 million and IPO cash bonuses to certain of our employees of $8.2 million prior to the completion of this offering; and |
| • | on a pro forma as further adjusted basis for PBF Energy, giving effect to the transactions described under “Unaudited Pro Forma Consolidated Financial Statements,” including the application of the proceeds from this offering as described in “Use of Proceeds.” |
This information should be read in conjunction with sections entitled “Organizational Structure,” “Use of Proceeds,” “Management’s Discussion and Analysis of Financial Condition and Results of Operations,” and “Unaudited Pro Forma Consolidated Financial Statements,” and the historical consolidated financial statements and related notes thereto included in this prospectus.
| September 30, 2012 | ||||||||||||
| Actual | As Adjusted | Pro Forma as Further Adjusted |
||||||||||
| (in thousands, except share and per share data) |
||||||||||||
| Cash and cash equivalents |
$ | 170,048 | $ | 19,048 | $ | |||||||
|
|
|
|
|
|
|
|||||||
| Debt: |
||||||||||||
| Long-term debt (including current portion)(1) |
$ | 732,961 | $ | 732,961 | ||||||||
| PBF LLC Series B Units |
4,261 | 4,261 | ||||||||||
| Equity: |
||||||||||||
| Series A Units |
924,840 | 924,840 | ||||||||||
| Class A common stock, par value $0.001 per share, 1,000,000,000 shares to be authorized, shares to be issued and outstanding, on a pro forma basis |
— | — | ||||||||||
| Class B common stock, par value $0.001 per share, 1,000,000 shares to be authorized, shares to be issued and outstanding, on a pro forma basis |
— | — | ||||||||||
| Preferred stock, par value $0.001 per share, 100,000,000 shares to be authorized, none to be issued and outstanding on a pro forma basis |
— | — | ||||||||||
| Additional paid-in capital |
— | — | ||||||||||
| Accumulated other comprehensive income |
(2,357 | ) | (2,357 | ) | ||||||||
| Retained earnings |
710,843 | 559,843 | ||||||||||
|
|
|
|
|
|
|
|||||||
| Total members’/stockholders’ equity attributable to the Company |
1,633,326 | 1,482,326 | ||||||||||
| Noncontrolling interest |
— | — | ||||||||||
|
|
|
|
|
|
|
|||||||
| Total equity |
1,633,326 | 1,482,326 | ||||||||||
|
|
|
|
|
|
|
|||||||
| Total capitalization |
$ | 2,370,548 | $ | 2,219,548 | $ | |||||||
|
|
|
|
|
|
|
|||||||
| (1) | Actual long-term debt includes our Delaware Economic Development Authority Loan of $20.0 million and unamortized original issue discount of $9.2 million related to the senior secured notes. |
48
Table of Contents
Dilution is the amount by which the offering price paid by purchasers of shares of Class A common stock in this offering will exceed the net tangible book value per share of Class A common stock immediately after the completion of this offering. Net tangible book value per share as of a particular date represents the amount of our total tangible assets less our total liabilities divided by the number of shares of Class A common stock outstanding as of such date. The net tangible book value of our Class A common stock as of September 30, 2012 was $ , or approximately $ per share. On a pro forma basis, after giving effect to the transactions described under “Organizational Structure,” including the sale of shares of Class A common stock in this offering at an assumed initial public offering price of $ (the mid-point of the estimated price range set forth on the cover page of this prospectus), assuming that our existing owners exchanged all of their PBF LLC Series A Units for newly-issued shares of Class A common stock on a one-for-one basis, and after deducting the underwriting discounts and commissions and estimated offering expenses, our pro forma net tangible book value as of September 30, 2012 would have been $ , or approximately $ per share. This represents an immediate decrease in pro forma net tangible book value of $ per share to existing stockholders and an immediate dilution of $ per share to new investors.
The following table illustrates this dilution on a per share of Class A common stock basis:
| Assumed initial public offering price per share |
$ | |||||||
| Net tangible book value as of September 30, 2012 |
$ | |||||||
| Decrease in net tangible book value per share attributable to new investors |
||||||||
|
|
|
|||||||
| Pro forma net tangible book value per share after the offering |
||||||||
|
|
|
|||||||
| Dilution per share to new investors |
$ | |||||||
|
|
|
Because our existing owners do not own any Class A common stock or other economic interest in us, we have presented dilution in pro forma net tangible book value per share of Class A common stock to investors in this offering assuming that our existing owners exchanged their PBF LLC Series A Units for newly-issued shares of Class A common stock on a one-for-one basis in order to more meaningfully present the dilutive impact on the investors in this offering.
If the underwriters exercise their over-allotment option in full, the pro forma net tangible book value per share after giving effect to the offering would be $ per share. This represents an increase in pro forma net tangible book value of $ per share to existing stockholders and dilution in pro forma net tangible book value of $ per share to new investors.
A $1.00 increase (decrease) in the assumed initial public offering price of $ per share would increase (decrease) our pro forma net tangible book value per share after this offering and the dilution to new investors by $ , assuming the number of shares offered, as set forth on the cover page of this prospectus, remains the same and after deducting the underwriting discounts and commissions and estimated offering expenses payable by us.
49
Table of Contents
The following table presents, on a pro forma basis, as of September 30, 2012, the differences among the number of shares of Class A common stock purchased, the total consideration paid or exchanged and the average price per share paid by our existing owners and by new investors purchasing shares of our Class A common stock in this offering, assuming that our existing owners exchanged all of their PBF LLC Series A Units for shares of our Class A common stock on a one-for-one basis, before deducting the underwriting discounts and commissions and estimated offering expenses payable by us. The table assumes an initial public offering price of $ per share, as specified above, and excludes underwriting discounts and commissions and estimated offering expenses payable by PBF Energy:
| Shares Purchased | Total Consideration | Average Price Per Share | ||||||||
| Number | Percent | Amount | Percent | |||||||
| Existing owners |
||||||||||
| New investors |
||||||||||
|
|
|
|
|
| ||||||
| Total |
||||||||||
|
|
|
|
|
| ||||||
50
Table of Contents
UNAUDITED PRO FORMA CONSOLIDATED FINANCIAL STATEMENTS
The unaudited pro forma consolidated financial statements are presented to show how we might have looked if the Toledo acquisition, the senior secured notes offering, the Offering Transactions described under “Organizational Structure,” and the use of the estimated net proceeds from this offering as described under “Use of Proceeds” had occurred on the dates and for the periods indicated below. We derived the following unaudited pro forma consolidated financial statements by applying pro forma adjustments to the historical consolidated financial statements of PBF LLC and the statements of revenues and direct expenses of Toledo, each included elsewhere in this prospectus. PBF LLC will be considered our predecessor for accounting purposes, and its consolidated financial statements will be our historical consolidated financial statements following this offering.
The unaudited pro forma consolidated statements of operations for the year ended December 31, 2011 have been derived by starting with PBF LLC’s financial data and giving pro forma effect to the consummation of the Toledo acquisition, the senior secured notes offering, the Offering Transactions, and the use of the estimated net proceeds from this offering as if they had occurred on January 1, 2011. The unaudited pro forma condensed consolidated statement of operations for the nine months ended September 30, 2012 have been derived by starting with PBF LLC’s unaudited financial data and giving pro forma effect to consummation of the senior secured notes offering, the Offering Transactions, and the use of the estimated net proceeds from this offering as if they had occurred on January 1, 2011. The unaudited pro forma consolidated balance sheet as of September 30, 2012 gives effect to cash distributions to our existing owners made prior to the completion of this offering, the Offering Transactions and the use of the estimated net proceeds from this offering as if they had occurred on September 30, 2012. As a result of the Toledo acquisition, our historical financial results include the results of operations for Toledo from March 1, 2011 forward.
Sunoco did not manage Toledo as a stand-alone business as either a subsidiary or division, and therefore complete historical financial statements are not available. The statements of revenue and expenses reflect items specifically identified to the refinery and therefore exclude certain other items such as interest income, interest expenses and income taxes not directly related to the refinery. They also reflect certain allocations Sunoco made for shared resources utilized prior to the acquisition which were considered reasonable.
The unaudited pro forma consolidated financial information is presented for informational purposes only. The unaudited pro forma consolidated financial information does not purport to represent what our results of operations or financial condition would have been had the transactions to which the pro forma adjustments relate actually occurred on the dates indicated, and they do not purport to project our results of operations or financial condition for any future period or as of any future date. Further, the unaudited pro forma consolidated financial statements do not reflect the impact of restructuring activities, cost savings, non-recurring charges, employee termination costs and other exit costs that may result from or in connection with the Toledo acquisition. For example, the unaudited pro forma consolidated financial data does not give effect to the anticipated termination of employees deemed redundant or the reconfiguration of facilities.
The pro forma adjustments for the year ended December 31, 2011 and for the nine months ended September 30, 2012 principally give effect to:
| • | the impact on interest expense as a result of the senior secured notes offering and the refinancing of our existing senior debt; |
| • | the consummation of the Offering Transactions described in “Organizational Structure—Offering Transactions” and the related effects of the tax receivable agreement. See “Certain Relationships and Related Transactions—Tax Receivable Agreement”; and |
| • | a provision for corporate income taxes on the income of PBF Energy at an effective rate of 39%, which includes a provision for U.S. federal income taxes and assumes the highest statutory rates apportioned to each state, local and/or foreign jurisdiction. |
51
Table of Contents
The pro forma adjustments for the year ended December 31, 2011 also give effect to the acquisition of Toledo.
The unaudited pro forma consolidated balance sheet and statements of operations should be read in conjunction with the sections entitled “Organizational Structure,” “Use of Proceeds,” “Capitalization,” “Selected Financial Data,” “Management’s Discussion and Analysis of Financial Condition and Results of Operations—Results of Operations—PBF LLC,” our historical consolidated financial statements and related notes thereto, and the historical financial information and related notes thereto of Toledo, included elsewhere in this prospectus.
52
Table of Contents
Unaudited Pro Forma Consolidated Balance Sheet
As of September 30, 2012
| PBF Energy Company LLC Actual |
Pro Forma Adjustments(a) |
PBF Energy Company LLC Pro Forma |
Pro Forma Adjustments |
PBF Energy Inc. Pro Forma |
||||||||||||||||||||
| (in thousands) |
||||||||||||||||||||||||
| ASSETS |
||||||||||||||||||||||||
| Current Assets |
||||||||||||||||||||||||
| Cash and cash equivalents |
$ | 170,048 | $ | (151,000 | ) | $ | 19,048 | $ | (b) | $ | ||||||||||||||
| Accounts receivable, net |
496,241 | 496,241 | ||||||||||||||||||||||
| Inventories |
1,479,728 | 1,479,728 | ||||||||||||||||||||||
| Other current assets |
26,388 | 26,388 | ||||||||||||||||||||||
|
|
|
|
|
|
|
|
|
|
|
|||||||||||||||
| Total Current Assets |
2,172,405 | (151,000 | ) | 2,021,405 | ||||||||||||||||||||
| Property, plant and equipment, net |
1,574,712 | 1,574,712 | ||||||||||||||||||||||
| Deferred tax asset |
— | — | (c) | |||||||||||||||||||||
| Deferred charges and other assets, net |
185,390 | 185,390 | ||||||||||||||||||||||
|
|
|
|
|
|
|
|
|
|
|
|||||||||||||||
| Total Assets |
$ | 3,932,507 | $ | (151,000 | ) | $ | 3,781,507 | $ | $ | |||||||||||||||
|
|
|
|
|
|
|
|
|
|
|
|||||||||||||||
| LIABILITIES AND EQUITY |
||||||||||||||||||||||||
| Current Liabilities |
||||||||||||||||||||||||
| Accounts payable |
$ | 246,914 | $ | 246,914 | $ | |||||||||||||||||||
| Accrued expenses |
1,082,143 | 1,082,143 | ||||||||||||||||||||||
| Deferred revenue |
202,953 | 202,953 | ||||||||||||||||||||||
|
|
|
|
|
|
|
|
|
|
|
|||||||||||||||
| Total Current Liabilities |
1,532,010 | 1,532,010 | ||||||||||||||||||||||
| Economic Development Authority Loan |
20,000 | 20,000 | ||||||||||||||||||||||
| Long-term debt |
712,961 | 712,961 | ||||||||||||||||||||||
| Payable to related parties pursuant to tax receivable agreement |
— | — | (c) | |||||||||||||||||||||
| Other long-term liabilities |
29,949 | 29,949 | ||||||||||||||||||||||
|
|
|
|
|
|
|
|
|
|
|
|||||||||||||||
| Total Liabilities |
2,294,920 | 2,294,920 | ||||||||||||||||||||||
| Commitments and Contingencies |
||||||||||||||||||||||||
| Series B Units |
4,261 | 4,261 | (d) | |||||||||||||||||||||
| Members’/Stockholders’ Equity |
||||||||||||||||||||||||
| Series A Units |
924,840 | 924,840 | (d) |
|||||||||||||||||||||
| Class A common stock |
— | — | (d) |
|||||||||||||||||||||
| Class B common stock |
— | — | (d) |
|||||||||||||||||||||
| Preferred stock |
— | — | ||||||||||||||||||||||
| Additional paid-in capital |
— | — | (d) |
|||||||||||||||||||||
| Accumulated other comprehensive loss |
(2,357 | ) | (2,357 | ) | ||||||||||||||||||||
| Retained earnings |
710,843 | (151,000 | ) | 559,843 | (d) | |||||||||||||||||||
|
|
|
|
|
|
|
|
|
|
|
|||||||||||||||
| Members’ equity/stockholders’ equity attributable to PBF |
1,633,326 | (151,000 | ) | 1,482,326 | ||||||||||||||||||||
| Noncontrolling interest |
— | — | — | (e) |
||||||||||||||||||||
|
|
|
|
|
|
|
|
|
|
|
|||||||||||||||
| Total Liabilities, Series B Units, and Equity |
$ | 3,932,507 | $ | (151,000 | ) | $ | 1,482,326 | $ | $ | |||||||||||||||
|
|
|
|
|
|
|
|
|
|
|
|||||||||||||||
53
Table of Contents
NOTES TO THE UNAUDITED PRO FORMA CONSOLIDATED BALANCE SHEET
| (a) | Reflects the net effect on cash and cash equivalents and retained earnings of cash distributions to our existing owners of $142.8 million and IPO cash bonuses to certain of our employees of $8.2 million to be made prior to the completion of this offering. |
| (b) | Reflects the net effect on cash and cash equivalents of the receipt of offering proceeds of $ million and net uses of proceeds as described in “Use of Proceeds”. |
| (c) | Reflects adjustments to give effect to the tax receivable agreement (as described in “Certain Relationships and Related Transactions—Tax Receivable Agreement”) based on the following assumptions: |
| • | we will record an increase of $ million in deferred tax assets for estimated income tax effects of the increase in the tax basis of the purchased interests, based on an effective income tax rate of 39% (which includes a provision for U.S. federal, state, and local income taxes); |
| • | we will record $ million, representing 85% of the estimated realizable tax benefit resulting from (i) the increase in the tax basis of the purchased interests as noted above and (ii) certain other tax benefits related to entering into the tax receivable agreement, including tax benefits attributable to payments under the tax receivable agreement as an increase to the liability under the tax receivable agreement; |
| • | we will record an increase of $ million to additional paid-in-capital, which is an amount equal to the difference between the increase in deferred tax assets and the increase in the liability due to existing owners under the tax receivable agreement; and |
| • | there are no material changes in the relevant tax law and that we earn sufficient taxable income in each year to realize the full tax benefit of the amortization of our assets. |
| (d) | Represents adjustments to stockholders’ equity reflecting (i) par value for Class A and Class B common stock to be outstanding following this offering, (ii) an increase of $ million of additional paid-in capital as a result of net proceeds from this offering, (iii) an increase of $ million of additional paid-in-capital due to the tax receivable agreement as described in footnote (c) above, (iv) a decrease of $ million of additional paid-in-capital to allocate a portion of PBF Energy’s equity to the noncontrolling interest, (v) the elimination of PBF LLC Series A Units of $924.8 million upon consolidation, (vi) the elimination of PBF LLC Series B Units of $4.3 million upon consolidation, and (vii) a decrease of $ million in retained earnings to allocate a portion of PBF Energy’s equity to noncontrolling interest. |
| (e) | As described in “Organizational Structure,” PBF Energy will become the sole managing member of PBF LLC. PBF Energy will initially own less than 100% of the economic interest in PBF LLC, but will have 100% of the voting power and control the management of PBF LLC. As a result, we will consolidate the financial results of PBF LLC and will record a noncontrolling interest. Immediately following this offering, the noncontrolling interest, based on the assumptions to the pro forma information, will be %. Pro forma noncontrolling interest represents % of the pro forma equity of PBF LLC of $ billion, which differs from the pro forma equity of PBF Energy as the former is not affected by the adjustments related to the tax receivable agreement described in footnote (c). |
54
Table of Contents
Unaudited Pro Forma Consolidated Statement of Operations
For the Nine Months Ended September 30, 2012
| PBF
Energy Company LLC Actual |
Pro
Forma Adjustments(f) |
PBF Energy Company LLC Pro Forma |
Pro Forma Adjustments(g) |
PBF Energy Inc. |
||||||||||||||||||
| (in thousands) | ||||||||||||||||||||||
| Revenues |
$ | 15,188,327 | $ | 15,188,327 | ||||||||||||||||||
| Cost and expenses |
||||||||||||||||||||||
| Cost of sales, excluding depreciation |
13,871,884 | 13,871,884 | ||||||||||||||||||||
| Operating expenses, excluding depreciation |
537,880 | 537,880 | ||||||||||||||||||||
| General and administrative expenses(i) |
78,042 | 78,042 | ||||||||||||||||||||
| Gain on sale of asset |
(2,430 | ) | (2,430) | |||||||||||||||||||
| Depreciation and amortization expense |
67,419 | 67,419 | ||||||||||||||||||||
|
|
|
|
|
|
|
|
|
|
||||||||||||||
| 14,552,795 | 14,552,795 | |||||||||||||||||||||
|
|
|
|
|
|
|
|
|
|
||||||||||||||
| Operating income (loss) |
635,532 | 635,532 | ||||||||||||||||||||
| Other income (expense) |
||||||||||||||||||||||
| Change in fair value of catalyst lease obligation |
(6,929 | ) | — | (6,929) | ||||||||||||||||||
| Change in fair value of contingent consideration |
(2,076 | ) | — | (2,076) | ||||||||||||||||||
| Interest expense, net |
(86,753 | ) | (139 | ) (j) | (86,892) | |||||||||||||||||
|
|
|
|
|
|
|
|
|
|
||||||||||||||
| 539,774 | (139 | ) | 539,635 | |||||||||||||||||||
| Income tax expense (benefit) |
— | — | — | (m) | ||||||||||||||||||
|
|
|
|
|
|
|
|
|
|
||||||||||||||
| Net income (loss) |
$ | 539,774 | $ | (139 | ) | $ | 539,635 | |||||||||||||||
|
|
|
|
|
|
|
|||||||||||||||||
| Less—net income (loss) attributable to noncontrolling interest |
(o) | |||||||||||||||||||||
|
|
|
|
||||||||||||||||||||
| Net income (loss) attributable to PBF Energy Inc. |
$ | |||||||||||||||||||||
|
|
|
|
||||||||||||||||||||
| Weighted Average Shares of Class A common stock outstanding(p) |
||||||||||||||||||||||
| Basic |
||||||||||||||||||||||
| Diluted |
||||||||||||||||||||||
| Net income available to Class A common stock per share(p) |
||||||||||||||||||||||
| Basic |
||||||||||||||||||||||
| Diluted |
||||||||||||||||||||||
55
Table of Contents
Unaudited Pro Forma Consolidated Statement of Operations
For the Year Ended December 31, 2011
| PBF
Energy Company LLC Actual |
Toledo Period from January 1, 2011 through February 28, 2011(n) |
Pro Forma Adjustments(f) |
PBF Energy Company LLC Pro Forma |
Pro Forma Adjustments(g) |
PBF Energy Inc. |
|||||||||||||||||||||||
| (in thousands) | ||||||||||||||||||||||||||||
| Revenues |
$ | 14,960,338 | $ | 1,053,206 | $ | (52,015 | ) | (l) | $ | 15,961,529 | ||||||||||||||||||
| Cost and expenses |
||||||||||||||||||||||||||||
| Cost of sales, excluding depreciation |
13,855,163 | 916,418 | (52,015 | ) | (l) | 14,719,566 | ||||||||||||||||||||||
| Operating expenses, excluding depreciation |
658,831 | 40,726 | — | 699,557 | ||||||||||||||||||||||||
| General and administrative expenses(j) |
86,183 | 3,674 | — | 89,857 | ||||||||||||||||||||||||
| Acquisition related expenses |
728 | — | (556 | ) | (h) | 172 | ||||||||||||||||||||||
| Depreciation and amortization expense |
53,743 | — | 4,209 | (i) | 57,952 | |||||||||||||||||||||||
|
|
|
|
|
|
|
|
|
|
|
|
||||||||||||||||||
| 14,654,648 | 960,818 | (48,362 | ) | 15,567,104 | ||||||||||||||||||||||||
|
|
|
|
|
|
|
|
|
|
|
|
||||||||||||||||||
| Income (loss) from operations |
305,690 | 92,388 | (3,653 | ) | 394,425 | |||||||||||||||||||||||
| Other income (expense) |
||||||||||||||||||||||||||||
| Change in fair value of catalyst lease obligation |
7,316 | — | — | 7,316 | ||||||||||||||||||||||||
| Change in fair value of contingent consideration |
(5,215 | ) | — | — | (5,215 | ) | ||||||||||||||||||||||
| Interest expense, net |
(65,120 | ) | — | (30,542 | ) | (j) | (95,662 | ) | ||||||||||||||||||||
| Other income |
— | 59 | — | 59 | ||||||||||||||||||||||||
|
|
|
|
|
|
|
|
|
|
|
|
||||||||||||||||||
| 242,671 | 92,447 | (34,195 | ) | 300,923 | ||||||||||||||||||||||||
| Income tax expense (benefit) |
— | — | — | — | (m) | |||||||||||||||||||||||
|
|
|
|
|
|
|
|
|
|
|
|
||||||||||||||||||
| Net income (loss) |
$ | 242,671 | $ | 92,447 | $ | (34,195 | ) | $ | 300,923 | |||||||||||||||||||
|
|
|
|
|
|
|
|
|
|||||||||||||||||||||
| Less—net income (loss) attributable to noncontrolling interest |
(o) | |||||||||||||||||||||||||||
|
|
|
|
||||||||||||||||||||||||||
| Net income (loss) attributable to PBF Energy Inc. |
$ | |||||||||||||||||||||||||||
|
|
|
|
||||||||||||||||||||||||||
| Weighted Average Shares of Class A common stock outstanding(p) |
||||||||||||||||||||||||||||
| Basic |
||||||||||||||||||||||||||||
| Diluted |
||||||||||||||||||||||||||||
| Net income available to Class A common stock per share(p) |
||||||||||||||||||||||||||||
| Basic |
||||||||||||||||||||||||||||
| Diluted |
||||||||||||||||||||||||||||
56
Table of Contents
NOTES TO THE UNAUDITED PRO FORMA
CONSOLIDATED STATEMENTS OF OPERATIONS
| (f) | These pro forma adjustments give effect to the senior secured notes offering. The pro forma adjustments for the year ended December 31, 2011 also give effect to the acquisition of Toledo. |
| (g) | These pro forma adjustments give effect to the Offering Transactions. |
| (h) | To eliminate the acquisition related expenses that relate to the Toledo acquisition. |
| (i) | To reflect the change in depreciation and amortization arising from the Toledo acquisition as a result of the pro forma depreciation and amortization expense for the two months prior to our acquisition of Toledo on March 1, 2011. |
| (j) | Estimates the impact of the senior secured notes offering and the refinancing of existing senior debt as follows: |
| Nine Months Ended September 30, 2012 |
Year Ended December 31, 2011 |
|||||||
| Estimated interest expense for the notes issued in connection with the senior secured notes offering(1) |
$ | (6,217 | ) | $ | (57,393 | ) | ||
| Estimated amortization of deferred financing fees related to the notes issued in connection with the senior secured notes offering(2) |
(244 | ) | (2,250 | ) | ||||
| Eliminate historical interest expense and amortization of deferred financing fees for refinanced debt(3) |
6,322 | 29,101 | ||||||
|
|
|
|
|
|||||
| Pro forma adjustment |
$ | (139 | ) | $ | (30,542 | ) | ||
|
|
|
|
|
|||||
| (1) | Reflects pro forma cash interest expense related to the notes issued in connection with the senior secured notes offering. |
| (2) | Amortization expense related to the estimated deferred financing fees capitalized in connection with the indebtedness to be incurred in connection with the senior secured notes offering, which are being amortized over 8 years. |
| (3) | Reflects the elimination of historical interest expense and amortization of deferred financing fees, net of the unused commitment fee, arising from debt instruments paid off in connection with the notes issued in connection with the senior secured notes offering. |
| (k) | General and administrative expenses represent historical costs from PBF LLC and Toledo. Toledo’s historical financial information includes certain general and administrative costs incurred by Sunoco that were subsequently allocated to Toledo as direct and indirect costs attributable to the refinery. These costs are not necessarily indicative of what would have been incurred had the refinery been a standalone entity or operated as a subsidiary of PBF LLC nor are these costs necessarily indicative of what general and administration costs will be in the future. In addition, under various transition service agreements with Sunoco, we have incurred a total of $13.7 million of expense for the ten month period ended December 31, 2011. |
| (l) | To adjust consumer excise taxes reported gross within the historical Toledo statement of operations to net which conforms to PBF LLC accounting policy and statement of operations presentation. |
| (m) | Following the Offering Transactions, PBF Energy will be subject to U.S. federal income taxes, in addition to state and local taxes, with respect to its allocable share of any taxable income of PBF LLC. As a result, the pro forma consolidated statement of operations reflects an adjustment to our provision for corporate income taxes to reflect an effective rate of 39%, which includes provision for U.S. federal income taxes and assumes the highest statutory rates apportioned to each state and local jurisdictions. |
| (n) | Reflects the historical revenues and direct expenses of Toledo. The statements of revenue and expenses reflect items specifically identified to the refinery and therefore exclude certain other items such as interest |
57
Table of Contents
| income, interest expenses and income taxes not directly related to the refinery. They also reflect certain allocations Sunoco made for shared resources utilized prior to the acquisition which were considered reasonable. |
| (o) | As described in “Organizational Structure,” PBF Energy will become the sole managing member of PBF LLC. PBF Energy will initially own less than 100% of the economic interest in PBF LLC, but will have 100% of the voting power and control the management of PBF LLC. Immediately following this offering, the noncontrolling interest will be %. Net income attributable to the noncontrolling interest represents %, or $ of income before income taxes of $ for the nine months ended September 30, 2012 and %, or $ of income before income taxes of $ for the year ended December 31, 2011. Net income available to Class A common stock per share would not be significantly different if the assumed offering price changed by $1.00. |
| (p) | The shares of Class B common stock do not share in our earnings and are therefore not included in the weighted average shares outstanding or net income (loss) available per share. |
58
Table of Contents
Selected Historical Consolidated Financial Data of PBF LLC
The following table presents the selected historical consolidated financial data of PBF LLC. PBF LLC will be considered our predecessor for accounting purposes, and its consolidated financial statements will be our historical consolidated financial statements following this offering. The selected historical consolidated financial data as of December 31, 2010 and 2011 and for the years ended December 31, 2009, 2010 and 2011 have been derived from audited financial statements of PBF LLC, included elsewhere in this prospectus. The selected historical consolidated financial data for the period from March 1, 2008 (date of inception) through December 31, 2008 and as of December 31, 2008 and 2009 have been derived from the audited financial statements of PBF LLC not included in this prospectus. As a result of the Paulsboro and Toledo acquisitions, the historical consolidated financial results of PBF LLC only include the results of operations for Paulsboro and Toledo from December 17, 2010 and March 1, 2011 forward, respectively. The information as of September 30, 2011 and 2012, and for the nine months ended September 30, 2011 and 2012 was derived from the unaudited condensed consolidated financial statements of PBF LLC (included elsewhere in this prospectus) which include all adjustments, consisting of normal recurring adjustments, which management considers necessary for a fair presentation of the financial position and the results of operations for such periods. Results for the interim periods are not necessarily indicative of the results for the full year.
The historical consolidated financial data and other statistical data presented below should be read in conjunction with the consolidated financial statements of PBF LLC and the related notes thereto, included elsewhere in this prospectus, and the sections entitled “Unaudited Pro Forma Consolidated Financial Statements” and “Management’s Discussion and Analysis of Financial Condition and Results of Operations.” The consolidated financial information may not be indicative of our future performance.
PBF ENERGY COMPANY LLC AND SUBSIDIARIES
| Period From March 1, 2008 (Date of Inception) through December 31, 2008(3) |
Year Ended December 31, 2009(3) |
Year Ended December 31, 2010 |
Year Ended December 31, 2011 |
Nine Months Ended September 30, 2011 |
Nine Months Ended September 30, 2012 |
|||||||||||||||||||
| (in thousands) |
||||||||||||||||||||||||
| Statement of operations data: |
||||||||||||||||||||||||
|
Revenues(1) |
$ | 134 | $ | 228 | $ | 210,671 | $ | 14,960,338 | $ | 10,183,897 | $ | 15,188,327 | ||||||||||||
| Cost and expenses |
||||||||||||||||||||||||
| Cost of sales, excluding depreciation |
— | — | 203,971 | 13,855,163 | 9,147,063 | 13,871,884 | ||||||||||||||||||
| Operating expenses, excluding depreciation |
— | — | 25,140 | 658,831 | 457,722 | 537,880 | ||||||||||||||||||
| General and administrative expenses |
6,378 | 6,294 | 15,859 | 86,183 | 71,533 | 78,042 | ||||||||||||||||||
| Acquisition related expenses(2) |
— | — | 6,051 | 728 | 684 | — | ||||||||||||||||||
| Gain on sale of asset |
— | (2,430 | ) | |||||||||||||||||||||
| Depreciation and amortization expense |
18 | 44 | 1,402 | 53,743 | 35,636 | |
67,419 |
| ||||||||||||||||
|
|
|
|
|
|
|
|
|
|
|
|
|
|||||||||||||
| 6,396 | 6,338 | 252,423 | 14,654,648 | 9,712,638 | 14,552,795 | |||||||||||||||||||
|
|
|
|
|
|
|
|
|
|
|
|
|
|||||||||||||
| (Loss) income from operations |
(6,262 | ) | (6,110 | ) | (41,752 | ) | 305,690 | 471,259 | 635,532 | |||||||||||||||
| Other (expense) income |
||||||||||||||||||||||||
| Change in fair value of catalyst lease obligation |
— | — | (1,217 | ) | 7,316 | 4,848 | (6,929 | ) | ||||||||||||||||
| Change in fair value of contingent consideration |
— | — | — | (5,215 | ) | (4,829 | ) | (2,076 | ) | |||||||||||||||
| Interest income (expense), net |
198 | 10 | (1,388 | ) | (65,120 | ) | (44,127 | ) | (86,753 | ) | ||||||||||||||
|
|
|
|
|
|
|
|
|
|
|
|
|
|||||||||||||
| Net (loss) income |
(6,064 | ) | (6,100 | ) | (44,357 | ) | 242,671 | 427,151 | 539,774 | |||||||||||||||
| Less—Net loss attributable to the noncontrolling interest |
(165 | ) | — | — | — | — | — | |||||||||||||||||
|
|
|
|
|
|
|
|
|
|
|
|
|
|||||||||||||
| Net (loss) income attributable to PBF Energy Company LLC |
$ | (6,229 | ) | $ | (6,100 | ) | $ | (44,357 | ) | $ | 242,671 | $ | 427,151 | $ | 539,774 | |||||||||
|
|
|
|
|
|
|
|
|
|
|
|
|
|||||||||||||
| Balance sheet data (at end of period): |
||||||||||||||||||||||||
| Total assets |
$ | 25,040 | $ | 19,150 | $ | 1,274,393 | $ | 3,621,109 | $ | 3,872,150 | $ | 3,932,507 | ||||||||||||
| Total long-term debt(4) |
— | — | 325,064 | 804,865 | 713,255 | 732,961 | ||||||||||||||||||
| Total equity |
24,810 | 18,694 | 456,739 | 1,107,615 | 1,293,211 | 1,633,326 | ||||||||||||||||||
| Other financial data: |
||||||||||||||||||||||||
| Capital expenditures(5) |
$ | 118 | $ | 70 | $ | 72,118 | $ | 551,544 | $ | 504,034 | $ | 129,505 | ||||||||||||
59
Table of Contents
| (1) | Consulting services income provided to a related party was $10, $221, and $98 for the years ended December 31, 2010, 2009 and the period from March 1, 2008 (date of inception) to December 31, 2008, respectively. No consulting services income was earned subsequent to 2010. |
| (2) | Acquisition related expenses consist of consulting and legal expenses related to the Paulsboro and Toledo acquisitions as well as non-consummated acquisitions. |
| (3) | December 31, 2008 and 2009 balance sheet data is that of PBF Investments LLC. See footnote 1, Description of Business and Basis of Presentation, in the PBF LLC consolidated financial statements. |
| (4) | Total long-term debt includes current maturities and our Delaware Economic Development Authority Loan of $20.0 million. |
| (5) | Includes expenditures for construction in progress, property, plant and equipment and deferred turnaround costs. |
Selected Historical Financial Data of Paulsboro, PBF LLC’s Predecessor
The following table presents Paulsboro’s selected historical financial data. We refer to Paulsboro as PBF LLC’s “Predecessor” or “Predecessor Paulsboro,” as prior to its acquisition PBF LLC generated substantially no revenues and prior to the acquisition of Paulsboro and the Delaware City assets, was a new company formed to pursue acquisitions of crude oil refineries and downstream assets in North America. At the time of its acquisition, Paulsboro represented the major portion of PBF LLC’s business and assets.
The financial statements and supplementary data of Predecessor Paulsboro, are presented as of, and for the years ended, December 31, 2008 and 2009 and for the period from January 1, 2010 through December 16, 2010 and as of December 16, 2010, periods prior to PBF LLC’s acquisition. These financial statements were prepared by the former management of Predecessor Paulsboro and audited by Predecessor Paulsboro’s independent registered public accounting firm. The financial statements and supplementary data of Predecessor Paulsboro presented herein may not be representative of the operations of PBF going forward for the following reasons, among others:
| • | Both PBF LLC’s financial statements and Paulsboro’s financial statements contain items which require management to make considerable judgments and estimates. There can be no assurance that the judgments and estimates made by PBF LLC’s management will be identical or even similar to the historical judgments and estimates made by Paulsboro’s former management. |
| • | The financial statements of Paulsboro contain allocations of certain general and administrative expenses and income taxes specific to Valero. |
| • | The financial statements of Paulsboro reflect depreciation and amortization expense and asset impairment losses based on Valero’s historical cost basis for the applicable assets. PBF LLC’s cost basis in such assets is different. |
The historical financial data and other statistical data presented below should be read in conjunction with Paulsboro’s financial statements and the related notes thereto for the year ended December 31, 2009 and for the period from January 1, 2010 through December 16, 2010 and as of December 16, 2010, included elsewhere in this prospectus, and the sections entitled “Unaudited Pro Forma Consolidated Financial Statements” and “Management’s Discussion and Analysis of Financial Condition and Results of Operations—Results of Operations—Predecessor Paulsboro.” The historical financial data for Paulsboro for the year ended December 31, 2008 and as of December 31, 2008 and 2009 has been derived from audited financial statements not included in this prospectus.
60
Table of Contents
PAULSBORO REFINING BUSINESS—PBF LLC’S PREDECESSOR
| Year Ended December 31, | Period from January 1, 2010 through December 16, 2010 |
|||||||||||
| 2008 | 2009 | |||||||||||
| (in thousands) | ||||||||||||
| Statement of operations data: |
||||||||||||
| Operating revenues(1) |
$ | 6,448,379 | $ | 3,549,517 | $ | 4,708,989 | ||||||
| Cost and expenses: |
||||||||||||
| Cost of sales(2) |
5,718,685 | 3,419,460 | 4,487,825 | |||||||||
| Operating expenses |
317,093 | 266,319 | 259,768 | |||||||||
| General and administrative expenses(3) |
15,619 | 15,594 | 14,606 | |||||||||
| Asset impairment loss |
705 | 8,478 | 895,642 | |||||||||
| Depreciation and amortization expense |
56,634 | 65,103 | 66,361 | |||||||||
|
|
|
|
|
|
|
|||||||
| Total costs and expenses |
6,108,736 | 3,774,954 | 5,724,202 | |||||||||
| Operating income (loss) |
339,643 | (225,437 | ) | (1,015,213 | ) | |||||||
| Interest and other income and expense, net |
551 | 1,249 | 500 | |||||||||
|
|
|
|
|
|
|
|||||||
| Income (loss) before income tax expense (benefit) |
340,194 | (224,188 | ) | (1,014,713 | ) | |||||||
| Income tax expense (benefit)(4) |
131,445 | (86,586 | ) | (322,962 | ) | |||||||
|
|
|
|
|
|
|
|||||||
| Net income (loss) |
$ | 208,749 | $ | (137,602 | ) | $ | (691,751 | ) | ||||
|
|
|
|
|
|
|
|||||||
| Balance sheet data (at end of period): |
||||||||||||
| Total assets |
$ | 1,434,980 | $ | 1,440,557 | $ | 510,205 | ||||||
| Total liabilities |
392,099 | 357,289 | 42,582 | |||||||||
| Net parent investment |
1,042,881 | 1,083,268 | 467,623 | |||||||||
| Selected financial data: |
||||||||||||
| Capital expenditures |
$ | 198,647 | $ | 96,754 | $ | 20,122 | ||||||
| (1) | Operating revenues consist of refined products sold from Paulsboro to Valero that were recorded at intercompany transfer prices, which were market prices adjusted by quality, location, and other differentials on the date of the sale. |
| (2) | Cost of sales consist of the cost of feedstock acquired for processing, including transportation costs to deliver the feedstock to Paulsboro. Purchases of feedstock by Paulsboro from Valero were recorded at the cost paid to independent third parties by Valero. |
| (3) | General and administrative expenses include allocations and estimates of general and administrative costs of Valero that were attributable to the operations of Paulsboro. |
| (4) | The income tax provision represented the current and deferred income taxes that would have resulted if Paulsboro were a stand-alone taxable entity filing its own income tax returns. Accordingly, the calculations of current and deferred income tax provision require certain assumptions, allocations, and estimates that Paulsboro management believed were reasonable to reflect the tax reporting for Paulsboro as a stand-alone taxpayer. |
The selected financial data as of December 31, 2007 and for the year ended December 31, 2007 has been omitted because it is not available without the expenditure of unreasonable effort and expense. We believe the omission of this financial data does not have a material impact on the understanding of our results of operations, financial performance and related trends.
61
Table of Contents
MANAGEMENT’S DISCUSSION AND ANALYSIS OF FINANCIAL
CONDITION AND RESULTS OF OPERATIONS
You should read the following discussion and analysis together with “Selected Financial Data” and our consolidated financial statements and related notes included elsewhere in this prospectus. Among other things, those historical financial statements include more detailed information regarding the basis of presentation for the financial data included in the following discussion. This discussion contains forward-looking statements about our business, operations and industry that involve risks and uncertainties, such as statements regarding our plans, objectives, expectations and intentions. Our actual results could differ materially from those discussed in the forward-looking statements. Factors that could cause or contribute to these differences include those discussed below and elsewhere in this prospectus particularly in the sections entitled “Risk Factors” and “Forward-Looking Statements.”
Management’s Discussion and Analysis of Financial Condition and Results of Operations is divided into sections entitled “Executive Summary,” “Factors Affecting Comparability,” “Factors Affecting Operating Results,” “Results of Operations—PBF LLC” “Results of Operations—Paulsboro Refining Business—PBF LLC’s Predecessor,” “Liquidity and Capital Resources,” “Cash Flows Analysis of Paulsboro Refining Business—PBF LLC’s Predecessor,” “Senior Secured Notes Offering,” “Credit Facilities,” “Cash Balances,” “Liquidity,” “Working Capital,” “Pro Forma Contractual Obligations and Commitments,” “Off-Balance Sheet Arrangements,” “Quantitative and Qualitative Disclosures about Market Risk,” “Critical Accounting Policies” and “Recent Accounting Pronouncements.” Information therein should help provide a better understanding of the major factors and trends that affect our earnings performance and financial condition, and how our performance during the first three quarters of 2012 and the years ended December 31, 2011 and 2010 compare to the applicable prior periods. The historical results of operations for PBF LLC’s Predecessor is presented and discussed separately to allow the readers of our prospectus to better evaluate the historical operating performance of our current business.
Executive Summary
We were formed in 2008 to pursue acquisitions of crude oil refineries and downstream assets in North America. We currently own and operate three domestic oil refineries and related assets located in Toledo, Ohio, Delaware City, Delaware, and Paulsboro, New Jersey, which we acquired in 2011 and 2010. Our refineries have a combined processing capacity, known as throughput, of approximately 540,000 bpd, and a weighted average Nelson Complexity Index of 11.3.
The following table summarizes our history and acquisitions:
| March 2008 |
PBF was formed. | |
| June 2010 |
The idle Delaware City refinery and its related assets were acquired from Valero for approximately $220.0 million. | |
| December 2010 |
The Paulsboro refinery was acquired from Valero for approximately $357.7 million, excluding working capital. | |
| March 2011 |
The Toledo refinery was acquired from Sunoco for approximately $400.0 million, excluding working capital. | |
| October 2011 |
Delaware City became operational. | |
Throughout this prospectus we include financial statements and other financial and operating data for the Paulsboro Refining Business for periods prior to its acquisition date of December 17, 2010. We refer to Paulsboro as PBF LLC’s “Predecessor” or “Predecessor Paulsboro,” because we generated substantially no revenues and prior to our acquisition of Paulsboro and the Delaware City assets, we were a new company formed to pursue acquisitions of crude oil refineries and downstream assets in North America. At the time of its acquisition, Paulsboro represented the major portion of our business and assets.
62
Table of Contents
Factors Affecting Comparability
Our results over the past three years have been affected by the following events, which must be understood in order to assess the comparability of our period to period financial performance and condition.
Acquisition of Delaware City Refinery
Through our subsidiaries, Delaware City Refining and Delaware Pipeline Company LLC, we acquired the idle Delaware City refinery and its related assets, including a petroleum product terminal, a petroleum products pipeline and an electric generation facility, on June 1, 2010 from affiliates of Valero for approximately $220.0 million in cash. We also incurred approximately $4.3 million in acquisition costs. The acquisition of the Delaware City refinery and its related assets was accounted for as an acquisition of assets. The purchase price was allocated to the assets acquired and liabilities assumed based on their estimated fair value. The results of operations have been included in our consolidated financial statements since June 1, 2010. For the period from June 1, 2010 until June 2011, when we began re-starting refinery operations, our results of operations included only certain minor terminal operations and substantial capital improvement activities to prepare the refinery and power plant for re-start. The refinery became fully operational in October 2011 and the results of operations prior to re-start and during the re-start period may not be indicative of our future performance.
The prior owner shut down the Delaware City refinery in the fourth quarter of 2009 due to, among other reasons, financial losses caused by one of the worst recessions in recent history. We were therefore able to acquire the refinery at an attractive price, obtain economic support from the State of Delaware to re-start the refinery, and enter into a new contract with the relevant union at the refinery.
On June 1, 2010, we hired 63 employees of the prior owner to assist us with implementing our refinery turnaround/reconfiguration plan and to conduct terminal operations at the refinery. These employees primarily held positions as engineers, refinery operators, terminal operators, dockworkers, maintenance workers and administrative staff prior to our acquisition of the refinery assets. In connection with our acquisition, we were able to negotiate a new contract with the union including: (1) reopening of the refinery with approximately 470 employees, compared to approximately 700 prior to shutdown by Valero; (2) flexibility with respect to which workers are hired (i.e., no seniority clause); (3) different benefits packages; and (4) more flexible work rules.
Since our acquisition, we have invested more than $500.0 million in turnaround and re-start projects at Delaware City, as well as in the recent strategic development of a crude rail unloading facility. The re-start process included the decommissioning of the gasifier unit located on the property which allowed us to decrease emissions and improve the reliability of the refinery. In addition, we have completed a cogeneration project to convert the electric generation units at the refinery to use natural gas as a fuel and a hydrocracker corrosion control project aimed at increasing throughput. We made significant operating improvements in the first year of operations by modifying the crude slate and product yield, changing operations of the conversion units and re-starting certain units. Through these capital investments and by restructuring certain operations, we have lowered the annual operating expenses of the Delaware City refinery relative to its pre-acquisition operating expense levels by more than 40%. In 2012, we are spending approximately $57.0 million, $20.0 million of which has been spent as of September 30, 2012, to expand and upgrade the existing on-site rail infrastructure, including the expansion of the crude rail unloading facilities that will be capable of discharging approximately 110,000 bpd.
In connection with our re-start of the refinery, we received a $20.0 million loan from the State of Delaware which converts to a grant contingent upon our continued operation of the refinery and certain other conditions. The State of Delaware also agreed to reimburse us $12.0 million in the aggregate for the dredging of the Delaware River near the refinery over the next six years, granted us $1.5 million to fund employee training programs, and granted us $10.0 million towards the conversion of the gas turbines at the refinery to run on natural gas and reduce emissions.
63
Table of Contents
We also obtained a new operating agreement for the Delaware City refinery that defers the construction of previously scheduled cooling water towers that the prior owner planned to spend in excess of $100.0 million to install. The deferral allows us to evaluate the cost effectiveness of closed loop cooling water systems and propose alternatives to be implemented in the next permitting cycle, which is at least five years away. The permits issued pursuant to the new operating agreement provide a plant-wide limit for certain emissions rather than source specific limits. Based on our shutdown of the gasifier unit and the resulting reduction of certain emissions by converting the combustion turbines to natural gas, we avoided additional controls on specific sources that the prior owner anticipated spending approximately $200.0 million to install. As a result of these negotiations, we now have the operational flexibility to manage our emissions in a cost effective manner.
The Delaware City refinery has a throughput capacity of 190,000 bpd and a Nelson Complexity Index of 11.3. It is located on a 5,000-acre site, with access to waterborne cargoes and an extensive distribution network of pipelines, barges and tankers, truck and rail. Delaware City is a fully integrated operation that receives crude via ship or barge at its docks located on the Delaware River. The crude and other feedstocks are transported, via pipes, to an extensive tank farm where they are stored until processing. In addition, there is a 17-bay, 50,000 bpd capacity truck loading rack located adjacent to the refinery, and a 23-mile interstate pipeline that is used to distribute clean products.
Acquisition of Paulsboro Refinery
We acquired the entities that owned the Paulsboro refinery (including an associated natural gas pipeline) on December 17, 2010, from Valero for approximately $357.7 million, excluding working capital. We paid the purchase price with the $160.0 million Paulsboro Promissory Note and cash funded with equity. The purchase price excludes inventory purchased on our behalf by MSCG and Statoil. The acquisition was accounted for using the acquisition method of accounting. The purchase price was allocated to the assets acquired and liabilities assumed based on their estimated fair values. The results of operations of the Paulsboro refinery have been included in our combined and consolidated financial statements as of December 17, 2010. We invested approximately $60.0 million in capital in early 2011 to complete a scheduled turnaround at the refinery.
Paulsboro has a throughput capacity of 180,000 bpd and a Nelson Complexity Index of 13.2. The Paulsboro refinery is located on approximately 950 acres on the Delaware River in Paulsboro, New Jersey, just south of Philadelphia, and approximately 30 miles away from Delaware City. The refinery processes a variety of medium and heavy, sour crude oils.
Acquisition of Toledo Refinery
Through our subsidiary, Toledo Refining, we acquired the Toledo refinery on March 1, 2011, from Sunoco for approximately $400.0 million, excluding working capital. We paid the purchase price with the $200.0 million Toledo Promissory Note and cash funded with equity. We also purchased refined and certain intermediate products in inventory for approximately $299.6 million with the proceeds from a note provided by Sunoco that we subsequently repaid on May 31, 2011 with proceeds from our ABL Revolving Credit Facility, and MSCG purchased the refinery’s crude oil inventory on our behalf. Additionally, included in the terms of the sale is a five-year participation payment of up to $125.0 million payable to Sunoco based upon post-acquisition earnings of the refinery, of which $103.6 million was paid in 2012. We currently anticipate paying the balance of the participation payment in April 2013. See “—Pro Forma Contractual Obligations and Commitments.”
The acquisition was accounted for using the acquisition method of accounting with the preliminary purchase price allocated to the assets acquired and liabilities assumed based on their estimated fair values. The results of operations of the Toledo refinery have been included in our consolidated financial statements as of March 1, 2011.
Toledo has a throughput capacity of 170,000 bpd and a Nelson Complexity Index of 9.2. Toledo processes a slate of light, sweet crudes from Canada, the Midcontinent, the Bakken region and the U.S. Gulf Coast. The Toledo refinery is located on a 282-acre site near Toledo, Ohio, approximately 60 miles from Detroit.
64
Table of Contents
Amended and Restated ABL Revolving Credit Facility
On May 31, 2011, we amended the terms of our ABL Revolving Credit Facility to increase its size to $500.0 million and included certain inventory and accounts receivable of the Toledo refinery in the borrowing base. In addition, the interest rate was changed to the Adjusted LIBOR Rate plus 2.00% to 2.50%, depending on the excess availability, as defined, and the maturity date was extended to May 31, 2016. On an ongoing basis, the ABL Revolving Credit Facility is available to be used for working capital and other general corporate purposes. In March, August, and September 2012, we amended the ABL Revolving Credit Facility again to increase the aggregate size from $500.0 million to $750.0 million, $950 million, and $965 million, respectively. In addition, the ABL Revolving Credit Facility was amended and restated on October 26, 2012 to increase the maximum availability to $1.375 billion, extend the maturity date to October 26, 2017, and amend the borrowing base to include non-U.S. inventory. The amended and restated ABL Revolving Credit Facility includes an accordion feature which allows for commitments of up to $1.8 billion.
Letter of Credit Facility
On January 25, 2011, we entered into a short-term letter of credit facility, which was subsequently amended on April 26, 2011 and April 24, 2012, under which we can obtain letters of credit up to $750.0 million composed of a committed maximum amount of $500.0 million and an uncommitted maximum amount of $250.0 million to support certain of our crude oil purchases. We are charged letter of credit issuance fees and a fee for the unused portion of the committed letter of credit facility. The facility matures on April 23, 2013. As a result of the increased size of the amended and restated ABL Revolving Credit Facility, we expect to terminate the letter of credit facility prior to its maturity.
Senior Secured Notes Offering
On February 9, 2012, we completed an offering of $675.5 million aggregate principal amount of 8.25% Senior Secured Notes, due 2020 (which we refer to as the “senior secured notes offering”). The net proceeds from the offering of approximately $665.8 million were used to repay our Paulsboro Promissory Note in the amount of $150.6 million, our Term Loan Facility in the amount of $123.8 million, our Toledo Promissory Note in the amount of $181.7 million, and to reduce indebtedness under the ABL Revolving Credit Facility. As a result of the senior secured notes offering, and the repayment of our Delaware City construction financing on August 31, 2012, with the exception of our catalyst lease, we have no long-term debt maturing before 2020.
Factors Affecting Operating Results
Overview
Our earnings and cash flows from operations are primarily affected by the relationship between refined product prices and the prices for crude oil and other feedstocks. The cost to acquire crude oil and other feedstocks and the price of refined petroleum products ultimately sold depend on numerous factors beyond our control, including the supply of, and demand for, crude oil, gasoline, diesel and other refined petroleum products, which, in turn, depend on, among other factors, changes in global and regional economies, weather conditions, global and regional political affairs, production levels, the availability of imports, the marketing of competitive fuels, pipeline capacity, prevailing exchange rates and the extent of government regulation. Our revenue and operating income fluctuate significantly with movements in industry refined petroleum product prices, our materials cost fluctuate significantly with movements in crude oil prices and our other operating expenses fluctuate with movements in the price of energy to meet the power needs of our refineries. In addition, the effect of changes in crude oil prices on our operating results is influenced by how the prices of refined products adjust to reflect such changes.
Crude oil and other feedstock costs and the prices of refined petroleum products have historically been subject to wide fluctuation. Expansion and upgrading of existing facilities and installation of additional refinery distillation or conversion capacity, price volatility, international political and economic developments and other
65
Table of Contents
factors beyond our control are likely to continue to play an important role in refining industry economics. These factors can impact, among other things, the level of inventories in the market, resulting in price volatility and a reduction or increase in product margins. Moreover, the industry typically experiences seasonal fluctuations in demand for refined petroleum products, such as for gasoline and diesel, during the summer driving season and for home heating oil during the winter.
Benchmark Refining Margins
In assessing our operating performance, we compare the refining margins (revenue less materials cost) of each of our refineries against a specific benchmark industry refining margin based on a crack spread. Benchmark refining margins take into account both crude and refined petroleum product prices. When these prices are combined in a formula they provide a single value—a gross margin per barrel—that, when multiplied by a throughput number, provides an approximation of the gross margin generated by refining activities.
The performance of our East Coast refineries follows the currently published Dated Brent (NYH) 2-1-1 benchmark refining margins. For our Toledo refinery, we utilize a composite benchmark refining margin, the WTI (Chicago) 4-3-1, that is based on publicly available pricing information for products trading in the Chicago and United States Gulf Coast markets.
While the benchmark refinery margins presented below under “Results of Operations—PBF LLC—Market Indicators” and “—Results of Operations—Paulsboro Refining Business—PBF LLC’s Predecessor—Market Indicators,” are representative of the results of our refineries, each refinery’s realized gross margin on a per barrel basis will differ from the benchmark due to a variety of factors affecting the performance of the relevant refinery to its corresponding benchmark. These factors include the refinery’s actual type of crude oil throughput, product yield differentials and any other factors not reflected in the benchmark refining margins, such as transportation costs, storage costs, credit fees, fuel consumed during production and any product premiums or discounts, as well as inventory fluctuations, timing of crude oil and other feedstock purchases, a rising or declining crude and product pricing environment and commodity price management activities. As discussed in more detail below, each of our refineries, depending on market conditions, has certain feedstock-cost and product-value advantages and disadvantages as compared to the refinery’s relevant benchmark.
Credit Risk Management
Credit risk refers to the risk that a counterparty will default on its contractual obligations resulting in financial loss to us. Our exposure to credit risk is reflected in the carrying amount of the receivables that are presented in our balance sheet. To minimize credit risk, all customers are subject to extensive credit verification procedures and extensions of credit above defined thresholds are to be approved by the senior management. Our intention is to trade only with recognized creditworthy third parties. In addition, receivable balances are monitored on an ongoing basis. We also limit the risk of bad debts by obtaining security such as guarantees or letters of credit.
Other Factors
We currently source our crude oil for Paulsboro and Delaware City on a global basis through a combination of market purchases and short-term purchase contracts through our crude supply contracts primarily with Statoil. Our agreement with Statoil for Paulsboro will terminate effective March 31, 2013, at which time we plan to source Paulsboro’s crude oil and feedstocks internally. Our agreement with Statoil for Delaware City has been extended by Statoil through December 31, 2015 and we have recently entered into certain amendments to that agreement that are effective through the extended term. In addition, we have a long-term contract with the Saudi Arabian Oil Company (“Saudi Aramco”). We have been purchasing up to approximately 100,000 bpd of crude oil from Saudi Aramco that is processed at Paulsboro pursuant to this agreement and on a spot basis. Our Toledo refinery sources domestic and Canadian crude oil through similar market purchases through our crude supply
66
Table of Contents
contract with MSCG. We believe purchases based on market pricing has given us flexibility in obtaining crude oil at lower prices and on a more accurate “as needed” basis. Since our Paulsboro and Delaware City refineries access their crude slates from the Delaware River via ship or barge and through our rail facilities at Delaware City, these refineries have the flexibility to purchase crude oils from the Midcontinent and Western Canada, as well as a number of different countries.
Our operating cost structure is also important to our profitability. Major operating costs include costs relating to employees and contract labor, energy, maintenance and environmental compliance. The predominant variable cost is energy, in particular, the price of utilities, natural gas and chemicals.
Our operating results are also affected by the reliability of our refinery operations. Unplanned downtime of our refinery assets generally results in lost margin opportunity and increased maintenance expense. The financial impact of planned downtime, such as major turnaround maintenance, is managed through a planning process that considers such things as the margin environment, the availability of resources to perform the needed maintenance and feedstock logistics, whereas unplanned downtime does not afford us this opportunity.
Refinery-Specific Information
The following section includes refinery-specific information related to crude differentials, ancillary costs, and local premiums and discounts.
Delaware City Refinery. The benchmark refining margin for the Delaware City refinery is calculated by assuming that two barrels of the benchmark Dated Brent crude oil are converted into one barrel of gasoline and one barrel of heating oil. We calculate this refining margin using the New York Harbor market value of gasoline and heating oil against the market value of Dated Brent crude oil and refer to the benchmark as the Dated Brent (NYH) 2-1-1 benchmark refining margin. Our Delaware City refinery has a product slate of approximately 52.5% gasoline, 35% distillate (split evenly between ULSD and heating oil), 1.5% high-value petrochemicals, with the remaining 11% of the product slate comprised of lower-value products (5% petroleum coke, 5% LPGs and 1% other). For this reason, we believe the Dated Brent (NYH) 2-1-1 is an appropriate benchmark industry refining margin. The Dated Brent (NYH) 2-1-1 benchmark crack has averaged $14.55 per barrel over the period from January 1, 2012 to September 30, 2012. The majority of Delaware City revenues are generated off NYH-based market prices.
The Delaware City refinery’s realized gross margin on a per barrel basis has historically differed from the Dated Brent (NYH) 2-1-1 benchmark refining margin due to the following factors:
| • | the Delaware City refinery processes a slate of primarily medium and heavy, and sour crude oil, which has constituted approximately 70% to 80% of total throughput. The remaining throughput consists of sweet crude oil and other feedstocks and blendstocks. Our total throughput costs have historically priced at a discount to Dated Brent; and |
| • | as a result of the heavy, sour crude slate processed at Delaware City, we produce low value products including sulfur and petroleum coke. These products are priced at a significant discount to gasoline, ULSD and heating oil and represent approximately 5% of our total production volume. |
Paulsboro Refinery. The benchmark refining margin for the Paulsboro refinery is calculated by assuming that two barrels of the benchmark Dated Brent crude oil are converted into one barrel of gasoline and one barrel of heating oil. We calculate this refining margin using the New York Harbor market value of gasoline and heating oil against the market value of Dated Brent crude oil and refer to the benchmark as the Dated Brent (NYH) 2-1-1 benchmark refining margin. Our Paulsboro refinery has a product slate of approximately 37.5% gasoline, 40.5% distillate (comprised of approximately one-third jet fuel and two-thirds heating oil), 5.5% high-value Group I lubricants, with the remaining 16.5% of the product slate comprised of lower-value products (4% petroleum coke, 3% LPGs, 3% fuel oil, 5% asphalt, and 1.5% other). For this reason, we believe the Dated
67
Table of Contents
Brent (NYH) 2-1-1 is an appropriate benchmark industry refining margin. The Dated Brent (NYH) 2-1-1 benchmark crack has averaged $14.55 per barrel over the period from January 1, 2012 to September 30, 2012. The majority of Paulsboro revenues are generated off NYH-based market prices.
The Paulsboro refinery’s realized gross margin on a per barrel basis has historically differed from the Dated Brent (NYH) 2-1-1 benchmark refining margin due to the following factors:
| • | the Paulsboro refinery processes a slate of primarily medium and heavy, and sour crude oil, which has historically constituted approximately 70% to 80% of total throughput. The remaining throughput consists of sweet crude oil and other feedstocks and blendstocks. Historically, Paulsboro’s delivered crude costs have priced at a discount to Dated Brent; |
| • | as a result of the heavy, sour crude slate processed at Paulsboro, we produce low value products including sulfur, petroleum coke and fuel oil. These products are priced at a significant discount to gasoline and heating oil and represent approximately 8% to 9.5% of our total production volume; and |
| • | the Paulsboro refinery produces Group I lubricants which, through an extensive production process, has a low volume yield which limits the volume expansion on crude inputs. |
Toledo Refinery. The benchmark refining margin for the Toledo refinery is calculated by assuming that four barrels of benchmark WTI crude oil are converted into three barrels of gasoline, one-half barrel of ULSD and one-half barrel of jet fuel. We calculate this refining margin using the Chicago market values of gasoline and ULSD and the United States Gulf Coast value of jet fuel against the market value of WTI crude oil and refer to this benchmark as the WTI (Chicago) 4-3-1 benchmark refining margin. Our Toledo refinery has a product slate of approximately 51% gasoline, 35% distillate (comprised of approximately 45% jet fuel and 55% ULSD), 5% high-value petrochemicals (including nonene, tetramer, benzene, xylene and toluene) with the remaining 9% of the product slate comprised of lower-value products (6% LPGs, 2.5% fuel oil and 0.5% other). For this reason, we believe the WTI (Chicago) 4-3-1 is an appropriate benchmark industry refining margin. The majority of Toledo revenues are generated off Chicago-based market prices. The WTI (Chicago) 4-3-1 benchmark crack has averaged $28.05 per barrel over the period from January 1, 2012 to September 30, 2012.
The Toledo refinery’s realized gross margin on a per barrel basis has historically differed from the WTI (Chicago) 4-3-1 benchmark refining margin due to the following factors:
| • | the Toledo refinery processes a slate of domestic sweet crude oil (60% of total crude throughput) and Syncrude (40% of total crude throughput). Historically, Toledo’s delivered crude costs have been higher than the market value of WTI crude oil; |
| • | the Toledo refinery is connected to its distribution network through a variety of third party product pipelines. While lower in cost when compared to barge or rail transportation, the inclusion of transportation costs increases our overall cost relative to the 4-3-1 benchmark refining margin; and |
| • | the Toledo refinery generates a pricing benefit on some of its products, primarily its petrochemicals. |
68
Table of Contents
Results of Operations—PBF LLC
The tables below summarize certain information relating to our operating results derived from our unaudited condensed consolidated financial data for the nine months ended September 30, 2012 and 2011 and our audited consolidated financial data for the years ended December 31, 2009, 2010 and 2011. This data should be read in conjunction with our audited and unaudited condensed consolidated financial statements and the notes thereto included elsewhere in this prospectus.
PBF LLC and Subsidiaries
| Year Ended December 31, 2009 |
Year Ended December 31, 2010 |
Year Ended December 31, 2011 |
Nine Months Ended September 30, 2011 |
Nine Months Ended September 30, 2012 |
||||||||||||||||
| (in thousands) |
||||||||||||||||||||
| Revenues |
$ | 228 | $ | 210,671 | $ | 14,960,338 | $ | 10,183,897 | $ | 15,188,327 | ||||||||||
| Cost of sales, excluding depreciation |
— | 203,971 | 13,855,163 | 9,147,063 | 13,871,884 | |||||||||||||||
|
|
|
|
|
|
|
|
|
|
|
|||||||||||
| Non-GAAP gross margin(1) |
228 | 6,700 | 1,105,175 | 1,036,834 | 1,316,443 | |||||||||||||||
| Operating expenses, excluding depreciation |
— | 25,140 | 658,831 | 457,722 | 537,880 | |||||||||||||||
| General and administrative expenses |
6,294 | 15,859 | 86,183 | 71,533 | 78,042 | |||||||||||||||
| Acquisition related expenses |
— | 6,051 | 728 | 684 | — | |||||||||||||||
| Gain on sale of asset |
— | — | — | — | (2,430 | ) | ||||||||||||||
| Depreciation and amortization expense |
44 | 1,402 | 53,743 | 35,636 | 67,419 | |||||||||||||||
|
|
|
|
|
|
|
|
|
|
|
|||||||||||
| 6,338 | 48,452 | 799,485 | 565,575 | 680,911 | ||||||||||||||||
|
|
|
|
|
|
|
|
|
|
|
|||||||||||
| (Loss) income from operations |
(6,110 | ) | (41,752 | ) | 305,690 | 471,259 | 635,532 | |||||||||||||
| Change in fair value of catalyst leases |
— | (1,217 | ) | 7,316 | 4,848 | (6,929 | ) | |||||||||||||
| Change in fair value of contingent consideration |
— | — | (5,215 | ) | (4,829 | ) | (2,076 | ) | ||||||||||||
| Interest income (expense), net |
10 | (1,388 | ) | (65,120 | ) | (44,127 | ) | (86,753 | ) | |||||||||||
|
|
|
|
|
|
|
|
|
|
|
|||||||||||
| Net (loss) income |
$ | (6,100 | ) | $ | (44,357 | ) | $ | 242,671 | $ | 427,151 | $ | 539,774 | ||||||||
|
|
|
|
|
|
|
|
|
|
|
|||||||||||
| Gross margin |
$ | 228 | $ | (4,895 | ) | $ | 417,962 | $ | 567,995 | $ | 716,267 | |||||||||
| (1) | Non-GAAP gross margin is defined as gross margin excluding direct operating expenses and depreciation expense related to the refineries. We believe non-GAAP gross margin is an important measure of operating performance and provides useful information to investors because it is a better metric comparison for the industry refining margin benchmarks, as the refining margin benchmarks do not include a charge for operating expenses and depreciation expense. In order to assess our operating performance, we compare our non-GAAP gross margin (revenue less cost of sales) to industry refining margin benchmarks and crude oil prices as defined in the table below. Information is shown only for the periods during which we had refining operations. |
69
Table of Contents
| Non-GAAP gross margin should not be considered an alternative to gross margin, operating income, net cash flows from operating activities or any other measure of financial performance or liquidity presented in accordance with GAAP. Non-GAAP gross margin presented by other companies may not be comparable to our presentation, since each company may define this term differently. The following table presents a reconciliation of Non-GAAP gross margin to the most directly comparable GAAP financial measure, gross margin, on a historical basis, as applicable, for each of the periods indicated: |
| Year Ended December 31, | Nine Months Ended September 30, | |||||||||||||||||||
| 2009 | 2010 | 2011 | 2011 | 2012 | ||||||||||||||||
| (in thousands) | ||||||||||||||||||||
| Reconciliation of gross margin to Non-GAAP gross margin: |
||||||||||||||||||||
| Gross margin |
$ | 228 | $ | (4,895 | ) | $ | 417,962 | $ | 567,995 | $ | 716,267 | |||||||||
| Add: |
||||||||||||||||||||
| Refinery operating expenses |
— | 11,052 | 635,517 | 434,408 | 537,880 | |||||||||||||||
| Refinery depreciation expense |
— | 543 | 51,696 | 34,431 | 62,296 | |||||||||||||||
|
|
|
|
|
|
|
|
|
|
|
|||||||||||
| Non-GAAP gross margin |
$ | 228 | $ | 6,700 | $ | 1,105,175 | $ | 1,036,834 | $ | 1,316,443 | ||||||||||
|
|
|
|
|
|
|
|
|
|
|
|||||||||||
| Year Ended December 31, 2010(b) |
Year Ended December 31, 2011 |
Nine Months
Ended September 30, 2011 |
Nine Months
Ended September 30, 2012 |
|||||||||||||
| Market Indicators(a) (dollars per barrel, except as noted) |
||||||||||||||||
| Dated Brent crude oil |
$ | 92.77 | $ | 111.26 | $ | 111.89 | $ | 112.21 | ||||||||
| West Texas Intermediate (WTI) crude oil |
$ | 90.03 | $ | 95.04 | $ | 95.37 | $ | 96.13 | ||||||||
| Crack Spreads |
||||||||||||||||
| Dated Brent (NYH)2-1-1 |
$ | 10.41 | $ | 9.93 | $ | 10.38 | $ | 14.55 | ||||||||
| WTI (Chicago) 4-3-1 |
$ | 10.30 | $ | 24.14 | $ | 26.18 | $ | 28.05 | ||||||||
| Crude Oil Differentials |
||||||||||||||||
| Dated Brent (foreign) less WTI |
$ | 2.74 | $ | 16.22 | $ | 16.52 | $ | 16.08 | ||||||||
| Dated Brent less Maya (heavy, sour) |
$ | 13.19 | $ | 12.63 | $ | 14.86 | $ | 10.51 | ||||||||
| Dated Brent less WTS (sour) |
$ | 5.22 | $ | 18.28 | $ | 18.98 | $ | 20.18 | ||||||||
| Dated Brent less ASCI (sour) |
$ | 2.55 | $ | 3.82 | $ | 4.26 | $ | 4.46 | ||||||||
| WTI less WCS (heavy, sour) |
$ | 18.25 | $ | 15.63 | $ | 16.71 | $ | 20.40 | ||||||||
| WTI less Bakken (light, sweet) |
$ | 2.96 | $ | (3.31 | ) | $ | (4.73 | ) | $ | 6.36 | ||||||
| WTI less Syncrude (light, sweet) |
$ | 1.43 | $ | (9.79 | ) | $ | (11.06 | ) | $ | 1.37 | ||||||
| Natural gas (dollars per MMBTU) |
$ | 4.17 | $ | 4.00 | $ | 4.21 | $ | 2.58 | ||||||||
| Key Operating Information |
||||||||||||||||
| Production (barrels per day in thousands) |
146.5 | 427.9 | 318.7 | 463.0 | ||||||||||||
| Crude oil and feedstocks throughput (barrels per day in thousands) |
143.8 | 429.4 | 316.0 | 464.0 | ||||||||||||
| Total crude oil and feedstocks throughput (millions of barrels) |
2.2 | 128.7 | 86.3 | 127.1 | ||||||||||||
| (a) | As reported by Platts. |
| (b) | Data is for the period from December 17, 2010 to December 31, 2010. |
Nine Months Ended September 30, 2012 Compared to Nine Months Ended September 30, 2011
Overview—Net income was $539.8 million for the nine months ended September 30, 2012 compared to $427.2 for the nine months ended September 30, 2011. During the 2011 period, our results reflect nine months of operations of our Paulsboro refinery, seven months of operations of our Toledo refinery, which was acquired on March 1, 2011, and activities to turnaround, reconfigure and re-start our Delaware City Refinery. We began restarting our Delaware City refinery in June 2011 and it was fully operational in October 2011. During the nine months ended September 30, 2012, all three of our refineries were operating, although the Toledo refinery was impacted by a thirty day turnaround of its hydrocracker, reformer and UDEX units which commenced on March 9, 2012. Our results for the nine months ended September 30, 2012 were favorably impacted by improved crack spreads despite the narrowing of the light/heavy crude differential.
Revenues—Revenues totaled $15.2 billion for the nine months ended September 30, 2012 compared to $10.2 billion for the nine months ended September 30, 2011, an increase of $5.0 billion, or 49%. The revenue
70
Table of Contents
increase primarily relates to nine months of operations of the Toledo refinery in 2012 compared to seven months in 2011 as a result of its acquisition on March 1, 2011, and nine months of operations of our Delaware City refinery in 2012, which was being reconfigured and prepared for restart during the 2011 period. For the nine months ended September 30, 2012, the total throughput rates at our Paulsboro, Toledo, and Delaware City refineries averaged approximately 155,000 bpd, 147,400 bpd, and 161,500 bpd, respectively. For the nine months ended September 30, 2011, the total throughput rates at our Paulsboro, Toledo and Delaware City refineries averaged approximately 150,100 bpd, 151,300 bpd, and 105,700 bpd, respectively. For the nine months ended September 30, 2012, the total barrels sold at our Paulsboro, Toledo, and Delaware City refineries averaged approximately 148,000 bpd, 154,200 bpd, and 154,100 bpd, respectively. For the nine months ended September 30, 2011, the total barrels sold at our Paulsboro, Toledo, and Delaware City refineries averaged approximately 150,800 bpd, 159,800 bpd, and 89,800 bpd, respectively.
The throughput rate and barrels sold for our Toledo and Delaware City refineries for the nine months ended September 30, 2011 reflect the period from March 1 to September 30 and June 1 to September 30, respectively. Total barrels sold during the nine months ended September 30, 2012 were approximately 128.5 million barrels at an average price of $118.19 per barrel, compared to 86.3 million barrels at an average price of $117.97 per barrel during the 2011 period.
Gross Margin—Non-GAAP gross margin totaled $1,316.4 million, or $10.36 per barrel of throughput, for the nine months ended September 30, 2012 compared to $1,036.8 million, or $12.02 per barrel of throughput during the nine months ended September 30, 2011, an increase of $279.6 million. Gross margin totaled $716.3 million, or $5.63 per barrel of throughput, for the nine months ended September 30, 2012 compared to $568.0 million, or $6.58 per barrel of throughput, for the nine months ended September 30, 2011, an increase of $148.3 million. The increase in non-GAAP gross margin and gross margin was primarily due to a full nine months of operations at the Toledo and Delaware City refineries in 2012.
Average industry refining margins in the Midcontinent were generally stronger during the nine month period ended September 30, 2012 as compared to the same period in 2011. The WTI (Chicago) 4-3-1 industry crack spread was approximately $1.87 per barrel or 7.1% higher in the nine month period ended September 30, 2012 as compared to the same period in 2011. During the nine month period ended September 30, 2012, we believe the strong industry refining margins and crude oil price differentials reflect limitations on takeaway capacity of WTI crude stored at Cushing, Oklahoma and the increase in domestically available supply which depressed the price of WTI versus Dated Brent and other crudes. The WTI-Syncrude differential improved by $12.43 per barrel during the nine month period ended September 30, 2012 compared to the same period in 2011. As the WTI-Syncrude premium increases, it has a positive impact on our Toledo refinery’s gross margin because Syncrude represents a significant portion of its crude slate.
While the Dated Brent (NYH) 2-1-1 industry crack spread was approximately $4.17 per barrel, or 40.2%, higher in the nine month period ended September 30, 2012 as compared to the same period in 2011, the Dated Brent/Maya differential was approximately $4.35 per barrel, or approximately 29.2%, lower in 2012 than in 2011. A reduction in the Dated Brent/Maya crude differential, our proxy for the light/heavy crude differential, has a negative impact on Paulsboro and Delaware City as both refineries process a large slate of medium and heavy, sour crude oil that is priced at a discount to light, sweet crude oil.
The decrease in our non-GAAP gross margin per barrel to $10.36 per barrel for the nine months ended September 30, 2012 from $12.02 per barrel during the same period in 2011 was primarily driven by an unfavorable increase in the landed cost of crude at our East Coast refineries due to the narrowing of the light/heavy crude differential, partially offset by improved crack spreads and lower cost of crude at our Toledo refinery. The impact of the narrowing of the light/heavy crude differential on the results of our Paulsboro and Delaware City refineries was compounded by their significant production of low value products such as sulfur, petroleum coke and fuel oils as these products price at a substantial discount to light products. As a result, we were not able to fully benefit from the increase in gasoline and distillates prices during the nine month period.
71
Table of Contents
Operating Expenses—Operating expenses totaled $537.9 million, or $4.23 per barrel of throughput, for the nine months ended September 30, 2012 compared to $457.7 million, or $5.31 per barrel of throughput, for the nine months ended September 30, 2011, an increase of $80.2 million, or 17.5%. The increase in operating expenses primarily relates to having Toledo for a full nine months in the 2012 period versus seven months in 2011, and the restart of the Delaware City refinery. During the 2011 period, our Delaware City refinery was undergoing a turnaround and reconfiguration. It was fully operational during the nine months ended September 30, 2012. The decrease in operating expenses per barrel of throughput is mainly attributable to a reduction in energy and utilities costs, primarily driven by lower natural gas prices, and the increase in throughput barrels. Our operating expenses principally consist of salaries and employee benefits, maintenance, energy and catalyst and chemicals costs.
General and Administrative Expenses—General and administrative expenses totaled $78.0 million for the nine months ended September 30, 2012 compared to $71.5 million for the nine months ended September 30, 2011, an increase of $6.5 million or 9%. The increase in general and administrative expenses primarily relates to higher information technology expenses for the implementation of accounting and commercial software recorded in 2012. Our general and administrative expenses are comprised of the personnel, facilities and other infrastructure costs necessary to support our refineries.
Acquisition-related Expenses—Acquisition-related expenses for the nine months ended September 30, 2011 were $0.7 million and related to our acquisition of Toledo.
Depreciation and Amortization Expense—Depreciation and amortization expense totaled $67.4 million for the nine months ended September 30, 2012 compared to $35.6 million for the nine months ended September 30, 2011, an increase of $31.8 million. The increase was principally due to the acquisition of Toledo in March 2011, commencement of depreciation in July 2011 related to the restart of Delaware City, and capital expenditure and turnaround activity.
Change in Fair Value of Catalyst Leases—Change in the fair value of catalyst leases represented a loss of $6.9 million for the nine months ended September 30, 2012 compared to a gain of $4.8 million for the nine months ended September 30, 2011. This gain or loss relates to the change in value of the precious metals underlying the sale and leaseback of our refineries’ precious metals catalyst, which we are obligated to repurchase at fair market value at the lease termination dates.
Change in Fair Value of Contingent Consideration—Change in the fair value of contingent consideration was an expense of $2.1 million for the nine months ended September 30, 2012, compared to $4.8 million for the 2011 period. This change represents the increase in the estimated fair value of the total contingent consideration we expect to pay in connection with our acquisition of the Toledo refinery.
Interest (Expense) Income—Interest expense totaled $86.7 million for the nine months ended September 30, 2012 compared to $44.1 million for the nine months ended September 30, 2011, an increase of $42.6 million. Interest expense includes interest on long-term debt, costs related to the sale and leaseback of our precious metals catalyst, interest expense incurred in connection with our crude and feedstock supply agreements with Statoil and MSCG, letter of credit fees associated with the purchase of certain crude oils, and the amortization of deferred financing fees. The increase in interest expense primarily relates to an increase in overall debt associated with the issuance of senior secured notes in February 2012 and precious metals catalyst leases for the Toledo and Delaware City refineries, interest expense associated with the Statoil agreement related to the Delaware City restart and the write off of $4.4 million in deferred financing costs on debt that was repaid from the proceeds of our senior secured notes offering.
2011 Compared to 2010
Overview—Net income was $242.7 million for the year ended December 31, 2011 compared to a net loss of $44.4 million for the year ended December 31, 2010. During most of 2010, we were a development stage
72
Table of Contents
company focused on the acquisition of oil refineries and other downstream assets in North America and activities to turnaround, reconfigure and re-start our Delaware City refinery. Our net loss in 2010 was related to those activities, plus the results of operations of our Paulsboro refinery for the period from December 17, 2010 to December 31, 2010. Our 2011 net income primarily reflects a full year’s operation of our Paulsboro refinery, the results of our Toledo refinery, which we acquired on March 1, 2011, and the results of our Delaware City refinery, which we began re-starting in June 2011 and which was fully operational in October 2011.
Revenues—Revenues totaled $15.0 billion for the year ended December 31, 2011 compared to $210.7 million in the year ended December 31, 2010. The revenue increase was primarily due to the operations of our Paulsboro and Toledo refineries, and the commencement of refining operations at our Delaware City refinery, which became operational in October 2011. The total throughput rate and barrels sold rate at our Paulsboro refinery averaged 151,400 bpd and 151,700 bpd, respectively, during the year ended December 31, 2011. The total throughput rate and barrels sold rate at our Toledo refinery averaged 151,400 bpd and 160,800 bpd, respectively, during the period from March 1, 2011 to December 31, 2011. We began re-starting our Delaware City refinery during June 2011 and it became operational in October 2011. Its throughput rate and barrels sold rate averaged approximately 126,600 bpd and 116,200 bpd, respectively, for the period from June 2011 through December 31, 2011. Our 2010 revenues were primarily related to consulting services that we provided to third parties, minor terminaling operations at our Delaware City refinery beginning June 1, 2010, and revenue from our Paulsboro refinery from December 17, 2010 to December 31, 2010. During this period, the refinery had an average throughput rate of approximately 143,800 bpd.
Gross Margin—Non-GAAP gross margin totaled $1,105.2 million, or $8.59 per barrel of throughput, for the year ended December 31, 2011 compared to $6.7 million, or $3.05 per barrel of throughput for the year ended December 31, 2010, an increase of $1,098.5 million. Gross margin totaled $418.0 million, or $3.25 per barrel of throughput, for the year ended December 31, 2011 compared to a loss of $4.9 million, or $2.27 per barrel of throughput, for the year ended December 31, 2010, an increase of $422.9 million. The increase in non-GAAP gross margin and gross margin in 2011 was due to the acquisition of the Toledo refinery, a full year of operations at the Paulsboro refinery, and the re-start of the Delaware City refinery during the year. Additionally, the increase in non-GAAP gross margin and gross margin was also driven by strong margins for most of the products we produce and wider crude oil price differentials.
Average industry refining margins and crude oil price differentials were stronger in 2011 as compared to 2010. The WTI (Chicago) 4-3-1 industry crack spread was approximately 169.1% higher in 2011 compared to 2010. The Dated Brent/WTI differential and Dated Brent/Maya differentials were $16.17 per barrel and $3.36 per barrel higher, respectively, in 2011 than in 2010. In 2011, we believe these industry refining margins and crude oil price differentials were impacted by supply limitations of WTI crude stored at Cushing, Oklahoma which depressed the price of WTI. In addition, the demand for crude oil increased which, in turn, increased prices for non-WTI crude worldwide. As a result, the differential between light and heavy barrels widened. A strong Dated Brent/WTI crude differential has a significant positive impact on Toledo’s gross margin because its primary feedstock is mainly WTI and WTI based light, sweet crude oil. A wide Dated Brent/Maya crude differential, our proxy for the light/heavy differential, has a positive impact on Paulsboro and Delaware City as both refineries process a large slate of medium and heavy, sour crude oil that is priced at a discount to light, sweet crude oil.
Demand for transportation fuels has generally been higher in the spring and summer months than during the fall and winter months. As a result, we expect our operating results for the second and third quarters will generally be higher than for the first and fourth quarters.
Operating Expenses—Operating expenses totaled $658.8 million, or $5.12 per barrel of throughput, for the year ended December 31, 2011 compared to $25.1 million for the year ended December 31, 2010, an increase of $633.7 million. Our operating expenses principally consist of salaries and employee benefits, maintenance, energy and catalyst and chemicals. Operating expenses for 2011 include our Paulsboro refinery for the entire year and our Toledo refinery from March 1, 2011 through December 31, 2011. During 2011, our Delaware City
73
Table of Contents
refinery was undergoing a turnaround and reconfiguration and we began re-starting the refinery in June 2011. It was fully operational in October 2011. During 2010, our operating expenses included expenses associated with the Delaware City turnaround and reconfiguration projects, minor terminaling operations, and the operating expenses of our Paulsboro refinery from December 17, 2010 to December 31, 2010. Our consolidated operating expense per barrel of $5.12 for the year ended December 31, 2011 may not be indicative of our future performance, primarily because it included the operating expenses of Delaware City prior to the period we began re-starting the refinery and during the re-start period which began in June 2011.
General and Administrative Expenses—General and administrative expenses totaled $86.2 million for the year ended December 31, 2011 compared to $15.9 million for the year ended December 31, 2010, an increase of $70.3 million or 443.4%. The increase is primarily attributable to increased personnel, facilities and other infrastructure costs necessary to support our three operating oil refineries in 2011. During 2010, we were primarily focused on completing the acquisitions of our three refineries and starting the process of building out our infrastructure to support our transition from a development stage company to an operating entity.
Acquisition-related Expenses—Acquisition-related expenses totaled $0.7 million for the year ended December 31, 2011 compared to $6.1 million for the year ended December 31, 2010, a decrease of $5.4 million or 88.0%. Acquisition related expense in 2010 represented consulting and legal expenses related to the Paulsboro and Toledo acquisitions and other pending or non-consummated acquisitions. In addition, we capitalized $4.3 million in acquisition related costs associated with our acquisition of the Delaware City assets. Our acquisition related expenses in 2011 were primarily related to Toledo.
Depreciation and Amortization Expense—Depreciation and amortization expense totaled $53.7 million for the year ended December 31, 2011 compared to $1.4 million for the year ended December 31, 2010, an increase of $52.3 million. The increase was principally due to a year of Paulsboro activity, the acquisition of Toledo in March 2011, commencement of depreciation in July 2011 related to the beginning of re-start activity for Delaware City, and capital expenditure activity. In the comparable period in 2010, depreciation expense related primarily to our Paulsboro refinery for the period from December 17, 2010 to December 31, 2010.
Change in Fair Value of Catalyst Leases—Change in the fair value of catalyst leases represented a gain of $7.3 million for the year ended December 31, 2011 compared to a loss of $1.2 million for the year ended December 31, 2010. This gain or loss relates to the change in value of the precious metals underlying the sale leaseback of the Delaware City refinery and Toledo refinery precious metals catalyst, which we are obligated to repurchase at fair market value at the lease termination date.
Change in Fair Value of Contingent Consideration—Change in the fair value of contingent consideration was $5.2 million for the year ended December 31, 2011, compared to zero in 2010. This change represents the increase in the estimated fair value of the contingent consideration we expect to pay in connection with our acquisition of the Toledo refinery.
Interest (Expense) Income—Interest expense totaled $65.1 million for the year ended December 31, 2011 compared to $1.4 million for the year ended December 31, 2010. We incurred long-term debt in connection with our acquisitions of Delaware City, Paulsboro and Toledo, giving rise to interest expense. We also incurred interest expense in connection with our crude and feedstock supply agreements with Statoil and MSCG and letter of credit fees associated with the purchase of certain crude oils.
2010 Compared to 2009
Overview—Our net loss was $44.4 million in 2010 compared to a net loss of $6.1 million in 2009, an increase of $38.3 million or 627.9%. During 2009 and throughout most of 2010, we were a development stage company focused on the acquisition of oil refineries and downstream assets in North America. Our net loss in 2009 related to costs associated with those activities. In 2010, our net loss results from acquisition activities,
74
Table of Contents
terminal operations and non-capitalizable maintenance activities at our Delaware City refinery, which we acquired on June 1, 2010, and the operating results of our Paulsboro refinery, which we acquired on December 17, 2010.
Revenues—Revenues totaled $210.7 million in 2010 compared to $0.2 million in 2009, an increase of $210.5 million. The increase was principally due to $4.8 million in terminal revenues at our Delaware City refinery for the period from June 1, 2010 to December 31, 2010 and $205.9 million in revenue at our Paulsboro refinery for the period from December 17, 2010 to December 31, 2010. Total throughput averaged 143,800 bpd at Paulsboro from December 17, 2010 to December 31, 2010. Our revenue in 2009 related primarily to consulting services that we provided to third parties.
Gross Margin—Non-GAAP gross margin totaled $6.7 million in 2010 and $0.2 million in 2009. Gross margin was a loss of $4.9 million in 2010 and $0.2 million in 2009. Our non-GAAP gross margin and gross margin in 2009 related to consulting activities. In 2010, we reported non-GAAP gross margin of $4.8 million related to our terminal operations at our Delaware City refinery for the period from June 1, 2010 to December 31, 2010 and $1.9 million in non-GAAP gross margin for our Paulsboro refinery for the period from December 17, 2010 to December 31, 2010. Non-GAAP gross margin and gross margin at our Paulsboro refinery for December 17, 2010 through December 31, 2010 totaled $0.88 and a loss of $4.49 per barrel of crude oil throughput, respectively.
Operating Expenses—Operating expenses totaled $25.1 million in 2010 compared to zero in 2009. We did not incur any operating expenses in 2009 as we were a development stage company without any operations. We began to incur operating expenses concurrent with our acquisition of Delaware City in June 2010, where we reported $14.1 million in operating expenses related to terminal operations and non-capitalizable maintenance expenses incurred while the refinery was undergoing a major turnaround and reconfiguration project. Operating expenses at our Paulsboro refinery for December 17, 2010 through December 31, 2010 totaled $11.0 million, or $5.01 per barrel of crude oil throughput.
General and Administrative Expenses—General and administrative expenses totaled $15.9 million in 2010 compared to $6.3 million in 2009, an increase of $9.6 million or 152.0%. The increase is principally attributable to increased personnel, facilities and other infrastructure costs as we began to build-out our back office administrative functions to support our acquisitions.
Acquisition-related Expenses—Acquisition-related expenses totaled $6.1 million in 2010 compared to zero in 2009. Acquisition-related expenses in 2010 represented consulting and legal expenses related to the Paulsboro and Toledo acquisitions and other pending or non-consummated acquisitions.
Depreciation and Amortization Expense—Depreciation and amortization expense totaled $1.4 million in 2010 compared to $44 thousand in 2009, an increase of $1.4 million. This increase was principally due to our commencing operations in 2010 following the acquisitions of Delaware City and Paulsboro. In 2009, we had de minimis depreciable assets.
Change in Fair Value of Catalyst Lease Obligation—Change in the fair value of catalyst lease totaled $1.2 million in 2010 compared to zero in 2009. This charge relates to the change in value of the precious metals underlying the sale leaseback of the Delaware City precious metals catalyst, which we are obligated to repurchase at fair market value at the lease termination date.
Interest Income (Expense)—Interest expense totaled $1.4 million in 2010 compared to $10 thousand of interest income in 2009. We incurred long-term debt in 2010 in connection with our acquisitions of Delaware City and Paulsboro, giving rise to interest expense. In 2009, we had no long-term debt.
75
Table of Contents
Paulsboro Refining Business—PBF LLC’s Predecessor
| Year Ended December 31, 2009 |
Period from January 1, 2010 through December 16, 2010 |
|||||||
| (in thousands) | ||||||||
| Operating revenues |
$ | 3,549,517 | $ | 4,708,989 | ||||
| Cost of sales, excluding depreciation |
3,419,460 | 4,487,825 | ||||||
|
|
|
|
|
|||||
| Non-GAAP gross margin(1) |
130,057 | 221,164 | ||||||
| Operating expenses, excluding depreciation |
266,319 | 259,768 | ||||||
| General and administrative expenses |
15,594 | 14,606 | ||||||
| Asset impairment loss |
8,478 | 895,642 | ||||||
| Depreciation and amortization expense |
65,103 | 66,361 | ||||||
|
|
|
|
|
|||||
| Operating income (loss) |
(225,437 | ) | (1,015,213 | ) | ||||
| Interest and other income, net |
1,249 | 500 | ||||||
|
|
|
|
|
|||||
| Income (loss) before income tax expense (benefit) |
(224,188 | ) | (1,014,713 | ) | ||||
| Income tax expense (benefit) |
(86,586 | ) | (322,962 | ) | ||||
|
|
|
|
|
|||||
| Net income (loss) |
$ | (137,602 | ) | $ | (691,751 | ) | ||
|
|
|
|
|
|||||
| Gross margin |
$ | (188,362 | ) | $ | (90,704 | ) | ||
| (1) | Non-GAAP gross margin is defined as gross margin excluding direct operating expenses and depreciation expense related to the refineries. We believe non-GAAP gross margin is an important measure of operating performance and provides useful information to investors because it is a better metric comparison for the industry refining margin benchmarks, as the refining margin benchmark do not contemplate a charge for operating expenses and depreciation expense. In order to assess our operating performance, we compare our non-GAAP gross margin (revenue less cost of sales) to industry refining margin benchmarks and crude oil prices as defined in the table below. |
| Non-GAAP gross margin should not be considered an alternative to gross margin, operating income, net cash flows from operating activities or any other measure of financial performance or liquidity presented in accordance with GAAP. Non-GAAP gross margin presented by other companies may not be comparable to our presentation, since each company may define this term differently. The following table presents a reconciliation of non-GAAP gross margin to the most directly comparable GAAP financial measure, gross margin, on a historical basis, as applicable, for each of the periods indicated: |
| Year Ended December 31, 2009 |
Period from January 1, 2010 through December 16, 2010 |
|||||||
| (in thousands) | ||||||||
| Reconciliation of gross margin to Non-GAAP gross margin: |
||||||||
| Gross margin |
$ | (188,362 | ) | $ | (90,704 | ) | ||
| Add: |
||||||||
| Refinery operating expenses |
266,319 | 259,768 | ||||||
| Refinery depreciation expense |
52,100 | 52,100 | ||||||
|
|
|
|
|
|||||
| Non-GAAP gross margin |
$ | 130,057 | $ | 221,164 | ||||
|
|
|
|
|
|||||
76
Table of Contents
| Year Ended December 31, 2009 |
Period from January 1, 2010 through December 16, 2010 |
|||||||
| Market Indicators(a) |
||||||||
| (dollars per barrel, except as noted) |
||||||||
| Dated Brent crude oil |
$ | 61.67 | $ | 79.01 | ||||
| West Texas Intermediate (WTI) crude oil |
$ | 61.92 | $ | 79.01 | ||||
| Crack Spreads |
||||||||
| Dated Brent (NYH) 2-1-1 |
$ | 8.24 | $ | 9.40 | ||||
| WTI (Chicago) 4-3-1 |
$ | 8.62 | $ | 8.92 | ||||
| Crude Oil Differentials |
||||||||
| Dated Brent (foreign) less WTI |
$ | (0.25 | ) | $ | 0.00 | |||
| Dated Brent less Maya (heavy, sour) |
$ | 5.00 | $ | 9.20 | ||||
| Dated Brent less WTS (sour) |
$ | 1.27 | $ | 2.13 | ||||
| Dated Brent less ASCI (sour) |
$ | 1.26 | $ | 1.59 | ||||
| WTI less WCS (heavy, sour) |
$ | 7.65 | $ | 13.61 | ||||
| WTI less Bakken (light, sweet) |
N/A | $ | 3.13 | |||||
| WTI less Syncrude (light, sweet) |
$ | (1.61 | ) | $ | (0.17 | ) | ||
| Natural gas (dollars per MMBTU) |
$ | 4.16 | $ | 4.39 | ||||
| Key Operating Information |
||||||||
| Production (barrels per day in thousands) |
147.0 | 153.0 | ||||||
| Crude oil and feedstocks throughput (barrels per day in thousands) |
148.6 | 154.0 | ||||||
| Total crude oil and feedstocks throughput (millions of barrels) |
54.2 | 53.9 | ||||||
| (a) | As reported by Platts. |
Paulsboro Refining Business—PBF LLC’s Predecessor
Period from January 1, 2010 through December 16, 2010 Compared to 2009
Overview—Net loss was $691.8 million in the period from January 1, 2010 through December 16, 2010 compared to a net loss of $137.6 million in 2009, an increase of $554.2 million or 402.8%. The net loss in 2010 was driven primarily by the $895.6 million impairment charge discussed below. Excluding the charge, the pretax loss would have been $119.1 million as compared to a reported pretax loss of $1.0 billion in 2010. The operating losses in both periods resulted from narrow margins on refined products and high operating costs to maintain the refinery.
Operating Revenues—Operating revenues totaled $4.7 billion in the 2010 period compared to $3.5 billion in 2009, an increase of $1.2 billion or 34.3%. The increase was principally due to an increase in average finished product prices. The spot prices of conventional gasoline and diesel increased approximately 27% over the period, while throughput increased 3.6%. Total throughput averaged 154,000 bpd over the 2010 period compared to 148,600 bpd in 2009.
Cost of Sales—Cost of sales totaled $4.5 billion in the 2010 period compared to $3.4 billion in 2009, an increase of $1.1 billion or 32.4%. The increase was principally due to a rise in average crude prices. The Dated Brent crude average price increased 28% from period to period, while throughput increased 3.6%. Non-GAAP gross margin per barrel averaged $4.10 in 2010 versus $2.40 per barrel in 2009 and gross margin per barrel averaged a loss of $1.68 in 2010 versus a loss of $3.48 per barrel in 2009.
Expenses—Operating expenses totaled $259.8 million, or $4.82 per barrel of throughput, in the 2010 period compared to $266.3 million, or $4.91 per barrel of throughput, in 2009, a decrease of $6.5 million or 2.4%. General and administrative expenses totaled $14.6 million in the 2010 period compared to $15.6 million in 2009, a decrease of $1.0 million or 6.4%. The decreases were principally due to there being 14 fewer days in 2010 as compared to a full year of 2009.
77
Table of Contents
Asset Impairment Loss—Asset impairment loss totaled $895.6 million in the 2010 period compared to $8.5 million in 2009, an increase of $887.1 million. The impairment loss in 2010 is due to the write-down of assets to their fair value in connection with the sale of the refinery to PBF. The impairment loss in 2009 related to capital projects in progress that were permanently cancelled in light of deteriorating economic conditions.
Depreciation and Amortization Expense—Depreciation and amortization expense totaled $66.4 million in the 2010 period compared to $65.1 million in 2009, an increase of $1.3 million or 2.0%. This increase was principally due to a slight increase in capital expenditures in 2010 following the decline in spending in 2009.
Interest and Other Income and Expense—Interest and other income totaled $0.5 million in the 2010 period compared to $1.2 million in 2009, a decrease of $0.7 million or 58.3%. The decrease is mainly attributable to the reversal of tax related accruals that were reversed upon expiration of the statutory audit period in 2010.
Income Tax Expense (Benefit)—Income tax benefit totaled $323.0 million in the 2010 period compared to income tax benefit of $86.6 million in 2009, an increase of $236.4 million or 273.0%. The increase was primarily due to the larger pre-tax loss in 2010 as compared to 2009.
Liquidity and Capital Resources
Overview
Our primary source of liquidity is our cash flows from operations and borrowing availability under our credit facilities, as more fully described below. We believe that our cash flows from operations and available capital resources will be sufficient to meet our capital expenditure, working capital, including payment of the Toledo refinery contingent consideration, and debt service requirements for the next twelve months. However, our ability to generate sufficient cash flow from operations depends, in part, on oil market pricing and general economic, political and other factors beyond our control. We believe we could, during periods of economic downturn, access the capital markets and/or other available financial resources or reduce our capital and discretionary expenditure plans to strengthen our financial position.
Cash Flow Analysis—PBF LLC
Cash Flows from Operating Activities
Net cash provided by operating activities was $468.8 million for the nine months ended September 30, 2012 compared to net cash provided by operating activities of $467.6 million for the nine months ended September 30, 2011. During the 2011 period, our cash flows reflect only seven months of operations of our Toledo refinery, which was acquired on March 1, 2011, and limited operations at our Delaware City refinery, which was not fully operational until October 2011. Our operating cash flows for the nine months ended September 30, 2012 included our net income of $539.8 million, plus net non-cash charges relating to depreciation and amortization of $71.1 million, pension and other post retirement benefits of $9.5 million, changes in the fair value of our catalyst lease and Toledo contingent consideration obligations of $9.0 million, change in the fair value of our inventory repurchase obligations of $5.1 million, the write-off of unamortized deferred financing fees related to retired debt of $4.4 million and stock-based compensation of $1.7 million, partially offset by a gain on asset sales of $2.4 million. In addition, net changes in working capital used $169.4 million in cash driven by increases in hydrocarbon purchases and sales volumes and their associated impact on inventory, accounts receivable, and hydrocarbon-related liabilities. Our operating cash flows for the nine months ended September 30, 2011 included our net income of $427.2 million, plus net non-cash charges relating to depreciation and amortization of $37.8 million, pension and other post retirement benefits of $7.2 million, change in the fair value of the Toledo contingent consideration of $4.8 million and stock-based compensation of $1.9 million, partially offset by change in the fair value of our inventory repurchase obligations of $4.9 million, changes in the fair value of our catalyst lease obligations of $4.8 million, and net cash used in working capital of $1.6 million.
78
Table of Contents
Net cash provided by operating activities was $249.3 million for the year ended December 31, 2011 compared to net cash used in operating activities of $1.2 million for the year ended December 31, 2010. During 2011, our operations were comprised primarily of a full year of operations of our Paulsboro refinery, ten months of operations of our Toledo refinery, which was acquired on March 1, 2011, and activities to turnaround, reconfigure and re-start our Delaware City refinery. We began re-starting our Delaware City refinery in June 2011 and it was fully operational in October 2011. During most of 2010, we were a development stage company focused on the acquisition of oil refineries and other downstream assets in North America and activities to turnaround, reconfigure and re-start our Delaware City refinery. Our cash flow in 2010 was related to those activities, plus the results of operations of our Paulsboro refinery for the period from December 17, 2010 to December 31, 2010. Our operating cash flows for the year ended December 31, 2011 included our net income of $242.7 million, plus net non-cash charges relating to depreciation and amortization of $56.9 million, stock-based compensation of $2.5 million, pension and other post retirement benefit costs of $9.8 million, an increase in the fair value of our inventory repurchase obligations of $25.3 million, an increase in the fair value of the contingent consideration liability for our Toledo refinery of $5.2 million, less a decrease in the fair value of our catalyst lease obligations of $7.3 million. In addition, net working capital changes used $85.8 million in cash, primarily related to the acquisition of our Toledo refinery. During 2010, our net loss of $44.4 million was partially offset by non-cash charges totaling $7.4 million and net cash from working capital of $35.8 million.
Net cash used in operating activities was $1.2 million for the year ended December 31, 2010 as compared to the net cash flows used in operating activities of $5.8 million for the year ended December 31, 2009. During 2010, our operating cash flows were comprised of our net loss of $44.4 million, which was partially offset by net cash provided by working capital of $35.8 million, as well as non-cash charges relating to depreciation and amortization of $1.5 million, stock based compensation expense of $2.3 million and the $1.2 million change in the fair value of our catalyst lease obligation, the $2.0 million change in the value of inventory repurchase obligations and other changes totaling $0.4 million. During 2009, our net loss of $6.1 million was primarily offset by the net impact of a non-cash charge relating to pension and other post retirement benefits and working capital changes of $0.3 million.
Cash Flows from Investing Activities
Net cash used in investing activities was $133.9 million for the nine months ended September 30, 2012 compared to net cash used in investing activities of $690.7 million for the nine months ended September 30, 2011. The net cash flows used in investing activities in the 2012 period were comprised of capital expenditures totaling $102.0 million, expenditures for turnarounds of $27.5 million, primarily at our Toledo refinery, and expenditures for other assets of $7.7 million, partially offset by $3.3 million in proceeds from the sale of assets. Net cash used in investing activities for the nine months ended September 30, 2011 consisted primarily of the acquisition of the Toledo refinery of $168.2 million, capital expenditures totaling $447.0 million, primarily related to the reconfiguration and re-start of our Delaware City refinery, expenditures for a turnaround at our Paulsboro refinery of $57.0 million and expenditures for other assets of $23.2 million slightly offset by $4.7 million in proceeds from the sale of assets.
Net cash used in investing activities was $739.2 million for the year ended December 31, 2011 compared to net cash used in investing activities of $501.3 million for the year ended December 31, 2010. The net cash flows used in investing activities in 2011 were comprised of the acquisition of the Toledo refinery of $168.2 million, capital expenditures totaling $488.7 million related to the reconfiguration and re-start of our Delaware City refinery, expenditures for turnarounds, primarily at our Paulsboro refinery, of $62.8 million and expenditures for other assets of $23.3 million, partially offset by $4.7 million in proceeds from the sale of assets, and $0.8 million for other investing activities. Net cash used in investing activities for the year ended December 31, 2010 were comprised of cash paid for the acquisition of Delaware City for $224.3 million, cash paid for the acquisition of the Paulsboro refinery of $204.9 million, $69.1 million in expenditures primarily for the reconfiguration and re-start of the Delaware City refinery, and $3.0 million for other capital expenditures.
Net cash used in investing activities was $501.3 million for the year ended December 31, 2010 as compared to the net cash flows used in investing activities of $0.1 million for the year ended December 31, 2009. The cash
79
Table of Contents
flows used in investing activities in 2010 reflect the acquisition of the Paulsboro refinery and pipeline and Delaware City refinery and pipeline assets totaling $204.9 million and $224.3 million, respectively. In addition, $69.1 million was expended during 2010 relating to the reconfiguration of the Delaware City refinery in order to bring it back into working condition with improved reliability and efficiency. In 2010, $3.0 million was used for other capital expenditures while, in 2009, $0.1 million was used for other capital expenditures.
Cash Flows from Financing Activities
Net cash used in financing activities was $215.1 million for the nine months ended September 30, 2012 compared to net cash provided by financing activities of $292.3 million for the nine months ended September 30, 2011. For the 2012 period, net cash used in financing activities consisted primarily of repayments of $484.6 million of long-term debt, net repayments on the ABL credit facility of $270.0 million, a contingent consideration payment related to the Toledo acquisition of $103.6 million, cash distributions to members of PBF LLC of $15.1 million and $17.3 million in deferred financing costs, partially offset by net proceeds from the senior secured notes offering of $665.8 million, proceeds of $9.5 million from the Paulsboro catalyst lease and proceeds of $0.2 million from stock options. For the nine months ended September 30, 2011, cash provided by financing activities consisted primarily of capital contributions from PBF LLC of $408.4 million, proceeds from the issuance of long-term debt of $343.7 million and proceeds from catalyst leases of $18.6 million, partially offset by principal repayments of $299.6 million on a seller note for inventory, repayments of long-term debt of $169.3 million and $9.5 million for deferred financing and other costs.
Net cash provided by financing activities was $384.6 million for the year ended December 31, 2011 compared to $639.2 million for the year ended December 31, 2010. For 2011, net financing cash flows were comprised of capital contributions from PBF LLC of $408.4 million; net borrowings on our ABL Revolving Credit Facility of $270.0 million, which was used primarily to repay our $299.6 million seller note for Toledo inventory; proceeds totaling $18.9 million for Delaware City construction financing which was used to fund a portion of that refinery’s turnaround and re-start activity; proceeds of $18.6 million for the sale and leaseback of Toledo’s precious metals catalyst which was used to partially repay $18.3 million of the Toledo Promissory Note; other principal repayments totaling $2.2 million; and payments of $11.2 million for deferred financing costs. Net cash provided by financing activities was $639.2 million for the year ended December 31, 2010. Cash provided by financing activities consisted of capital contributions of $483.1 million; proceeds from the Delaware Economic Development Authority Loan in connection with the Delaware City acquisition of $20.0 million; proceeds from the Delaware City catalyst sale and leaseback of $17.7 million; proceeds from a term loan of $125.0 million; less the payment of deferred financing fees totaling $6.6 million.
Net cash provided by financing activities was $639.2 million for the year ended December 31, 2010 as compared to $8 thousand used for the year ended December 31, 2009. In 2010, net cash provided by financing was comprised of contributions totaling $483.1 million from PBF LLC; proceeds from an interest free loan in connection with the Delaware City acquisition of $20.0 million; proceeds from the Delaware City catalyst sale and leaseback of $17.7 million; proceeds from the $125.0 million Term Loan Credit Agreement with UBS AG, Stamford Branch, as administrative and collateral agent and certain other lenders, or the Term Loan Facility; less the payment of deferred financing fees totaling $6.6 million.
Cash Flows Analysis of Paulsboro Refining Business—PBF LLC’s Predecessor
Cash Flows from Operating Activities
Net cash used in operating activities was $33.7 million for the period from January 1, 2010 to December 16, 2010 as compared to the net cash used in operating activities of $61.9 million for the year ended December 31, 2009. During the 2010 period, Paulsboro’s operating cash flows were comprised of its net loss of $691.8 million, adjusted for non-cash charges (benefits) related to depreciation and amortization expense of $66.4 million, an asset impairment loss of $895.6 million and a deferred tax benefit of ($283.5) million and cash used in working capital and other changes of $20.5 million. During 2009, net cash used in operating activities was comprised of
80
Table of Contents
Paulsboro’s net loss of $137.6 million, adjusted for depreciation and amortization expense of $65.1 million, asset impairment loss of $8.5 million and deferred tax expense of $13.8 million and cash used in working capital and other changes of $11.7 million.
Cash Flows from Investing Activities
Net cash used in investing activities was $42.4 million for the period from January 1, 2010 to December 16, 2010 as compared to the net cash flows used in investing activities of $116.0 million for the year ended December 31, 2009. The cash flows used in investing activities in the 2010 period reflect capital expenditures of $20.1 million, deferred turnaround and catalyst costs of $17.0 million and other investing activities, net of $5.2 million. For the year ended December 31, 2009, cash flows used in investing activities included capital expenditures of $96.8 million and deferred turnaround and catalyst costs of $19.3 million.
Cash Flows from Financing Activities
Net cash provided by financing activities was $76.1 million for the period from January 1, 2010 to December 16, 2010 as compared to the net cash flows provided by financing activities of $178.0 million for the year ended December 31, 2009. In both periods, cash provided by financing activities represented net cash advances from Paulsboro’s parent, Valero.
Senior Secured Notes Offering
On February 9, 2012, PBF Holding completed the senior secured notes offering. The net proceeds from the offering of approximately $665.8 million were used to repay our Paulsboro Promissory Note in the amount of $150.6 million, our Term Loan Facility in the amount of $123.8 million, our Toledo Promissory Note in the amount of $181.7 million, and to reduce indebtedness under the ABL Revolving Credit Facility. As a result of the senior secured notes offering, and the repayment of our Delaware City construction financing on August 31, 2012, with the exception of our catalyst leases, we have no long-term debt maturing before 2020. Our Executive Chairman of the Board of Directors, and certain of our other executives, purchased $25.5 million aggregate principal amount of the senior secured notes. The senior secured notes were offered pursuant to exemptions under the Securities Act, and have not been registered under the Securities Act or the securities laws of any other jurisdiction and may not be offered or sold in the United States absent registration or an applicable exemption from the registration requirements of the Securities Act.
Credit Facilities
ABL Revolving Credit Facility
On May 31, 2011, we amended our ABL Revolving Credit Facility with UBS AG, Stamford Branch, as administrative agent and co-collateral agent and certain other lenders to increase its size to $500.0 million by including certain inventory and accounts receivable of the Toledo refinery in the borrowing base. A portion of the proceeds of the ABL Revolving Credit Facility was used on the closing date thereof to repay in full all amounts then outstanding under and to terminate the Products and Intermediates Inventory Promissory Note, dated as of March 1, 2011, in an aggregate principal amount equal to $299.6 million, issued by Toledo Refining in favor of Sunoco. In March, August, and September 2012, we amended the ABL Revolving Credit Facility again to increase the aggregate size to $965.0 million. The ABL Revolving Credit Facility was amended and restated on October 26, 2012 to increase the maximum availability to $1.375 billion, extend the maturity date to October 26, 2017, and amend the borrowing base to include non-U.S. inventory. The amended and restated ABL Revolving Credit facility includes an accordion feature which allows for commitments of up to $1.8 billion. On an ongoing basis, the ABL Revolving Credit Facility is available to PBF Holding and its subsidiaries for working capital and other general corporate purposes.
The ABL Revolving Credit Facility contains customary covenants and restrictions on the activities of PBF Holding and its subsidiaries, including, but not limited to, limitations on the incurrence of additional indebtedness;
81
Table of Contents
liens, negative pledges, guarantees, investments, loans, asset sales, mergers, acquisitions and prepayment of other debt; distributions, dividends and the repurchase of capital stock; transactions with affiliates; the ability to change the nature of our business or our fiscal year; the ability to amend the terms of the senior secured notes facility documents; and sale and leaseback transactions. As of September 30, 2012, we were in compliance with these covenants.
The ABL Revolving Credit Facility currently provides for revolving loans of up to an aggregate of $965.0 million, a portion of which is available in the form of letters of credit. The amount available for borrowings and letters of credit under the ABL Revolving Credit Facility is calculated according to a “borrowing base” formula based on (1) 90% of the book value of eligible accounts receivable with respect to investment grade obligors plus (2) 85% of the book value of eligible accounts receivable with respect to non-investment grade obligors plus (3) 80% of the cost of eligible hydrocarbon inventory plus (4) 100% of cash and cash equivalents in deposit accounts subject to a control agreement. The borrowing base is subject to customary reserves and eligibility criteria and in any event cannot exceed $965.0 million. As of September 30, 2012, there were no outstanding borrowings under the ABL Revolving Credit Facility. Additionally, we had $36.0 million in standby letters of credit issued and outstanding as of that date.
All obligations under the ABL Revolving Credit Facility are guaranteed (solely on a limited recourse basis to the extent required to support the lien described in clause (y) below by PBF LLC, PBF Finance Corporation, or PBF Finance, and each of our domestic operating subsidiaries and secured by a lien on (y) PBF LLC’s equity interests in PBF Holding and (z) substantially all of the assets of the borrowers and the subsidiary guarantors (subject to certain exceptions). The lien of the ABL Revolving Credit Facility lenders ranks first in priority with respect to the following: all deposit accounts (other than zero balance accounts, cash collateral accounts, trust accounts and/or payroll accounts, all of which are excluded from the collateral); all accounts receivables; all hydrocarbon inventory (other than the Saudi crude oil pledged under the letter of credit facility); to the extent evidencing, governing, securing or otherwise related to the foregoing, all general intangibles, chattel paper, instruments, documents, letter of credit rights and supporting obligations; and all products and proceeds of the foregoing, collectively, the Revolving Loan Priority Collateral. As a result of the payment in full of the Term Loan Facility, the Paulsboro Promissory Note and the Toledo Promissory Note with the net cash proceeds of the senior secured notes offering in February 2012, the ABL Revolving Credit Facility is now secured solely by the Revolving Loan Priority Collateral and the lien on the other assets previously part of the ABL Revolving Credit Facility collateral was released.
Letter of Credit Facility
PBF Holding, Paulsboro Refining and Delaware City Refining are party to a letter of credit facility with BNP Paribas (Suisse) SA, or BNP, consisting of (1) a committed portion of the facility in which BNP and other committed participants agreed to provide a committed letter of credit facility of up to $500.0 million, or the Maximum Committed L/C Facility Amount, and (2) an uncommitted portion of the facility of up to $250.0 million, or the Maximum Uncommitted L/C Facility Amount, and together with the Maximum Committed L/C Facility Amount, the L/C Facility, under which letters of credit are issued from time to time at the request of and on behalf of PBF Holding in favor of Saudi Arabian Oil Company, or the Beneficiary, in connection with a crude oil sales agreement between PBF Holding and Beneficiary for the purchase of Saudi crude oil. As of September 30, 2012, there were $248.2 million standby letters of credit issued under the letter of credit facility.
The validity period for each letter of credit is limited to 45 days. Each letter of credit will be issued in either United States Dollars or Euros, at our option. The letter of credit facility contains covenants and restrictions on PBF Holding’s and Paulsboro Refining’s activities, including, but not limited to, limitations on their main business purpose; modifications to purchase contracts; and affirmative obligations to notify BNP of certain material events. As of September 30, 2012, we were in compliance with these covenants. The letter of credit facility matures on April 23, 2013. As a result of the increased size of the amended and restated ABL Revolving Credit Facility, we expect to terminate the letter of credit facility prior to its maturity.
An unused commitment fee payable under the letter of credit facility is equal to 0.375% per annum on the unused portion of the Maximum Committed L/C Facility Amount. Such unused commitment fee is due and
82
Table of Contents
payable on a quarterly basis in arrears. Each letter of credit that is issued is subject to an issuance commission of 1.50% per annum calculated on the maximum amount of such letter of credit issued. Such issuance commission is due and payable on a monthly basis in arrears and shall accrue from the date of issuance of each letter of credit until the earlier of its expiration date and the date of BNP’s disbursement thereunder (but in any event, such commission shall not be less than the amount that would be due if the letter of credit were outstanding for a period of not less than 30 days). Additionally, letters of credit are subject to certain other customary charges of BNP for amendments and/or extensions and confirmation fees.
The letter of credit facility is secured by a lien on and security interest in PBF Holding’s, Paulsboro Refining’s and Delaware City Refining’s right, title and interest in and to the Saudi crude oil, receivables arising from the sale or other disposition of Saudi crude oil, all contracts, bills of lading and other documents of title pertaining to the foregoing and all proceeds and products of each of the foregoing and all accessions to, substitutions, and replacements for, and rents, profits and products of each of the foregoing, all of which collateral is excluded from the Revolving Loan Priority Collateral.
Cash Balances
As of September 30, 2012, our cash and cash equivalents totaled $170.0 million. We also had $12.1 million in restricted cash, which was included within deferred charges and other assets, net on our balance sheet. The restricted cash represents a trust fund we acquired in connection with the Paulsboro refinery acquisition and represents the estimated cost of environmental remediation obligations assumed.
Liquidity
As of September 30, 2012, our total liquidity, which is the sum of our cash and cash equivalents plus the amount of availability under the ABL Revolving Credit Facility, totaled approximately $665.1 million.
Working Capital
Working capital at September 30, 2012 was $640.4 million, consisting of $2,172.4 million in total current assets and $1,532.0 million in total current liabilities. Working capital at December 31, 2011 was $286.4 million, consisting of $1,946.5 million in total current assets and $1,660.1 million in total current liabilities. Our working capital for financial reporting purposes is significantly impacted by the way we account for our crude and feedstock and product offtake agreements as more fully described below.
Crude and Feedstock Supply Agreements
We acquire crude oil for our Paulsboro and Delaware City refineries under supply agreements whereby Statoil generally purchases the crude oil requirements for each refinery on our behalf and under our direction. Our agreement with Statoil for Paulsboro will terminate effective March 31, 2013, at which time we plan to source Paulsboro’s crude oil and feedstocks internally. Our agreement with Statoil for Delaware City has been extended by Statoil through December 31, 2015 and we have recently entered into certain amendments to that agreement that are effective through the extended term. Statoil generally provides transportation and logistics services, risk management services and holds title to the crude oil until we purchase it as it enters the refinery process units. For our purchases of Saudi crude oil, we post letters of credit and arrange for shipment. We pay for the crude when we are invoiced and the letter of credit is lifted. Under the Statoil agreements, the amount of crude oil we own and the time we are exposed to market fluctuations is substantially reduced. Under generally accepted accounting principles we record the inventory owned by Statoil on our behalf as inventory with a corresponding accrued liability on our balance sheet because we have risk of loss while the Statoil inventory is in our storage tanks and because we have an obligation to repurchase Statoil’s inventory upon termination of the agreements at the then market value.
83
Table of Contents
We have a similar agreement with MSCG to supply the crude oil requirements for our Toledo refinery. Under the Toledo agreement, for the period from March 1, 2011 through May 31, 2011, MSCG held title to the crude oil until we purchased it as it entered the refinery process units. Beginning June 1, 2011, under a new agreement we take title to MSCG’s crude oil at the out-of-state pipeline delivery locations. Payment for the crude oil under the Toledo agreement is due three days after it is processed by us or sold to third parties. We do not have to post letters of credit for these purchases and the Toledo agreement allows us to price and pay for our crude oil as it is processed, which reduces the time we are exposed to market fluctuations. We record an accrued liability at each period-end for the amount we owe MSCG for the crude oil that we own but have not processed. The accrued liability is based on the period-end market value, as it represents our best estimate of what we will pay for the crude oil. The MSCG agreement for Toledo expires June 30, 2013, subject to automatic renewal and termination rights.
In connection with the crude and feedstock supply agreements for our Paulsboro and Delaware City refineries, Statoil also purchases the refineries’ production of certain feedstocks or purchases feedstocks from third parties on the refineries’ behalf. Legal title to the feedstocks is held by Statoil and stored in the refineries’ storage tanks until they are needed for further use in the refining process. At that time, the feedstocks are drawn out of the storage tanks and purchased by the refineries. These purchases and sales are netted at cost and reported within cost of sales. The feedstock inventory owned by Statoil remains on our balance sheet with a corresponding accrued liability.
At September 30, 2012, the LIFO value of crude oil and feedstocks owned by Statoil included within inventory on our balance sheet was $363.7 million. The corresponding accrued liability for such crude oil and feedstocks was $393.5 million at that date.
Product Offtake Agreements
Our Paulsboro and Delaware City refineries sell their light finished products, certain intermediates and lube base oils to MSCG under a products offtake agreement. Legal title transfers to MSCG as the products leave the process units and enter the refinery storage facilities. On a daily basis MSCG, under a payment direction agreement, pays the purchase price of certain finished products directly to Statoil, the counterparty to our crude oil and feedstocks supply agreement, effectively netting our liability for crude and feedstock purchases. The payment direction agreement for Paulsboro will terminate effective March 31, 2013. Any shortfall or overage in the netting process is trued up between us and Statoil. Under generally accepted accounting principles, we defer the revenue on finished product sales and retain the inventory owned by MSCG on our balance sheet until MSCG ships the products out of our refinery storage facilities, which typically occurs within an average of six days.
In addition, MSCG purchases the daily production of certain intermediates and lube products. When needed for additional blending or sales to third parties, the Paulsboro and Delaware City refineries repurchase the intermediates or lubes from MSCG. These purchases and sales occur at the daily market price for the related products and are netted in cost of sales at cost. The inventory of intermediates and lubes owned by MSCG remain in inventory on our balance sheet and the net cash receipts result in a liability that is recorded at market price for the volumes held in storage with any change in the market price being recorded in cost of sales. The MSCG agreements for Paulsboro and Delaware City will automatically renew for six month terms effective June 30, 2013, unless terminated with six months notice by either party (the first effective date of termination being no earlier than June 30, 2013 if notice is provided anytime prior to January 1, 2013). We are currently considering providing such notice of termination.
At September 30, 2012, the LIFO value of light finished products, intermediates and lubes owned by MSCG included within inventory on our balance sheet was $397.4 million. The corresponding deferred revenue for light finished products and accrued liability for intermediates and lubes was $201.9 million and $291.5 million, respectively.
84
Table of Contents
Pro Forma Contractual Obligations and Commitments
The following table summarizes our material contractual pro forma payment obligations as of December 31, 2011, after giving effect to the senior secured notes offering and the application of the net proceeds therefrom, as if they had occurred on that date.
| Payments due by period | ||||||||||||||||||||
| Total | Less than 1 year |
1-3 Years |
3-5 Years | More than 5 years |
||||||||||||||||
| (in thousands) | ||||||||||||||||||||
| Long-term debt(a) |
$ | 812,660 | $ | 2,765 | $ | 37,740 | $ | 96,655 | $ | 675,500 | ||||||||||
| Interest payments on debt facilities(a) |
490,674 | 40,242 | 132,585 | 122,797 | 195,050 | |||||||||||||||
| Delaware Economic Development Authority Loan(b) |
— | — | — | — | — | |||||||||||||||
| Operating leases(c) |
54,640 | 17,341 | 18,617 | 11,621 | 7,061 | |||||||||||||||
| Purchase obligations(d): |
||||||||||||||||||||
| Crude Supply and Offtake Agreements |
641,588 | 641,588 | — | — | — | |||||||||||||||
| Other Supply and Capacity Agreements |
515,255 | 39,483 | 88,026 | 88,452 | 299,294 | |||||||||||||||
| Delaware City construction obligations |
5,909 | 5,909 | — | — | — | |||||||||||||||
| Refinery contingent consideration(e) |
125,000 | 103,643 | 21,357 | — | — | |||||||||||||||
| Environmental obligations(f) |
18,202 | 2,915 | 3,530 | 1,920 | 9,837 | |||||||||||||||
| Pension and post-retirement obligations(g) |
53,020 | 338 | 4,154 | 7,320 | 41,208 | |||||||||||||||
|
|
|
|
|
|
|
|
|
|
|
|||||||||||
| Total contractual cash obligations |
$ | 2,716,948 | $ | 854,224 | $ | 306,009 | $ | 328,765 | $ | 1,227,950 | ||||||||||
|
|
|
|
|
|
|
|
|
|
|
|||||||||||
| (a) | Long-term Debt and Interest Payments on Debt Facilities |
Long-term obligations represent (i) the repayment of any indebtedness incurred in connection with the senior secured notes offering; (ii) the repayment of our catalyst lease obligations on their maturity dates; (iii) repayment of our Delaware City construction loan; and (iv) repayment of the pro forma balance of our ABL Revolving Credit Facility in the amount of $87.7 million.
Interest payments on debt facilities include pro forma cash interest payments on the senior secured notes, catalyst lease obligations, the Delaware City construction loan, ABL Revolving Credit Facility, plus cash payments for the commitment fee on the unused ABL Revolving Credit Facility and letter of credit fees on the letters of credit outstanding at December 31, 2011.
| (b) | Delaware Economic Development Authority Loan |
The Delaware Economic Development Authority Loan converts to a grant in tranches of $4.0 million annually, starting at the one year anniversary of the Delaware City refinery’s “certified re-start date” provided we meet certain criteria, all as defined in the loan agreement. We expect that we will meet the requirements to convert the loan to a grant and that we will ultimately not be required to repay the $20.0 million loan. Our Delaware Economic Development Authority Loan is further explained at Note 8 to our financial statements for the years ended December 31, 2011, 2010 and 2009, included elsewhere in this prospectus.
| (c) | Operating Leases |
We enter into operating leases in the normal course of business, some of these leases provide us with the option to renew the lease or purchase the leased item. Future operating lease obligations would change if we chose to exercise renewal options and if we enter into additional operating lease agreements. Certain of our lease obligations contain a fixed and variable component. The table above reflects the fixed component of our lease obligations. The variable component could be significant. Our operating lease obligations are further explained at the Commitments and Contingencies footnote to our financial statements, included elsewhere in this prospectus.
85
Table of Contents
During 2012, we entered into agreements to lease approximately 2,400 crude railcars that will be utilized to transport crude by rail to our Delaware City refinery. The leases will commence as the railcars are delivered. Railcar deliveries are expected to begin in the first quarter of 2013.
| (d) | Purchase Obligations |
We have obligations to repurchase crude oil, feedstocks, certain intermediates and lube oils under various crude supply and product offtake agreements with MSCG and Statoil as further explained at the Summary of Significant Accounting Policies, Inventories and Accrued Expenses footnotes to our financial statements, included elsewhere in this prospectus.
Payments under Other Supply and Capacity Agreements include contracts for the supply of hydrogen, steam, or natural gas to certain of our refineries, contracts for the treatment of wastewater, and contracts for pipeline capacity. We enter into these contracts to ensure an adequate supply of energy or essential services to support our refinery operations. Substantially all of these obligations are based on fixed prices. Certain agreements include fixed or minimum volume requirements, while others are based on our actual usage. The amounts included in this table are based on fixed or minimum quantities to be purchased and the fixed or estimated costs based on market conditions as of December 31, 2011.
| (e) | Refinery Contingent Consideration |
In connection with the Toledo acquisition, the seller will be paid an amount equal to 25% of the amount by which the purchased assets’ EBITDA exceeds $125.0 million in a given calendar year through 2016. The purchased assets’ EBITDA is calculated using calendar year earnings we have earned solely from the purchase of Toledo including reasonable direct and allocated overhead expenses, not to exceed a fixed amount in any calendar year, less interest expense, income tax expense and depreciation and amortization expense as well as any significant extraordinary or non-recurring expenses, such as an asset impairment loss and any fees or expenses incurred by us in connection with the Toledo acquisition. We paid $103.6 million in April 2012 to Sunoco related to the amount of contingent consideration earned in 2011. The aggregate amount of all payments to be made shall not exceed $125.0 million.
| (f) | Environmental Obligations |
In connection with the Paulsboro acquisition, we assumed certain environmental remediation obligations to address existing soil and groundwater contamination at the site and acquired a trust fund established to meet the state’s related financial assurance requirement, recorded as a liability in the amount of $12.1 million which reflects the present value of the current estimated cost of the remediation obligations assumed based on investigative work to-date. The undiscounted estimated costs related to these environmental remediation obligations were $18.2 million as of December 31, 2011.
In connection with the acquisition of the Delaware City assets, the prior owners remain responsible, subject to certain limitations, for certain pre-acquisition environmental obligations, including ongoing soil and groundwater remediation at the site.
In connection with the Delaware City assets and Paulsboro refinery acquisitions, we, along with the seller, purchased two individual ten year, $75.0 million environmental insurance policies to insure against unknown environmental liabilities at each site.
In connection with the acquisition of Toledo, the seller initially retains, subject to certain limitations, remediation obligations which will transition to us over a 20-year period.
In connection with the acquisition of all three of our refineries, we assumed certain environmental obligations under regulatory orders unique to each site, including orders regulating air emissions from each facility.
86
Table of Contents
| (g) | Pension and Post-retirement Obligations |
Pension and post-retirement obligations include only those amounts we expect to pay out in benefit payments and are further explained at the Employee Benefit Plans footnote to our financial statements, included elsewhere in this prospectus.
Off-Balance Sheet Arrangements
We have no off-balance sheet arrangements as of September 30, 2012, other than outstanding letters of credit in the amount of approximately $284.2 million.
Quantitative and Qualitative Disclosures about Market Risk
We are exposed to market risks, including changes in commodity prices and interest rates. Our primary commodity price risk is associated with the difference between the prices we sell our refined products and the prices we pay for crude oil and other feedstocks. We may use derivative instruments to manage the risks from changes in the prices of crude oil and refined products, interest rates, or to capture market opportunities.
Commodity Price Risk
In order to realize value from our processing capacity, we must achieve a positive spread between the cost of raw materials and the value of finished products (i.e., refinery gross product margin or crack spread). The physical commodities that comprise our raw materials and finished goods are typically bought and sold at a spot or index price that can be highly variable.
The prices of crude oil, refined products and other commodities are subject to fluctuations in response to changes in supply, demand, market uncertainty and a variety of additional factors that are beyond our control. The crude and feedstock supply agreements for our Paulsboro and Delaware City refineries allow us to take title to and price our crude oil at locations in close proximity to our refineries, as opposed to the crude oil origination point, reducing the time we are exposed to market fluctuations before the finished refined products are sold. Our offtake agreements with MSCG for our Paulsboro and Delaware City refineries allow us to sell our light finished products and certain intermediates and lube base oils as they are produced.
We carry inventories of crude oil, intermediates and refined products (“hydrocarbon inventories”) on our balance sheet, the values of which are subject to fluctuations in market prices. Our hydrocarbon inventories totaled approximately 14.6 million barrels at December 31, 2011 and 14.4 million barrels at September 30, 2012. The average cost of our hydrocarbon inventories was approximately $101.93 and $100.75 per barrel on a LIFO basis at December 31, 2011 and September 30, 2012, respectively. If market prices decline to a level below the average cost, we may be required to write down the carrying value of our hydrocarbon inventories to market.
Our predominant variable operating cost is energy, which is comprised primarily of natural gas and electricity. We are therefore sensitive to movements in natural gas prices. Assuming normal operating conditions, we annually consume a total of approximately 37 million MMBTUs of natural gas amongst our three refineries. Accordingly, a $1.00 per MMBTU change in natural gas prices would increase or decrease our natural gas costs by approximately $37 million.
We periodically use non-trading derivative instruments to manage exposure to commodity price risks associated with the purchase or sale of crude oil, finished products and natural gas to fuel our refinery operations. We may also use non-trading derivative instruments to manage price risks associated with inventories above or below a baseline we set for our target levels of hydrocarbon inventories. We may engage in the purchase and sale of physical commodities, derivatives, options, over-the-counter products and various exchange-traded instruments. We mark-to-market our derivative instruments and recognize the changes in their fair value in our statements of operations.
87
Table of Contents
Interest Rate Risk
During 2012, we amended the terms of our ABL Revolving Credit Facility to increase the size of our asset-based revolving credit facility from $500.0 million to $1.375 billion. Borrowings under our ABL Revolving Credit Facility bear interest at the Adjusted LIBOR Rate plus 1.75% to 2.50%, depending on our debt rating. If this facility were fully drawn, a one percent change in the interest rate would increase or decrease our interest expense by $13.8 million annually.
We also have interest rate exposure in connection with our Statoil and MSCG crude oil and offtake agreements under which we pay a time value of money charge based on LIBOR.
Credit Risk
We are subject to risk of losses resulting from nonpayment or nonperformance by our customers. We will continue to closely monitor the creditworthiness of customers to whom we grant credit and establish credit limits in accordance with our credit policy.
Concentration Risk
MSCG and Sunoco accounted for 57% and 11%, respectively, of our total sales for the nine months ended September 30, 2012 and 52% and 12%, respectively, of our total sales for the year ended December 31, 2011. MSCG and Sunoco accounted for 19% and 18%, respectively, of total trade accounts receivable as of September 30, 2012. Sunoco and Statoil accounted for 19% and 11%, respectively, of total trade accounts receivable as of December 31, 2011.
Critical Accounting Policies
The following summary provides further information about our critical accounting policies that involve critical accounting estimates and should be read in conjunction with Note 2 to our financial statements, which summarizes our significant accounting policies.
Use of Estimates
The preparation of financial statements in accordance with GAAP requires management to make estimates and assumptions that affect the reported amounts of assets and liabilities, the disclosure of contingent assets and liabilities and the reported revenues and expenses. Actual results could differ from those estimates.
Revenue and Deferred Revenue
We sell various refined products and recognize revenue related to the sale of products when there is persuasive evidence of an agreement, the sales prices are fixed or determinable, collectability is reasonably assured and when products are shipped or delivered in accordance with their respective agreements. Revenue for services is recorded when the services have been provided.
Our Paulsboro and Delaware City refineries sell their light finished products, certain intermediates and lube base oils to MSCG under products offtake agreements. On a daily basis, MSCG purchases and pays for the refineries’ production of these products as they are produced, delivered to the refineries’ storage tanks and legal title passes to MSCG. The inventory associated with these sales remains on our balance sheet and the revenue is deferred until the products are shipped out of our storage facilities by MSCG, which typically occurs within an average of six days. As a result, gross margin on these product sales is deferred until shipment occurs.
Under the offtake agreements, our Paulsboro and Delaware City refineries also enter into purchase and sale transactions of certain of their intermediates and lube base oils whereby MSCG purchases and pays for the
88
Table of Contents
refineries’ production of certain intermediates and lube products as they are produced and legal title passes to MSCG. The intermediate products are held in the refineries’ storage tanks until they are needed for further use in the refining process. The refineries have the right to repurchase lube products and do so to supply other third parties with that product. When the refineries need intermediates or when they repurchase lube products, the products are drawn out of their storage tanks, title passes back to the refineries and MSCG is paid for those products. These transactions are considered to be made in contemplation of each other and, accordingly, do not result in the recognition of a sale when title passes from the refineries to the counterparty. Inventory remains at cost, valued on a LIFO basis and the net cash receipts result in a liability that is recorded at market price for the volumes held in storage with any change in the market price being recorded in costs of sales. The liability represents the amount we expect to pay to repurchase the volumes in storage.
Our Paulsboro and Delaware City refineries sell and purchase feedstocks under supply agreements primarily with Statoil. Statoil purchases the refineries’ production of certain feedstocks or purchases feedstocks from third parties on the refineries’ behalf. Legal title to the feedstocks is held by Statoil and the feedstocks are held in the refineries’ storage tanks until they are needed for further use in the refining process. At that time the feedstocks are drawn out of the storage tanks and purchased by us. These purchases and sales are settled monthly at the daily market prices related to those feedstocks. These transactions are considered to be made in the contemplation of each other and, accordingly, do not result in the recognition of a sale when title passes from the refineries to the counterparty. Inventory remains at cost and the net cash receipts result in a liability.
Inventory
Inventories are carried at the lower of cost or market. The cost of crude oil, feedstocks, blendstocks and refined products is determined under the LIFO method using the dollar value LIFO method with increments valued based on average cost during the year. The cost of supplies and other inventories is determined principally on the weighted average cost method.
Our Paulsboro and Delaware City refineries acquire substantially all of their crude oil from Statoil under our crude supply agreements whereby we take title to the crude oil as it is delivered to our processing units. We have risk of loss while the Statoil inventory is in our storage tanks. We are obligated to purchase all the crude oil held by Statoil on our behalf upon termination of the agreements. In addition, we are obligated to purchase a fixed volume of the Paulsboro feedstocks from Statoil when the arrangement is terminated. As a result of the purchase obligations, we record the inventory of crude oil and feedstocks in the refineries’ storage facilities. The purchase obligations contain derivatives that change in value based on changes in commodity prices. Such changes are included in our cost of sales. Our agreement with Statoil for Paulsboro will terminate effective March 31, 2013, at which time we plan to source crude oil and feedstocks internally.
For the period from March 1, 2011 through May 31, 2011, our Toledo refinery acquired substantially all of its crude oil from MSCG under a crude oil supply agreement whereby we took title to the crude oil as it was delivered to the refinery processing units. We had custody and risk of loss for MSCG’s crude oil stored on the refinery premises. As a result, we recorded the crude oil in the Toledo refinery’s storage facilities as inventory with a corresponding accrued liability. Effective June 1, 2011 we entered into a new supply agreement with MSCG under which we take legal title to the crude oil at out-of-state pipeline delivery locations. We record an accrued liability at each period-end for the amount we owe MSCG for the crude oil that we own but have not processed. The accrued liability is based on the period-end market value, as it represents our best estimate of what we will pay for the crude oil.
Environmental Matters
Liabilities for future clean-up costs are recorded when environmental assessments and/or clean-up efforts are probable and the costs can be reasonably estimated. Other than for assessments, the timing and magnitude of these accruals generally are based on the completion of investigations or other studies or a commitment to a formal plan
89
Table of Contents
of action. Environmental liabilities are based on best estimates of probable future costs using currently available technology and applying current regulations, as well as our own internal environmental policies. The actual settlement of our liability for environmental matters could materially differ from our estimates due to a number of uncertainties such as the extent of contamination, changes in environmental laws and regulations, potential improvements in remediation technologies and the participation of other responsible parties.
Long-Lived Assets and Definite-Lived Intangibles
We review our long and finite lived assets for impairment whenever events or changes in circumstances indicate their carrying value may not be recoverable. Impairment is evaluated by comparing the carrying value of the long and finite lived assets to the estimated undiscounted future cash flows expected to result from the use of the assets and their ultimate disposition. If such analysis indicates that the carrying value of the long and finite lived assets is not considered to be recoverable, the carrying value is reduced to the fair value. There have been no impairment indicators and therefore, no impairment reviews were performed in the nine months ended September 30, 2012 and in the year ended December 31, 2011.
Impairment assessments inherently involve judgment as to assumptions about expected future cash flows and the impact of market conditions on those assumptions. Although management would utilize assumptions that it believes are reasonable, future events and changing market conditions may impact management’s assumptions, which could produce different results.
Indefinite-lived Assets
We consider precious metals catalyst and linefill to be indefinite-lived assets as they are not expected to deteriorate in their prescribed functions. These assets are not depreciated, but are assessed for impairment.
Deferred Maintenance
Refinery turnaround costs, which are incurred in connection with planned major maintenance activities at our refineries are capitalized when incurred and amortized on a straight-line basis over the period of time estimated until the next turnaround occurs (generally three to five years).
Derivative Instruments
We are exposed to market risk, primarily related to changes in commodity prices for the crude oil and feedstocks we use in the refining process as well as the prices of the refined products we sell. The accounting treatment for commodity contracts depends on the intended use of the particular contract and on whether or not the contract meets the definition of a derivative. Non-derivative contracts are recorded at the time of delivery.
All derivative instruments that are not designated as normal purchase or sales are recorded in our balance sheet as either assets or liabilities measured at their fair values. Changes in the fair value of derivative instruments that either are not designated or do not qualify for hedge accounting treatment or normal purchase or normal sale accounting are recognized in income. Contracts qualifying for the normal purchase and sales exemption are accounted for upon settlement. Prior to June 30, 2011 we did not apply hedge accounting to any of our derivative instruments. Effective July 1, 2011, we elected fair value hedge accounting for certain derivatives associated with our inventory repurchase obligations.
Derivative accounting is complex and requires management judgment in the following respects: identification of derivatives and embedded derivatives; determination of the fair value of derivatives; identification of hedge relationships; assessment and measurement of hedge ineffectiveness; and election and designation of the normal purchases and sales exception. All of these judgments, depending upon their timing and effect, can have a significant impact on earnings.
90
Table of Contents
Income Taxes
As PBF LLC is a limited liability company treated as a “flow-through” entity for income tax purposes, there is no benefit or provision for federal or state income tax in the accompanying financial statements.
Recent Accounting Pronouncements
There are no recently issued accounting pronouncements requiring adoption subsequent to September 30, 2012 that would have a significant impact on our results of operations or financial position.
91
Table of Contents
Introduction
Oil refining is the process of separating hydrocarbon molecules present in crude oil and converting them into marketable, finished petroleum products, such as diesel fuel, gasoline, home heating oil, lubricants and petrochemicals. Refining is primarily a margin-based business where both the feedstock (primarily crude oil) and refined petroleum products are commodities with fluctuating prices. Refiners create value by selling refined petroleum products at prices higher than the costs of acquiring crude oil and other feedstocks, and by managing operating costs. It is important for a refinery to maximize the yields of high value finished products and to minimize the costs of feedstock and operating expenses.
The United States has historically been the largest consumer of petroleum-based products in the world. According to the EIA’s 2012 Refinery Capacity Report, there were 134 operating oil refineries in the United States in January 2012, with a total refining capacity of approximately 16.7 million bpd and a weighted average Nelson Complexity Index of approximately 10.9. Of the total operating refining capacity in the United States, approximately 55.2%, or 9.2 million bpd, is currently owned and operated by independent refining companies, compared to 2002 when approximately 31.6%, or 5.1 million bpd, was owned by independent refining companies. The remaining capacity is controlled by integrated oil companies. Because of this trend, the refining industry increasingly must rely on its own operations for its profitability.
We believe our three refineries currently benefit from secular growth in North American crude production because of our ability to access lower cost WTI priced based crudes. According to a recent EIA publication, average United States crude oil production in 2013 is expected to grow by approximately 1.5 million bpd, to 6.9 million bpd from 5.4 million bpd in 2009, an increase of approximately 28%. This level of United States crude oil production would represent the highest level since 1993. In addition, CAPP projects that Canadian crude oil production will increase by 800,000 bpd, from 3.0 million bpd in 2011 to 3.8 million bpd in 2015. As a result of the recent and projected growth in North American crude production, the United States has reduced its reliance on imported crude. The EIA estimates that crude imported from foreign sources (crude from outside North America) since 2008 has declined by approximately 1.3 million bpd or 13.3%, to 8.5 million bpd as of September 30, 2012 and is forecasted to decline by an additional 500,000 bpd by 2013. With the addition of our crude rail unloading facilities at Delaware City and our investment in a crude railcar fleet, we expect our East Coast refineries to capitalize on the growth in both Canadian and United States crude oil production, while maintaining the flexibility to source waterborne crude.
Refining is an industry that historically has seasonal influences as a result of differentiated consumer demand for key refined products during certain months of the year. Most importantly, demand for gasoline is generally higher during the summer months than during the winter months due to seasonal increases in highway traffic and construction work. Decreased demand during the winter months can lower gasoline prices. Consequently, refining margins and profitability have historically generally been stronger in the second and third calendar quarters of each year relative to the first and fourth calendar quarters.
Refining Basics
Refineries are uniquely designed to process specific crude oils into selected products. In general, each of a refinery’s different process units performs one of three functions:
| • | separate through distillation the many types of hydrocarbons present in crude oil into a number of different components, ranging from light to heavy; |
| • | catalytically or thermally convert the separated hydrocarbons into more desirable products; and |
| • | treat the products by removing unwanted elements and compounds. |
Each function in the refining process is designed to maximize the value of the refined petroleum products produced. Below is a general description of refinery process units. Not all refineries possess each of these units.
92
Table of Contents
Distillation. Typically crude oil is initially processed at a refinery in the atmospheric and vacuum distillation units. Crude oil is separated by boiling point in the distillation units under high heat and low pressure and recovered as hydrocarbon fractions. The lowest boiling fractions, including gasoline and LPG, vaporize and exit the top part of the atmospheric distillation unit. Medium boiling liquids, including jet fuel, kerosene and distillates such as gasoil, heating oil and diesel fuel, are drawn from the middle of the distillation unit. Higher boiling liquids, such as fuel oils and the highest boiling liquids, called residuum, are drawn together from the bottom of the atmospheric distillation unit and separated further in the vacuum distillation unit. Vacuum residues can be used for fuel oil or bitumen production. The various fractions are then pumped to the next appropriate unit in the refinery for further processing into higher value products or are sent to storage tanks for sale to customers.
Conversion. The next step in the refining process is to convert the hydrocarbon fractions into distinct products. One of the ways of accomplishing this is through “cracking,” a process that breaks or cracks higher boiling fractions into more valuable products, such as gasoline, distillates and gasoil. The most important conversion units are the crude unit, the hydrocracker, the FCC unit and the coker. Thermal cracking is generally accomplished in the coker. The coker upgrades residuum into naphtha, distillate and gasoil and produces coke as a residual. Catalytic cracking is accomplished in the hydrocracker and/or FCC unit. Hydrocrackers receive feedstocks from cokers, FCCs and crude distillation units and convert lower value intermediate products into gasoline, naphtha, kerosene and distillates under very high pressure in the presence of hydrogen and a catalyst. The FCC unit converts gasoil and some residual from the crude distillation units into LPG, gasoline and distillates by applying heat in the presence of a catalyst. An FCC unit produces a higher percentage of gasoline, whereas a hydrocracker produces a higher percentage of diesel.
Reforming. The reformer converts naphtha, or low-octane gasoline fractions, into higher octane gasoline blendstocks, which are used to increase the overall octane level of the gasoline pool. The alkylation unit reduces the vapor pressure and enhances the octane of gasoline blendstocks produced by the FCC and coker units through the conversion of light olefins to heavier, high-octane paraffins.
Removal of Impurities. Lastly, the intermediate products from the distillation and conversion processes are treated to remove impurities, such as sulfur, nitrogen and heavy metals and are processed to enhance octane, reduce vapor pressure and to meet other product specifications. Treatment for sulfur, nitrogen and metals is most commonly accomplished in hydrotreating units by heating the intermediates under high pressure in the presence of hydrogen and catalysts.
Crude Oil
The quality of crude oil dictates the level of processing and conversion necessary to achieve the optimal mix of finished products. Crude oils are classified by their density (light to heavy) and sulfur content (sweet to sour).
Density. The less dense the crude, the lighter and thinner it is. Conversely, the more dense the crude, the heavier and thicker it is. Density is technically classified by the American Petroleum Institute in terms of “API degrees.” The higher the API degree, the lighter the crude oil. Light crude oils generally exceed 35° API, while heavy crude oils feature densities of 28° API or less. Crude oil varieties within the range of 28° API and 35° API are commonly known as medium crude oils.
Sulfur content. Crude is considered sweet, or low-sulfur, if its sulfur content is less than 1.0% and sour, or high-sulfur, if its sulfur content is 1.0% or more. The terms light, medium and heavy when used in reference to crude oils refer to their API gravity and the terms sweet and sour refer to their sulfur content. These terms are often used in conjunction with each other to describe the qualities of crude oil. Light sweet crude oils typically are more expensive than heavy, sour crude oils because they require less treatment and, therefore, lower operating costs to produce a slate of products with a greater percentage of higher value, light refined products. Heavy and sour crude oils produce a greater percentage of lower value products with simple distillation and require additional processing and higher operating costs to produce the higher value, light refined products. In
93
Table of Contents
seeking to maximize their refining margins, refiners strive to process the optimal mix or slate of crude oils through their refineries, depending on their refinery’s conversion and treating equipment, the desired product output and the relative price of available crude oils.
Industry Terminology
Crack Spreads
Crack spreads are a proxy for refining margins and refer to the margin that would be derived from the simultaneous purchase of crude oil and the sale of refined petroleum products, in each case at the then-prevailing price. The 2-1-1 crack spread assumes two barrels of crude oil will be converted, or “cracked,” into one barrel of gasoline and one barrel of heating oil or diesel fuel. Average 2-1-1 crack spreads vary from region to region throughout the United States, depending on the supply and demand balances of crude oils and refined products.
Actual refinery margins vary from benchmark crack spreads due to the actual crude oils used and products produced, transportation costs, regional differences and the timing of the purchase of the feedstock and sale of light products.
Benchmark Crudes
Oil prices and quality are usually stated by reference to certain benchmarks, including:
| • | WTI, the benchmark for North American crude oil, is lighter and sweeter than Brent. WTI typically has a gravity of approximately 38° to 40° API and sulfur content of approximately 0.3%. WTI is typically priced FOB Cushing, Oklahoma, which is a price settlement point for trades on the NYMEX. |
| • | Dated Brent is the price of all ready shipments of Brent blend, a light sweet North Sea crude oil. Brent blend has a gravity of approximately 38° API and sulfur content of approximately 0.4%. Most of the Brent blend is refined in northwest Europe, but significant volumes are also shipped to the United States and the Mediterranean region. Oil production from Europe, Africa and the Middle East flowing west tends to be priced off the Dated Brent benchmark. According to the Intercontinental Exchange, this benchmark is currently used for pricing two-thirds of the world’s internationally traded crude oil supplies. Brent blend has a rolling price assessment based on the physical Brent Forties Oseberg crude oil cargoes loading not less than ten days forward and loaded FOB at the named port of shipment. |
Light-Heavy Crude Differential
The light-heavy crude differential is the price differential between heavy (high density), sour (high sulfur) and light (low density), sweet (low sulfur) crude oils. In general, the heavier, sour crude blends trade at a discount to lighter, sweet crudes that are easier for refiners to process.
Product Differentials
Because refineries produce many other products that are not reflected in crack spreads, product differentials relative to the products reflected in the crack spreads are calculated to analyze a given refinery’s product mix advantage. Refineries that have an economic advantage are those that produce relatively high volumes of premium products, such as premium and reformulated gasoline, low-sulfur diesel fuel and jet fuel and relatively low volumes of lesser valued products, such as LPG, residual fuel oil, petroleum coke and sulfur.
Operating Costs
Major operating costs for refineries include employee labor, maintenance and energy. Employee labor and maintenance are relatively fixed costs that generally increase proportional to inflation. By far, the predominant variable cost is energy such as natural gas, electricity and refinery fuel gas.
94
Table of Contents
Refinery Products
The main refinery products, not all of which we produce, are as follows:
Petroleum Gases. Petroleum gases are the lightest products of the refining process, primarily consisting of methane, ethane, propane and butane. Their primary uses include heating and use as an intermediary in petrochemical manufacturing processes. Petroleum gases are often liquefied under pressure to create LPG, consisting primarily of propane and butane, for use as a fuel and an intermediate material in the petrochemical manufacturing process.
Petrochemicals. Many products derived from crude oil refining, such as ethylene, propylene, butylene, isobutylene, tetramer, nonene, toluene, xylene and benzene are primarily intended for use as petrochemical feedstocks in the production of plastics, synthetic fibers, synthetic rubbers and other products. A variety of petrochemicals are produced for use as solvents, including benzene, toluene and xylene.
Gasoline. One of the most significant refinery products is motor gasoline. Various gasoline blendstocks, including RBOB and CBOB, are blended to achieve specifications for regular and premium grades in both summer and winter gasoline formulations. Additives are often used to enhance performance and provide protection against oxidation and rust formation.
Naphtha. Naphtha is a low-octane gasoline product used as a feedstock by the chemicals industry and for catalytic reforming and the production of hydrogen.
Middle Distillates. Middle distillates are diesel fuels, heating oil and kerosene. Diesel fuels are used for on-road vehicles, construction equipment, locomotives and stationary and marine engines. Heating oil fuels are used for home heating, oil-fired heating plants and boilers. Kerosene is used for jet fuel, cooking, space heating, lighting and solvents and for blending into diesel fuel.
Fuel Oil. Fuel oils are petroleum products that are used as fuels for industrial and utility boilers.
Residual Fuels. Many marine vessels, power plants, commercial buildings and industrial facilities use residual fuels or combinations of residual and distillate fuels for heating and power generation. Bitumen, a low-value residual product, is used primarily for asphalt coating of roads and roofing materials.
Petroleum Coke. Petroleum coke, a co-product of the coking process, is almost pure carbon and has a variety of uses. Fuel-grade coke is used primarily by power plants as fuel for producing electricity. Premium grades of coke, low in sulfur and metal content, are used as anodes for the manufacture of aluminum.
Niche Refined Petroleum Products. Various refined petroleum products are produced in relatively small quantities such as lubricant base oils, biofuels and other refined petroleum products. These products are commonly used as blending components for transportation fuels or as lubricants.
Industry Characteristics
Refinery Complexity
Refinery complexity refers to an oil refinery’s ability to process feedstocks, such as heavier and higher sulfur content crude oils, into value-added products. Refinery complexity is commonly measured by the Nelson Complexity Index. The Nelson Complexity Index assigns a complexity factor to each major piece of refinery equipment based on its complexity and cost in comparison to crude distillation, which is assigned a complexity factor of 1.0. The complexity of each piece of refinery equipment is then calculated by multiplying its complexity factor by its throughput ratio as a percentage of crude distillation capacity. Adding up the complexity values assigned to each piece of equipment, including crude distillation, determines a refinery’s complexity on
95
Table of Contents
the Nelson Complexity Index. A refinery with a complexity of 10.0 on the Nelson Complexity Index is considered ten times more complex than crude distillation for the same amount of throughput. The average Nelson Complexity Index for refineries on the East Coast and in the Midcontinent is 9.3 and 10.1, respectively.
Refinery Locations
The location of an oil refinery has an important impact on its refining margin since the location influences its ability to access feedstocks and distribute its products efficiently. The location also dictates whether the feedstocks and products can be transported via sea tanker vessels, pipelines, rail or tank trucks. Refiners seek to maximize their profits by placing their products in the markets where they receive the highest margins. Due to their lower logistics costs, oil refineries located in coastal areas typically have a competitive advantage over oil refineries located inland in sourcing crude oil supplies. Nevertheless, certain inland refineries with niche market positions may also have significant competitive advantages. For example, refiners whose refineries and logistics systems are situated in areas of high petroleum consumption enjoy a competitive advantage over other suppliers in product distribution and in satisfying local demand. The map below shows the five regions in the U.S. (called Petroleum Administration for Defense Districts, or PADDs), which have historically experienced varying levels of refining profitability due to regional market conditions.
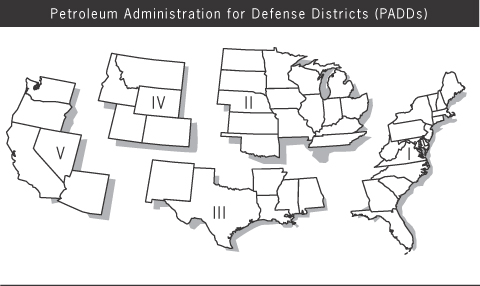
Our Delaware City and Paulsboro refineries are located within 30 miles of each other on the East Coast in PADD 1, and our Toledo refinery is located in the Northeastern portion of PADD 2.
Ownership of Refineries
Refineries typically are owned by either integrated oil companies or independent entities.
Integrated oil companies have upstream operations, which are concerned with the exploration and production of crude oil, combined with downstream activities, or refining, marketing and other operations; such as gas, petrochemicals, power and transportation operations.
An independent refiner has no source of proprietary crude oil production; it purchases its feedstocks on the open market under term or spot contracts.
96
Table of Contents
Refiners primarily distribute their products through either wholesale or retail channels. Oil refining companies that operate as wholesalers principally sell their refined petroleum products under term and spot contracts to their customers. Many refiners, both integrated and independent, distribute part of their refined products through retail outlets.
In recent years, integrated oil companies have sought to lower their exposure to the refining sector through divestments and rationalization of their refining portfolio. Of the total refining capacity in the United States, approximately 55.2% or 9.2 bpd, is currently owned and operated by independent refining companies compared to 2002 when approximately 31.6%, or 5.1 million bpd, was owned by independent refining companies. The remaining capacity is controlled by integrated oil companies. Because of this trend, the refining industry increasingly must rely on its own operations for its profitability. We believe this trend will continue.
Market Trends
United States Supply and Demand Dynamics. Petroleum refining is an industry that historically has seasonal influences as a result of differentiated consumer demand for key refined products during certain months of the year. Most importantly, demand for gasoline is generally higher during the summer months than during the winter months due to seasonal increases in highway traffic and construction work. Decreased demand during the winter months can lower gasoline prices. Consequently, refining margins and profitability have historically generally been stronger in the second and third calendar quarters of each year relative to the first and fourth calendar quarters.
Supply and demand dynamics can vary greatly by region, creating differentiated margin opportunities at any given time for refiners depending on the location of their facilities. The refined product volumes necessary to satisfy demand in excess of production in areas where we operate are sourced from refineries located outside of such areas, including the United States Gulf Coast.
97
Table of Contents
Our Toledo refinery is located in the Midcontinent (PADD 2) and our Delaware City and Paulsboro refineries are both located on the East Coast (PADD 1) where product demand exceeds refinery capacity. We expect that this demand/capacity imbalance may continue in PADD 1. For example, since 2009 16 refineries representing approximately 2.6 million bpd of refining capacity have been closed or idled in the Atlantic Basin (which includes PADD 1). This Atlantic Basin reduction has occurred across the United States, Europe and the Caribbean and directly affects our East Coast refineries because we compete with operating refineries in these markets. According to the EIA, total demand for refined products in the Midcontinent has represented approximately 25% of refined products demand in the United States for the past decade. Within the Midcontinent, refined product production capacity currently is insufficient to meet demand, so significant volumes are imported from other areas. The recent demand and capacity dynamic by PADD is outlined in the following chart:
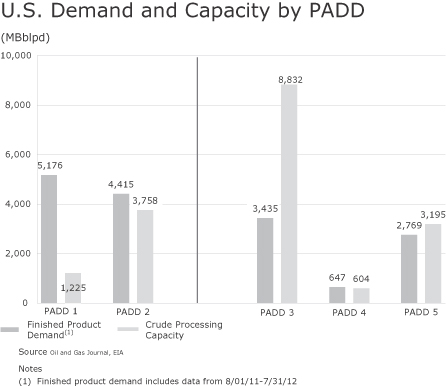
Increasing Demand for Products Meeting Tighter Specifications. We expect that products meeting new and evolving stricter fuel specifications could account for an increasing share of total fuel demand, which may benefit refiners that possess the capabilities to blend and process these fuels. Tightened petroleum product specifications and the increased role of renewable raw materials have resulted in increasing demand for new high-quality transportation fuels and other products, such as ULSD and biodiesel. Demand for low-sulfur products in the United States is expected to increase further as the mandatory maximum sulfur limit for certain distillates is lowered from the current limit of 50 PPM to 15 PPM.
98
Table of Contents
Natural Gas. Since 2010, natural gas prices in the United States have been lower than natural gas prices in Europe, giving refineries in the United States a cost advantage versus European refineries on energy-related operating expenses. The following chart depicts the price differential between natural gas at Henry Hub, a United States natural gas benchmark and distribution center, and ICE natural gas, a benchmark for natural gas in Northwest Europe.
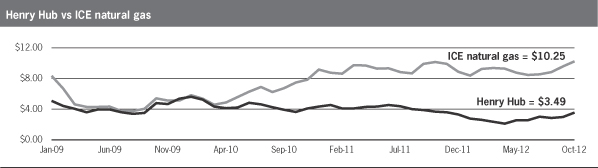
Refined Product Cracks. During the course of 2011, as the world-wide and domestic economic outlook and performance continued to recover from the credit crisis, the demand for refined products improved. This improvement, coupled with refining capacity rationalization, has led to a positive refining margin environment for the industry. The charts below show the Dated Brent (NYH) 2-1-1 spread, the benchmark crack spread for our Delaware City and Paulsboro refineries, and the WTI (Chicago) 4-3-1 spread, the benchmark crack spread for our Toledo refinery, over the last three-and-a-half-years.
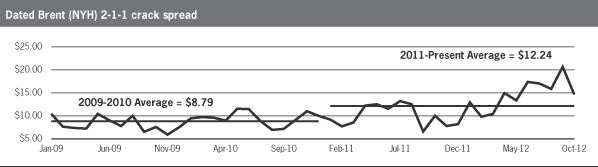
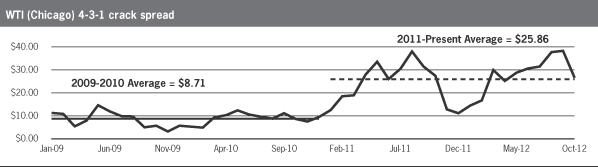
99
Table of Contents
Light-Heavy Differential Expansion. Recently the light-heavy differential has expanded. This differential expansion typically favors complex refiners, like our East Coast refineries, who are able to process the heavier crude varieties. As global economic demand for crude oil increases, the marginal barrel of crude oil produced is a heavier, more sour crude. The following two charts depict the price differentials between Dated Brent and Maya, and WTI and WCS over the last three-and-a-half-years.
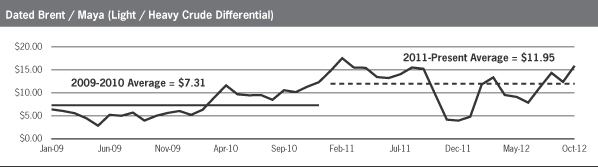
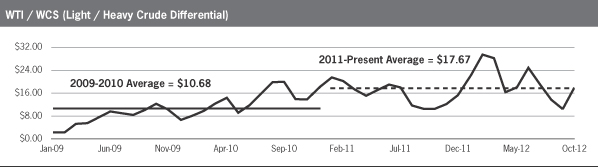
Dated Brent—WTI Differential Expansion. Historically, Dated Brent has traded at a slight discount to WTI domestically, due to its higher sulfur content and higher transportation costs. Recently, Dated Brent has traded at a significant premium to WTI. The primary driver of this recent phenomenon is increasing oil production from Western Canada and the United States leading to large inventories of WTI based crude oil being subject to logistics constraints in the Midcontinent, with the primary bottleneck occurring in Cushing, Oklahoma. The over-supply of WTI at Cushing has driven the price of WTI lower, while the price of Dated Brent has increased. The following chart shows the price differential between WTI and Dated Brent over the last three-and-a-half-years, a key determinant of margins at our Toledo refinery. We expect Dated Brent to continue to trade at a premium to WTI in the near term due to the growth in WTI based crude production and continued logistics constraints.
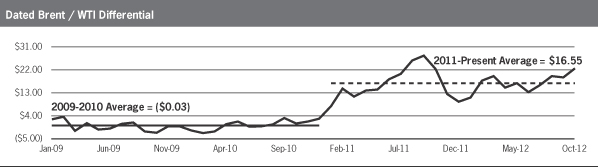
100
Table of Contents
Overview
We are one of the largest independent petroleum refiners and suppliers of unbranded transportation fuels, heating oil, petrochemical feedstocks, lubricants and other petroleum products in the United States. We were formed in 2008 to pursue acquisitions of crude oil refineries and downstream assets in North America. We currently own and operate three domestic oil refineries and related assets, which we acquired in 2010 and 2011. Our refineries have a combined processing capacity, known as throughput, of approximately 540,000 bpd.
| March 1, 2008 |
PBF was formed. | |
| June 1, 2010 |
The idle Delaware City refinery and its related assets were acquired from Valero for approximately $220.0 million. | |
| December 17, 2010 |
The Paulsboro refinery was acquired from Valero for approximately $357.7 million, excluding working capital. | |
| March 1, 2011 |
The Toledo refinery was acquired from Sunoco for approximately $400.0 million, excluding working capital. | |
| October 2011 |
Delaware City became operational. | |
Our three refineries are located in Toledo, Ohio, Delaware City, Delaware and Paulsboro, New Jersey. Our Midcontinent refinery at Toledo processes light, sweet crude, has a throughput capacity of 170,000 bpd and a Nelson Complexity Index of 9.2. The majority of Toledo’s WTI based crude is delivered via pipelines that originate in both Canada and the United States. Since our acquisition of Toledo in 2011, we have added additional truck and rail crude unloading capabilities that provide feedstock sourcing flexibility for the refinery and enables Toledo to run a more cost-advantaged crude slate. Our East Coast refineries at Delaware City and Paulsboro have a combined refining capacity of 370,000 bpd and Nelson Complexity Indices of 11.3 and 13.2, respectively. These high conversion refineries process primarily medium and heavy, sour crudes and have historically received the bulk of their feedstock via ships and barges on the Delaware River. Importantly, in May 2012 we commenced crude shipments via rail into a newly developed crude rail unloading facility at our Delaware City refinery. Currently, crude delivered to this facility is consumed at our Delaware City refinery. In the future we plan to transport some of the crude delivered by rail from Delaware City via barge to our Paulsboro refinery. The Delaware City rail unloading facility allows our East Coast refineries to source WTI based crudes from Western Canada and the Midcontinent, which provides significant cost advantages versus traditional Brent based international crudes. We are in the process of expanding the rail crude unloading capacity at Delaware City from 40,000 bpd to more than 110,000 bpd by early 2013 and have entered into agreements to lease approximately 2,400 crude railcars (comprised of approximately 1,600 coiled and insulated railcars that are capable of transporting Western Canadian bitumen without diluent and approximately 800 general purpose railcars) that are currently scheduled to be delivered through the second quarter of 2014 and which will be utilized to transport crude by rail to Delaware City.
Our Competitive Strengths
We believe that we have the following competitive strengths:
Strategically located refineries with cost and supply advantages. Our Midcontinent Toledo refinery advantageously sources a substantial portion of its WTI based crude slate from sources in Canada and throughout the Midcontinent. The balance of the crude oil is delivered by truck from local sources and by rail to a nearby terminal. Recent increases in production volumes of crudes from Western Canada and the Midcontinent combined with limitations on takeaway capacity in the Midcontinent, including at Cushing, Oklahoma where WTI is priced, have resulted in a price discount for WTI based crudes compared to Brent based crudes. We believe that our access to WTI based crudes at Toledo provides us with a cost advantage versus facilities that do not have similar access to such crudes and must process Brent based feedstocks.
101
Table of Contents
Our Delaware City and Paulsboro refineries have similar supply advantages given that they have the flexibility to source crudes from around the world via the Delaware River, and can source currently price advantaged WTI based crudes from Western Canada and the Midcontinent through our Delaware City crude rail unloading facility and through third party rail unloading terminals on the East Coast. The 2,400 crude railcars that we have entered into agreements to lease will enable us to transport this crude to each of our refineries. This transportation flexibility allows our East Coast refineries to process the most cost advantaged crude available.
Our three refineries currently have access to inexpensive natural gas, a primary component of a refinery’s operating costs. This access provides us with a competitive advantage versus other refineries, such as those located in Europe and the Caribbean, that are forced to purchase more expensive natural gas or run fuel oil in the refining process.
Future crude supply may emerge from other crude oil producing basins, including the development of the Utica Shale play (located in portions of the Appalachian Basin and Canada), which could potentially bring significant oil production online in regional proximity to all three of our refineries, providing an attractive feedstock source with low associated transportation cost.
Complex assets with a valuable product slate located in high-demand regions. Our refinery assets are located in regions where product demand exceeds refining capacity. Our refineries have a weighted average Nelson Complexity Index of 11.3, which allows us the flexibility to process a variety of crudes. Our East Coast refineries have the highest Nelson Complexity Indices on the East Coast, which allows them to process lower cost, heavier, more sour crude oils and giving us a cost advantage over other refineries in the same region. The complexity of our refining assets allows us to produce a higher percentage of more valuable light products. For example, our East Coast refineries produce a greater percentage of distillates versus gasoline than other East Coast refineries and have 100% of the East Coast’s heavy coking capacity. In addition, our Paulsboro refinery produces Group I base oils which are typically priced at a premium to both gasoline and distillates. Similarly, our Toledo refinery is a high conversion refinery with high gasoline and distillate yields and also produces high-value petrochemical products.
Significant scale and diversification. We currently operate three refineries with a combined crude throughput of 540,000 bpd making us the fifth largest independent refiner in the United States. Our refineries provide us diversification through crude slates, end products, customers and geographic locations. Our scale provides us buying power advantages, and we benefit from the cost efficiencies that result from operating three large refineries.
Recent capital investments and restructuring initiatives to improve financial returns. Since 2006, over $2.8 billion of capital has been invested in our three refineries to improve their operating performance, to meet environmental and regulatory standards, and to minimize the need for near-term capital expenditures. For example, since our acquisition of Delaware City, we have invested more than $500.0 million in turnaround and re-start projects that will improve the cost structure and profitability of the refinery, as well as in the recent strategic development of a crude rail unloading facility. In addition, we are spending approximately $57.0 million to expand and upgrade the rail unloading infrastructure that will allow us to discharge more than 110,000 bpd of cost advantaged, WTI based crudes for both our Delaware City and Paulsboro refineries by the first quarter of 2013. In conjunction with the re-start of Delaware City in 2011, we undertook a significant restructuring of the operations to improve its operating cost position, including reductions in labor costs compared to operations before shutdown by Valero, reductions in energy costs and reductions in other ongoing operating and maintenance expenses. Management estimates that the Delaware City restructuring has reduced the refinery’s annual operating expenses by over $200.0 million relative to pre-acquisition operating expense levels (without including the rail upgrades). We made significant operating improvements in the first year of operations by modifying the crude slate and product yield, changing operations of the conversion units and re-starting certain units.
Experienced management team with a demonstrated track record of acquiring, integrating and operating refining assets. Our management team is led by our Executive Chairman of the Board of Directors, Thomas
102
Table of Contents
D. O’Malley, who has more than 30 years experience in the refining industry and has led the acquisition of more than 20 refineries during his career. In addition, our executive management team, including our Chief Executive Officer, Thomas J. Nimbley, our President, Michael D. Gayda, and our head of Commercial Operations, Donald F. Lucey, has a proven track record of successfully operating refining assets. Our core management team has significant experience working together, including while at Tosco Corporation and Premcor. These executives have a long history of acquiring refineries at attractive prices and integrating these operations into a single, consolidated platform. For example, we believe we acquired the Paulsboro, Delaware City and Toledo refineries at or near the bottom of the refining cycle at a small fraction of replacement cost. These acquisitions were made at lower prices on a per barrel basis and significantly lower prices on a complexity barrel basis than other comparable acquisitions over the past five years.
Support from strong financial sponsors and management with a substantial investment. Our financial sponsors, Blackstone and First Reserve, have a long history of successful investments across the energy industry. Together, our financial sponsors and management have invested substantial equity in PBF LLC to date, with management investing over $23.5 million. In addition, Thomas D. O’Malley, our Executive Chairman of the Board of Directors, certain of his affiliates and family members, and certain of our other executives, purchased $25.5 million aggregate principal amount of senior secured notes in the notes offering.
Our Business Strategy
Our primary goal is to create stockholder value by improving our market position as one of the largest independent refiners and suppliers of petroleum products in the United States. We intend to execute the following strategies to achieve our goal:
Maintain efficient refinery operations. We intend to operate our refineries as reliably and efficiently as possible and further improve our operations by maintaining our costs at competitive levels, seeking to optimize utilization of our refinery asset base, and making focused high-return capital improvements designed to generate incremental profits.
We are continuously looking for ways to improve our overall operating efficiencies. For example, our refineries in Paulsboro and Delaware City are located approximately 30 miles apart from one another on the Delaware River. Both refineries have the capability to process heavy, sour crudes and have complementary operating units and we exchange certain feedstocks and intermediates between the refineries in an effort to optimize profitability. We are able to recognize cost savings associated with the sharing of crude oil shipments for these refineries. In addition to allowing us to share crude cargoes transported to our East Coast refineries via water, the construction of our new crude rail unloading facility at Delaware City will also help us realize better crude economics, because we will be able to deliver crude via rail through our own facilities and process WTI based crudes at both Paulsboro and Delaware City. We employ a small, centralized corporate staff that provides capital control and oversight and have experienced managers making operational decisions at our refineries.
Continue to grow through acquisitions and internal projects. We believe that we will encounter attractive acquisition opportunities as a result of the continuing strategic divestitures by major integrated oil companies and the rationalization of specific refinery assets. In selecting future acquisitions and internal projects, we intend to consider, among other things, the following criteria: performance through the cycle, access to advantageous crude supplies, attractive refined product end market fundamentals, access to storage, distribution and logistics infrastructure, acquisition price and our ability to maintain a conservative capital structure, and synergies with existing assets. In addition, we own a number of energy-related logistical assets that qualify for the favorable tax treatment that is permitted through an MLP structure. We continue to evaluate our strategic alternatives for these assets.
Promote operational excellence in reliability and safety. We will continue to devote significant time and resources toward improving the reliability and safety of our operations. We will seek to improve operating
103
Table of Contents
performance through our commitment to our preventive maintenance program and to employee training and development programs. We will continue to emphasize safety in all aspects of our operations. We believe that a superior reliability record, which can be measured and managed like all other aspects of our business, is inherently tied to safety and profitability.
Create an organization highly motivated to maintain earnings and improve return on capital. We have created an organization in which employees are highly motivated to maintain earnings and improve return on capital. Our cash incentive compensation plan, which covers all non-unionized employees, is solely based on achieving earnings above designated levels. Our equity incentive plan provides participating employees with an equity stake in us and aligns their interests with our investors’ interests.
Refining Operations
We currently own and operate three refineries, all located in regions with favorable market dynamics where finished product demand exceeds operating refining capacity. We produce a variety of products at each of our refineries, including gasoline, ULSD, heating oil, jet fuel, lubricants, petrochemicals and asphalt. We sell our products throughout the Northeast and Midwest of the United States, as well as in other regions of the United States and Canada, and are able to ship products to other international destinations.
Delaware City Refinery
Acquisition and Re-Start. Through our subsidiaries, Delaware City Refining and Delaware Pipeline Company LLC, we acquired the idle Delaware City refinery and its related assets, including a petroleum product terminal, a petroleum products pipeline and an electric generation facility, on June 1, 2010 from affiliates of Valero for approximately $220.0 million in cash; consisting of approximately $170.0 million for the refinery, terminal and pipeline assets and $50.0 million for the power plant complex located on the property. We also incurred approximately $4.3 million in acquisition costs.
The refinery was commissioned in 1956, and was most recently operated, and ultimately shut down in November 2009, by affiliates of Valero. The Delaware City refinery began production in 1957 as part of the Tidewater Oil Company. In 1967, the Tidewater Oil Company merged into Getty Oil Company. The refinery became an important part of Texaco’s domestic refining portfolio when Texaco acquired Getty in 1984. The Delaware City refinery was part of Star Enterprise, a joint venture between Texaco and Saudi Refining from 1989 until 1998, when it became one of Motiva Enterprises LLC’s refineries. A subsidiary of Premcor, which later merged with Valero in August 2005, purchased Delaware City from Motiva in 2004.
In the fourth quarter of 2009, due to, among other reasons, financial losses caused by one of the worst recessions in recent history, the prior owner shut down the Delaware City refinery. We were therefore able to acquire the refinery at an attractive price. In addition, at the time of acquisition, we reached an agreement with the State of Delaware that provided for a five-year operating permit and up to approximately $45.0 million of economic support to re-start the facility, and negotiated a new long-term contract with the relevant union at the refinery. We believe that the refinery’s ability to process lower quality crudes will allow us to capture a higher margin as these lower quality crudes are typically priced at discounts to benchmark crudes, and to compete effectively in a region where product demand significantly exceeds refining capacity.
Since our acquisition through December 31, 2011, we have invested more than $500.0 million in turnaround and re-start projects at Delaware City, as well as in the recent strategic development of a crude rail unloading facility. In the first year of operations we have also modified the crude slate and product yield, changed operations of the conversion units, and re-started certain units in order to optimize the refinery. The re-start process included the decommissioning of the gasifier unit located on the property which allowed us to decrease emissions and improve the reliability of the refinery. We have also completed a cogeneration project to convert the electric generation units at the refinery to use natural gas as a fuel and a hydrocracker corrosion control
104
Table of Contents
project aimed at increasing throughput. Through these capital investments and by restructuring certain operations, management estimates that we have lowered the annual operating expenses of the Delaware City refinery by approximately $200.0 million (without including rail upgrades). This estimate includes operating expense reductions (maintenance, labor, etc.) of approximately $100.0 million, reduced annual energy costs of approximately $55.0 million, approximately $15.0 million of savings from decommissioning the gasifier and approximately $30.0 million of additional savings from improved reliability of the refinery and decreased operating expenses. In 2012, we are spending approximately $57.0 million, $20.0 million of which has been spent as of September 30, 2012, to expand and upgrade the existing on-site railroad infrastructure, including the expansion of the crude rail unloading facilities that will be capable of discharging approximately 110,000 bpd. Additionally, we continue to evaluate the development of a construction project consisting of a mild hydrocracker and hydrogen plant at the refinery, which was conditionally approved by our board of directors at the end of 2011. We estimate that the construction of the project, if commenced, will take approximately three years from commencement and when completed would process streams from both Delaware City and Paulsboro.
In connection with our re-start of the refinery, we received a $20.0 million loan from the State of Delaware which converts to a grant contingent upon our continued operation of the refinery and certain other conditions. The State of Delaware has also agreed to reimburse us $12.0 million in the aggregate for the dredging of the Delaware River near the refinery over the next six years, granted us $1.5 million to fund employee training programs and granted us $10.0 million towards the conversion of the gas turbines at the refinery to run on natural gas. During the first years of the refinery’s operations we anticipate saving in excess of $100.0 million in capital expenditures we otherwise would have expected to make if not for our reconfiguration of the refinery and the terms of our environmental operating agreement issued by the State of Delaware.
Overview. The Delaware City refinery is located on a 5,000-acre site, with access to waterborne cargoes and an extensive distribution network of pipelines, barges and tankers, truck and rail. Delaware City is a fully integrated operation that receives crude via rail at the crude unloading facility, or ship or barge at its docks located on the Delaware River. The crude and other feedstocks are transported, via pipes, to an extensive tank farm where they are stored until processing. In addition, there is a 17-bay, 50,000 bpd capacity truck loading rack located adjacent to the refinery and a 23-mile interstate pipeline that is used to distribute clean products.
The Delaware City refinery has a throughput capacity of 190,000 bpd and a Nelson Complexity Index of 11.3. As a result of its configuration and process units, Delaware City has the capability of processing a heavy slate of crudes with a high concentration of high sulfur crudes and is one of the largest and most complex refineries on the East Coast. The Delaware City refinery is one of two heavy coking refineries, in addition to Paulsboro, on the East Coast of the United States with coking capacity equal to approximately 25% of crude capacity.
The Delaware City refinery processes a variety of medium to heavy, sour crude oils. The refinery has large conversion capacity with its 82,000 bpd FCC unit, 47,000 bpd FCU and 18,000 bpd hydrocracking unit with vacuum distillation. Hydrogen is provided via the refinery’s steam methane reformer and continuous catalytic reformer.
105
Table of Contents
Delaware City Process Flow Diagram
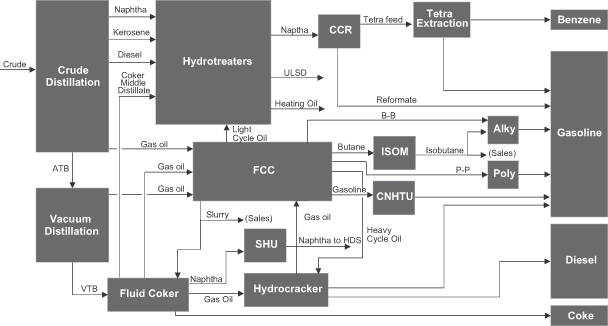
The following table approximates the Delaware City refinery’s major process unit capacities. Unit capacities are shown in barrels per stream day.
| Refinery Units |
Nameplate Capacity |
|||
| Crude Distillation Unit |
190,000 | |||
| Vacuum Distillation Unit |
102,000 | |||
| Fluid Catalytic Cracking Unit (FCC) |
82,000 | |||
| Hydrotreating Units |
160,000 | |||
| Hydrocracking Unit |
18,000 | |||
| Catalytic Reforming Unit (CCR) |
43,000 | |||
| Benzene / Toluene Extraction Unit |
15,000 | |||
| Butane Isomerization Unit (ISOM) |
6,000 | |||
| Alkylation Unit (Alky) |
11,000 | |||
| Polymerization Unit (Poly) |
16,000 | |||
| Fluid Coking Unit (Fluid Coker) |
47,000 | |||
Feedstocks and Supply Arrangements. In April 2011, we entered into a crude and feedstock supply agreement with Statoil that expires in April 2013, subject to Statoil having an option to extend the term through December 31, 2015. We are currently in discussions with Statoil to amend the agreement in anticipation of their extension. Pursuant to the agreement, we direct Statoil to purchase crude and other feedstocks for Delaware City and Statoil purchases these products on the spot market or through term agreements. Accordingly, Statoil enters into, on our behalf, hedging arrangements to protect against changes in prices between the time of purchase and the time of processing the feedstocks. In addition to procurement, for waterborne deliveries Statoil arranges transportation and insurance for the crude and feedstock supply and we pay Statoil a per barrel fee for their procurement and logistics services. Statoil generally holds title to the crude and feedstocks until we run the crude or feedstocks through our process units. We pay Statoil on a daily basis for the corresponding volume of crude or feedstocks that are consumed in conjunction with the refining process. This crude supply and feedstock arrangement helps us reduce the amount of investment we are required to maintain in crude inventories and, as a result, helps us manage our working capital.
106
Table of Contents
Product Offtake. We sell the bulk of Delaware City’s clean products to MSCG through our offtake agreement. MSCG purchases 100% of our finished clean products at Delaware City, which includes gasoline, heating oil and jet fuel, as well as our intermediates. The remainder of our products are sold to a variety of customers on the spot market.
Tankage Capacity. The Delaware City refinery has total storage capacity of approximately 10.0 MMbbls. Of the total, 18 tanks with approximately 3.6 million barrels of storage capacity are dedicated to crude oil and other feedstock storage with the remaining approximately 6.4 million barrels allocated to finished products, intermediates and other products.
Energy and Other Utilities. Under normal operating conditions, the Delaware City refinery consumes approximately 55,000 MMBTU per day of natural gas. The Delaware City refinery has a 280 MW power plant located on-site that consists of two natural gas-fueled turbines with combined capacity of approximately 140 MW and four turbo-generators with combined nameplate capacity of approximately 140 MW. Collectively, this power plant produces electricity in excess of Delaware City’s refinery load of approximately 90 MW. Excess electricity is sold into the Pennsylvania-New Jersey-Maryland, or PJM, grid. Steam is primarily produced by a combination of three dedicated boilers and supplemented by secondary boilers at the FCC and coker.
Paulsboro Refinery
Acquisition. We acquired the entities that owned the Paulsboro refinery (including an associated natural gas pipeline) on December 17, 2010, from Valero for approximately $357.7 million, excluding working capital. The purchase price excludes inventory purchased on our behalf by MSCG and Statoil. We invested approximately $60.0 million in capital in early 2011 to complete a scheduled turnaround at the refinery. The refinery was commissioned in 1917 and was purchased by Valero from Mobil Oil Corporation in 1998.
Overview. Paulsboro has a throughput capacity of 180,000 bpd and a Nelson Complexity Index of 13.2. The Paulsboro refinery is located on approximately 950 acres on the Delaware River in Paulsboro, New Jersey, just south of Philadelphia and approximately 30 miles away from Delaware City. Paulsboro receives crude and feedstocks via its marine terminal on the Delaware River. Paulsboro is one of two operating refineries on the East Coast with coking capacity, the other being Delaware City. Major units at the Paulsboro refinery include crude distillation units, vacuum distillation units, an FCC unit, a delayed coking unit, a lube oil processing unit and a propane deasphalting unit.
The Paulsboro refinery processes a variety of medium and heavy, sour crude oils. The Paulsboro refinery predominantly produces gasoline, heating oil and jet fuel and also manufactures Group I base oils or lubricants. In addition to its finished clean products slate, Paulsboro produces asphalt and petroleum coke.
107
Table of Contents
Paulsboro Refinery Process Flow Diagram
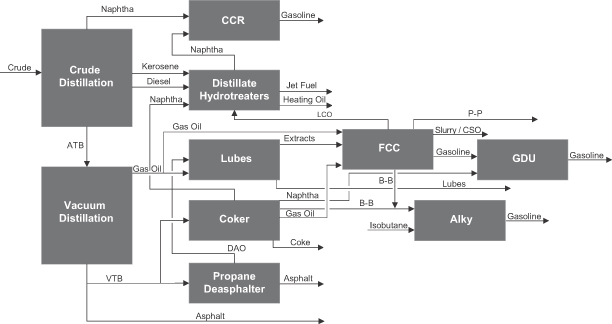
The following table approximates the Paulsboro refinery’s major process unit capacities. Unit capacities are shown in barrels per stream day.
| Refinery Units |
Nameplate Capacity |
|||
| Crude Distillation Units |
168,000 | |||
| Vacuum Distillation Units |
83,000 | |||
| Fluid Catalytic Cracking Unit (FCC) |
55,000 | |||
| Hydrotreating Units |
141,000 | |||
| Catalytic Reforming Unit (CCR) |
32,000 | |||
| Alkylation Unit (Alky) |
11,000 | |||
| Lube Oil Processing Unit |
12,000 | |||
| Delayed Coking Unit (Coker) |
27,000 | |||
| Propane Deasphalting Unit |
11,000 | |||
Feedstocks and Supply Arrangements. In December 2010, we entered into a crude and feedstock supply agreement with Statoil that will terminate effective March 31, 2013. Pursuant to the agreement, we direct Statoil to purchase crude and other feedstocks for Paulsboro and Statoil purchases these products on the spot market. Accordingly, Statoil enters into, on our behalf, hedging arrangements to protect against changes in prices between the time of purchase and the time of processing the feedstocks. In addition to procurement, Statoil generally arranges transportation and insurance for the crude and feedstock supply and we pay Statoil a per barrel fee for their procurement and logistics services. Statoil holds title to the crude and feedstocks until we run the crude or feedstocks through our process units. We pay Statoil on a daily basis for the corresponding volume of crude or feedstocks that are consumed in conjunction with the refining process.
In addition, we have a long-term contract with Saudi Aramco. We have been purchasing up to approximately 100,000 bpd of crude oil from Saudi Aramco that is processed at Paulsboro pursuant to this agreement and on a spot basis. The crude purchased is priced off ASCI.
108
Table of Contents
Product Offtake. We sell the bulk of Paulsboro’s clean products to MSCG through our offtake agreement. With the exception of certain jet fuel sales, MSCG purchases 100% of our finished clean products and intermediates. In addition to the finished products offtake agreement with MSCG, we sell the remaining products produced at Paulsboro to third parties under various long-term contracts and on the spot market.
Tankage Capacity. The Paulsboro refinery has total storage capacity of approximately 7.5 MMbbls. Of the total, approximately 2.1 million barrels are dedicated to crude oil storage with the remaining 5.4 million barrels allocated to finished products, intermediates and other products. Paulsboro has a remote gauging system to monitor tank levels and all storage tanks are diked through either individual or common dikes.
Energy and Other Utilities. Under normal operating conditions, the Paulsboro refinery consumes approximately 30,000 MMBTU per day of natural gas. The Paulsboro refinery is virtually self-sufficient for its electrical power requirements. The refinery supplies approximately 90% of its 63 MW load through a combination of four generators with a nameplate capacity of 78 MW, in addition to a 30 MW gas turbine generator and two 15 MW steam turbine generators located at the Paulsboro utility plant. In the event that Paulsboro requires additional electricity to operate the refinery, supplemental power is available through a local utility. Paulsboro is connected to the grid via three separate 69 KV aerial feeders and has the ability to run entirely on imported power. Steam is primarily produced by three boilers, each with continuous rated capacity of 300,000-lb/hr at 900-psi. In addition, Paulsboro has a heat recovery steam generator and a number of waste heat boilers throughout the refinery that supplement the steam generation capacity. Paulsboro’s current hydrogen needs are met by the hydrogen supply from the reformer. In addition, the refinery employs a standalone steam methane reformer that is capable of producing 10 MMSCFD of 99% pure hydrogen. This ancillary hydrogen plant is utilized as a back-up source of hydrogen for the refinery’s process units.
Toledo Refinery
Acquisition. Through our subsidiary, Toledo Refining, we acquired the Toledo refinery on March 1, 2011, from Sunoco for approximately $400.0 million, excluding working capital. We also purchased refined and certain intermediate products in inventory for approximately $299.6 million, and MSCG purchased the refinery’s crude oil inventory on our behalf. Additionally, included in the terms of the sale is a five-year participation payment of up to $125.0 million payable to Sunoco based upon post-acquisition earnings of the refinery, of which $103.6 million was paid in 2012. We currently anticipate paying the balance of the participation payment in April 2013.
Overview. Toledo has a throughput capacity of approximately 170,000 bpd and a Nelson Complexity Index of 9.2. Toledo processes a slate of light, sweet crudes from Canada, the Midcontinent, the Bakken region and the U.S. Gulf Coast. Toledo produces a high percentage of finished products including gasoline and ULSD, in addition to a variety of high-value petrochemicals including nonene, xylene, tetramer and toluene.
The Toledo refinery is located on a 282-acre site near Toledo, Ohio, approximately 60 miles from Detroit. Major units at the Toledo refinery include an FCC unit, a hydrocracker, an alkylation unit and a UDEX unit. Crude is delivered to the Toledo refinery through three primary pipelines: (1) Enbridge from the north, (2) Capline from the south and (3) Mid-Valley from the south. Crude is also delivered from local sources by truck.
109
Table of Contents
Toledo Refinery Process Flow Diagram
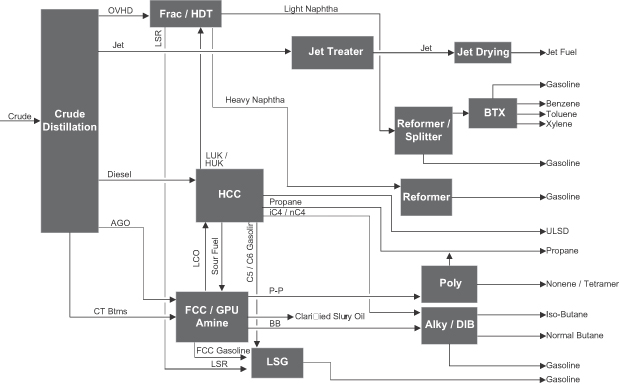
The following table approximates the Toledo refinery’s major process unit capacities. Unit capacities are shown in barrels per stream day.
| Refinery Units |
Nameplate Capacity |
|||
| Crude Distillation Unit |
170,000 | |||
| Fluid Catalytic Cracking Unit (FCC) |
79,000 | |||
| Hydrotreating Units |
95,000 | |||
| Hydrocracking Unit (HCC) |
45,000 | |||
| Catalytic Reforming Units |
45,000 | |||
| Alkylation Unit (Alky) |
10,000 | |||
| Polymerization Unit (Poly) |
7,000 | |||
| UDEX Unit (BTX) |
16,300 | |||
Feedstocks and Supply Arrangements. In May 2011, we entered into a crude oil acquisition agreement with MSCG that expires in June 2013, subject to certain termination rights and automatic renewals unless otherwise terminated by either party. Pursuant to the agreement, we direct MSCG to purchase crude and other feedstocks for Toledo and MSCG purchases these products on the spot market. Accordingly, MSCG enters into, on our behalf, hedging arrangements to protect against changes in prices between the time of purchase and the time of processing the feedstocks. In addition to procurement, MSCG arranges transportation and insurance for the crude and feedstock supply and we pay MSCG a per barrel fee for their procurement and logistics services. We pay MSCG on a daily basis for the corresponding volume of crude or feedstocks two days after they are consumed in conjunction with the refining process. This arrangement helps us reduce the amount of investment we are required to maintain in crude inventories and, as a result, helps us manage our working capital.
110
Table of Contents
Product Offtake. Toledo is connected, via pipelines, to an extensive distribution network throughout Ohio, Illinois, Indiana, Kentucky, Michigan, Pennsylvania and West Virginia. The finished products are transported on pipelines owned by Sunoco Logistics Partners L.P. and Buckeye Partners. In addition, we have proprietary connections to a variety of smaller pipelines and spurs that help us optimize our clean products distribution. A significant portion of Toledo’s gasoline and ULSD are distributed through the approximately 28 terminals in this network.
In March 2011, we entered into an agreement with Sunoco whereby Sunoco purchases gasoline and distillates products representing approximately one-third of the Toledo refinery’s gasoline and diesel production. The agreement has a three year term, subject to certain early termination rights. We sell the bulk of the petrochemicals produced at the Toledo refinery through short-term contracts or on the spot market and the majority of the product distribution is done via rail.
Tankage Capacity. The Toledo refinery has total storage capacity of approximately 4.0 MMbbls. The Toledo refinery receives its crude through pipeline connections and a truck rack. Of the total, approximately 0.4 million barrels are dedicated to crude oil storage with the remaining 3.6 million barrels in the pipeline systems.
Energy and Other Utilities. Under normal operating conditions, the Toledo refinery consumes approximately 17,000 MMBTU per day of natural gas. The Toledo refinery purchases its electricity from a local utility and has a long-term contract to purchase hydrogen and steam from a local third party supplier. In addition to the third party steam supplier, Toledo consumes a portion of the steam that is generated by its various process units.
Competition
The refining business is very competitive. We compete directly with various other refining companies both on the East Coast and in the Midcontinent, with integrated oil companies, with foreign refiners that import products into the United States and with producers and marketers in other industries supplying alternative forms of energy and fuels to satisfy the requirements of industrial, commercial and individual consumers. Some of our competitors have expanded the capacity of their refineries and internationally new refineries are coming on line which could also affect our competitive position.
Profitability in the refining industry depends largely on refined product margins, which can fluctuate significantly, as well as operating efficiency and reliability, product mix and costs of product distribution and transportation. Certain of our competitors that have larger and more complex refineries may be able to realize lower per-barrel costs or higher margins per barrel of throughput. Several of our principal competitors are integrated national or international oil companies that are larger and have substantially greater resources. Because of their integrated operations and larger capitalization, these companies may be more flexible in responding to volatile industry or market conditions, such as shortages of feedstocks or intense price fluctuations. Refining margins are frequently impacted by sharp changes in crude oil costs, which may not be immediately reflected in product prices.
The refining industry is highly competitive with respect to feedstock supply. Unlike certain of our competitors that have access to proprietary controlled sources of crude oil production available for use at their own refineries, we obtain substantially all of our crude oil and other feedstocks from unaffiliated sources. The availability and cost of crude oil is affected by global supply and demand. We have no crude oil reserves and are not engaged in the exploration or production of crude oil. We believe, however, that we will be able to obtain adequate crude oil and other feedstocks at generally competitive prices for the foreseeable future.
111
Table of Contents
Employees
As of September 30, 2012, we had approximately 1,578 employees. At Paulsboro, 289 of our 446 employees are covered by a collective bargaining agreement that expires in March 2015. In addition, 639 of our 986 employees at Delaware City and Toledo are covered by a collective bargaining agreement that is currently anticipated to expire in February of 2015. None of our corporate employees are covered by a collective bargaining agreement. We consider our relations with the represented employees to be satisfactory.
Environmental, Health and Safety Matters
Refinery and pipeline operations are subject to federal, state and local laws regulating the discharge of matter into the environment or otherwise relating to human health and safety or the protection of the environment. These laws regulate among other things, the generation, storage, handling, use and transportation of petroleum and other regulated materials, the emission and discharge of materials into the environment, waste management, remediation of contaminated sites, characteristics and composition of gasoline and diesel and other matters otherwise relating to the protection of the environment. Permits are also required under these laws for the operation of our refineries, pipelines and related operations and these permits are subject to revocation, modification and renewal. Compliance with applicable environmental laws, regulations and permits will continue to have an impact on our operations, results of operations and capital requirements. We believe that our current operations are in substantial compliance with existing environmental laws, regulations and permits.
Our operations and many of the products we manufacture are subject to certain specific requirements of the CAA, and related state and local regulations. The CAA contains provisions that require capital expenditures for the installation of certain air pollution control devices at our refineries. Subsequent rule making authorized by the CAA or similar laws or new agency interpretations of existing rules, may necessitate additional expenditures in future years.
Additionally, as of January 1, 2011 we are required to meet an EPA regulation limiting the average sulfur content in gasoline to 30 PPM. The EPA has also announced that it plans to propose new “Tier 3” motor vehicle emission and fuel standards. It has been reported that these new Tier 3 regulations may, among other things, lower the maximum average sulfur content of gasoline from 30 PPM to 10 PPM. If the Tier 3 regulations are eventually implemented and lower the maximum allowable content of sulfur or other constituents in fuels that we produce, we may at some point in the future be required to make significant capital expenditures and/or incur materially increased operating costs to comply with the new standards. As of January 1, 2011, we are required to comply with the EPA’s new Control of Hazardous Air Pollutants From Mobile Sources, or MSAT2, regulations on gasoline that impose reductions in the benzene content of our produced gasoline. We purchase benzene credits to meet these requirements. Our planned capital projects will reduce the amount of benzene credits that we need to purchase and we could implement additional benzene reduction projects to completely eliminate our benzene credit purchase requirements if we can justify such a project from a cost benefit standpoint. In addition, the renewable fuel standards will mandate the blending of prescribed percentages of renewable fuels (e.g., ethanol and biofuels) into our produced gasoline and diesel. These new requirements, other requirements of the CAA and other presently existing or future environmental regulations may cause us to make substantial capital expenditures as well as the purchase of credits at significant cost, to enable our refineries to produce products that meet applicable requirements.
Our operations are also subject to the federal Clean Water Act, or the CWA, the federal Safe Drinking Water Act, or the SDWA, and comparable state and local requirements. The CWA, the SDWA and analogous laws prohibit any discharge into surface waters, ground waters, injection wells and publicly-owned treatment works except in strict conformance with permits, such as pre-treatment permits and discharge permits, issued by federal, state and local governmental agencies. Federal waste-water discharge permits and analogous state waste-water discharge permits are valid for a maximum of five years and must be renewed.
112
Table of Contents
We generate wastes that may be subject to the federal Resource Conservation and Recovery Act, or RCRA, and comparable state and local requirements. The EPA and various state agencies have limited the approved methods of disposal for certain hazardous and non-hazardous wastes.
The federal Comprehensive Environmental Response, Compensation and Liability Act of 1980, or CERCLA, also known as “Superfund,” imposes liability, without regard to fault or the legality of the original conduct, on certain classes of persons who are considered to be responsible for the release of a “hazardous substance” into the environment. These persons include the current or former owner or operator of the disposal site or sites where the release occurred and companies that disposed of or arranged for the disposal of the hazardous substances. Under CERCLA, such persons may be subject to joint and several liability for investigation and the costs of cleaning up the hazardous substances that have been released into the environment, for damages to natural resources and for the costs of certain health studies. As discussed more fully below, certain of our sites are subject to these laws and we may be held liable for investigation and remediation costs or claims for natural resource damages. It is not uncommon for neighboring landowners and other third parties to file claims for personal injury and property damage allegedly caused by hazardous substances or other pollutants released into the environment. Analogous state laws impose similar responsibilities and liabilities on responsible parties. In our current normal operations, we have generated waste, some of which falls within the statutory definition of a “hazardous substance” and some of which may have been disposed of at sites that may require cleanup under Superfund.
As is the case with all companies engaged in industries similar to ours, we face potential exposure to future claims and lawsuits involving environmental matters. These matters include soil and water contamination, air pollution, personal injury and property damage allegedly caused by substances which we manufactured, handled, used, released or disposed of.
Current and future environmental regulations are expected to require additional expenditures, including expenditures for investigation and remediation, which may be significant, at our refineries and at pipeline transportation facilities. To the extent that future expenditures for these purposes are material and can be reasonably determined, these costs are disclosed and accrued.
Our operations are also subject to various laws and regulations relating to occupational health and safety. We maintain safety, training and maintenance programs as part of our ongoing efforts to ensure compliance with applicable laws and regulations. Compliance with applicable health and safety laws and regulations has required and continues to require substantial expenditures.
In connection with each of our acquisitions, we assumed certain environmental remediation obligations. In the case of Paulsboro, a trust fund established to meet state financial assurance requirements, in the amount of approximately $12.1 million, the current estimated cost of the remediation obligations assumed based on investigation undertaken to date, was acquired as part of the acquisition. The short term portion of the trust fund and corresponding liability are recorded as restricted cash and accrued expenses, the long term portion is recorded in other assets and other long-term liabilities. In connection with the acquisition of Delaware City, the prior owners remain responsible subject to certain limitations, for certain environmental obligations including ongoing remediation of soil and groundwater contamination at the site. Further, in connection with the Delaware City and Paulsboro acquisitions, we purchased two individual ten-year, $75.0 million environmental insurance policies to insure against unknown environmental liabilities at each refinery. In connection with the acquisition of Toledo, the seller, subject to certain limitations, initially retains remediation obligations which will transition to us over a 20-year period. However, there can be no assurance that any available indemnity, trust fund or insurance will be sufficient to cover any ultimate environmental liabilities we may incur with respect to our refineries which could be significant.
We cannot predict what additional health and environmental legislation or regulations will be enacted or become effective in the future or how existing or future laws or regulations will be administered or interpreted with respect to our operations. Compliance with more stringent laws or regulations or adverse changes in the
113
Table of Contents
interpretation of existing requirements or discovery of new information such as unknown contamination could have an adverse effect on the financial position and the results of our operations and could require substantial expenditures for the installation and operation of systems and equipment that we do not currently possess.
Legal Proceedings
We are not currently a party to any legal proceedings that, if determined adversely against us, individually or in the aggregate, would have a material adverse effect on our financial position, results of operations or cash flows. Our subsidiary, Paulsboro Refining, formerly known as Valero Refining Company—New Jersey, is party to certain legal proceedings that arose prior to our acquisition of the entity, for which we are indemnified by Valero.
114
Table of Contents
The following table sets forth certain information regarding our current directors and executive officers. Each director and executive officer will hold office until a successor is elected and qualified or until his earlier death, resignation or removal.
| Name |
Age | Position | ||||
| Thomas D. O’Malley |
71 | Executive Chairman of the Board of Directors | ||||
| Thomas J. Nimbley |
61 | Chief Executive Officer | ||||
| Michael D. Gayda |
58 | President | ||||
| Donald F. Lucey |
59 | Executive Vice President, Chief Commercial Officer | ||||
| Matthew C. Lucey |
39 | Senior Vice President, Chief Financial Officer | ||||
| Jeffrey Dill |
51 | Senior Vice President, General Counsel | ||||
| Spencer Abraham |
60 | Director | ||||
| Jefferson F. Allen |
67 | Director | ||||
| Martin J. Brand |
37 | Director | ||||
| Timothy H. Day |
42 | Director | ||||
| David I. Foley |
45 | Director | ||||
| Dennis Houston |
61 | Director | ||||
| Neil A. Wizel |
35 | Director | ||||
Thomas D. O’Malley has served as Executive Chairman of the Board of Directors of PBF Energy since its formation in November 2011, has served as Executive Chairman of the Board of Directors of PBF LLC and its predecessors since March 2008 and was our Chief Executive Officer from inception until June 2010. Mr. O’Malley has more than 30 years experience in the refining industry. He served as Chairman of the Board of Petroplus Holdings A.G., listed on the Swiss Exchange, from May 2006 until February 2011, and was Chief Executive Officer from May 2006 until September 2007. Mr. O’Malley was Chairman of the Board and Chief Executive Officer of Premcor, a domestic oil refiner and Fortune 250 company listed on the NYSE, from February 2002 until its sale to Valero in August 2005. Before joining Premcor, Mr. O’Malley was Chairman and Chief Executive Officer of Tosco Corporation. This Fortune 100 company, listed on the NYSE, was the largest independent oil refiner and marketer of oil products in the United States, with annualized revenues of approximately $25.0 billion when it was sold to Philips Petroleum Company in September 2001.
Mr. O’Malley’s extensive experience in and knowledge of the refining industry, as well as his proven leadership skills and management experience provides the board with valuable leadership, and for these reasons we believe Mr. O’Malley is qualified to serve as Chairman of our board of directors.
Thomas J. Nimbley has served as our Chief Executive Officer since June 2010 and was our Executive Vice President, Chief Operating Officer from March 2010 through June 2010. Prior thereto, he served as a Principal for Nimbley Consultants LLC from June 2005 to April 2010, where he provided consulting services and assisted on the acquisition of two refineries. He previously served as Senior Vice President and head of Refining for Phillips Petroleum Company and subsequently Senior Vice President and head of Refining for ConocoPhillips domestic refining system (13 locations) following the merger of Phillips and Conoco. Before joining Phillips at the time of its acquisition of Tosco in September 2001, Mr. Nimbley served in various positions with Tosco Corporation and its subsidiaries starting in April 1993.
Michael D. Gayda joined us as our Executive Vice President, General Counsel and Secretary in April 2010 and has served as our President since June 2010 and was a director from inception until October 2009. Prior
115
Table of Contents
thereto, from May 2006 until January 2010 Mr. Gayda served as Executive Vice President, General Counsel and Secretary of Petroplus, for whom Mr. Gayda is currently obligated to perform limited consulting services. Prior to Petroplus, he served as an executive officer of Premcor until its sale to Valero in August 2005 and as General Counsel—Refining for Phillips 66 Company, a division of Phillips Petroleum Company, following Phillips Petroleum’s acquisition of Tosco in September 2001. Mr. Gayda previously served as a Vice President of certain of Tosco’s subsidiaries.
Donald F. Lucey joined us as our Senior Vice President, Commercial Operations in April 2008 and has served as our Executive Vice President, Chief Commercial Officer since April 2010. From 2005 until April 2008, Mr. Lucey provided consulting services to a variety of energy companies. Prior thereto, Mr. Lucey served as Senior Vice President, Commercial for Premcor from April 2002 until August 2005. Prior to that, Mr. Lucey worked at both Tosco and Phillips Petroleum Company, where he managed Atlantic Basin fuel oil activities. Before joining Tosco, Mr. Lucey worked with Phibro Energy in its fuel oil products and solid fuels departments throughout the United States and abroad.
Matthew C. Lucey joined us as our Vice President, Finance in April 2008 and has served as our Senior Vice President, Chief Financial Officer since April 2010. Prior thereto, Mr. Lucey served as a Managing Director of M.E. Zukerman & Co., a New York-based private equity firm specializing in several sectors of the broader energy industry, from 2001 to 2008. While at M.E. Zukerman & Co., Mr. Lucey participated in all aspects of the firm’s energy investment activities and served on the Management Committee of Penreco, a manufacturer of specialty petroleum products; Cortez Pipeline Company, a 500 mile CO2 pipeline; and Venture Coke Company, a merchant petroleum coke calciner. Before joining M.E. Zukerman & Co., Mr. Lucey spent six years in the banking industry.
Jeffrey Dill has served as our Senior Vice President, General Counsel and Secretary since May 2010 and from March 2008 until September 2009. Mr. Dill served as Senior Vice President, General Counsel and Secretary for Maxum Petroleum, Inc., a national marketer and logistics company for petroleum products, from September 2009 to May 2010 and as Consulting General Counsel and Secretary for NTR Acquisition Co., a special purpose acquisition company focused on downstream energy opportunities, from April 2007 to February 2008. Previously he served as Vice President, General Counsel and Secretary at Neurogen Corporation, a drug discovery and development company, from March 2006 to December 2007. Mr. Dill has over 15 years experience providing legal support to refining, transportation and marketing organizations in the petroleum industry, including positions at Premcor, ConocoPhillips, Tosco and Unocal.
Spencer Abraham has served as a director of PBF Energy since October 2012 and has been a director of PBF LLC since August 2012. Mr. Abraham is the Chief Executive Officer and Chairman of the international strategic consulting firm The Abraham Group, which he founded in 2005. Prior to starting The Abraham Group, Mr. Abraham served as Secretary of Energy under President George W. Bush from 2001 through January 2005 and was a U.S. Senator for the State of Michigan from 1995 to 2001. Prior to serving as a U.S. Senator, Mr. Abraham held various other public and private sector positions in the public policy arena. Mr. Abraham serves as a director of Occidental Petroleum Corporation and GenOn Energy, Inc. and as Chairman of the Advisory Board of Lynx Global Realty Asset Fund Onshore LLC. He was previously a director of ICx Technologies and non-executive Chairman of Areva Inc. Mr. Abraham also serves on the boards or advisory committees of several private companies, including Deepwater Wind, LLC, Green Rock Energy, Sindicatum Sustainable Resources and C3.
Mr. Abraham’s extensive political and financial experience in the energy sector, including as the Secretary of Energy of the United States, as a U.S. Senator and as a board member of various public companies in the oil and gas sector, provides him with unique and valuable insights into the industry in which we operate and the markets that we serve, and for these reasons we believe that Mr. Abraham is a valuable member of our board of directors.
116
Table of Contents
Jefferson F. Allen has served as a director of PBF Energy since its formation in November 2011 and has been a director of PBF LLC since January 2011. Mr. Allen serves as chairman of our audit committee for PBF. Mr. Allen has over 35 years experience in the oil industry. Before his retirement in 2005, Mr. Allen most recently served as the Chief Executive Officer of Premcor at the time of its sale to Valero in 2005. In addition, from 2002 until 2005 Mr. Allen served on Premcor’s Board of Directors and from 2002 until 2004 was Chairman of its Audit Committee. Prior to his service with Premcor, Mr. Allen was the Chief Financial Officer and a director of Tosco Corporation from 1990, and served as its President from 1995, until its merger with Phillips Petroleum Company in September 2001. Before joining Tosco, his previous energy industry experience was in the international exploration and production business for 14 years.
Mr. Allen’s industry specific experience as a financial expert and board member of a public company, provides our board with a unique perspective and insight, and for these reason we believe Mr. Allen is a valuable member of our board of directors.
Martin J. Brand has served as a director of PBF Energy since its formation in November 2011 and has been a director of PBF LLC and its predecessors since October 2010. Mr. Brand is a Managing Director in the Private Equity Group at Blackstone. Mr. Brand joined Blackstone in 2003 in the London office and transferred to the New York office in 2005. Mr. Brand currently serves as a director of Bayview Financial, Travelport Limited, Performance Food Group, Orbitz Worldwide, Knight Capital Group and SunGard. Before joining Blackstone, Mr. Brand worked as a derivatives trader with the FICC division of Goldman, Sachs & Co. in New York and Tokyo and with McKinsey & Company in London.
Mr. Brand brings extensive financial expertise and broad-based international experience with private equity firms that invest in growing companies to our board. These attributes provide the board with critical insight into what is needed to successfully compete in the global marketplace, and for these reasons we believe Mr. Brand is a valuable member of our board.
Timothy H. Day has served as a director of PBF Energy since its formation in November 2011 and has been a director of PBF LLC and its predecessors since March 2008. Mr. Day serves as chairman of our nominating and corporate governance committee. Mr. Day is a Managing Director at First Reserve and is co-head of the firm’s buyout funds. Mr. Day’s responsibilities include investment origination, structuring, execution, monitoring and exit strategy, with particular emphasis on the global natural gas chain and related services for the hydrocarbon processing industry as well as midstream and downstream assets. Prior to joining First Reserve in 2000, Mr. Day spent three years with SCF Partners, a private equity investment group specializing in the energy industry and three years with Credit Suisse First Boston and Salomon Brothers. Mr. Day serves as a director of Brand Energy & Infrastructure Services, Crestwood Midstream Partners, Diamond S Management and KA First Reserve.
Mr. Day’s affiliation with First Reserve, his extensive financial expertise and his significant experience in the energy industry working with companies controlled by private equity sponsors make him a valuable member of our board.
David I. Foley has served as a director of PBF Energy since its formation in November 2011 and has been a director of PBF LLC and its predecessors since March 2008. Mr. Foley serves as chairman of our compensation committee. Mr. Foley is a Senior Managing Director in the Private Equity Group at Blackstone, the Chief Executive Officer of Blackstone Energy Partners, and leads all of Blackstone’s private equity investment activities in the energy and natural resource sector on a global basis. Since joining Blackstone in 1995, Mr. Foley has been responsible for building Blackstone’s energy and natural resources practice and has played an integral role in every private equity energy deal that the firm has invested in. Before joining Blackstone, Mr. Foley worked with AEA Investors in the firm’s private equity business and prior to that served as a consultant for the Monitor Company. Mr. Foley serves as a director of Cheniere Energy Inc., Cheniere Energy Partners, Kosmos Energy and several privately-held energy companies in which Blackstone is an equity investor.
117
Table of Contents
Mr. Foley’s affiliation with Blackstone, his financial expertise and his vast experience in the energy industry working with companies controlled by private equity sponsors make him a valuable member of our board.
Dennis Houston has served as a director of PBF Energy since its formation in November 2011 and has been a director of PBF LLC since June 2011. Mr. Houston has approximately 40 years experience in the oil and gas industry, including over 35 years with ExxonMobil and its related companies. At the time of his retirement from ExxonMobil in May 2010, Mr. Houston held the positions of Executive Vice President Refining & Supply Company, Chairman and President of ExxonMobil Sales & Supply LLC and Chairman of Standard Tankers Bahamas Limited. Mr. Houston’s experience also includes engineering and management positions in Exxon’s refining organization and positions in Lubes and Supply.
Mr. Houston’s extensive operational experience in the oil and gas industry, including as a manager of a global refining organization, provides him with valuable insight into the markets in which we operate and provides a unique perspective to our board, and for these reasons we believe that Mr. Houston is qualified to serve on our board.
Neil A. Wizel has served as a director of PBF Energy since its formation in November 2011 and has been a director of PBF LLC and its predecessors since October 2010. Mr. Wizel is a Director at First Reserve. Mr. Wizel’s responsibilities include investment origination, structuring, execution, monitoring and exit strategy, with particular emphasis on the equipment, manufacturing and services sector as well as the reserves sector and downstream assets. Prior to joining First Reserve in April 2007, Mr. Wizel worked for five years at Greenbriar Equity Group, a transportation—focused private equity firm. Prior to Greenbriar, he was a Financial Analyst in the Leveraged Finance/Financial Sponsor Group at Credit Suisse First Boston. Mr. Wizel serves as a director of the Deep Gulf Energy companies and Saxon Energy Services.
Mr. Wizel’s affiliation with First Reserve, his financial expertise and his investment experience across the entire energy value chain make him a valuable member of our board.
Mr. O’Malley, by marriage, is the uncle of Mr. M. Lucey and the first cousin of Mr. D. Lucey.
Board of Directors Composition
Our board of directors currently has eight members, two of whom were nominated by Blackstone, two of whom were nominated by First Reserve, one of whom is our Executive Chairman and three of whom are independent directors nominated by the other five directors.
In connection with this offering we will enter into a stockholders agreement with Blackstone and First Reserve pursuant to which our board will be comprised of nine members, three of whom shall be designees of Blackstone and three of whom shall be designees of First Reserve. Blackstone and First Reserve will retain the right to designate nominees to our board of directors subject to the maintenance of certain ownership requirements in the Company. See “Certain Relationships and Related Party Transactions—Stockholders Agreement.”
Members of the board of directors will be elected at our annual meeting of stockholders to serve for a term of one year or until their successors have been elected and qualified, subject to prior death, resignation, retirement or removal from office. Each election of directors will be by plurality vote of the stockholders.
Corporate Governance Principles and Board Matters
Upon completion of this offering, we will be a “controlled company” under the NYSE corporate governance rules for so long as Blackstone and First Reserve continue to own more than 50% of the combined voting power of our Class A and Class B common stock after the completion of this offering. As a result, we will be eligible
118
Table of Contents
for exemptions from provisions of the NYSE corporate governance standards, including (1) the requirement that a majority of the board of directors consist of independent directors, (2) the requirement that we have a nominating and corporate governance committee that is composed entirely of independent directors with a written charter addressing the committee’s purpose and responsibilities, (3) the requirement that we have a compensation committee that is composed entirely of independent directors with a written charter addressing the committee’s purpose and responsibilities and (4) the requirement that there be an annual performance evaluation of the corporate governance and compensation committees.
Following this offering, we intend to utilize these exemptions. As a result, we will not be required to have a majority of independent directors nor will our nominating and corporate governance and compensation committees be required to consist entirely of independent directors. In addition, although we will have adopted charters for our audit, nominating and corporate governance and compensation committees and intend to conduct annual performance evaluations for these committees, none of these committees will be required to be composed entirely of independent directors immediately following the completion of this offering. Accordingly, you would not have the same protections afforded to stockholders of companies that are subject to all of the NYSE corporate governance requirements. In the event that we are not, or cease to be, a controlled company within the meaning of these rules, we will be required to comply with these provisions within the transition periods specified in the NYSE corporate governance rules.
Board Committees
Our board of directors currently has an audit committee, a compensation committee and a nominating and corporate governance committee.
Audit Committee
Our audit committee consists of Messrs. Allen, Brand and Wizel. Mr. Allen serves as chairman of our audit committee and qualifies as independent as defined in Rule 10A-3(b)(1) under the Exchange Act and as an “audit committee financial expert” as such term is defined in Item 407(d)(5) of Regulation S-K. We will rely on the phase-in rules of the SEC and NYSE with respect to the independence of our audit committee. These rules permit us to have an audit committee that has one member that is independent upon the effectiveness of the registration statement of which this prospectus forms a part, a majority of members that are independent within 90 days thereafter and all members that are independent within one year thereafter.
The purpose of our audit committee is to assist our board of directors in overseeing and monitoring (1) the quality and integrity of our financial statements; (2) our independent registered public accounting firm’s qualifications and independence; (3) the performance of our internal audit function; (4) the performance of our independent registered public accounting firm; and (5) our compliance with applicable laws and regulations, our Code of Business Conduct and Ethics, and our related policies and procedures, including our company-wide compliance and ethics program, with the committee to make regular reports to the board of directors regarding these compliance and ethics related responsibilities.
Our audit committee has adopted a Code of Business Conduct and Ethics for all employees, a copy of which will be available on our website as soon as practicable upon the completion of this offering.
Compensation Committee
Our compensation committee consists of Messrs. Foley, Day, Allen and Abraham. Mr. Foley serves as chairman of our compensation committee. Our compensation committee is responsible for assisting our board of directors in discharging its responsibilities relating to (1) setting our compensation program and compensation of our executive officers and directors; (2) monitoring our incentive and equity-based compensation plans; and (3) preparing our compensation committee report required to be included in our proxy statement under the rules and regulations of the SEC.
119
Table of Contents
Our board of directors has adopted a written charter for our compensation committee, a copy of which will be available on our website as soon as practicable upon the completion of this offering.
Compensation Committee Interlocks and Insider Participation
We do not anticipate any interlocking relationships between any member of our compensation committee and any of our executive officers that would require disclosure under the applicable rules promulgated under federal securities laws.
Nominating and Corporate Governance Committee
Our nominating and corporate governance committee consists of Messrs. Day, Foley and Abraham. Mr. Day serves as chairman of our nominating and corporate governance committee. Our nominating and corporate governance committee is responsible for (1) identifying individuals qualified to become new board members, consistent with criteria approved by the board of directors, subject to our stockholders agreement; (2) reviewing the qualifications of incumbent directors to determine whether to recommend them for reelection and selecting, or recommending that the board select, the director nominees for the next annual meeting of stockholders; (3) identifying board members qualified to fill vacancies on any board committee and recommending that the board appoint the identified member or members to the applicable committee; (4) reviewing and recommending to the board of directors corporate governance guidelines; (5) overseeing the evaluation of the board of directors and executive officers; and (6) handling such other matters that are specifically delegated to the committee by the board of directors from time to time.
Our board of directors has adopted a written charter for our nominating and corporate governance committee, a copy of which will be available on our website as soon as practicable upon the completion of this offering.
Our chief executive officer and other executive officers will regularly report to the non-executive directors and our audit, compensation and nominating and corporate governance committees to ensure effective and efficient oversight of our activities and to assist in proper risk management and the ongoing evaluation of management controls. Our principal accounting officer reports functionally to our chief financial officer and directly to our audit committee. We believe that the board’s leadership structure provides appropriate risk oversight of our activities.
120
Table of Contents
Compensation Discussion and Analysis
The following discussion and analysis of compensation arrangements of our named executive officers for the fiscal year ended December 31, 2011 should be read together with the compensation tables and related disclosures about our current plans, considerations, expectations and determinations regarding future compensation programs. Actual compensation programs that we adopt may differ materially from currently planned programs summarized in this discussion.
Background and Overview
This section discusses the principles underlying our executive compensation policies and decisions. It provides qualitative information regarding the manner in which compensation is earned by our executive officers and places in context the data presented in the tables that follow. Our named executive officers for 2011 were Thomas D. O’Malley, Executive Chairman of the Board of Directors, Thomas J. Nimbley, Chief Executive Officer, Matthew C. Lucey, Senior Vice President, Chief Financial Officer, Donald F. Lucey, Executive Vice President, Chief Commercial Officer, and Michael D. Gayda, President.
Since our formation, our named executive officers have not received any compensation directly from us. All of our named executive officers have employment agreements with PBF Investments LLC, an indirect wholly owned subsidiary of PBF LLC, which currently pays the salaries of, and provides benefits to, these employees.
Our Compensation Committee
Prior to this offering, our board of directors approved each of the employment agreements with our named executive officers, including incentive compensation arrangements and eligibility for long-term equity compensation. Our board of directors has also approved our equity incentive plans and individual grants of equity to members of the board of directors, our named executive officers and other employees. Following this offering, our compensation policies and objectives will be established by our compensation committee.
In order to ensure that compensation programs are aligned with appropriate performance goals and strategic direction, management works with our compensation committee in the compensation-setting process. Specifically, management will recommend to our compensation committee its opinion of executive performance, recommend business performance targets and objectives, and recommend salary levels and annual and long-term incentive levels. However, in the future, all decisions regarding executive compensation will be made by our compensation committee.
Our compensation committee recently engaged Frederic W. Cook & Co. as its independent compensation consultant to assist it in evaluating our executive compensation program and to make recommendations with respect to appropriate levels and forms of compensation and benefits as we transition to becoming a public company, including the following:
| • | an assessment of the components of our executive compensation program and our executives’ equity compensation levels relative to peers; |
| • | a review of market and “best” practice with respect to executive severance/change-of-control arrangements; |
| • | assistance with a review of our equity compensation strategy, including the development of award guidelines and an aggregate spending budget; |
| • | a review of considerations and market practices related to short-term cash incentive plans; and |
| • | a review of board of director compensation market practices. |
121
Table of Contents
The objective of this evaluation is to ensure that we remain competitive as a newly public company and that we develop and maintain a compensation framework that is appropriate for a public company. Frederic W. Cook & Co. has not yet finalized its findings and the compensation committee has not approved, or recommended for approval, any material changes to our executive compensation program. Frederic W. Cook & Co. does not provide any other services to us or to management.
Our compensation committee determines and approves the compensation arrangements for our named executive officers and senior management, the appropriate annual salary, as well as applicable incentive compensation arrangements.
Compensation Philosophy
Our compensation arrangements are designed to ensure that our executives are rewarded appropriately for their contributions to our growth and profitability, and that the compensation is demonstrably contingent upon and linked to our sustainable success. This linkage encourages the commonality of interest between our executives and our stockholders.
The following are the principal objectives in the design of our executive compensation arrangements:
| • | our ability to attract, retain and motivate superior management talent critical to our long-term success with compensation that is competitive within the marketplace; |
| • | linking executive compensation to the creation and maintenance of long-term equity value; |
| • | the maintenance of a reasonable balance among base salary, annual cash incentive payments and long-term equity-based incentive compensation, and other benefits; |
| • | promoting equity ownership by executives to align their interests with the interests of our equity holders; and |
| • | ensuring that incentive compensation is linked to the achievement of specific financial and strategic objectives, which are established in advance and approved by the board of directors. |
Compensation Elements and Mix
We believe that compensation to our executive officers should be aligned closely with our short-term and long-term financial performance goals. As a result, a portion of executive compensation will be “at risk” and will be tied to the attainment of previously established financial goals. However, we also believe that it is prudent to provide competitive base salaries and benefits to attract and retain superior talent in order to achieve our strategic objectives.
For 2011, the principal elements of our compensation for our named executive officers were:
| • | Base salaries; |
| • | Annual cash incentive plan; |
| • | Long-term equity-based incentives; and |
| • | Benefits and executive perquisites. |
Annual Base Salary
In general, base salary is used as a principal means of providing cash compensation for performance of a named executive officer’s essential duties. Base salaries for our named executive officers are determined on an individual basis and are based on the level of job responsibility in the organization, past experience and market comparisons and are intended to provide our named executive officers with a stable income. The base salaries are
122
Table of Contents
designed to compensate the named executive officer for daily duties provided to the Company. Salaries are reviewed from time to time by the board of directors, and all proposed adjustments to the base salaries of our named executive officers are reviewed and approved by the board of directors and in the future will be reviewed and approved by our compensation committee. The base salary for each named executive officer for 2011 is reported in the Summary Compensation Table below.
Annual Cash Incentive Plan
Our named executive officers are eligible to participate in our annual cash incentive compensation plan on the same basis as our other members of management. The cash incentive compensation plan and any amounts thereunder to be paid to a named executive officer are determined in the discretion of our compensation committee.
In 2011, the cash incentive plan was designed to align our named executive officers and other members of management’s short-term cash compensation opportunities with our 2011 financial goals. Awards under the 2011 cash incentive plan are based on earnings thresholds determined by our compensation committee, based on recommendations provided by our Executive Chairman and Chief Executive Officer. For 2011, the cash incentive plan was established using minimum earnings thresholds with graduated increments and a total dollar limit on the amount available for awards. The earnings thresholds are designed to be realistic and attainable though slightly aggressive, requiring strong performance and execution that in our view provides an incentive firmly aligned with stockholder interests.
We retain the discretion to amend or discontinue the cash incentive plan and/or any award granted under the plan in the future, subject to the terms of the existing awards and the requirements of applicable law.
Equity Compensation
Our executive officer compensation has a substantial equity component as we believe superior equity investors’ returns are achieved through a culture that focuses on long-term performance by our named executive officers and other key employees. By providing our executives with an equity stake, we are better able to align the interests of our named executive officers and our other equity holders. In addition, because employees are able to profit from stock options only if our stock price increases relative to the stock option’s exercise price, we believe stock options provide meaningful incentives to our named executive officers and other employees to achieve increases in the value of our stock over time.
As discussed under “Certain Relationships and Related Transactions—Investments in PBF LLC,” since our formation in 2008, our named executive officers, one of our directors and certain other employees were provided the opportunity to purchase PBF LLC Series A Units and warrants to purchase PBF LLC Series A Units, and were granted additional compensatory warrants to purchase PBF LLC Series A Units. In addition, certain of our officers, including our named executive officers, were granted PBF LLC Series B Units, which are profits interests in PBF LLC.
Since March 2011, PBF LLC has maintained the PBF Energy Company LLC 2011 Equity Incentive Plan, pursuant to which options to purchase Series A Units of PBF LLC have been granted to one of our named executive officers and certain of our employees. The options to purchase Series A Units vest in equal annual installments over three years, subject to accelerated vesting upon certain events. The options cannot be exercised more than 10 years after the date of grant. In making equity grants to our named executive officers, we considered a number of factors, including the position the executive has or is taking with us, individual performance of the executive, the present equity ownership levels of the executive, internal pay equity and the level of the executive’s total annual compensation package compared to similar positions at other refiners and energy companies. Following this offering PBF LLC does not intend to grant any additional equity awards under its 2011 Equity Incentive Plan. Our board of directors adopted the PBF Energy Inc. 2012 Equity Incentive Plan, which will be the source of new equity-based and cash-based awards for us following this offering. See “—2012 Equity Incentive Plan.”
123
Table of Contents
We do not have a formal policy requiring stock ownership by our executives. Notwithstanding the absence of a requirement, our executives have invested personal capital in us in connection with the formation of PBF LLC. See “Certain Relationships and Related Transactions—Investments in PBF LLC” and “—Private Placement of Senior Secured Notes” and the beneficial ownership chart under “Principal Stockholders.”
Other Benefits
All executive officers, including the named executive officers, are eligible for other benefits including: medical, dental, short-term disability and life insurance. The executives participate in these plans on the same basis, terms and conditions as other administrative employees. In addition, we provide long-term disability insurance coverage on behalf of the named executive officers at an amount equal to 65% of current base salary (up to $10,000 per month). The named executive officers also participate in our vacation, holiday and sick day program which provides paid leave during the year at various amounts based upon the executive’s position and length of service.
Clawback Policies
If required by applicable law or stock exchange listing requirements, any incentive or equity-based award provided to one of our employees shall be conditioned on repayment or forfeiture in accordance with applicable law, any company policy, and any relevant provisions in the applicable award agreement.
Pension and Other Retirement Benefits
Defined Contribution Plan. Our defined contribution plan covers all employees, including our named executive officers. Employees are eligible to participate as of the first day of the month following 30 days of service. Participants can make basic contributions up to 50 percent of their annual salary subject to Internal Revenue Service limits. We match participants’ contributions at the rate of 200 percent of the first 3 percent of each participant’s total basic contribution based on the participant’s total annual salary. Employee contributions to the defined contribution plan are fully vested immediately. Our matching contributions to the defined contribution plan vest to the employee’s account over time. Participants may receive distributions from the vested portion of their defined contribution plan accounts any time after they cease service with us.
PBF Energy Pension Plan. We sponsor a qualified defined benefit plan for all employees, including our named executive officers, with a policy to fund pension liabilities in accordance with the limits imposed by the Employee Retirement Income Security Act of 1974, or ERISA, and Federal income tax laws. Annual contributions are made to an individual employee’s pension account based on their length of service with us and base salary, up to certain limits imposed by Federal and state income tax laws. Employees become eligible to participate in the defined benefit plan after their first 30 days of employment and an employee’s interest in their plan account vests after three years of employment, with the exception of certain circumstances.
PBF Energy Restoration Plan. We sponsor a non-qualified plan for non-union employees, including our named executive officers. Contributions, which are made at our discretion, are made to an individual employee’s pension restoration account based on their total cash compensation over a defined period of time. Employees become eligible to participate in the non-qualified plan after their first 30 days of employment and an employee’s interest in their plan account vests after one year of employment, with the exception of certain circumstances. An employee’s pension restoration account vests immediately and is non-forfeitable upon the attainment of age 65.
Summary of PBF LLC Series B Units
Certain of our officers currently hold PBF LLC Series B Units, which are profits interests. Profits interests have no taxable value at the date of issuance, and are designed to be an interest in the profits of PBF LLC after the date of issuance.
124
Table of Contents
Under the amended and restated limited liability company agreement of PBF LLC, following this offering distributions initially are made to the holders of PBF LLC Series A Units and PBF LLC Series C Units in proportion to the number of units owned by them. Once the financial sponsors receive a full return of their capital contributions with respect to their PBF LLC Series A Units, distributions and other payments made on account of the PBF LLC Series A Units held by our financial sponsors will then be shared by our financial sponsors with the holders of PBF LLC Series B Units in accordance with the sharing percentages described below. Accordingly, the amounts paid to the holders of PBF LLC Series B Units will reduce only the amounts otherwise payable to the PBF LLC Series A Units held by our financial sponsors, and will not reduce or otherwise impact any amounts payable to PBF Energy (the holder of our PBF LLC Series C Units), the holders of our Class A common stock or any other holder of PBF LLC Series A Units. However, our consolidated statements of operations and comprehensive income (loss) reflect non-cash charges for compensation related to the PBF LLC Series B Units.
As of the date of this prospectus, there are 1,000,000 PBF LLC Series B Units issued and outstanding, which are held as follows: Thomas O’Malley—350,000 (35%); Thomas Nimbley—160,000 (16%); Matthew Lucey—60,000 (6%); Donald Lucey—160,000 (16%); Michael Gayda—160,000 (16%); and other officers—110,000 (11%). All distributions to the holders of PBF LLC Series B Units will be made pro rata, subject to vesting.
The amended and restated limited liability company agreement of PBF LLC provides that no holder of PBF LLC Series B Units will receive any distributions made by PBF LLC (other than certain tax distributions) until each of our financial sponsors holding PBF LLC Series A Units receives the aggregate amount invested for such PBF LLC Series A Units. Following the return to each of our financial sponsors of the aggregate amount invested for such holder’s PBF LLC Series A Units, the PBF LLC Series B Units will be entitled to share in all distributions (including prior distributions other than return of amounts invested) made to such holder of PBF LLC Series A Units in amounts ranging on a sliding scale basis from 0% up to 10% based on the aggregate amount of distributions made to such holder of PBF LLC Series A Units. For example, if the aggregate amounts distributed to such holder of PBF LLC Series A Units is one and one-half times the aggregate amount invested for such PBF LLC Series A Units, the holders of PBF LLC Series B Units will be entitled to receive 2% of all distributions (including prior distributions other than return of amounts invested) made to such holder of PBF LLC Series A Units, and if the aggregate amount increases to two times, the sharing percentage will be 6%, and at two and one-half times, the sharing percentage will be 7%, at three times, the sharing percentage will be 8% and at four times and thereafter, the sharing percentage will be 10%.
If any amounts (other than tax distributions) are to be distributed in respect of any unvested PBF LLC Series B Units, such amounts shall be set aside for distribution to such holder at the time that such units vest. If such unvested PBF LLC Series B Units shall be forfeited by or repurchased from a holder without having vested, such amounts shall revert to certain holders of PBF LLC Series A Units. All amounts received, directly or indirectly, by our financial sponsors and the holders of PBF LLC Series B Units (and each of their successors and permitted transferees) in connection with their holding of units, including amounts received upon the sale of, or as a result of the ownership of, shares of Class A common stock following an exchange of units pursuant to the exchange agreement, upon a transfer of units by the financial sponsors to an unrelated third party or upon an in-kind distribution to their limited partners, pursuant to the tax receivable agreement or as a result of any assignment or transfer of any rights or entitlements thereunder, or otherwise as a result of such holder’s ownership of PBF LLC Series A Units or PBF LLC Series B Units, as applicable, are treated as being distributed, and treated as a distribution, for purposes of the amounts payable to the holders of PBF LLC Class B Units. Any payments required to be made to the holders of PBF LLC Series B Units by our financial sponsors shall be made in cash. Payments made to any of our financial sponsors pursuant to the tax receivable agreement shall be taken into account for purposes of satisfying the applicable sharing thresholds of the holders of PBF LLC Series B Units under the amended and restated limited liability company agreement of PBF LLC. All distributions under the amended and restated limited liability company agreement are treated as being distributed in a single distribution. Accordingly, if multiple distributions are made, the holders of PBF LLC Series B Units shall be entitled to share in the distributions at the highest then applicable sharing percentage, and if such holders have received prior distributions at a lower sharing percentage, such holders shall be entitled to a priority catch-up distribution at the
125
Table of Contents
applicable higher sharing percentage before any further amounts are distributed to such holders of PBF LLC Series A Units. Any amounts received as tax distributions made by PBF LLC shall be treated as an advance on and shall reduce further distributions to which such holder otherwise would be entitled to under the agreement.
One quarter of the PBF LLC Series B Units vested at the time of grant in June 2010 and the remaining three-quarters vest in equal annual installments on the first, second and third anniversary of grant, subject to accelerated vesting upon certain events described below. Any unvested PBF LLC Series B Units of a holder automatically vest upon a change of control or upon such holder’s death or disability, and all vested and unvested PBF LLC Series B Units of a holder are automatically forfeited upon such holder’s termination for cause. In addition, if a holder’s employment is terminated by us without cause or by the holder for good reason, PBF Energy, in consultation with the Executive Chairman, may accelerate the vesting of all or a portion of such holder’s unvested PBF LLC Series B Units. See “—Potential Payments Upon Termination Occurring on December 31, 2011, Including in Connection With a Change In Control” for further information.
If the employment of a holder of PBF LLC Series B Units is terminated by us for any reason other than due to death, disability or retirement, our financial sponsors will have the right to purchase for cash all or part of the holder’s PBF LLC Series B Units for the fair market value of such units as of the purchase date. In addition, upon the death or disability of a holder of PBF LLC Series B Units, the holder (or his representatives) will have the right to sell to our financial sponsors, and our financial sponsors will be required to purchase (pro rata), all of the holder’s PBF LLC Series B Units for the fair market value of such units as of the purchase date, with the purchase price payable, at the election of the purchaser, in cash or by delivery of PBF LLC Series A Units held by the purchaser.
Our board of directors has adopted the PBF Energy Inc. 2012 Equity Incentive Plan, which will be the source of new equity-based and cash-based awards for us following this offering. See “—2012 Equity Incentive Plan.”
2012 Equity Incentive Plan
We adopted and obtained stockholder approval of the PBF Energy Inc. 2012 Equity Incentive Plan, or the 2012 Equity Incentive Plan, prior to this offering. The following description of the 2012 Equity Incentive Plan is a summary of the material features of the plan, and this summary is not complete and is qualified by reference to the 2012 Equity Incentive Plan. The 2012 Equity Incentive Plan will be the source of new equity-based and cash-based awards permitting us to grant to our key employees, directors and consultants incentive stock options (within the meaning of Section 422 of the Internal Revenue Code of 1986, as amended, or the Code), non-qualified stock options, stock appreciation rights, restricted stock, other awards valued in whole or in part by reference to shares of our Class A common stock and performance based awards denominated in shares or cash.
Administration. Our compensation committee will administer the 2012 Equity Incentive Plan. Our compensation committee may delegate its authority under the 2012 Equity Incentive Plan in whole or in part as it determines to a subcommittee consisting solely of at least two non-employee directors within the meaning of Rule 16b-3 of the Exchange Act, “independent directors” within the meaning of the NYSE listed company rules and “outside directors” within the meaning of Section 162(m) of the Code, to the extent any such provisions or rules are applicable to us and the 2012 Equity Incentive Plan. Our compensation committee will determine who will receive awards under the 2012 Equity Incentive Plan, as well as the form of the awards, the number of shares underlying the awards, and the terms and conditions of the awards consistent with the terms of the 2012 Equity Incentive Plan. Our compensation committee will have full authority to interpret and administer the 2012 Equity Incentive Plan, which determinations will be final and binding on all parties concerned.
Shares Subject to the 2012 Equity Incentive Plan. The total number of shares of our Class A common stock which may be issued under the 2012 Equity Incentive Plan is 5,000,000, subject to adjustment upon certain events specified in the 2012 Equity Incentive Plan. We will make available the number of shares of our Class A common stock necessary to satisfy the maximum number of shares that may be issued under the 2012 Equity
126
Table of Contents
Incentive Plan. The shares of our Class A common stock underlying any award granted under the 2012 Equity Incentive Plan that expire unexercised, terminate or are forfeited or cancelled without the delivery of shares, or are tendered to satisfy the exercise price of any award granted under the 2012 Equity Incentive Plan, in each case, will again become available for awards under the 2012 Equity Incentive Plan. Notwithstanding the foregoing, but subject to adjustment upon certain events specified in the 2012 Equity Incentive Plan, no more than 5,000,000 shares that can be delivered under the 2012 Equity Incentive Plan may be deliverable pursuant to the exercise of incentive stock options, and, subject to adjustment upon certain events specified in the 2012 Equity Incentive Plan, the maximum number of shares with respect to which options or stock appreciation rights may be granted to an individual grantee in any fiscal year of the Company shall be 1,500,000. No award may be granted under the 2012 Equity Incentive Plan after the tenth anniversary of the effective date of the plan, but awards granted prior to such date may extend beyond such tenth anniversary.
Stock Options and Stock Appreciation Rights. Our compensation committee may award non-qualified or incentive stock options under the 2012 Equity Incentive Plan. Stock options granted under the 2012 Equity Incentive Plan will become vested and exercisable at such times and upon such terms and conditions as may be determined by our compensation committee at the time of grant, but an option will generally not be exercisable for a period of more than ten years after it is granted.
Except with respect to substitute awards, the exercise price per share for any stock option awarded will not be less than the fair market value of a share of our Class A common stock on the day the stock option is granted. Except as otherwise provided in an award agreement, the purchase price for the shares as to which an option is exercised shall be paid in full at the time of exercise at the election of the grantee in cash or its equivalent (e.g., by check), under certain circumstances by transferring shares of Class A common stock, through cashless exercise, net exercise, or such other method as our compensation committee may determine. Repricing of options and stock appreciation rights is prohibited without prior approval of the stockholders.
Our compensation committee may grant stock appreciation rights independent of or in conjunction with a stock option. The exercise price of a stock appreciation right will not be less than the fair market value of a share of our Class A common stock on the date the stock appreciation right is granted; except that, in the case of a stock appreciation right granted in conjunction with a stock option, the exercise price will not be less than the exercise price of the related stock option.
Other Awards. Our compensation committee, in its sole discretion, may grant or sell shares of our Class A common stock, restricted stock, restricted stock units and awards that are valued in whole or in part by reference to, or are otherwise based on the fair market value of, shares of our Class A common stock as well as make awards of cash. Any of these other awards may be in such form, and dependent on such conditions, as our compensation committee determines, including, without limitation, the right to receive, or vest with respect to, one or more shares of our Class A common stock (or the equivalent cash value of such shares of our Class A common stock) upon the completion of a specified period of service, the occurrence of an event and/or the attainment of performance objectives. Our compensation committee may in its discretion determine whether other awards will be payable in cash, shares of our Class A common stock, or a combination of both cash and shares.
Performance Based Awards. Our compensation committee, in its sole discretion, may grant certain awards (other than, and in addition to, grants of stock options and stock appreciation rights) that are denominated in shares or cash, that are designed to be deductible by us under Section 162(m) of the Code. Such awards, “performance-based awards,” will be subject to the terms and conditions established by our compensation committee and will be based upon one or more of the following objective performance criteria: (1) consolidated income before or after taxes (including income before interest, taxes, depreciation and amortization); (2) EBITDA; (3) Adjusted EBITDA; (4) operating income; (5) net income; (6) net income and/or earnings per share; (7) book value per share; (8) return on capital and/or equity; (9) expense management; (10) return on investment; (11) improvements in capital structure; (12) profitability of an identifiable business unit or product; (13) maintenance or improvement of profit margins; (14) stock price; (15) market share; (16) revenue or sales; (17) costs; (18) cash flow; (19) working capital; (20) multiple of invested capital; (21) total return;
127
Table of Contents
(22) environmental, health and safety; (23) operating performance; (24) commercial optimization; or (25) except for awards granted to any “covered employee” that are intended by us to be deductible by us under Section 162(m) of the Code, such other objective performance criteria as determined by our compensation committee in its sole discretion. The criteria may relate to us, one or more of our subsidiaries or one or more of our divisions or units, or any combination of the foregoing, and may be applied on an absolute basis and/or be relative to one or more peer group companies or indices, or any combination thereof, as our compensation committee shall determine. Our compensation committee will determine whether, with respect to a performance period, the applicable performance goals have been met with respect to a given participant and, if they have, during any period when Section 162(m) of the Code is applicable to us, will so certify and ascertain the amount of the applicable performance-based award. During any period when Section 162(m) of the Code is applicable to us, no performance-based awards will be paid to any participant for a given period of service until our compensation committee certifies that the objective performance goals (and any other material terms) applicable to such period have been satisfied. The amount of the performance-based award actually paid to a given participant may be less than the amount determined by the applicable performance goal formula, at the discretion of our compensation committee. The amount of the performance-based award determined by our compensation committee for a performance period will be paid to the participant at such time as determined by our compensation committee in its sole discretion after the end of such performance period. The maximum amount of performance-based awards that may be granted during a fiscal year to any participant will be, subject to adjustment upon certain events specified in the 2012 Equity Incentive Plan, (i) with respect to performance-based awards that are denominated in shares, 750,000 shares, and (ii) with respect to performance-based awards or other awards that are denominated in cash, $10.0 million.
Adjustments upon Certain Events. In the event of any equity split, spin off, equity distribution or dividend (other than regular cash dividends or distributions), equity combination, reclassification, recapitalization, liquidation, dissolution, reorganization, merger, consolidation or similar event that our compensation committee determines in its sole discretion affects our capitalization, our compensation committee shall adjust appropriately (1) the number and kind of shares (or other securities) subject to the 2012 Equity Incentive Plan and available for or covered by awards, (2) share prices related to outstanding awards, and (3) make such other revisions or substitutions to outstanding awards, in each case, as it deems are equitably required.
Upon a Change in Control. Unless provided otherwise in an award agreement or otherwise determined at any time by our compensation committee in its sole discretion, upon a termination of a participant’s employment by the participant for good reason (as defined in the 2012 Equity Incentive Plan) or by the Company without cause (as defined in the 2012 Equity Incentive Plan), in each case, within 24 months of the occurrence of a change in control of us (as defined in the 2012 Equity Incentive Plan), the 2012 Equity Incentive Plan provides that (1) if determined by our compensation committee in the applicable award agreement or otherwise, any outstanding awards then held by participants which are unexercisable or otherwise unvested or subject to lapse restrictions will automatically be deemed exercisable or otherwise vested or no longer subject to lapse restrictions, as the case may be, as of immediately prior to such change in control and (2) our compensation committee shall take one or more of the following actions: (a) cancel the awards for fair consideration (as determined by our compensation committee), (b) provide for the issuance of substitute awards that will substantially preserve the otherwise applicable terms of any affected awards previously granted under the 2012 Equity Incentive Plan, including without limitation, any applicable vesting conditions, or (c) provide that, with respect to any awards that are stock options or stock appreciation rights, the awards will be exercisable for a period of at least 15 days prior to the change in control.
Forfeiture and Clawback. Our compensation committee may, in its sole discretion, specify in an award that the participant’s rights, payments, and benefits with respect to such award will be subject to reduction, cancellation, forfeiture or recoupment upon the occurrence of certain specified events, in addition to any otherwise applicable vesting or performance conditions contained in such award. Such events may include, but are not limited to, termination of employment for cause, termination of the participant’s provision of services to us, breach of noncompetition, confidentiality, or other restrictive covenants that may apply to the participant, or restatement of our financial statements to reflect adverse results from those previously released financial
128
Table of Contents
statements as a consequence of errors, omissions, fraud, or misconduct. Awards shall also be subject to clawback, reduction, cancellation, forfeiture or recoupment to the extent necessary to comply with applicable law.
Transferability. Unless otherwise determined by our compensation committee, no award granted under the 2012 Equity Incentive Plan will be transferable or assignable by a participant in the plan, other than by will or by the laws of descent and distribution.
Amendment and Termination. Our board of directors may amend, suspend or terminate the 2012 Equity Incentive Plan except that no such action, other than certain adjustments and related actions specified in the 2012 Equity Incentive Plan, may be taken which would, without stockholder approval to the extent required by law, or to the extent necessary to comply with the performance-based compensation section under Section 162(m) of the Code, increase the aggregate number of shares available for awards under the 2012 Equity Incentive Plan, decrease the price of outstanding awards, change the requirements relating to the compensation committee as set forth in the 2012 Equity Incentive Plan, or extend the term of the 2012 Equity Incentive Plan. The compensation committee may also amend outstanding awards, consistent with the plan, provided that no modifications will be made that are adverse to the participant in any material respect without the consent of the participant, unless such modification is otherwise provided for under the terms of the 2012 Equity Incentive Plan or the award.
Impact of Tax and Accounting Principles
The forms of our executive compensation are largely dictated by our capital structure and have not been designed to achieve any particular accounting treatment. We do take tax considerations into account, both to avoid tax disadvantages and to obtain tax advantages, where reasonably possible consistent with our compensation goals (tax advantages for our executives benefit us by reducing the overall compensation we must pay to provide the same after-tax income to our executives), including the application of Sections 280G and 409A of the Code.
Section 162(m) of the Code (as interpreted by IRS Notice 2007-49) imposes a $1,000,000 cap on federal income tax deductions for compensation paid to our chief executive officer and to the three other most highly-paid executive officers (other than the principal financial officer) or such other persons which may be deemed covered persons under Section 162(m) during any fiscal year unless the compensation is “performance-based” under Section 162(m). Under a special Section 162(m) provision for newly public companies, compensation paid pursuant to a compensation plan or arrangement in existence before the effective date of this initial public offering, provided the arrangement is adequately described in this prospectus, will not be subject to the $1,000,000 limitation during a reliance period that ends on the earliest of: (1) the expiration of the compensation plan, (2) a material modification of the compensation plan (as determined under Section 162(m)), (3) the issuance of all the employer stock and other compensation allocated under the compensation plan, or (4) the first meeting of stockholders at which directors are elected after the close of the third calendar year following the year in which the public offering occurs. With respect to stock-based compensation, this provision applies to stock options, stock appreciation rights and the substantial vesting of restricted property granted before the end of the reliance period, even if not paid until after the end of the reliance period. While our compensation committee has not adopted a formal policy regarding tax deductibility of compensation paid to our named executive officers, following this initial public offering our compensation committee intends to consider the tax treatment of compensation pursuant to Section 162(m) and other applicable rules in determining the amounts of compensation
for our named executive officers. However, to retain highly skilled executives and remain competitive with other employers, our compensation committee retains the right to authorize compensation on a purely discretionary basis, including compensation that would not be deductible under Section 162(m) or otherwise.
Employment Agreements
We believe that employment agreements with our executives are necessary to attract and retain key talent. They provide a minimum level of stability to our executives in the event of certain terminations and/or the
129
Table of Contents
occurrence of a change in control of our business, freeing the executive to focus on our business rather than personal financial concerns.
Thomas D. O’Malley
Upon completion of this offering, we are entering into an amended and restated employment agreement with Thomas D. O’Malley, pursuant to which Mr. O’Malley serves as our Executive Chairman of the Board of Directors. This amended and restated agreement supersedes our prior employment agreement with Mr. O’Malley. The employment term is one year with automatic one year extensions thereafter, unless either we or Mr. O’Malley provide 30 days’ prior notice of an election not to renew the agreement.
Under the agreement, Mr. O’Malley is entitled to receive an annual base salary of $1,500,000. Mr. O’Malley is entitled to increases in his annual base salary at the sole discretion of our board. Mr. O’Malley is also eligible to participate in our annual cash incentive plan and earn an annual bonus award. Mr. O’Malley also participates in our incentive programs and is also entitled to grants of equity based compensation, as discussed above. Mr. O’Malley is also entitled to participate in our employee benefit plans in which our employees are eligible to participate, other than any severance plan generally offered to all of our employees, on the same basis as those benefits are generally made available to other senior executives. Mr. O’Malley is also entitled to reimbursement for business travel using his personal aircraft. See “Certain Relationships and Related Transactions—Private Aircraft.”
The termination provisions in Mr. O’Malley’s employment agreement are discussed under “—Potential Payments Upon Termination Occurring on December 31, 2011, Including in Connection With a Change In Control” below. In addition, the amended and restated agreement modifies the definition of Change in Control, provides for severance in the event the agreement is not renewed by us in connection with a Change in Control, and provides, that in the event of a Change in Control, the payments made under the employment agreement will be reduced under certain circumstances in order to avoid any required excise tax under Section 4999 of the Code.
Mr. O’Malley is also subject to a covenant not to disclose our confidential information during his employment term and at all times thereafter and covenants not to compete with us and not to solicit our employees during his employment term and for six months following termination of his employment for any reason, subject to certain exceptions.
Thomas J. Nimbley
Upon completion of this offering, we are entering into an amended and restated employment agreement with Thomas J. Nimbley, pursuant to which Mr. Nimbley serves as our Chief Executive Officer. This amended and restated agreement supersedes our prior employment agreement with Mr. Nimbley. The employment term is one year with automatic one year extensions thereafter, unless either we or Mr. Nimbley provide 30 days’ prior notice of an election not to renew the agreement.
Under the agreement, Mr. Nimbley is entitled to receive an annual base salary of $750,000. Mr. Nimbley is entitled to increases in his annual base salary at the sole discretion of our board. Mr. Nimbley is also eligible to participate in our annual cash incentive plan. Mr. Nimbley also participates in our incentive programs and is also entitled to grants of equity based compensation, as discussed above. Mr. Nimbley is also entitled to participate in our employee benefit plans in which our employees are eligible to participate, other than any severance plan generally offered to all of our employees, on the same basis as those benefits are generally made available to other senior executives.
The termination provisions in Mr. Nimbley’s employment agreement are discussed under “—Potential Payments Upon Termination Occurring on December 31, 2011, Including in Connection With a Change In Control” below. In addition, the amended and restated agreement modifies the definition of Change in Control,
130
Table of Contents
provides for severance in the event the agreement is not renewed in connection with a Change in Control, and provides that, in the event of a Change in Control, the payments made under the employment agreement will be reduced under certain circumstances in order to avoid any required excise tax under Section 4999 of the Code.
Mr. Nimbley is also subject to a covenant not to disclose our confidential information during his employment term and at all times thereafter and covenants not to compete with us and not to solicit our employees during his employment term and for six months following termination of his employment for any reason, subject to certain exceptions.
Matthew C. Lucey
Upon completion of this offering, we are entering into an amended and restated employment agreement with Matthew C. Lucey, pursuant to which Mr. Lucey serves as our Senior Vice President, Chief Financial Officer. This amended and restated agreement supersedes our prior employment agreement with Mr. Lucey. The employment term is one year with automatic one year extensions thereafter, unless either we or Mr. Lucey provide 30 days’ prior notice of an election not to renew the agreement.
Under the agreement, Mr. Lucey is entitled to receive an annual base salary of $450,000. Mr. Lucey is entitled to increases in his annual base salary at the sole discretion of our board. Mr. Lucey is also eligible to participate in our annual cash incentive plan. Mr. Lucey also participates in our incentive programs and is also entitled to grants of equity based compensation, as discussed above. Mr. Lucey is also entitled to participate in our employee benefit plans in which our employees are eligible to participate, other than any severance plan generally offered to all of our employees, on the same basis as those benefits are generally made available to other senior executives.
The termination provisions in Mr. Lucey’s employment agreement are discussed under “—Potential Payments Upon Termination Occurring on December 31, 2011, Including in Connection With a Change In Control” below. In addition, the amended and restated agreement modifies the definition of Change in Control, provides for severance in the event the agreement is not renewed in connection with a Change in Control, and provides that, in the event of a Change in Control, the payments made under the employment agreement will be reduced under certain circumstances in order to avoid any required excise tax under Section 4999 of the Code.
Mr. Lucey is also subject to a covenant not to disclose our confidential information during his employment term and at all times thereafter and covenants not to compete with us and not to solicit our employees during his employment term and for six months following termination of his employment for any reason, subject to certain exceptions.
Donald F. Lucey
Upon completion of this offering, we are entering into an amended and restated employment agreement with Donald F. Lucey, pursuant to which Mr. Lucey serves as our Executive Vice President, Chief Commercial Officer. This amended and restated agreement supersedes our prior employment agreement with Mr. Lucey. The employment term is one year with automatic one year extensions thereafter, unless either we or Mr. Lucey provide 30 days’ prior notice of an election not to renew the agreement.
Under the agreement, Mr. Lucey is entitled to receive an annual base salary of $625,000. Mr. Lucey is entitled to increases in his annual base salary at the sole discretion of our board. Mr. Lucey is also eligible to participate in our annual cash incentive plan. Mr. Lucey also participates in our incentive programs and is also entitled to grants of equity based compensation, as discussed above. Mr. Lucey is also entitled to participate in our employee benefit plans in which our employees are eligible to participate, other than any severance plan generally offered to all of our employees, on the same basis as those benefits are generally made available to other senior executives.
131
Table of Contents
The termination provisions in Mr. Lucey’s employment agreement are discussed under “—Potential Payments Upon Termination Occurring on December 31, 2011, Including in Connection With a Change In Control” below. In addition, the amended and restated agreement modifies the definition of Change in Control, provides for severance in the event the agreement is not renewed in connection with a Change in Control, and provides that, in the event of a Change in Control, the payments made under the employment agreement will be reduced under certain circumstances in order to avoid any required excise tax under Section 4999 of the Code.
Mr. Lucey is also subject to a covenant not to disclose our confidential information during his employment term and at all times thereafter and covenants not to compete with us and not to solicit our employees during his employment term and for six months following termination of his employment for any reason, subject to certain exceptions.
Michael D. Gayda
Upon completion of this offering, we are entering into an amended and restated employment agreement with Michael D. Gayda, pursuant to which Mr. Gayda, commencing on June 2, 2010, serves as our President. This amended and restated agreement supersedes our prior employment agreement with Mr. Gayda. The employment term is one year with automatic one year extensions thereafter, unless either we or Mr. Gayda provide 30 days’ prior notice of an election not to renew the agreement.
Under the agreement, Mr. Gayda is entitled to receive an annual base salary of $675,000. Mr. Gayda is entitled to increases in his annual base salary at the sole discretion of our board. Mr. Gayda is also eligible to participate in our annual cash incentive plan. Mr. Gayda also participates in our incentive programs and is also entitled to grants of equity based compensation, as discussed above. Mr. Gayda is also entitled to participate in our employee benefit plans in which our employees are eligible to participate, other than any severance plan generally offered to all of our employees, on the same basis as those benefits are generally made available to other senior executives.
The termination provisions in Mr. Gayda’s employment agreement are discussed under “—Potential Payments Upon Termination Occurring on December 31, 2011, Including in Connection With a Change In Control” below. In addition, the amended and restated agreement modifies the definition of Change in Control, provides for severance in the event the agreement is not renewed in connection with a Change in Control, and provides that, in the event of a Change in Control, the payments made under the employment agreement will be reduced under certain circumstances in order to avoid any required excise tax under Section 4999 of the Code.
Mr. Gayda is also subject to a covenant not to disclose our confidential information during his employment term and at all times thereafter and covenants not to compete with us and not to solicit our employees during his employment term and for six months following termination of his employment for any reason, subject to certain exceptions.
132
Table of Contents
2011 Summary Compensation Table
This Summary Compensation Table summarizes the total compensation paid or earned by each of our named executive officers for the fiscal year ended December 31, 2011.
| Name and Principal Position |
Year | Salary ($)(1) |
Bonus ($) |
Stock Awards ($)(2) |
Options Awards ($)(3) |
Change in Pension Value And Nonqualified Deferred Compensation Earnings ($)(4) |
All Other Compensation ($)(5) |
Total ($) |
||||||||||||||||||||||||
| Thomas D. O’Malley |
2011 | 1,500,000 | 6,097,500 | — | 543,000 | 220,711 | 10,950 | 8,372,161 | ||||||||||||||||||||||||
| Executive Chairman of |
||||||||||||||||||||||||||||||||
| the Board of Directors |
||||||||||||||||||||||||||||||||
| Thomas J. Nimbley |
2011 | 700,000 | 2,845,500 | 51,100 | 108,600 | 77,504 | 14,700 | 3,797,404 | ||||||||||||||||||||||||
| Chief Executive Officer |
||||||||||||||||||||||||||||||||
| Matthew C. Lucey |
2011 | 425,000 | 1,727,625 | 51,100 | 59,150 | 46,717 | 14,700 | 2,342,292 | ||||||||||||||||||||||||
| Senior Vice President, |
||||||||||||||||||||||||||||||||
| Chief Financial Officer |
||||||||||||||||||||||||||||||||
| Donald F. Lucey |
2011 | 600,000 | 2,439,000 | 51,100 | 36,200 | 80,314 | 14,700 | 3,221,314 | ||||||||||||||||||||||||
| Executive Vice President, |
||||||||||||||||||||||||||||||||
| Chief Commercial Officer |
||||||||||||||||||||||||||||||||
| Michael D. Gayda |
2011 | 650,000 | 2,642,250 | 51,100 | 36,200 | 77,186 | 14,700 | 3,471,436 | ||||||||||||||||||||||||
| President |
||||||||||||||||||||||||||||||||
| (1) | The annual salaries of Messrs. Nimbley, M. Lucey, D. Lucey and Gayda increased by $50,000, $25,000, $25,000 and $25,000, respectively, for 2012. |
| (2) | The amounts set forth in this column represent the grant date fair value of PBF LLC Series B Units allocated in 2011 as calculated pursuant to FASB ASC Topic 718. The amounts have been determined based on the assumptions set forth in Note 12 to the PBF LLC Consolidated financial statements for the year ended December 31, 2011. |
| (3) | The amounts set forth in this column represent the grant date fair value of options for the purchase of PBF LLC Series A Units granted to Mr. M. Lucey and compensatory warrants for the purchase of PBF LLC Series A Units granted to the named executive officers in connection with their purchase of PBF LLC Series A Units. The grant date fair value was calculated pursuant to FASB ASC Topic 718 based on the assumptions set forth in Note 12 to the PBF LLC Consolidated financial statements for the year ended December 31, 2011. |
| (4) | The amounts set forth in this column represent the aggregate change during the year in the actuarial present value of accumulated benefits under the PBF Energy Pension Plan and the PBF Energy Restoration Plan. |
| (5) | The amounts set forth in this column consist of company matching contributions to our 401(k) Plan. |
133
Table of Contents
Grants of Plan-Based Awards in 2011
The following table provides information regarding the grants of plan-based awards to each of our named executive officers for the fiscal year ended December 31, 2011.
| Name | Grant Date | All Other Stock Awards: Number of Shares of Stock or Units (#)(1) |
All Other Option Awards: Number of Securities Underlying Options (#)(2) |
Exercise or Base Price of Option Awards ($/Sh) |
Grant Date Fair Value of Stock and Option Awards($)(3) |
|||||||||||||
| Thomas D. O’Malley |
January 31, 2011 | — | 300,000 | 10.00 | 543,000 | |||||||||||||
| Thomas J. Nimbley |
March 1, 2011 | — | 60,000 | 10.00 | 108,600 | |||||||||||||
| May 19, 2011 | 10,000 | — | — | 51,100 | ||||||||||||||
| Matthew C. Lucey |
March 1, 2011 | — | 2,679 | 10.00 | 4,850 | |||||||||||||
| March 4, 2011 | — | 30,000 | 10.00 | 54,300 | ||||||||||||||
| May 19, 2011 | 10,000 | — | — | 51,100 | ||||||||||||||
| Donald F. Lucey |
March 1, 2011 | — | 20,000 | 10.00 | 36,200 | |||||||||||||
| May 19, 2011 | 10,000 | — | — | 51,100 | ||||||||||||||
| Michael D. Gayda |
March 1, 2011 | — | 20,000 | 10.00 | 36,200 | |||||||||||||
| May 19, 2011 | 10,000 | — | — | 51,100 | ||||||||||||||
| (1) | As described in Footnote 1 to the Summary Compensation Table, amounts in this column represent the number of PBF LLC Series B Units allocated to the named executive officers in 2011. |
| (2) | As described in Footnote 2 to the Summary Compensation Table, amounts in this column represent compensatory warrants and options to purchase PBF LLC Series A Units. |
| (3) | The amounts set forth in this column represent the total grant date fair value of (a) compensatory warrants and options to purchase PBF LLC Series A Units and (b) the PBF LLC Series B Units for each of the named executive officers, calculated in accordance with FASB ASC Topic 718. |
Narrative Disclosure to 2011 Summary Compensation Table and Grants of Plan-Based Awards in 2011 Table
PBF LLC Series A Compensatory Warrants and Options
In conjunction with the purchase of PBF LLC Series A Units and warrants to purchase PBF LLC Series A Units by our named executive officers and certain other employees, each purchaser of PBF LLC Series A Units and warrants received a grant of compensatory warrants to purchase PBF LLC Series A Units. The Series A Compensatory Warrants were fully vested at the time of grant and expire after ten years. 25% of the Series A Compensatory Warrants became exercisable at the grant date and the remaining 75% are exercisable over equal annual installments on each of the first three anniversaries of the grant date, subject to acceleration upon the closing of this initial public offering or under certain other circumstances. In 2011, options to purchase PBF LLC Series A Units were also granted to Mr. M. Lucey and certain other employees. The Series A options vest and become exercisable in equal annual installments on each of the first three anniversaries of the grant date. As of December 31, 2011, compensatory warrants and options to purchase 1,835,579 PBF LLC Series A Units were outstanding.
PBF LLC Series B Units
In 2011, our named executive officers and certain other officers were allocated equity incentive awards by PBF LLC in the form of PBF LLC Series B Units, which are profits interests in PBF LLC. One-quarter of the PBF LLC Series B Units vested at the time of grant in June 2010 and the remaining three-quarters vest in equal annual installments on the first, second and third anniversary of grant, subject to accelerated vesting upon certain events. As of December 31, 2011, there were 1,000,000 PBF LLC Series B Units allocated (of which 500,000 units were
134
Table of Contents
vested). Any unvested PBF LLC Series B Units of a holder automatically vest upon a change of control or upon such holder’s death or disability, and all vested and unvested PBF LLC Series B Units of a holder are automatically forfeited upon such holder’s termination for cause. In addition, if a holder’s employment is terminated by us without cause or by the holder for good reason, PBF Energy, in consultation with the Executive Chairman, may accelerate the vesting of all or a portion of such holder’s unvested PBF LLC Series B Units.
Outstanding Equity Awards At 2011 Fiscal Year-End
The following table provides information regarding outstanding equity awards of PBF LLC interests made to our named executive officers as of December 31, 2011.
| Option Awards(1) | Stock Awards(2) | |||||||||||||||||||||||
| Name |
Number of Securities Underlying Unexercised Options (#) Exercisable |
Number of Securities Underlying Unexercised Options (#) Unexercisable |
Option Exercise Price ($) |
Option Expiration Date |
Number of Shares or Units of Stock That Have Not Vested (#) |
Market Value of Shares or Units of Stock That Have Not Vested ($) |
||||||||||||||||||
| Thomas D. O’Malley |
86,010 | 86,010 | (3) | 10.00 | 6/1/2020 | 175,000 | 691,797 | |||||||||||||||||
| 15,000 | 15,000 | (3) | 10.00 | 10/15/2020 | — | — | ||||||||||||||||||
| 123,000 | 123,000 | (3) | 10.00 | 12/17/2020 | — | — | ||||||||||||||||||
| 75,000 | 225,000 | (3) | 10.00 | 1/31/2021 | — | — | ||||||||||||||||||
| Thomas J. Nimbley |
22,500 | 22,500 | (3) | 10.00 | 6/1/2020 | 80,000 | 316,250 | |||||||||||||||||
| 22,500 | 22,500 | (3) | 10.00 | 12/17/2020 | — | — | ||||||||||||||||||
| 15,000 | 45,000 | (3) | 10.00 | 3/1/2021 | — | — | ||||||||||||||||||
| Matthew C. Lucey |
1,950 | 1,950 | (3) | 10.00 | 6/1/2020 | 30,000 | 118,594 | |||||||||||||||||
| 900 | 900 | (3) | 10.00 | 12/17/2020 | — | — | ||||||||||||||||||
| 670 | 2,009 | (3) | 10.00 | 3/1/2021 | — | — | ||||||||||||||||||
| — | 30,000 | 10.00 | 3/4/2021 | — | — | |||||||||||||||||||
| Donald F. Lucey |
7,500 | 7,500 | (3) | 10.00 | 6/1/2020 | 80,000 | 316,250 | |||||||||||||||||
| 7,500 | 7,500 | (3) | 10.00 | 12/17/2020 | — | — | ||||||||||||||||||
| 5,000 | 15,000 | (3) | 10.00 | 3/1/2021 | — | — | ||||||||||||||||||
| Michael D. Gayda |
7,500 | 7,500 | (3) | 10.00 | 6/1/2020 | 80,000 | 316,250 | |||||||||||||||||
| 7,500 | 7,500 | (3) | 10.00 | 12/17/2020 | — | — | ||||||||||||||||||
| 5,000 | 15,000 | (3) | 10.00 | 3/1/2021 | — | — | ||||||||||||||||||
| (1) | The awards described in this table represent compensatory warrants and options to purchase PBF LLC Series A Units, as described in the narrative above. |
| (2) | The awards described in this table represent PBF LLC Series B Units, as described in the narrative above. The PBF LLC Series B Units are profits interests in PBF LLC and derived from the value of the PBF LLC Series A Units. Following this offering, the amounts paid to the holders of PBF LLC Series B Units will reduce only the amounts otherwise payable to the PBF LLC Series A Units held by our financial sponsors, and will not reduce or otherwise impact any amounts payable to PBF Energy (the holder of our PBF LLC Series C Units), the holders of our Class A common stock or any other holder of PBF LLC Series A Units. However, our statement of operations and comprehensive income (loss) reflects non-cash charges for compensation related to the profits interests. |
| (3) | The compensatory warrants to purchase PBF LLC Series A Units become fully exercisable upon the closing of this initial public offering. |
135
Table of Contents
Option Exercises and Stock Vested in 2011
The following table provides information regarding the amounts received by our named executive officers upon exercise of options or similar instruments or the vesting of stock or similar instruments during the fiscal year ended December 31, 2011. All of the awards described in this table were for equity interests in PBF LLC.
| Option Awards | Stock Awards | |||||||||||||||
| Name |
Number of Shares Acquired on Exercise (#) |
Value Realized
on Exercise ($) |
Number of Shares Acquired on Vesting (#) |
Value Realized
on Vesting ($)(1) |
||||||||||||
| Thomas D. O’Malley |
— | — | 87,500 | 691,797 | ||||||||||||
| Thomas J. Nimbley |
— | — | 42,500 | 316,250 | ||||||||||||
| Matthew C. Lucey |
— | — | 17,500 | 118,594 | ||||||||||||
| Donald F. Lucey |
— | — | 42,500 | 316,250 | ||||||||||||
| Michael D. Gayda |
— | — | 42,500 | 316,250 | ||||||||||||
| (1) | The awards described in this table represent PBF LLC Series B Units, as described in the narrative above. The PBF LLC Series B Units are profits interests in PBF LLC. Following this offering, the amounts paid to the holders of PBF LLC Series B Units will reduce only the amounts otherwise payable to the PBF LLC Series A Units held by our financial sponsors, and will not reduce or otherwise impact any amounts payable to PBF Energy (the holder of our PBF LLC Series C Units), the holders of our Class A common stock or any other holder of PBF LLC Series A Units. However, our statement of operations and comprehensive income (loss) reflects non-cash charges for compensation related to the profits interests. |
Pension Benefits
The following table provides information regarding our named executive officers’ participation in our pension plans as of and for the fiscal year ended December 31, 2011.
| Name |
Plan Name |
Number of Years Credited Service (#) |
Present Value of Accumulated Benefit ($) |
Payments During Last Fiscal Year ($) |
||||||||||
| Thomas D. O’Malley |
PBF Energy Pension Plan PBF Energy Restoration Plan |
|
3 3 |
|
|
107,136 709,743 |
|
|
— — |
| ||||
| Thomas J. Nimbley |
PBF Energy Pension Plan PBF Energy Restoration Plan |
|
1 1 |
|
|
47,940 67,875 |
|
|
— — |
| ||||
| Matthew C. Lucey |
PBF Energy Pension Plan PBF Energy Restoration Plan |
|
3 3 |
|
|
79,105 37,515 |
|
|
— — |
| ||||
| Donald F. Lucey |
PBF Energy Pension Plan PBF Energy Restoration Plan |
|
3 3 |
|
|
103,398 101,767 |
|
|
— — |
| ||||
| Michael D. Gayda |
PBF Energy Pension Plan PBF Energy Restoration Plan |
|
1 1 |
|
|
49,550 65,183 |
|
|
— — |
| ||||
The PBF Energy Pension Plan is a funded, tax-qualified, non-contributory defined benefit plan covering all employees. The PBF Energy Restoration Plan is a non-qualified defined benefit plan designed to supplement the pension benefits for highly compensated employees. The Pension Plan and the Restoration Plan are structured as cash balance plans wherein each participant’s account is credited monthly with an interest credit and annually with a pay credit. Changes in the value of these plans’ investments do not directly impact the benefit amounts promised to each participant under the plans.
136
Table of Contents
At the end of each plan year, the Pension Plan provides for an annual pay credit equal to between 7% and 11% of pensionable earnings below the Social Security Wage Base and a pay credit of 14% on pensionable earnings above the Social Security Wage Base but below the Internal Revenue Service benefit plan compensation limit. The Restoration Plan provides for an annual pay credit equal to 14% on pensionable earnings in excess of Internal Revenue Service benefit plan compensation limits. In addition, on a monthly basis, the plans provide for an interest credit utilizing the prior year’s October 30-year Treasury Constant Maturity rate. For 2011, the interest crediting rate was 3.45%. Normal retirement age under the plans is attained at age 65.
137
Table of Contents
Potential Payments Upon Termination Occurring on December 31, 2011, Including in Connection With a Change In Control
The table below provides our best estimate of the amounts that would be payable (including the value of certain benefits) to each of our named executive officers had a termination hypothetically occurred on December 31, 2011 under various scenarios, including a termination of employment associated with a Change In Control. The table does not include payments or benefits under arrangements available on the same basis generally to all other eligible employees of PBF. The potential payments were determined under the terms of each named executive officer’s employment agreement in effect on December 31, 2011 and in accordance with our plans and arrangements in effect on December 31, 2011. We also retain the discretion to provide additional payments or benefits to any of our named executive officers upon any termination of employment or Change in Control. The estimates below exclude the value of any Accrued Rights, as described in footnote 1 below, as any such amounts have been assumed to have been paid current at the time of the termination event.
Under the terms of each named executive officer’s employment agreement, the executive is precluded under certain circumstances from competing with us for a period of six months post-termination, and must enter into a release of claims in order to receive the severance described below.
| Termination (a) for Cause, (b) without Good Reason or (c) due to non-renewal by the executive ($)(1) |
Termination (other than in connection with a Change in Control), (a) without Cause (other than by reason of death or disability) by us, (b) for Good Reason or (c) due to non-renewal by us ($)(2) |
Termination in connection with a Change in Control ($)(3) |
Death or Disability ($)(4) |
|||||||||||||
| Thomas D. O’Malley |
||||||||||||||||
| Cash severance payment |
— | 2,250,000 | 4,485,000 | 750,000 | ||||||||||||
| Cash bonus (5) |
— | — | — | 6,097,500 | ||||||||||||
| Continuation of health benefits (6) |
— | — | — | — | ||||||||||||
| Accelerated equity (7) |
— | — | 2,137,609 | 691,797 | ||||||||||||
| Thomas J. Nimbley |
||||||||||||||||
| Cash severance payment |
— | 1,050,000 | 2,093,000 | 350,000 | ||||||||||||
| Cash bonus (5) |
— | — | — | 2,845,500 | ||||||||||||
| Continuation of health benefits (6) |
— | — | — | — | ||||||||||||
| Accelerated equity (7) |
— | — | 606,050 | 316,250 | ||||||||||||
| Matthew C. Lucey |
||||||||||||||||
| Cash severance payment |
— | 637,500 | 1,270,750 | 212,500 | ||||||||||||
| Cash bonus (5) |
— | — | — | 1,727,625 | ||||||||||||
| Continuation of health benefits (8) |
— | 36,253 | 70,492 | — | ||||||||||||
| Accelerated equity (7) |
— | 96,600 | 327,440 | 215,194 | ||||||||||||
| Donald F. Lucey |
||||||||||||||||
| Cash severance payment |
— | 900,000 | 1,794,000 | 300,000 | ||||||||||||
| Cash bonus (5) |
— | — | — | 2,439,000 | ||||||||||||
| Continuation of health benefits (6) |
— | — | — | — | ||||||||||||
| Accelerated equity (7) |
— | — | 412,850 | 316,250 | ||||||||||||
| Michael D. Gayda |
||||||||||||||||
| Cash severance payment |
— | 975,000 | 1,943,500 | 325,000 | ||||||||||||
| Cash bonus (5) |
— | — | — | 2,642,250 | ||||||||||||
| Continuation of health benefits (6) |
— | — | — | — | ||||||||||||
| Accelerated equity (7) |
— | — | 412,850 | 316,250 | ||||||||||||
138
Table of Contents
| (1) | Termination for Cause, without Good Reason or due to non-renewal by the executive. In the event the executive is terminated by us for Cause, the executive terminates his employment without Good Reason or the executive does not renew his employment with us at the end of his current term, the executive will be entitled to: (1) receive accrued, but unpaid salary through the date of termination; (2) receive any earned, but unpaid portion of the previous year’s cash bonus; (3) receive unreimbursed business expenses; (4) receive applicable benefits; and (5) except in the event of a termination for Cause, exercise any vested options in accordance with the terms of the long term incentive plan, or collectively, the Accrued Rights. |
“Good Reason” as defined in the employment agreements means, without the executive’s consent (A) the failure of the company to pay or cause to be paid the executive’s base salary or cash bonus, if any, when due, (B) any adverse, substantial and sustained diminution in the executive’s authority or responsibilities by the company from those described in the employment agreement, (C) the company requiring a change in the location for performance of the executive’s employment responsibilities to a location more than 50 miles from the company’s office (not including ordinary travel during the regular course of employment) or (D) any other action or inaction that constitutes a material breach by the company of the employment agreement; provided, that the events described in clauses (A), (B), (C) and (D) shall constitute “Good Reason” only if the company fails to cure such event within 20 days after receipt from the executive of written notice of the event which constitutes “Good Reason;” provided, further, that “Good Reason” shall cease to exist for an event described in clauses (A), (B), (C) and (D) on the 90th day following the later of its occurrence or the executive’s knowledge thereof, unless the executive has given the company written notice thereof prior to such date.
“Cause” as defined in the employment agreements includes the following: (A) the executive’s continued willful failure to substantially perform his duties (other than as a result of a disability) for a period of 30 days following written notice by the company to the executive of such failure, (B) the executive’s conviction of, or plea of nolo contendere to a crime constituting a misdemeanor involving moral turpitude or a felony, (C) the executive’s willful malfeasance or willful misconduct in connection with the executive’s duties under the employment agreement, including fraud or dishonesty against the company, or any of its affiliates, or any act or omission which is materially injurious to the financial condition or business reputation of the company, or any of its affiliates, other than an act or omission that was committed or omitted by the executive in the good faith belief that it was in the best interest of the company, (D) a breach of the executive’s representations and warranties in such employment agreement, or (E) the executive’s breach of the non-competition, non-solicitation, non-disparagement or non-disclosure provisions of the employment agreement.
| (2) | Termination (other than in connection with a Change in Control as described below), without Cause (other than by reason of death or disability) by us, for Good Reason or due to non-renewal by us. In the event the executive is terminated during the term of employment (other than in connection with a Change in Control as described in footnote (3) below), without Cause (other than by reason of death or disability) by us, for Good Reason or due to non-renewal by us, the executive will be entitled to: (1) the Accrued Rights; (2) a cash lump sum payment equal to 1.5 times base salary; and (3) the continuation of certain health benefits for 18 months. |
| (3) | Termination in connection with a Change in Control. In the event the executive is terminated by us without Cause (other than by reason of death or disability) or resigns with Good Reason, in each case six months prior to or within one year subsequent to the consummation of a Change in Control, the executive will be entitled to: (1) the Accrued Rights; (2) a cash lump sum payment equal to 2.99 times the executive’s salary in effect on the date of termination; (3) immediate vesting and exercisability of outstanding options or other grants under the long term incentive plan, warrants and PBF LLC Series B Units; and (4) the continuation of certain health benefits for two years and 11 months. |
139
Table of Contents
A “Change In Control” as defined in the employment agreements, is deemed to have occurred if:
| • | any of the following is consummated: (x) any consolidation, reorganization, merger or similar transaction (in one transaction or a series of related transactions) involving the company, other than a consolidation, reorganization, merger or similar transaction in which the voting power of the voting securities of the company immediately prior to such transaction constitute more than 50% of the combined voting power of the voting securities of the surviving entity, (y) any sale, lease, exchange or other transfer (in one transaction or a series of related transactions) of all or substantially all of the assets of the company, or (z) the liquidation or dissolution of the company; or |
| • | any person (as defined in sections 13(d) and 14(d)(2) of the Exchange Act) becomes the “beneficial owner” (as defined in Rule 13d-3 under the Exchange Act), directly or indirectly, of more than 50% of the voting power of the company outstanding at the time (in one or more related or unrelated transactions). |
| (4) | Death or Disability. In the event of death or disability, the named executive officer’s estate or the executive, as applicable, will be entitled to receive: (1) the Accrued Rights; (2) a pro rata portion of the executive’s cash bonus for the year in which such death or disability occurs; and (3) a cash lump sum payment equal to the greater of (A) one-half of the executive’s annual salary as in effect on the date of termination or (B) one-half of the aggregate amount of the executive’s salary that the executive would have received had the full term of employment occurred under the employment agreement. The amounts shown in this column as the cash severance payment represent one-half of the executive’s annual salary as of December 31, 2011. The actual amount payable upon death or disability could vary. |
| (5) | These amounts are equal to the named executive officer’s cash bonus award for 2011. The actual pro rata portion of an executive’s cash bonus for the year in which death or disability occurs is likely to be different. |
| (6) | Messrs. O’Malley, Nimbley, D. Lucey and Gayda would not have been eligible to receive any continued medical benefits from us as of December 31, 2011, as they were covered by previous employer’s medical plans. Our obligation to provide continuation coverage for these named executive officers may change in future years. |
| (7) | These amounts reflect for all of the named executive officers the value of the accelerated exercisability of the compensatory warrants and the accelerated vesting of the PBF LLC Series B Units as of December 31, 2011. In addition, these amounts reflect for Mr. M. Lucey the value of the accelerated vesting of options to purchase PBF LLC Series A Units as of December 31, 2011. |
| (8) | The continued health benefits cost for Mr. M. Lucey is based on our cost for his benefits as of December 31, 2011. |
IPO Date Stock Option Awards and Cash Bonus to Employees
At the time of this offering, we will grant awards of non-qualified stock options to purchase an aggregate of 675,000 shares of our Class A common stock pursuant to the 2012 Equity Incentive Plan to certain of our employees. The foregoing number of shares subject to such option awards includes 50,000 to Mr. Nimbley, 40,000 to Mr. M. Lucey, 40,000 to Mr. D. Lucey and 40,000 to Mr. Gayda. Each stock option to purchase our Class A common stock will have an exercise price equal to the initial public offering price per share. Subject to the option holder’s continued employment, options will vest in equal annual installments over a four year period, subject to acceleration under certain circumstances set forth in the applicable award agreement. Holders of stock options will not have any rights as a stockholder with respect to the shares underlying stock options until such options are exercised and shares of Class A common stock underlying the stock options are actually delivered.
In addition, we will pay cash bonuses in an aggregate amount of approximately $8.2 million to certain of our employees in connection with this offering. The foregoing amount includes $2,992,080 to Mr. O’Malley, $600,000 to Mr. Nimbley, $153,517 to Mr. M. Lucey, $200,000 to Mr. D. Lucey and $200,000 to Mr. Gayda.
140
Table of Contents
Compensation of Directors
Directors who are also our employees or representatives of our affiliates receive no separate compensation for service on our board of directors or committees thereof. We reimburse all of our directors for customary expenses incurred in connection with attending meetings of our board of directors and committees thereof. Following the consummation of this offering, our non-executive directors will be entitled to receive director fees as determined by our compensation committee.
During 2011, we paid our non-employee, independent directors (Messrs. Allen and Houston) an annual cash retainer of $50,000 each and $1,500 for each board meeting attended. Mr. Allen receives an additional annual retainer of $10,000 for his role as chairman of our audit committee and $1,500 for presiding over each audit committee meeting. Each non-employee, independent director also was granted options to purchase 25,000 PBF LLC Series A Units. The options granted to Mr. Allen were fully vested and exercisable upon grant and were exercised in full in December 2011, and the options granted to Mr. Houston vest in three equal annual installments starting on the first anniversary of the date of grant.
During 2012, we increased the annual cash retainer payable to our non-employee, independent directors (Messrs. Abraham, Allen and Houston) to $100,000 each effective August 2012, and granted each non-employee, independent director an additional $100,000 equity award in the form of 7,968 restricted PBF LLC Series A Units, which vest in three equal annual installments starting on the first anniversary of the date of grant, subject to acceleration under certain circumstances.
The following table summarizes all compensation for our non-employee directors for the fiscal year ended December 31, 2011.
| Name |
Fees Earned or Paid in Cash($) |
Option Awards($)(1) |
Total ($) |
|||||||||
| Jefferson F. Allen |
84,000 | 99,550 | 183,550 | |||||||||
| Dennis Houston |
39,667 | 45,250 | 84,917 | |||||||||
| (1) | The amounts set forth in this column represent the grant date fair value of options for the purchase of Series A Units in PBF LLC. The grant date fair value was calculated pursuant to FASB ASC Topic 718 based on the assumptions set forth in Note 12 to the PBF LLC Consolidated financial statements for the year ended December 31, 2011. |
141
Table of Contents
CERTAIN RELATIONSHIPS AND RELATED TRANSACTIONS
Each of the related party transactions described below was negotiated on an arm’s length basis. We believe that the terms of such agreements are as favorable as those we could have obtained from parties not related to us.
Our Relationship with Blackstone and First Reserve
Since our formation, each of Blackstone and First Reserve purchased an aggregate of 44,861,169 PBF LLC Series A Units at a purchase price of $10.00 per unit, or an aggregate purchase price of approximately $448.6 million each. Blackstone and First Reserve control ownership interests in a broad range of companies. We have entered into commercial transactions on arm’s length terms in the ordinary course of business with certain of these companies, including for the purchase of goods and services.
Stockholders Agreement
In connection with this offering, we will enter into a stockholders agreement with Blackstone and First Reserve. At the closing of this offering, our board of directors will have nine directors, of whom three will be designees of Blackstone and three will be designees of First Reserve. Under the stockholders agreement, each of Blackstone and First Reserve will have the right to nominate three directors to our board of directors so long as it owns 25% or more of the voting power of all shares of our capital stock entitled to vote generally in the election of directors, two directors for so long as it owns 15% or more, but less than 25% of the voting power of all shares of our capital stock entitled to vote generally in the election of directors, and one director so long as it owns 7.5% or more, but less than 15% of the voting power of all shares of our capital stock entitled to vote generally in the election of directors. Each of Blackstone and First Reserve will lose its right to nominate any directors to our board of directors once it owns less than 7.5% of the voting power of all shares of our capital stock entitled to vote generally in the election of directors. Blackstone and First Reserve have agreed to vote their shares in favor of the other’s nominees to the board of directors and to otherwise take actions to maintain board structure consistent with the stockholders agreement. In addition, in the event that a director designated by either Blackstone and First Reserve serves simultaneously on the board of directors (or similar governing body) of any other company engaged in the crude oil refining business in North America, unless our board otherwise requests or the designee resigns from the board of directors of such competitor, such designee shall resign from our board or otherwise be removed. In addition, the stockholders agreement grants to each of Blackstone and First Reserve, so long as it owns at least 7.5% of the voting power of all shares of our capital stock entitled to vote generally in the election of directors and maintains a designee on our board of directors, certain customary rights to receive information upon request, subject to their agreement to keep such information confidential and not to use it for any purpose other than in connection with their investment in us, and requires us to undertake certain actions in order to allow Blackstone and/or First Reserve to qualify as “venture capital operating companies” under ERISA if so required.
PBF LLC Limited Liability Company Agreement
As a result of the Offering Transactions, PBF Energy will hold PBF LLC Series C Units and will be the sole managing member of PBF LLC. Accordingly, PBF Energy will control all of the business and affairs of PBF LLC and its operating subsidiaries.
Prior to this offering, there were 92,281,716 PBF LLC Series A Units issued and outstanding, of which 44,861,169 units were owned by each of Blackstone and First Reserve, 2,535,473 units were owned by our remaining existing owners, including Mr. O’Malley, and 23,904 were restricted Series A Units held by our independent directors. In addition, there are 1,000,000 PBF LLC Series B Units issued and outstanding, all of which are held by certain of our officers. The PBF LLC Series B Units are profits interests which entitle the holders to participate in the profits of PBF LLC after the date of issuance. Certain of our existing owners and other employees hold options and warrants to purchase an additional 4,774,630 PBF LLC Series A Units at a weighted average exercise price of $10.26 per unit, 4,179,610 of which will be vested and exercisable as of the date of the closing of this offering.
142
Table of Contents
Immediately prior to this offering, the limited liability company agreement of PBF LLC will be amended and restated to, among other things, designate PBF Energy as the sole managing member of PBF LLC and establish the PBF LLC Series C Units which will be held solely by PBF Energy. The PBF LLC Series A Units will be held solely by our existing owners (and their permitted transferees). The PBF LLC Series C Units rank on a parity with the PBF LLC Series A Units as to distribution rights, voting rights and rights upon liquidation, dissolution or winding up. Following this offering, PBF Energy will have the right to determine the timing and amount of any distributions (other than tax distributions) to be made to holders of PBF LLC Series A Units and PBF LLC Series C Units. Profits and losses of PBF LLC will be allocated, and all distributions generally will be made, pro rata to the holders of PBF LLC Series A Units (subject, under certain circumstances described below, to the rights of the holders of PBF LLC Series B Units) and PBF LLC Series C Units. In addition, the amended and restated limited liability company agreement of PBF LLC provides that any PBF LLC Series A Units acquired by PBF Energy from our existing owners, whether at the time of this initial public offering or thereafter in accordance with the exchange agreement, will automatically, and without any further action, be reclassified as PBF LLC Series C Units in connection with such acquisition.
The PBF LLC Series B Units are profits interests held by certain of our officers which had no taxable value at the date of issuance, have no voting rights and are designed to increase in value only after our financial sponsors achieve certain levels of return on their investment in PBF LLC Series A Units. Under the limited liability company agreement of PBF LLC, distributions initially are made to the holders of PBF LLC Series A Units and PBF LLC Series C Units in proportion to the number of units owned by them. Once the financial sponsors receive a full return of their capital contributions with respect to their PBF LLC Series A Units, distributions and other payments made on account of the PBF LLC Series A Units held by our financial sponsors then will be shared by our financial sponsors with the holders of PBF LLC Series B Units. Accordingly, the amounts paid to the holders of PBF LLC Series B Units will reduce only the amounts otherwise payable to the PBF LLC Series A Units held by our financial sponsors, and will not reduce or otherwise impact any amounts payable to PBF Energy (the holder of our PBF LLC Series C Units), the holders of our Class A common stock or any other holder of PBF LLC Series A Units. For a further discussion of the PBF LLC Series B Units, please see “Executive Compensation—Compensation Discussion and Analysis—Summary of PBF LLC Series B Units.”
The holders of limited liability company interests in PBF LLC, including PBF Energy, will generally have to include for purposes of calculating their U.S. federal, state and local income taxes their share of any taxable income of PBF LLC. Taxable income of PBF LLC generally will be allocated to the holders of units (including PBF Energy) pro rata in accordance with their respective share of the net profits and net losses of PBF LLC. The amended and restated limited liability company agreement of PBF LLC will provide for tax distributions to the members of PBF LLC, including PBF Energy, subject to available cash and applicable law and contractual restrictions (including pursuant to our debt instruments) and based on certain assumptions. Generally, these tax distributions will be an amount equal to our estimate of the taxable income of PBF LLC multiplied by an assumed tax rate equal to the highest effective marginal combined U.S. federal, state and local income tax rate prescribed for an individual or corporate resident in New York, New York (taking into account the nondeductibility of certain expenses).
The limited liability company agreement of PBF LLC also will provide that substantially all expenses incurred by or attributable to PBF Energy (such as expenses incurred in connection with this offering), but not including obligations incurred under the tax receivable agreement by PBF Energy, income tax expenses of PBF Energy and payments on indebtedness incurred by PBF Energy, will be borne by PBF LLC.
Exchange Agreement
We will enter into an exchange agreement pursuant to which our existing owners (and certain permitted assignees thereof and holders who acquire PBF LLC Series A Units upon the exercise of certain warrants) may from time to time (subject to the terms of the exchange agreement), cause PBF LLC to exchange its PBF LLC
143
Table of Contents
Series A Units for shares of Class A common stock of PBF Energy on a one-for-one basis, subject to equitable adjustments for stock splits, stock dividends and reclassifications, and further subject to the rights of the holders of PBF LLC Series B Units to share in a portion of the profits realized by our financial sponsors upon the sale of the shares of Class A common stock received by them upon such exchange. The exchange agreement also provides that, subject to certain exceptions, holders will not have the right to cause PBF LLC to exchange PBF LLC Series A Units if PBF Energy determines that such exchange would be prohibited by law or regulation or would violate other agreements to which PBF Energy may be subject, and that PBF Energy may impose additional restrictions on exchange that it determines to be necessary or advisable so that PBF LLC is not treated as a “publicly traded partnership” for United States federal income tax purposes. As a holder exchanges its PBF LLC Series A Units, PBF Energy’s interest in PBF LLC will be correspondingly increased.
Registration Rights Agreement
In connection with this offering, we will enter into an amended and restated registration rights agreement with each of our existing owners pursuant to which we will grant them and their affiliates and permitted transferees the right, under certain circumstances and subject to certain restrictions, to require us to register under the Securities Act shares of Class A common stock delivered in exchange for PBF LLC Series A Units or otherwise beneficially owned by them. Under the registration rights agreement, we will agree following the expiration of the 180-day lock-up period described in this prospectus, to make available a shelf registration statement to register the exchange by our existing owners of PBF LLC Series A Units for shares of Class A common stock and the resale by them of shares of Class A common stock into the market from time to time. In addition, each of our existing owners will have the ability to exercise certain piggyback registration rights in respect of shares of Class A common stock held by them in connection with registered offerings requested by other registration rights holders or initiated by us. Finally, our existing owners have the right to require us to cooperate with them in disposing of their shares of Class A common stock in an underwritten public offering if the gross proceeds from such offering is reasonably anticipated to be at least $25 million, provided that we shall not have to undertake an underwritten public offering more than twice in any 365-day period or sooner than 120 days from the closing of any other underwritten public offering for which the existing owners had piggyback registration rights, and each of Blackstone and First Reserve shall be entitled to request no more than four underwritten public offerings in the aggregate.
Tax Receivable Agreement
As described in “Organizational Structure—Offering Transactions,” we intend to use a significant portion of the proceeds from this offering to purchase PBF LLC Series A Units from certain of our existing owners. In addition, our existing owners may from time to time (subject to the terms of the exchange agreement) cause PBF LLC to exchange their remaining PBF LLC Series A Units for shares of Class A common stock of PBF Energy on a one-for-one basis. PBF LLC (and each of its subsidiaries classified as a partnership for federal income tax purposes) intends to make an election under Section 754 of the Code effective for each taxable year in which an exchange of PBF LLC Series A Units for shares of Class A common stock occurs. The purchase of PBF LLC Series A Units and exchanges of PBF LLC Series A Units for shares of Class A common stock are expected to result with respect to PBF Energy in increases in the tax basis of the assets of PBF LLC that otherwise would not have been available. These increases in tax basis may reduce the amount of tax that PBF Energy would otherwise be required to pay in the future. These increases in tax basis may also decrease gains (or increase losses) on future dispositions of certain assets to the extent tax basis is allocated to those assets.
We will enter into a tax receivable agreement with the holders of PBF LLC Series A Units and PBF LLC Series B Units (and certain permitted assignees thereof and holders who acquire PBF LLC Series A Units upon the exercise of certain warrants) that will provide for the payment from time to time by PBF Energy to such persons of 85% of the amount of the benefits, if any, that PBF Energy is deemed to realize as a result of (i) these increases in tax basis and (ii) certain other tax benefits related to our entering into the tax receivable agreement, including tax benefits attributable to payments under the tax receivable agreement. These payment obligations are obligations of PBF Energy and not of PBF LLC.
144
Table of Contents
For purposes of the tax receivable agreement, subject to certain exceptions noted below, the benefit deemed realized by PBF Energy generally will be computed by comparing the actual income tax liability of PBF Energy (calculated with certain assumptions) to the amount of such taxes that PBF Energy would have been required to pay had there been no increase to the tax basis of the assets of PBF LLC as a result of the purchase or exchanges of PBF LLC Series A Units and had PBF Energy not derived any tax benefits in respect of payments made under the tax receivable agreement. The term of the tax receivable agreement will continue until all such tax benefits have been utilized or expired, unless (i) certain changes of control occur as described below, (ii) PBF Energy exercises its right to terminate the tax receivable agreement for an amount based on the agreed payments remaining to be made under the agreement or (iii) PBF Energy breaches any of its material obligations under the tax receivable agreement in which case all obligations will generally be accelerated and due as if PBF Energy had exercised its right to terminate the agreement. Estimating the amount of payments that may be made under the tax receivable agreement is by its nature imprecise, insofar as the calculation of amounts payable depends on a variety of factors. The actual increase in tax basis, as well as the amount and timing of any payments under the tax receivable agreement, will vary depending upon a number of factors, including:
| • | the timing of any subsequent exchanges of PBF LLC Series A Units—for instance, the increase in any tax deductions will vary depending on the fair value, which may fluctuate over time, of the depreciable or amortizable assets of PBF LLC at the time of each exchange; |
| • | the price of shares of our Class A common stock at the time of the exchange—the increase in any tax deductions, as well as the tax basis increase in other assets, of PBF LLC is affected by the price of shares of our Class A common stock at the time of the exchange; |
| • | the extent to which such exchanges are taxable—if an exchange is not taxable for any reason, increased deductions will not be available; and |
| • | the amount and timing of our income—PBF Energy generally will be required to pay 85% of the deemed benefits as and when deemed realized. If PBF Energy does not have taxable income, PBF Energy generally is not required (absent a change of control or circumstances requiring an early termination payment) to make payments under the tax receivable agreement for that taxable year because no benefit will have been actually realized. However, any tax benefits that do not result in realized benefits in a given tax year will likely generate tax attributes that may be utilized to generate benefits in previous or future tax years. The utilization of such tax attributes will result in payments under the tax receivable agreement. |
We expect that the payments that we may make under the tax receivable agreement will be substantial. Assuming no material changes in the relevant tax law, and that we earn sufficient taxable income to realize all tax benefits that are subject to the tax receivable agreement, we expect that future payments under the tax receivable agreement relating to the purchase by us of PBF LLC Series A Units as part of the offering transactions to aggregate $ million (or $ million if the underwriters exercise their option to purchase additional shares) and to range over the next 15 years from approximately $ million to $ million per year (or range from approximately $ million to $ million per year if the underwriters exercise their option to purchase additional shares) and decline thereafter. Future payments under the agreement by us in respect of subsequent exchanges would be in addition to these amounts and are expected to be substantial. The foregoing numbers are merely estimates—the actual payments could differ materially. It is possible that future transactions or events could increase or decrease the actual tax benefits realized and the corresponding tax receivable agreement payments. There may be a material negative effect on our liquidity if, as a result of timing discrepancies or otherwise, (a) the payments under the tax receivable agreement exceed the actual benefits we realize in respect of the tax attributes subject to the tax receivable agreement and/or (b) distributions to PBF Energy by PBF LLC are not sufficient to permit PBF Energy to make payments under the tax receivable agreement after it has paid its taxes and other obligations. The payments under the tax receivable agreement are not conditioned upon any persons continued ownership of us.
145
Table of Contents
The effects of the tax receivable agreement on our consolidated balance sheet as a result of our purchase of PBF LLC Series A Units with our proceeds from this offering are as follows:
| • | we will record an increase of $ million in deferred tax assets (or $ million if the underwriters exercise their option to purchase additional shares) for the estimated income tax effects of the increase in the tax basis of the assets owned by PBF Energy based on enacted federal, state and local income tax rates at the date of the transaction. To the extent we estimate that we will not realize the full benefit represented by the deferred tax asset, based on an analysis of expected future earnings, we will reduce the deferred tax asset with a valuation allowance; |
| • | we will record 85% of the estimated realizable tax benefit resulting from (i) the increase in the tax basis of the purchased interests as noted above and (ii) certain other tax benefits related to entering into the tax receivable agreement, including tax benefits attributable to payments under the tax receivable agreement as an increase of $ million (or $ million if the underwriters exercise their option to purchase additional shares) payable to a related party pursuant to tax receivable agreement; and |
| • | we will record an increase to additional paid-in capital in an amount equal to the difference between the increase in deferred tax assets and the increase in liability due to our existing owners under the tax receivable agreement. |
The amounts to be recorded for both the deferred tax assets and the liability for our obligations under the tax receivable agreement have been estimated. All of the effects of changes in any of our estimates after the date of the purchase will be included in our net income. Similarly, the effect of subsequent changes in the enacted tax rates will be included in net income.
In certain instances (as described in the following two paragraphs), payments under the tax receivable agreement may be accelerated and/or significantly exceed the actual benefits we realize in respect of the tax attributes subject to the tax receivable agreement.
The tax receivable agreement will provide that upon certain changes of control, or if, at any time, we elect an early termination of the tax receivable agreement, our (or our successor’s) obligations with respect to exchanged or acquired PBF LLC Series A Units (whether exchanged or acquired before or after such transaction) would be based on certain assumptions, including that (a) we would have sufficient taxable income to fully utilize the deductions arising from the increased tax deductions and tax basis and other benefits related to entering into the tax receivable agreement and (b) that the subsidiaries of PBF LLC will sell certain nonamortizable assets (and realize certain related tax benefits) no later than a specified date. Moreover, (i) if we elect to terminate the tax receivable agreement early or if we undergo certain changes of control, we would be required to make an immediate payment equal to the present value of the anticipated future tax benefits (based on the foregoing assumptions), which upfront payment may be made years in advance of the actual realization of such future benefits and (ii) we could be required to make payments under the tax receivable agreement that are significantly greater than the actual benefits we realize in respect of the tax attributes subject to the tax receivable agreement. Assuming that the market value of a share of Class A common stock were to be equal to the initial public offering price per share of Class A common stock in this offering and that LIBOR were to be 1.86%, we estimate that the aggregate amount of these change of control payments would be approximately $ million if triggered immediately after this offering. In these situations, our obligations under the tax receivable agreement could have a substantial negative impact on our liquidity and there is no assurance that we will be able to finance these obligations.
Moreover, payments under the tax receivable agreement will be based on the tax reporting positions that we determine in accordance with the tax receivable agreement. We will not be reimbursed for any payments previously made under the tax receivable agreement if the Internal Revenue Service subsequently disallows part or all of the tax benefits that gave rise to such prior payments. As a result, in certain circumstances, payments could be made under the tax receivable agreement that are significantly in excess of the benefits that we actually realize in respect of (a) the increases in tax basis resulting from our purchases or exchanges of PBF LLC Series A
146
Table of Contents
Units and (b) certain other tax benefits related to our entering into the tax receivable agreement, including tax benefits attributable to payments under the tax receivable agreement.
Decisions made by our existing owners in the course of running our business, such as with respect to mergers, asset sales, other forms of business combinations or other changes in control, may influence the timing and amount of payments that we are required to make under the tax receivable agreement. For example, the earlier disposition of assets following an exchange or acquisition transaction will generally accelerate payments under the tax receivable agreement and increase the present value of such payments, and the disposition of assets before an exchange or acquisition transaction will increase our existing owners’ tax liability without giving rise to any obligations to make payments under the tax receivable agreement.
Payments are generally due under the tax receivable agreement within a specified period of time following the filing of our tax return for the taxable year with respect to which the payment obligation arises, although interest on such payments will begin to accrue at a rate of LIBOR plus 50 basis points from the due date (without extensions) of such tax return, however we may defer payments under the tax receivable agreement to the extent we do not have available cash to satisfy our payment obligations under the tax receivable agreement. Such deferred payments would accrue interest at a rate of LIBOR plus 150 basis points.
Investments in PBF LLC
Each of our executive officers, one of our directors and certain other employees have been provided with the opportunity to purchase PBF LLC Series A Units and non-compensatory warrants to purchase PBF LLC Series A Units. The number of units and warrants offered for purchase were based upon the individual’s position and other relevant factors, and approved by the board of directors of PBF LLC. The table below sets forth the number of PBF LLC Series A Units and non-compensatory warrants to purchase PBF LLC Series A Units purchased and the price paid therefor by our named executive officers and one of our directors since the beginning of fiscal 2008.
| Name |
Aggregate Purchase Price ($) |
Series A Units (#) |
Non-Compensatory Warrants for the Purchase of Series A Units(1)(2) (#) |
|||||||||
| Thomas D. O’Malley |
18,095,150 | 1,809,515 | 1,815,380 | |||||||||
| Executive Chairman of the Board of Directors(3) |
||||||||||||
| Thomas J. Nimbley |
2,250,000 | 225,000 | 300,000 | |||||||||
| Chief Executive Officer |
||||||||||||
| Matthew C. Lucey |
135,000 | 13,500 | 17,319 | |||||||||
| Senior Vice President, Chief Financial Officer |
||||||||||||
| Donald F. Lucey |
766,271 | 76,627 | 100,000 | |||||||||
| Executive Vice President, Chief Commercial Officer |
||||||||||||
| Michael D. Gayda |
750,000 | 75,000 | 100,000 | |||||||||
| President |
||||||||||||
| Jefferson F. Allen |
750,000 | 75,000 | 70,000 | |||||||||
| Director |
||||||||||||
| (1) | Each non-compensatory warrant for the purchase of PBF LLC Series A Units has an exercise price of $10.00 per unit and is immediately exercisable for a ten-year period. |
147
Table of Contents
| (2) | In connection with the purchase of PBF LLC Series A Units and warrants, compensatory warrants for the purchase of PBF LLC Series A Units were also granted to each of these persons. See “Executive Compensation—Grants of Plan-Based Awards in 2011” and “—Outstanding Equity Awards at 2011 Fiscal Year-End.” |
| (3) | Thomas D. O’Malley owns 1,649,700 PBF LLC Series A Units and holds non-compensatory warrants for the purchase of 1,745,380 PBF LLC Series A Units. Thomas D. O’Malley, Jr., Thomas D. O’Malley’s son, owns 101,627 PBF LLC Series A Units. Horse Island Partners, of which Mr. O’Malley is the managing member, directly owns 58,188 PBF LLC Series A Units and non-compensatory warrants for the purchase of 70,000 PBF LLC Series A Units. |
Consulting Agreement with Fuel Strategies International
Pursuant to a consulting agreement, Fuel Strategies International, Inc., the principal of which is James P. O’Malley, the brother of Thomas D. O’Malley, the Executive Chairman of our Board of Directors, provided us with monthly consulting services relating to our petroleum coke and commercial operations. The initial term of the agreement was effective from February 8, 2010 through May 1, 2010, after which time it became an evergreen contract. The agreement is automatically renewed for additional 30-day periods unless terminated by either party upon ten days notice prior to the expiration of any renewal term. For the nine months ended September 30, 2012 and the years ended December 31, 2011 and 2010 we paid $551,079, $487,925 and $276,302, respectively, to Fuel Strategies under this agreement.
Private Aircraft
We have an agreement with Thomas D. O’Malley, our Executive Chairman of the Board of Directors, for the use of an airplane owned by 936MP, LLC, a Delaware limited liability company, owned by Mr. O’Malley. We pay a charter rate that is the lowest rate this aircraft is chartered to third-parties. Our audit committee reviews such usage of the airplane annually. For the nine months ended September 30, 2012 and the years ended December 31, 2011 and 2010, we incurred charges of $700,257, $820,524 and $393,288, respectively, related to use of this plane.
Private Placement of Senior Secured Notes
On February 9, 2012, our subsidiary, PBF Holding, sold in a private placement $25.5 million aggregate principal amount of 8.25% senior secured notes due 2020 to Thomas D. O’Malley, our Executive Chairman of the Board of Directors, certain of his affiliates and family members, and certain of our other executives, at a purchase price of 98.565% thereof. These notes are identical in all material respects to the $650.0 million aggregate principal amount of 8.25% senior secured notes offered and sold by PBF Holding (but are not expected to trade, and are not fungible, with those notes) and were sold without registration under the securities laws. These purchasers have registration rights pursuant to which, under certain circumstances, PBF Holding will file and use commercially reasonable efforts to keep effective a shelf registration statement covering resales of these notes.
Statement of Policy Regarding Transactions with Related Persons
Our board of directors has adopted a written policy that applies to transactions with related persons. For purposes of the policy, related person transactions include transactions, arrangements or relationships involving amounts greater than $120,000 in the aggregate in which we are a participant and a related person has a direct or indirect material interest. Related persons are deemed to include directors, director nominees, executive officers, owners of more than five percent of our common stock, or an immediate family member of the preceding group. The policy provides that our audit committee will be responsible for the review and approval or ratification of all related-person transactions.
148
Table of Contents
Our audit committee will review the material facts of all related person transactions that require the committee’s approval and either approve or disapprove of the entry into the related person transaction, subject to certain exceptions described below. The policy prohibits any director from participating in any discussion or approval of a related person transaction for which such director is a related person, except that such director is required to provide all material information concerning the interested transaction to the committee. As part of its review and approval of a related person transaction, the committee will consider whether the transaction is made on terms no less favorable than terms that would be generally available to an unaffiliated third-party under the same or similar circumstances, the extent of the related-person’s interest in the transaction and any other matters the committee deems appropriate.
Our related person transactions policy does not apply to: (1) employment of executive officers if our compensation is disclosed in the proxy statement or approved by the compensation committee; (2) director compensation that is disclosed in the proxy statement; (3) pro rata payments arising solely from the ownership of our equity securities; (4) certain indebtedness arising from ordinary course transactions or with owners of more than five percent of our common stock; (5) transactions where the rates or charges are determined by competitive bids; (6) certain charitable contributions; (7) regulated transactions; and (8) certain financial services.
149
Table of Contents
The following tables set forth information regarding the beneficial ownership of shares of our Class A common stock by (1) each person known to us to beneficially own more than 5% of any class of the outstanding voting securities of PBF Energy, (2) each of our directors and named executive officers and (3) all of our directors and executive officers as a group.
Prior to this offering, PBF LLC owned 100% of our outstanding common stock. Following the closing of this offering, Blackstone and First Reserve, together with certain of our directors and executive officers, will beneficially own their interests in our Class A common stock set forth below through their ownership of PBF LLC. The number of shares of our Class A common stock and percentage of beneficial ownership before and after the Offering Transactions is presented after giving effect to the “Reorganization Transactions” and described under “Organizational Structure.” The number of shares of our Class A Common Stock and percentage of beneficial ownership after the Offering Transactions set forth below are based on shares of our Class A common stock and of PBF LLC Series A Units outstanding immediately after the Offering Transactions, and assumes that we will use $ million of the proceeds we receive from this offering to purchase PBF LLC Series A Units (which will be reclassified as PBF LLC Series C Units in connection with such acquisition) held by Blackstone and First Reserve.
Beneficial ownership is determined in accordance with the rules and regulations of the SEC. Except as otherwise indicated, the business address for each of the following persons is One Sylvan Way, Second Floor, Parsippany, New Jersey 07054.
| Class A Common Stock Beneficially Owned(1) | Combined Voting Power(2)(3) | |||||||||||||||||||||||
| Name |
Prior to the Offering Transactions |
After the Offering Transactions Assuming Underwriters’ Option is Not Exercised |
After the Offering Transactions Assuming Underwriters’ Option is Exercised in Full |
Prior to the Offering Transactions |
After the Offering Transactions Assuming Underwriters’ Option is Not Exercised |
After the Offering Transactions Assuming Underwriters’ Option is Exercised in Full | ||||||||||||||||||
| Number | % | Number | % | Number | % | % | % | % | ||||||||||||||||
| Blackstone(4) |
44,861,169 | 48.6 | 48.6 | |||||||||||||||||||||
| First Reserve(5) |
44,861,169 | 48.6 | 48.6 | |||||||||||||||||||||
| Thomas D. O’Malley(6) |
4,301,288 | 4.5 | 4.5 | |||||||||||||||||||||
| Thomas J. Nimbley(7) |
675,000 | * | * | |||||||||||||||||||||
| Matthew C. Lucey(8) |
49,198 | * | * | |||||||||||||||||||||
| Donald F. Lucey(9) |
226,627 | * | * | |||||||||||||||||||||
| Michael D. Gayda(10) |
225,000 | * | * | |||||||||||||||||||||
| Spencer Abraham |
— | — | — | |||||||||||||||||||||
| Jefferson F. Allen(11) |
175,000 | * | * | |||||||||||||||||||||
| Martin J. Brand(12) |
44,861,169 | 48.6 | 48.6 | |||||||||||||||||||||
| Timothy H. Day(13) |
44,861,169 | 48.6 | 48.6 | |||||||||||||||||||||
| David I. Foley(14) |
44,861,169 | 48.6 | 48.6 | |||||||||||||||||||||
| Dennis Houston(15) |
8,333 | * | * | |||||||||||||||||||||
| Neil A. Wizel(16) |
44,861,169 | 48.6 | 48.6 | |||||||||||||||||||||
| All directors and executive officers as a group |
95,429,597 | 99.6 | 99.6 | |||||||||||||||||||||
| * | Represents less than 1%. |
| (1) | Subject to the terms of the exchange agreement, the PBF LLC Series A Units are exchangeable at any time and from time to time for shares of our Class A common stock on a one-for-one basis, subject to equitable adjustments for stock splits, stock dividends and reclassifications and further |
150
Table of Contents
| subject to the rights of the holders of PBF LLC Series B Units to share in a portion of the profits realized by our financial sponsors upon the sale of the shares of Class A common stock received by them upon such exchange. See “Certain Relationships and Related Transactions—PBF LLC Limited Liability Company Agreement” and “Certain Relationships and Related Transactions—Exchange Agreement.” |
| (2) | Represents percentage of voting power of the Class A common stock and Class B common stock of PBF Energy voting together as a single class. See “Description of Capital Stock.” |
| (3) | Our existing owners will hold all of the shares of our Class B common stock. Each holder of Class B common stock shall be entitled, without regard to the number of shares of Class B common stock held by it, to one vote for each PBF LLC Series A Unit held by it. Accordingly, our existing owners have a number of votes in PBF Energy that is equal to the aggregate number of PBF LLC Series A Units that it holds. See “Description of Capital Stock—Class B Common Stock.” |
| (4) | Consists entirely of PBF LLC Series A Units. The Blackstone Vehicles (as hereinafter defined) are comprised of the following entities: Blackstone PB Capital Partners V Subsidiary L.L.C. (“BPBCP V”), Blackstone PB Capital Partners V-AC L.P. (“BPBCP V-AC”), Blackstone Family Investment Partnership V USS L.P. (“BFIP V”), Blackstone Family Investment Partnership V-A USS SMD L.P. (“BFIP V-A”), and Blackstone Participation Partnership V USS L.P. (“BPP V”, and together with BPBCP V, BPBCP V-AC, BFIP V and BFIP V-A, the “Blackstone Vehicles”). The Blackstone Vehicles beneficially own (i) 37,131,143 PBF LLC Series A Units, which are held by BPBCP V, (ii) 6,653,361 PBF LLC Series A Units, which are held by BPBCP V-AC, (iii) 204,804 PBF LLC Series A Units, which are held by BFIP V, (iv) 777,759 PBF LLC Series A Units, which are held by BFIP V-A, and (v) 94,100 PBF LLC Series A Units, which are held by BPP V. Blackstone Management Associates V USS L.L.C. (“BMA”) is a general partner of each of BPBCP V and BPBCP V-AC. BCP V USS Side-by-Side GP L.L.C. (“BCP V GP L.L.C.”) is a general partner of BFIP V and BPP V. Blackstone Holdings II L.P. holds the majority of membership interests in BMA and is the sole member of BCP V GP L.L.C. The general partner of Blackstone Holdings II L.P. is Blackstone Holdings I/II GP Inc. The sole shareholder of Blackstone Holdings I/II GP Inc. is The Blackstone Group L.P. The general partner of The Blackstone Group L.P. is Blackstone Group Management L.L.C., which is in turn, wholly owned by Blackstone’s senior managing directors and controlled by its founder, Stephen A. Schwarzman. The general partner of BFIP V-A is Blackstone Family GP L.L.C., which is in turn, wholly owned by Blackstone’s senior managing directors and controlled by its founder, Mr. Schwarzman. Each of such Blackstone entities and Mr. Schwarzman may be deemed to beneficially own the shares beneficially owned by the Blackstone Vehicles directly or indirectly controlled by it or him, but each disclaims beneficial ownership of such shares except to the extent of its or his indirect pecuniary interest therein. The address of each of Mr. Schwarzman and each of the other entities listed in this footnote is c/o The Blackstone Group L.P., 345 Park Avenue, New York, New York 10154. |
| (5) | Consists entirely of PBF LLC Series A Units. Owned collectively by FR PBF Holdings LLC and FR PBF Holdings II LLC, which in turn are wholly owned and managed by FR XII PBF Holdings LLC, which in turn is collectively owned and managed by FR XII PBF AIV, L.P. (“FR XII”) and FR XII-A PBF AIV, L.P. (“FR XII-A”). FR XII and FR XII-A are managed by First Reserve GP XII, L.P. which, in turn , is managed by First Reserve GP XII Limited. The address of FR PBF Holdings LLC and First Reserve is c/o First Reserve Corporation, One Lafayette Place, Greenwich, Connecticut 06830. |
| (6) | Consists of (a) 1,649,700 PBF LLC Series A Units held directly by Mr. O’Malley, (b) 58,188 PBF LLC Series A Units and warrants to purchase an additional 100,000 PBF LLC Series A Units held by Horse Island Partners, of which Mr. O’Malley is the Managing Member, and (c) an aggregate of 2,493,400 PBF LLC Series A Units that can be acquired within 60 days upon the exercise of outstanding warrants and options. In addition, does not include 350,000 PBF LLC Series B Units beneficially owned by Mr. O’Malley, 75% of which are currently vested. The PBF LLC Series B Units do not currently entitle the holders to any dividend payments or any rights upon liquidation or dissolution of PBF LLC but may in the future entitle them to certain interests in the profits of |
151
Table of Contents
| our financial sponsors after the passing of certain vesting dates and performance thresholds. For more information about the PBF LLC Series B Units, see “Executive Compensation — Compensation Discussion and Analysis — Summary of PBF LLC Series B Units.” |
| (7) | Consists of 225,000 PBF LLC Series A Units and an aggregate of 450,000 PBF LLC Series A Units that can be acquired within 60 days upon the exercise of outstanding warrants and options. In addition, does not include 160,000 PBF LLC Series B Units beneficially owned by Mr. Nimbley, 75% of which are currently vested. |
| (8) | Consists of 13,500 PBF LLC Series A Units and an aggregate of 35,698 PBF LLC Series A Units that can be acquired within 60 days upon the exercise of outstanding warrants and options. In addition, does not include 60,000 PBF LLC Series B Units beneficially owned by Mr. M. Lucey, 75% of which are currently vested. |
| (9) | Consists of 76,627 PBF LLC Series A Units and an aggregate of 150,000 PBF LLC Series A Units that can be acquired within 60 days upon the exercise of outstanding warrants and options. In addition, does not include 160,000 PBF LLC Series B Units beneficially owned by Mr. D. Lucey, 75% of which are currently vested. |
| (10) | Consists of 75,000 PBF LLC Series A Units and an aggregate of 150,000 PBF LLC Series A Units that can be acquired within 60 days upon the exercise of outstanding warrants and options. In addition, does not include 160,000 PBF LLC Series B Units beneficially owned by Mr. Gayda, 75% of which are currently vested. |
| (11) | Consists of 75,000 PBF LLC Series A Units and an aggregate of 100,000 PBF LLC Series A Units that can be acquired within 60 days upon the exercise of outstanding warrants and options. |
| (12) | Mr. Brand is a Managing Director of Blackstone. Mr. Brand disclaims beneficial ownership of any shares of the issuer’s equity securities owned by the Blackstone Funds or their affiliates, except to the extent of their pecuniary interests therein. |
| (13) | Mr. Day is a Managing Director of First Reserve. Mr. Day disclaims beneficial ownership of any shares of the issuer’s equity securities owned by such entities or their affiliates, except to the extent of their pecuniary interests therein. |
| (14) | Mr. Foley is a Senior Managing Director of Blackstone. Mr. Foley disclaims beneficial ownership of any shares of the issuer’s equity securities owned by the Blackstone Funds or their affiliates, except to the extent of their pecuniary interests therein. |
| (15) | Consists of 8,333 PBF LLC Series A Units that can be acquired within 60 days upon the exercise of outstanding options. |
| (16) | Mr. Wizel is a Director of First Reserve. Mr. Wizel disclaims beneficial ownership of any shares of the issuer’s equity securities owned by First Reserve or its affiliates, except to the extent of their pecuniary interests therein. |
| (17) | Consists of 91,908,166 PBF LLC Series A Units and an aggregate of 3,521,431 of PBF LLC Series A Units that can be acquired within 60 days upon the exercise of outstanding warrants and options. In addition, does not include 1,000,000 PBF LLC Series B Units beneficially owned by the directors and officers as a group, 75% of which are currently vested. |
152
Table of Contents
The following is a description of the material terms of our amended and restated certificate of incorporation and amended and restated bylaws that will be in effect upon consummation of this offering. We refer you to our certificate of incorporation and bylaws, copies of which have been filed as exhibits to the registration statement of which this prospectus forms a part.
Authorized Capitalization
Upon completion of this offering, our authorized capital stock will consist of 1,000,000,000 shares of Class A common stock, par value $0.001 per share, of which shares will be issued and outstanding, 1,000,000 shares of Class B common stock, par value $0.001 per share, of which 37 shares will be issued and outstanding, and 100,000,000 shares of preferred stock, par value $0.001 per share, none of which will be issued and outstanding. Unless our board of directors determines otherwise, we will issue all shares of our capital stock in uncertificated form.
Class A Common Stock
Voting Rights. Holders of shares of Class A common stock are entitled to one vote per share on all matters to be voted upon by the stockholders. The holders of Class A common stock do not have cumulative voting rights in the election of directors.
Dividend Rights. Subject to the rights of the holders of any preferred stock that may be outstanding and any contractual or statutory restrictions, holders of our Class A common stock are entitled to receive equally and ratably, share for share dividends as may be declared by our board of directors out of funds legally available to pay dividends. Dividends upon our Class A common stock may be declared by the board of directors at any regular or special meeting, and may be paid in cash, in property, or in shares of capital stock. Before payment of any dividend, there may be set aside out of any of our funds available for dividends, such sums as the board of directors deems proper as reserves to meet contingencies, or for equalizing dividends, or for repairing or maintaining any of our property, or for any proper purpose, and the board of directors may modify or abolish any such reserve.
Liquidation Rights. Upon liquidation, dissolution, distribution of assets or other winding up, the holders of Class A common stock are entitled to receive ratably the assets available for distribution to the stockholders after payment of liabilities and the liquidation preference of any of our outstanding shares of preferred stock.
Other Matters. The shares of Class A common stock have no preemptive or conversion rights and are not subject to further calls or assessment by us. There are no redemption or sinking fund provisions applicable to the Class A common stock. All outstanding shares of our Class A common stock, including the Class A common stock offered in this offering, are fully paid and non-assessable.
Class B Common Stock
Voting Rights. Holders of shares of Class B common stock are entitled, without regard to the number of shares of Class B common stock held by such holder, to one vote for each PBF LLC Series A Unit beneficially owned by such holder. Accordingly, our existing owners collectively have a number of votes in PBF Energy that is equal to the aggregate number of PBF LLC Series A Units that they hold. Holders of shares of our Class A common stock and Class B common stock vote together as a single class on all matters presented to our stockholders for their vote or approval, except as otherwise required by applicable law.
Dividend and Liquidation Rights. Holders of our Class B common stock do not have any right to receive dividends or to receive a distribution upon a liquidation or winding up of PBF Energy.
153
Table of Contents
Preferred Stock
Our certificate of incorporation authorizes our board of directors to establish one or more series of preferred stock and to determine, with respect to any series of preferred stock, the terms and rights of that series, including:
| • | the designation of the series; |
| • | the number of shares of the series which our board may, except where otherwise provided in the preferred stock designation, increase or decrease, but not below the number of shares then outstanding; |
| • | whether dividends, if any, will be cumulative or non-cumulative and the dividend rate of the series; |
| • | the dates at which dividends, if any, will be payable; |
| • | the redemption rights and price or prices, if any, for shares of the series; |
| • | the terms and amounts of any sinking fund provided for the purchase or redemption of shares of the series; |
| • | the amounts payable on shares of the series in the event of any voluntary or involuntary liquidation, dissolution or winding-up of the affairs of our company, or upon any distribution of assets of our company; |
| • | whether the shares of the series will be convertible into shares of any other class or series, or any other security, of our company or any other corporation, and, if so, the specification of the other class or series or other security, the conversion price or prices or rate or rates, any rate adjustments, the date or dates as of which the shares will be convertible and all other terms and conditions upon which the conversion may be made; |
| • | the preferences and special rights, if any, of the series and the qualifications and restrictions, if any, of the series; |
| • | the voting rights, if any, of the holders of the series; and |
| • | such other rights, powers and preferences with respect to the series as our board of directors may deem advisable. |
Authorized but Unissued Capital Stock
Delaware law does not require stockholder approval for any issuance of authorized shares. However, the listing requirements of the NYSE, which would apply so long as our Class A common stock is listed on the NYSE, require stockholder approval of certain issuances (other than a public offering) equal to or exceeding 20% of the then outstanding voting power or then outstanding number of shares of Class A common stock, as well as for certain issuances of stock in compensatory transactions. These additional shares may be used for a variety of corporate purposes, including future public offerings, to raise additional capital or to facilitate acquisitions. One of the effects of the existence of unissued and unreserved Class A common stock may be to enable our board of directors to issue shares to persons friendly to current management, which issuance could render more difficult or discourage an attempt to obtain control of our company by means of a merger, tender offer, proxy contest or otherwise, and thereby protect the continuity of our management and possibly deprive the stockholders of opportunities to sell their shares of Class A common stock at prices higher than prevailing market prices.
Anti-Takeover Effects of Certain Provisions of Delaware Law and our Certificate of Incorporation and Bylaws
Certain provisions of our certificate of incorporation and bylaws, which are summarized in the following paragraphs, may have an anti-takeover effect and may delay, defer or prevent a tender offer or takeover attempt that a stockholder might consider in its best interest, including those attempts that might result in a premium over the market price for the shares held by stockholders.
154
Table of Contents
Undesignated Preferred Stock
The ability to authorize undesignated preferred stock will make it possible for our board of directors to issue preferred stock with super voting, special approval, dividend or other rights or preferences on a discriminatory basis that could impede the success of any attempt to acquire us or otherwise effect a change in control of us. These and other provisions may have the effect of deferring, delaying or discouraging hostile takeovers, or changes in control or management of our company.
No Cumulative Voting
The Delaware General Corporation Law, or DGCL, provides that stockholders are not entitled to the right to cumulate votes in the election of directors unless our certificate of incorporation provides otherwise. Our certificate of incorporation prohibits cumulative voting.
Calling of Special Meetings of Stockholders
Our bylaws provide that special meetings of our stockholders may be called at any time only by the chairman of the board of directors, the chief executive officer or the board of directors, or Blackstone or First Reserve, for so long as Blackstone or First Reserve, in its individual capacity as the party calling the meeting, continues to beneficially own at least 25% of the total voting power of all the then outstanding shares of our capital stock.
Stockholder Action by Written Consent
The DGCL permits stockholder action by written consent unless otherwise provided by our certificate of incorporation. Our certificate of incorporation precludes stockholder action by written consent after the date on which Blackstone and First Reserve collectively cease to beneficially own at least a majority in voting power of all shares entitled to vote generally in the election of our directors.
Advance Notice Requirements for Stockholder Proposals and Director Nominations
Our bylaws establish advance notice procedures with respect to stockholder proposals and the nomination of candidates for election as directors, other than nominations made by or at the direction of the board of directors (or a committee of the board of directors), or Blackstone or First Reserve so long as certain ownership thresholds are met in accordance with the terms of our certificate of incorporation and bylaws. In order for any matter to be “properly brought” before a meeting, a stockholder will have to comply with advance notice requirements and provide us with certain information. Our bylaws allow the presiding officer at a meeting of the stockholders to adopt rules and regulations for the conduct of meetings which may have the effect of precluding the conduct of certain business at a meeting if the rules and regulations are not followed.
These provisions may defer, delay or discourage a potential acquirer from conducting a solicitation of proxies to elect the acquirer’s own slate of directors or otherwise attempting to obtain control of our company.
Removal of Directors; Vacancies
Our certificate of incorporation provides that directors may be removed with or without cause upon the affirmative vote of holders of at least a majority of the voting power of all the then outstanding shares of stock entitled to vote generally in the election of directors (but subject to the terms of the stockholders agreement). In addition, our bylaws provide that any newly-created directorship on the board of directors that results from an increase in the number of directors and any vacancy occurring on the board of directors shall be filled only by a majority of the directors then in office, although less than a quorum, or by a sole remaining director (but subject to the terms of the stockholders agreement).
155
Table of Contents
Delaware Anti-takeover Statute
We have opted out of Section 203 of the DGCL. However, in the event that Blackstone and First Reserve collectively cease to beneficially own at least 5% of the total voting power of all the then outstanding shares of our capital stock, we will automatically become subject to Section 203 of the DGCL.
Subject to specified exceptions, Section 203 prohibits a publicly held Delaware corporation from engaging in a “business combination” with an “interested stockholder” for a period of three years after the date of the transaction in which the person became an interested stockholder. “Business combinations” include mergers, asset sales and other transactions resulting in a financial benefit to the “interested stockholder.” Subject to various exceptions, an “interested stockholder” is a person who together with his or her affiliates and associates, owns, or within three years did own, 15% or more of the corporation’s outstanding voting stock. These restrictions generally prohibit or delay the accomplishment of mergers or other takeover or change in control attempts.
Supermajority Provisions
Our certificate of incorporation will grant our board of directors the authority to amend and repeal our bylaws without a stockholder vote in any manner not inconsistent with the laws of the State of Delaware or our certificate of incorporation but will require a 75% supermajority vote for the stockholders to amend any provision of our bylaws after the date Blackstone and First Reserve collectively cease to beneficially own a majority of all of the outstanding shares of our capital stock entitled to vote.
Limitations on Liability and Indemnification of Officers and Directors
The DGCL authorizes corporations to limit or eliminate the personal liability of directors to corporations and their stockholders for monetary damages for breaches of directors’ fiduciary duties. Our certificate of incorporation includes a provision that eliminates the personal liability of directors for monetary damages for breach of fiduciary duty as a director, except:
| • | for breach of duty of loyalty; |
| • | for acts or omissions not in good faith or involving intentional misconduct or knowing violation of law; |
| • | under Section 174 of the DGCL (unlawful dividends); or |
| • | for transactions from which the director derived improper personal benefit. |
Our certificate of incorporation and bylaws provide that we must indemnify our directors and officers to the fullest extent authorized by the DGCL. We are also expressly authorized to, and do, carry directors’ and officers’ insurance providing coverage for our directors, officers and certain employees for some liabilities. We believe that these indemnification provisions and insurance are useful to attract and retain qualified directors and executive officers.
The limitation of liability and indemnification provisions in our certificate of incorporation and bylaws may discourage stockholders from bringing a lawsuit against directors for breach of their fiduciary duty. These provisions may also have the effect of reducing the likelihood of derivative litigation against directors and officers, even though such an action, if successful, might otherwise benefit us and our stockholders. In addition, your investment may be adversely affected to the extent we pay the costs of settlement and damage awards against directors and officers pursuant to these indemnification provisions.
We have entered into indemnification agreements with each of our directors and officers providing for additional indemnification protection beyond that provided by the directors’ and officers’ liability insurance policy. In the indemnification agreements, we have agreed, subject to certain exceptions, to indemnify and hold harmless the director or officer to the maximum extent then authorized or permitted by the provisions of the certificate of incorporation, the DGCL, or by any amendment(s) thereto.
156
Table of Contents
There is currently no pending litigation or proceeding involving any of our directors, officers or employees for which indemnification is sought.
Corporate Opportunity
Neither Blackstone nor First Reserve have any obligation to offer us an opportunity to participate in business opportunities presented to Blackstone or First Reserve even if the opportunity is one that we might reasonably have pursued, and neither Blackstone or First Reserve will be liable to us or our stockholders for breach of any duty by reason of any such activities unless, in the case of any person who is our director or officer, such business opportunity is expressly offered to such director or officer solely in his or her capacity as our officer or director. Stockholders will be deemed to have notice of and consented to this provision of our certificate of incorporation.
Choice of Forum
Our certificate of incorporation provides that, unless we consent in writing to the selection of an alternative forum, the Court of Chancery of the State of Delaware will be the exclusive forum for: (a) any derivative action or proceeding brought on our behalf; (b) any action asserting a breach of fiduciary duty; (c) any action asserting a claim against us arising pursuant to the DGCL, our certificate of incorporation or our bylaws; or (d) any action asserting a claim against us that is governed by the internal affairs doctrine. However, several lawsuits involving other companies are currently pending challenging the validity of choice of forum provisions in certificates of incorporation, and it is possible that a court could rule that such provision is inapplicable or unenforceable.
Transfer Agent and Registrar
The transfer agent and registrar for our Class A common stock will be American Stock Transfer & Trust Company, LLC.
New York Stock Exchange Listing
We have applied to have our Class A common stock approved for listing on the NYSE under the symbol “PBF.”
157
Table of Contents
SHARES ELIGIBLE FOR FUTURE SALE
Before this offering, there has not been any public market for our shares of Class A common stock, and we cannot predict the effect, if any, that market sales of shares of our Class A common stock or the availability of shares of Class A common stock for future sale will have on the market price of our Class A common stock. Nevertheless, sales of substantial amounts of our Class A common stock in the public market, or the perception that such sales could occur, could adversely affect the market price of our Class A common stock and could impair our future ability to raise capital through the sale of equity securities.
Upon completion of this offering, we will have a total of shares of our Class A common stock outstanding (or shares of Class A common stock if the underwriters exercise in full their option to purchase additional shares of Class A common stock). All of the shares of Class A common stock sold in this offering will be freely tradable without restriction or further registration under the Securities Act, except for any shares which may be held or acquired by our “affiliates,” as that term is defined in Rule 144 promulgated under the Securities Act, which shares will be subject to the volume limitations and other restrictions of Rule 144 described below and shares subject to the lock-up agreements described below.
Upon consummation of this offering, our existing owners will beneficially own PBF LLC Series A Units, all of which will be exchangeable for shares of our Class A common stock pursuant to the terms of the exchange agreement on a one-for-one basis, subject to equitable adjustments for stock splits, stock dividends and reclassifications, and further subject to the rights of the holders of PBF LLC Series B Units to share in a portion of the profits realized by our financial sponsors upon the sale of the shares of Class A common stock received by them upon such exchange. The shares of Class A common stock we issue upon such exchanges would be “restricted securities” as defined in Rule 144 unless we register such issuances. However, we have entered into a registration rights agreement with our existing owners that will require us to register under the Securities Act these shares of Class A common stock. See “—Registration Rights Agreement” and “Certain Relationships and Related Transactions—Registration Rights Agreement.”
In addition, holders of outstanding options and warrants to purchase 4,774,630 PBF LLC Series A Units have the right, pursuant to the amended and restated limited liability company agreement of PBF LLC and the exchange agreement described above and following exercise of such options and warrants, to cause PBF LLC to exchange their PBF LLC Series A Units for up to an equivalent number of additional shares of Class A common stock. Finally, awards for up to 5,000,000 shares of Class A Common Stock may be granted under our 2012 Equity Incentive Plan, including 675,000 shares issuable upon the exercise of stock options that we intend to grant to our directors, officers and employees at the time of completion of this offering. See “Executive Compensation—Compensation Discussion and Analysis.” We intend to file one or more registration statements on Form S-8 under the Securities Act to register shares of Class A common stock or securities convertible into or exchangeable or exercisable for shares of Class A common stock issued under or covered by our equity incentive plans. Any such Form S-8 registration statements will automatically become effective upon filing. Accordingly, shares of Class A common stock registered under such registration statements will be available for sale in the open market. We expect that the initial registration statement on Form S-8 will cover up to 10,000,000 shares of Class A common stock. Accordingly, shares registered under such registration statement will be available for sale in the open market following the effective date, unless such shares are subject to vesting restrictions, Rule 144 restrictions applicable to our affiliates or the lock-up agreements described below.
Our certificate of incorporation authorizes us to issue additional shares of Class A common stock and options, rights, warrants and appreciation rights relating to Class A common stock for the consideration and on the terms and conditions established by our board of directors in its sole discretion. In accordance with the DGCL and the provisions of our certificate of incorporation, we may also issue preferred stock that has designations, preferences, rights, powers and duties that are different from, and may be senior to, those applicable to shares of Class A common stock. See “Description of Capital Stock.” Similarly, the limited liability company agreement of PBF LLC permits PBF LLC to issue an unlimited number of additional limited liability company interests of
158
Table of Contents
PBF LLC with designations, preferences, rights, powers and duties that are different from, and may be senior to, those applicable to the PBF LLC Series A Units and PBF LLC Series C Units, and which may be exchangeable for shares of our Class A common stock.
Rule 144
In general, under Rule 144 as currently in effect, beginning 90 days after the effective date of this prospectus, a person, including any of our “affiliates” who has beneficially owned shares of our Class A common stock for at least six months would be entitled to sell within any three-month period a number of shares that does not exceed the greater of either of the following:
| • | 1% of the number of shares of Class A common stock then outstanding, which will equal approximately of the shares outstanding immediately after this offering; and |
| • | the average weekly trading volume of the Class A common stock on the NYSE during the four calendar weeks preceding the filing of a notice on Form 144 with respect to the sale. |
Sales by affiliates under Rule 144 also are subject to manner of sale provisions and notice requirements and to the availability of current public information about us. Under Rule 144, a person who is not deemed to have been one of our “affiliates” at any time during the 90 days preceding a sale, and who has beneficially owned the shares proposed to be sold for at least six months, including the holding period of any prior owner other than an “affiliate,” is entitled to sell its shares freely so long as current public information about us is available and after a one year holding period without complying with the manner of sale, volume limitation or notice provisions of Rule 144. The sale of these shares, or the perception that sales will be made, could adversely affect the price of our Class A common stock after this offering because a greater supply of shares would be, or would be perceived to be, available for sale in the public market.
Sales under Rule 144 are also subject to the lock-up arrangements described below.
Lock-up Agreements
In connection with this offering, we, our executive officers and directors, and Blackstone and First Reserve have agreed with the underwriters, subject to certain exceptions, not to sell, dispose of or hedge any of our Class A common stock or securities convertible into or exchangeable for shares of Class A common stock, during the period ending 180 days after the date of this prospectus, except with the prior written consent of Citigroup Global Markets Inc. and Morgan Stanley & Co. LLC. See “Underwriting.” We may, however, grant awards under our equity incentive plans and issue shares of Class A common stock upon the exercise of outstanding options and warrants, and we may issue or sell shares of Class A common stock under certain other circumstances.
The 180-day restricted period described in the preceding paragraph will be automatically extended if (a) during the last 17 days of the 180-day restricted period we issue an earnings release or announce material news or a material event relating to us occurs or (b) prior to the expiration of the 180-day restricted period, we announce that we will release earnings results during the 16-day period beginning on the last day of the 180-day restricted period, in which case the restrictions described in the preceding paragraph will continue to apply until the expiration of the 18-day period beginning on the date of issuance of the earnings release or the announcement of the material news or material event.
Rule 701
Under Rule 701, any of our employees, consultants or advisors who purchase shares from us in connection with a qualified compensatory stock plan or other written agreement and are not deemed to be an affiliate of ours during the immediately preceding 90 days are eligible to resell those shares 90 days after the effective date of this offering in reliance on Rule 144, but without compliance with various restrictions, including the holding period, contained in Rule 144.
159
Table of Contents
Registration Rights Agreement
In connection with this offering, we will enter into a registration rights agreement with our existing owners pursuant to which we will grant them and their affiliates and certain of their transferees the right, under certain circumstances and subject to certain restrictions, to require us to register under the Securities Act shares of Class A common stock delivered in exchange for PBF LLC Series A Units or otherwise beneficially owned by them. Securities registered under any such registration statement will be available for sale in the open market unless restrictions apply. See “Certain Relationships and Related Transactions—Registration Rights Agreement.”
Effect of Sales of Shares
Prior to this offering, there was no public market for our Class A common stock, and no prediction can be made as to the effect, if any, that market sales of shares of Class A common stock or the availability of shares for sale will have on the market price of our Class A common stock. Nevertheless, sales of significant numbers of shares of our Class A common stock in the public market after the completion of this offering could adversely affect the market price of our Class A common stock and impair our future ability to raise capital through an offering of our equity securities.
160
Table of Contents
CERTAIN U.S. FEDERAL INCOME AND ESTATE TAX CONSEQUENCES TO NON-U.S. HOLDERS
The following is a summary of certain United States federal income and estate tax consequences, as of the date hereof, of the purchase, ownership and sale or exchange of our Class A common stock by a non-U.S. holder. This summary deals only with Class A common stock that is purchased in this offering and is held as a capital asset by a non-U.S. holder.
Except as modified for United States federal estate tax purposes (as described below), a “non-U.S. holder” means a beneficial owner of our Class A common stock that, for United States federal income tax purposes, is an individual, corporation, estate or trust other than:
| • | an individual who is a citizen or resident of the United States; |
| • | a corporation, or other entity taxable as a corporation, created or organized under the laws of the United States, any state thereof or the District of Columbia; |
| • | an estate the income of which is subject to United States federal income taxation regardless of its source; or |
| • | a trust that (1) is subject to the primary supervision of a court within the United States if one or more United States persons have the authority to control all substantial decisions of the trust or (2) was in existence on August 20, 1996, and has a valid election in effect under applicable United States Treasury regulations to continue to be treated as a United States person. |
If a partnership holds our Class A common stock, the tax treatment of a partner will generally depend upon the status of the partner and the activities of the partnership. If you are a partnership or a partner in a partnership considering an investment in our Class A common stock, you should consult your own tax advisor.
This summary is based upon provisions of the Code, and regulations, rulings and judicial decisions as of the date hereof. Those authorities may be changed, perhaps retroactively, so as to result in United States federal income and estate tax consequences different from those summarized below. This summary does not address all aspects of United States federal income and estate taxation and does not deal with other United States federal taxes (such as gift taxes or the recently enacted Medicare tax on investment income) or foreign, state, local or other tax considerations that may be relevant to non-U.S. holders in light of their personal circumstances. Further, this discussion does not describe all of the United States federal income tax consequences that may be relevant to holders subject to special rules, such as:
| • | financial institutions; |
| • | insurance companies; |
| • | dealers in securities; |
| • | persons holding our common stock as part of a hedge, “straddle,” integrated transaction or similar transaction; |
| • | partnerships or other entities classified as partnerships for United States federal income tax purposes (or investors in such entities); |
| • | United States expatriates or certain long-term residents of the United States; |
| • | tax-exempt entities; |
| • | controlled foreign corporations; |
| • | passive foreign investment companies; or |
| • | persons subject to the alternative minimum tax. |
161
Table of Contents
If you are considering an investment in our Class A common stock, you should consult your own tax advisor concerning the particular United States federal income and estate tax consequences to you of the purchase, ownership and sale or exchange of our Class A common stock, as well as the consequences to you arising under other United States federal tax laws and the laws of any other taxing jurisdiction.
The following summary assumes that a non-U.S. holder will structure its ownership of Class A common stock so as to avoid the withholding taxes that otherwise would be imposed under recently enacted legislation, as described below under “—Additional Withholding Requirements.”
Dividends
Dividends paid to a non-U.S. holder generally will be subject to withholding of United States federal income tax at a 30% rate or such lower rate as may be specified by an applicable income tax treaty. However, dividends that are effectively connected with the conduct of a trade or business by a non-U.S. holder within the United States are not subject to the withholding tax, provided such non-U.S. holder provides proper documentation, such as an applicable Internal Revenue Service (“IRS”) Form W-8 or an appropriate substitute form. Instead, unless an applicable income tax treaty provides otherwise, such dividends are subject to United States federal income tax on a net income basis in generally the same manner as if the non-U.S. holder were a United States person as defined under the Code. In addition, if the non-U.S. holder is a foreign corporation, it may be subject to a “branch profits tax” equal to 30% (or a lower applicable income tax treaty rate) of its effectively connected earnings and profits attributable to such dividends, subject to adjustments.
A non-U.S. holder who wishes to claim the benefit of an applicable income tax treaty for dividends generally will be required (a) to complete IRS Form W-8BEN (or an appropriate substitute form) and certify under penalty of perjury that such holder is not a United States person as defined under the Code and is eligible for treaty benefits or (b) if our Class A common stock is held through certain foreign intermediaries, to satisfy the relevant certification requirements of applicable United States Treasury regulations. Special certification and other requirements apply to certain non-U.S. holders that are pass-through entities rather than corporations or individuals.
A non-U.S. holder eligible for a reduced rate of United States federal withholding tax pursuant to an applicable income tax treaty may obtain a refund of any excess amounts withheld by timely filing an appropriate claim for refund with the IRS.
Gain on Sale or Exchange of Our Class A Common Stock
Any gain realized on the sale or exchange of our Class A common stock generally will not be subject to United States federal income tax unless:
| • | the gain is effectively connected with a trade or business of the non-U.S. holder in the United States (and, if required by an applicable income tax treaty, is attributable to a United States permanent establishment of the non-U.S. holder); |
| • | the non-U.S. holder is an individual who is present in the United States for 183 days or more in the taxable year of the sale or exchange, and certain other conditions are met; or |
| • | we are or have been a “United States real property holding corporation” for United States federal income tax purposes at some time during the shorter of (a) the five-year period preceding the sale or exchange or (b) the non-U.S. holder’s holding period for the Class A common stock in question (such shorter period, the “Applicable Period”). |
Unless an applicable income tax treaty provides otherwise, a non-U.S. holder described in the first bullet point immediately above will be subject to tax on the net gain derived from the sale or exchange in generally the same manner as if the non-U.S. holder were a United States person as defined under the Code. A non-U.S. holder
162
Table of Contents
that is a foreign corporation described in the first bullet point immediately above may also be subject to a branch profits tax equal to 30% (or a lower applicable income tax treaty rate) of its effectively connected earnings and profits attributable to such gain, subject to adjustments.
Unless an applicable income tax treaty provides otherwise, an individual non-U.S. holder described in the second bullet point immediately above will be subject to a flat 30% tax on the gain derived from the sale or exchange, which may be offset by United States source capital losses, even though the individual is not considered a resident of the United States.
Although the matter is not free from doubt, we believe we currently are not a “United States real property holding corporation” for United States federal income tax purposes. The determination of whether we become a “United States real property holding corporation” in the future will depend on the value of our assets treated as “real property” for this purpose relative to the value of all our assets, and such values are subject to fluctuations. If we are or become a “United States real property holding corporation,” so long as our Class A common stock continues to be regularly traded on an established securities market, only a non-U.S. holder who actually or constructively holds or held (at any time during the Applicable Period) more than 5% of our Class A common stock will be subject to United States federal income tax on the sale or exchange of our Class A common stock. Such a non-U.S. holder generally will be subject to tax on any gain in the same manner as a non-U.S. holder whose gain is effectively connected income, except that such gain should not be included in effectively connected earnings and profits for purposes of the branch profits tax.
Federal Estate Tax
Class A common stock held or treated as held by an individual who, at the time of death, is not a citizen or resident of the United States (as specifically defined for United States federal estate tax purposes) will be included in such holder’s gross estate for United States federal estate tax purposes, unless an applicable estate tax treaty provides otherwise.
Information Reporting and Backup Withholding
Information returns will be filed with the IRS in connection with dividend payments. Copies of the information returns reporting such dividend payments and any withholding may also be made available to the tax authorities in the country in which a non-U.S. holder resides under the provisions of an applicable income tax treaty.
A non-U.S. holder will be subject to backup withholding for dividends paid to such holder unless such holder certifies under penalty of perjury that it is a non-U.S. holder (and the payor does not have actual knowledge or reason to know that such holder is a United States person as defined under the Code), or such holder otherwise establishes an exemption.
Information reporting and, depending on the circumstances, backup withholding generally will apply to the proceeds of a sale or exchange of our Class A common stock within the United States or conducted through certain United States-related financial intermediaries, unless the beneficial owner certifies under penalty of perjury that it is a non-U.S. holder (and the payor does not have actual knowledge or reason to know that the beneficial owner is a United States person as defined under the Code), or such owner otherwise establishes an exemption.
The amount of any backup withholding from a payment to a non-U.S. holder will be allowed as a credit against the non-U.S. holder’s United States federal income tax liability and may entitle the non-U.S. holder to a refund, provided that the required information is timely furnished to the IRS.
163
Table of Contents
Additional Withholding Requirements
Legislation was enacted in 2010 that will materially change the requirements for obtaining an exemption from United States federal withholding tax and impose withholding taxes on certain types of payments made to “foreign financial institutions” and certain other non-U.S. entities. In general, and depending on the specific facts and circumstances, the failure to comply with certain certification, information reporting and other specified requirements will result in a 30% withholding tax being imposed on “withholdable payments” to such institutions and entities, including payments of dividends and proceeds from the sale or exchange of our common stock. The legislation generally applies to payments made after December 31, 2012, although Proposed Treasury Regulations from the IRS provide that withholding obligations with respect to payments of dividends will not begin until January 1, 2014, and a recent IRS notice provides that withholding obligations with respect to gross proceeds from the sale or exchange of common stock will not begin until January 1, 2017. Each prospective investor should consult its tax advisor regarding this legislation and the potential implications of this legislation on its investment in our common stock.
164
Table of Contents
Citigroup Global Markets Inc., Morgan Stanley & Co. LLC, Credit Suisse Securities (USA) LLC and Deutsche Bank Securities Inc. are acting as joint book-running managers of the offering and Citigroup Global Markets Inc. and Morgan Stanley & Co. LLC are acting as the representatives of the underwriters named below. Under the terms and subject to the conditions contained in an underwriting agreement dated the date of this prospectus, the underwriters named below have severally agreed to purchase, and we have agreed to sell to them, severally the number of shares of Class A common stock indicated below:
| Name |
Number of Shares | |
| Citigroup Global Markets Inc. |
||
| Morgan Stanley & Co. LLC |
||
| Credit Suisse Securities (USA) LLC |
||
| Deutsche Bank Securities Inc. |
||
| UBS Securities LLC |
||
| Barclays Capital Inc. |
||
|
| ||
| Total |
||
|
|
The underwriters are offering the shares of Class A common stock subject to their acceptance of the shares from us and subject to prior sale. The underwriting agreement provides that the obligations of the several underwriters to pay for and accept delivery of the shares of Class A common stock offered by this prospectus are subject to the approval of certain legal matters by their counsel and to certain other conditions. The underwriters are obligated to take and pay for all of the shares of Class A common stock offered by this prospectus if any such shares are taken. However, the underwriters are not required to take or pay for the shares covered by the underwriters’ over-allotment option described below.
The underwriters initially propose to offer part of the shares of Class A common stock directly to the public at the public offering price listed on the cover page of this prospectus and part to certain dealers at a price that represents a concession not in excess of $ a share under the public offering price. After the initial offering of the shares of Class A common stock, the offering price and other selling terms may from time to time be varied by the underwriters including in connection with sales of unsold allotments of Class A common stock or subsequent sales of Class A common stock purchased by the underwriters in stabilizing and related transactions.
We granted to the underwriters an option, exercisable for 30 days from the date of this prospectus, to purchase up to additional shares of our Class A common stock at the public offering price listed on the cover page of this prospectus, less underwriting discounts and commissions. To the extent the option is exercised, each underwriter will become obligated, subject to certain conditions, to purchase about the same percentage of the additional shares of Class A common stock as the number listed next to the underwriter’s name in the preceding table bears to the total number of shares of Class A common stock listed next to the names of all underwriters in the preceding table.
The following table shows the per share and total public offering price, underwriting discounts and commissions and proceeds before expenses to us. These amounts are shown assuming both no exercise and full exercise of the underwriters’ option to purchase up to additional shares of our Class A common stock.
| Per Share | Total | |||||
| Without Option |
With Option | |||||
| Public offering price |
||||||
| Underwriting discounts and commissions |
||||||
| Proceeds, before expenses, to us |
||||||
165
Table of Contents
The estimated offering expenses payable by us, are approximately $ million, which includes legal, accounting and printing costs and various other fees associated with the registration of the Class A common stock to be sold pursuant to this prospectus.
The underwriters have informed us that they do not intend sales to discretionary accounts to exceed % of the total number of shares of Class A common stock offered by them.
We have applied to have our Class A common stock approved for listing on the New York Stock Exchange under the symbol “PBF”.
At our request, the underwriters have reserved for sale, at the public offering price, up to shares of Class A common stock offered by this prospectus for sale to some of our directors, officers, employees and certain other persons who are otherwise associated with us through a directed share program. If these persons purchase reserved shares of Class A common stock, this will reduce the number of shares available for sale to the general public. Any reserved shares of Class A common stock that are not so purchased will be offered by the underwriters to the general public on the same terms as the other shares of Class A common stock offered by this prospectus.
We and all of our directors and executive officers have agreed that, without the prior written consent of Citigroup Global Markets Inc. and Morgan Stanley & Co. LLC on behalf of the underwriters, we and they will not, during the period ending 180 days after the date of this prospectus:
| • | offer, pledge, sell, contract to sell, sell any option or contract to purchase, purchase any option or contract to sell, grant any option, right or warrant to purchase, lend or otherwise transfer or dispose of, directly or indirectly, any shares of Class A common stock or any securities convertible into or exercisable or exchangeable for shares of Class A common stock; |
| • | enter into any swap or other arrangement that transfers to another, in whole or in part, any of the economic consequences of ownership of the Class A common stock; or |
| • | file any registration statement with the Securities and Exchange Commission relating to the offering of any shares of Class A common stock or any securities convertible into or exercisable or exchangeable for Class A common stock; |
whether any such transaction described in the first two bullet points above is to be settled by delivery of Class A common stock or such other securities, in cash or otherwise. In addition, we and each such person agrees that, without the prior written consent of Citigroup Global Markets Inc. and Morgan Stanley & Co. LLC, on behalf of the underwriters, each such person will not, during the period ending 180 days after the date of this prospectus, make any demand for, or exercise any right with respect to, the registration of any shares of common stock or any security convertible into or exercisable or exchangeable for common stock.
The restrictions in the immediately preceding paragraph do not apply to:
| • | the sale of Class A common stock to the underwriters pursuant to the underwriting agreement; |
| • | the issuance by us of Class A common stock upon the exercise of an option or a warrant or the conversion of a security outstanding on the date of this prospectus of which the underwriters have been advised in writing or are described in this prospectus; |
| • | the issuance by us, and the receipt by a holder, of equity awards pursuant to employee benefit plans described in this prospectus, so long as the recipient signs and delivers a lock-up letter agreement and the Class A common stock underlying such awards do not vest during the restricted period; |
| • | the establishment of a trading plan pursuant to Rule 10b5-1 under the Exchange Act, for the transfer of Class A common stock; provided that such plan does not provide for the transfer of Class A common |
166
Table of Contents
| stock during the 180-day restricted period and to the extent a public announcement or filing under the Exchange Act, if any, is required of or voluntarily made by or on behalf of the holder or us regarding the establishment of such plan, such announcement or filing shall include a statement to the effect that no transfer of Class A common stock may be made under such plan during the 180-day restricted period; |
| • | our issuance of shares of Class A common stock as consideration for bona fide acquisitions, in an aggregate number of shares not to exceed 10% of the total number of shares of Class A common stock issued and outstanding as of the date of such acquisition agreement, provided that each recipient of these shares of Class A common stock shall be subject to the lock-up restrictions described herein; |
| • | the filing of one or more registration statements on Form S-8 with respect to the issuance by us of equity awards pursuant to employee benefit plans described in this prospectus; |
| • | the issuance of Class A common stock, and the filing of one or more registration statements on Form S-1 with respect to such Class A common stock, pursuant to the Exchange Agreement described in this prospectus so long as the recipient signs and delivers a lock-up letter agreement; |
| • | transactions by any person other than us relating to Class A common stock or other securities acquired in open market transactions after the closing of the offering of the Class A common stock; provided that no filing under Section 16(a) of the Exchange Act is required or will be voluntarily made in connection with subsequent sales of Class A common stock or other securities acquired in such open market transactions; |
| • | transfers of shares of Class A common stock or any security convertible into or exchangeable or exercisable for Class A common stock (i) as a bona fide gift or for bona fide estate planning purposes, (ii) upon death or by will, testamentary document or intestate succession, (iii) to an immediate family member of the holder or to any trust for the direct or indirect benefit of the holder or the immediate family of the holder, (iv) not involving a change in beneficial ownership, or (v) if the undersigned is a trust, to any beneficiary of the holder or to the estate of any such beneficiary; |
| • | distributions of shares of Class A common stock or any security convertible into or exchangeable or exercisable for Class A common stock to any direct or indirect, current or former partners (general or limited), members or managers of the holder, as applicable, or to the estates of any such partners, members or managers; provided that in the case of any transfer or distribution pursuant to this exception or the prior exception above, (i) each such transferee, donee or distributee shall sign and deliver a lock-up letter agreement and (ii) no filing under Section 16(a) of the Exchange Act (other than a filing on Form 5), reporting a reduction in beneficial ownership of shares of Class A common stock, shall be required or shall be voluntarily made during the restricted period; |
| • | transfer of shares of Class A common stock or any security convertible into or exercisable or exchangeable for Class A common stock that occurs by operation of law, such as pursuant to a qualified domestic order or in connection with a divorce settlement; |
| • | any transfer of shares of Class A common stock or any security convertible into or exercisable or exchangeable for Class A common stock to us or PBF LLC, pursuant to agreements under which we or PBF LLC has the option to repurchase such shares or a right of first refusal with respect to transfers of such shares; or |
| • | in the event of undue hardship, any transfer of shares after notice to, and with the prior written consent (not to be unreasonably withheld) of, Morgan Stanley & Co. LLC and Citigroup Global Markets Inc. |
167
Table of Contents
We have been advised by Citigroup Global Markets Inc. and Morgan Stanley & Co. LLC that they have no present intention, and there are no agreements, tacit or explicit, regarding the possible early release of the locked-up shares.
The 180-day restricted period described in the preceding paragraphs will be extended if:
| • | during the last 17 days of the 180-day restricted period, we issue an earnings release or material news or a material event relating to us occurs; or |
| • | prior to the expiration of the 180-day restricted period, we announce that we will release earnings results during the 16-day period beginning on the last day of the 180-day period; |
in which case the restrictions described in the preceding paragraphs will continue to apply until the expiration of the 18-day period beginning on the issuance of the earnings release or the occurrence of the material news or material event.
In order to facilitate this offering of the Class A common stock, the underwriters may engage in transactions that stabilize, maintain or otherwise affect the price of the Class A common stock. Specifically, the underwriters may sell more shares than they are obligated to purchase under the underwriting agreement, creating a short position. A short sale is covered if the short position is no greater than the number of shares available for purchase by the underwriters under the over-allotment option. The underwriters can close out a covered short sale by exercising the over-allotment option or purchasing shares in the open market. In determining the source of shares to close out a covered short sale, the underwriters will consider, among other things, the open market price of shares compared to the price available under the over-allotment option. The underwriters may also sell shares in excess of the over-allotment option, creating a naked short position. The underwriters must close out any naked short position by purchasing shares in the open market. A naked short position is more likely to be created if the underwriters are concerned that there may be downward pressure on the price of the Class A common stock in the open market after pricing that could adversely affect investors who purchase in this offering. In addition, to stabilize the price of Class A common stock, the underwriters may bid for, and purchase, shares of Class A common stock in the open market. Finally, the underwriting syndicate may reclaim selling concessions allowed to an underwriter or a dealer for distributing the Class A common stock in this offering, if the syndicate repurchases previously distributed Class A common stock to cover syndicate short positions or to stabilize the price of the Class A common stock. These activities may raise or maintain the market price of the Class A common stock above independent market levels or prevent or retard a decline in the market price of the Class A common stock. The underwriters are not required to engage in these activities and may end any of these activities at any time.
In connection with this offering, the underwriters may engage in passive market making transactions in the Class A common stock on the NYSE in accordance with Rule 103 of Regulation M under the Exchange Act during the period before the commencement of offers or sales of Class A common stock and extending through the completion of distribution. A passive market maker must display its bids at a price not in excess of the highest independent bid of the Class A common stock. However, if all independent bids are lowered below the passive market maker’s bid, that bid must be lowered when specified purchase limits are exceeded.
The underwriters and their respective affiliates are full-service financial institutions engaged in various activities, which may include securities trading, commercial and investment banking, financial advisory, investment management, investment research, principal investment, hedging, financing and brokerage activities. In the ordinary course of their various business activities, the underwriters and their respective affiliates may make or hold a broad array of investments and actively trade debt and equity securities (or related derivative securities) and financial instruments (including bank loans) for their own account and for the accounts of their customers, and such investment and securities activities may involve securities and/or instruments of ours. The underwriters and their respective affiliates may also make investment recommendations and/or publish or express
168
Table of Contents
independent research views in respect of such securities or instruments and may at any time hold, or recommend to clients that they acquire, long and/or short positions in such securities and instruments. The underwriters and their affiliates have in the past engaged, currently engage and may in the future engage, in transactions with and perform services for, including commercial banking, financial advisory and investment banking services, us and our affiliates in the ordinary course of business for which they have received or will receive customary fees and expenses. From time to time, certain of the underwriters and/or their respective affiliates may provide investment banking services to us. Affiliates of one or more of the underwriters act as lenders and/or agents under, and as consideration therefor received customary fees and expenses in connection with, the ABL Revolving Credit Facility. UBS AG, Stamford Branch, an affiliate of one of the underwriters, is the administrative agent under our ABL Revolving Credit Facility and receives fees in connection with such role. MSCG, an affiliate of one of our underwriters, is the counterparty to our product offtake agreements for the Paulsboro and Delaware City refineries, and the counterparty to our crude oil and feedstock agreement for our Toledo refinery. DB Energy Trading LLC, an affiliate of one of our underwriters, is the counterparty to our catalyst lease at our Delaware City and our Toledo refineries. In addition, affiliates of certain of the underwriters are participants under our L/C Facility. Affiliates of certain of the underwriters acted as initial purchasers, and received fees in connection with, our senior secured notes offering.
We and the underwriters have agreed to indemnify each other against certain liabilities, including liabilities under the Securities Act.
A prospectus in electronic format may be made available on websites maintained by one or more underwriters participating in this offering. The representatives may agree to allocate a number of shares to underwriters for sale to their online brokerage account holders. Internet distribution will be allocated by the representatives to underwriters that may make Internet distributions on the same basis as other allocations.
Selling Restrictions
European Economic Area
In relation to each Member State of the European Economic Area which has implemented the Prospectus Directive (each, a “Relevant Member State”), each underwriter has represented and agreed that with effect from and including the date on which the Prospectus Directive is implemented in that Relevant Member State (the “Relevant Implementation Date”) it has not made and will not make an offer of shares which are the subject of the offering contemplated by this prospectus to the public in that Relevant Member State other than:
(a) to any legal entity which is a qualified investor as defined in the Prospectus Directive;
(b) to fewer than 100 or, if the Relevant Member State has implemented the relevant provision of the 2010 PD Amending Directive, 150, natural or legal persons (other than qualified investors as defined in the Prospectus Directive), as permitted under the Prospectus Directive subject to obtaining the prior consent of the relevant Dealer or Dealers nominated by the Issuer for any such offer; or
(c) in any other circumstances falling within Article 3(2) of the Prospectus Directive,
provided that no such offer of shares shall require the Issuer or any underwriter to publish a prospectus pursuant to Article 3 of the Prospectus Directive.
For the purposes of this provision, the expression an “offer of shares to the public” in relation to any shares in any Relevant Member State means the communication in any form and by any means of sufficient information on the terms of the offer and the shares to be offered so as to enable an investor to decide to purchase or subscribe the shares, as the same may be varied in that Member State by any measure implementing the Prospectus Directive in that Member State, the expression “Prospectus Directive” means Directive 2003/71/EC
169
Table of Contents
(and amendments thereto, including the 2010 PD Amending Directive, to the extent implemented in the Relevant Member State), and includes any relevant implementing measure in the Relevant Member State and the expression “2010 PD Amending Directive” means Directive 2010/73/EU.
United Kingdom
Each underwriter has represented and agreed that:
(a) (i) it is a person whose ordinary activities involve it in acquiring, holding, managing or disposing of investments (as principal or agent) for the purposes of its business and (ii) it has not offered or sold and will not offer or sell the shares other than to persons whose ordinary activities involve them in acquiring, holding, managing or disposing of investments (as principal or as agent) for the purposes of their businesses or who it is reasonable to expect will acquire, hold, manage or dispose of investments (as principal or agent) for the purposes of their businesses where the issue of the shares would otherwise constitute a contravention of Section 19 of the FSMA by the Issuer;
(b) it has only communicated or caused to be communicated and will only communicate or cause to be communicated an invitation or inducement to engage in investment activity (within the meaning of Section 21 of the FSMA) received by it in connection with the issue or sale of the shares in circumstances in which Section 21(1) of the FSMA does not apply to the Issuer; and
(c) it has complied and will comply with all applicable provisions of the FSMA with respect to anything done by it in relation to the shares in, from or otherwise involving the United Kingdom.
France
Neither this prospectus nor any other offering material relating to the shares described in this prospectus has been submitted to the clearance procedures of the Autorité des Marchés Financiers or of the competent authority of another member state of the European Economic Area and notified to the Autorité des Marchés Financiers. The shares have not been offered or sold and will not be offered or sold, directly or indirectly, to the public in France. Neither this prospectus nor any other offering material relating to the shares has been or will be:
| • | released, issued, distributed or caused to be released, issued or distributed to the public in France; or |
| • | used in connection with any offer for subscription or sale of the shares to the public in France. |
Such offers, sales and distributions will be made in France only:
| • | to qualified investors (investisseurs qualifiés) and/or to a restricted circle of investors (cercle restreint d’investisseurs), in each case investing for their own account, all as defined in, and in accordance with articles L.411-2, D.411-1, D.411-2, D.734-1, D.744-1, D.754-1 and D.764-1 of the French Code monétaire et financier; |
| • | to investment services providers authorized to engage in portfolio management on behalf of third parties; or |
| • | in a transaction that, in accordance with article L.411-2-II-1°-or-2°-or 3° of the French Code monétaire et financier and article 211-2 of the General Regulations (Règlement Général) of the Autorité des Marchés Financiers, does not constitute a public offer (appel public à l’épargne). |
The shares may be resold directly or indirectly, only in compliance with articles L.411-1, L.411-2, L.412-1 and L.621-8 through L.621-8-3 of the French Code monétaire et financier.
170
Table of Contents
Hong Kong
The shares may not be offered or sold by means of any document other than (i) in circumstances which do not constitute an offer to the public within the meaning of the Companies Ordinance (Cap.32, Laws of Hong Kong), or (ii) to “professional investors” within the meaning of the Securities and Futures Ordinance (Cap.571, Laws of Hong Kong) and any rules made thereunder, or (iii) in other circumstances which do not result in the document being a “prospectus” within the meaning of the Companies Ordinance (Cap.32, Laws of Hong Kong), and no advertisement, invitation or document relating to the shares may be issued or may be in the possession of any person for the purpose of issue (in each case whether in Hong Kong or elsewhere), which is directed at, or the contents of which are likely to be accessed or read by, the public in Hong Kong (except if permitted to do so under the laws of Hong Kong) other than with respect to shares which are or are intended to be disposed of only to persons outside Hong Kong or only to “professional investors” within the meaning of the Securities and Futures Ordinance (Cap. 571, Laws of Hong Kong) and any rules made thereunder.
Singapore
This prospectus has not been registered as a prospectus with the Monetary Authority of Singapore. Accordingly, this prospectus and any other document or material in connection with the offer or sale, or invitation for subscription or purchase, of the shares may not be circulated or distributed, nor may the shares be offered or sold, or be made the subject of an invitation for subscription or purchase, whether directly or indirectly, to persons in Singapore other than (i) to an institutional investor under Section 274 of the Securities and Futures Act, Chapter 289 of Singapore (the “SFA”), (ii) to a relevant person, or any person pursuant to Section 275(1A), and in accordance with the conditions, specified in Section 275 of the SFA or (iii) otherwise pursuant to, and in accordance with the conditions of, any other applicable provision of the SFA.
Where the shares are subscribed or purchased under Section 275 by a relevant person which is: (a) a corporation (which is not an accredited investor) the sole business of which is to hold investments and the entire share capital of which is owned by one or more individuals, each of whom is an accredited investor; or (b) a trust (where the trustee is not an accredited investor) whose sole purpose is to hold investments and each beneficiary is an accredited investor, shares, debentures and units of shares and debentures of that corporation or the beneficiaries’ rights and interest in that trust shall not be transferable for six months after that corporation or that trust has acquired the shares under Section 275 except: (1) to an institutional investor under Section 274 of the SFA or to a relevant person, or any person pursuant to Section 275(1A), and in accordance with the conditions, specified in Section 275 of the SFA; (2) where no consideration is given for the transfer; or (3) by operation of law.
Japan
The shares offered in this prospectus have not been registered under the Financial Instruments and Exchange Law of Japan. The shares have not been offered or sold and will not be offered or sold, directly or indirectly, in Japan or to or for the account of any resident of Japan, (which term as used herein means any person resident in Japan, including any corporation or other entity organized under the laws of Japan) or to others for re-offering or resale, directly or indirectly, in Japan or to a resident of Japan, except (i) pursuant to an exemption from the registration requirements of the Securities and Exchange Law and (ii) in compliance with any other applicable requirements of the Financial Instruments and Exchange Law and any other applicable laws, regulations and ministerial guidelines of Japan.
Switzerland
This document as well as any other material relating to the shares which are the subject of the offering contemplated by this Prospectus (the “Shares”) do not constitute an issue prospectus pursuant to Article 652a of the Swiss Code of Obligations. The Shares will not be listed on the SWX Swiss Exchange and, therefore, the documents relating to the Shares, including, but not limited to, this document, do not claim to comply with the disclosure standards of the listing rules of SWX Swiss Exchange and corresponding prospectus schemes annexed to the listing rules of the SWX Swiss Exchange.
171
Table of Contents
The Shares are being offered in Switzerland by way of a private placement, i.e. to a small number of selected investors only, without any public offer and only to investors who do not purchase the Shares with the intention to distribute them to the public. The investors will be individually approached by the Company from time to time.
This document as well as any other material relating to the Shares is personal and confidential and do not constitute an offer to any other person. This document may only be used by those investors to whom it has been handed out in connection with the offering described herein and may neither directly nor indirectly be distributed or made available to other persons without express consent of the Company. It may not be used in connection with any other offer and shall in particular not be copied and/or distributed to the public in (or from) Switzerland.
Dubai International Financial Centre
This document relates to an exempt offer in accordance with the Offered Securities Rules of the Dubai Financial Services Authority. This document is intended for distribution only to persons of a type specified in those rules. It must not be delivered to, or relied on by, any other person. The Dubai Financial Services Authority has no responsibility for reviewing or verifying any documents in connection with exempt offers. The Dubai Financial Services Authority has not approved this document nor taken steps to verify the information set out in it, and has no responsibility for it. The shares which are the subject of the offering contemplated by this Prospectus (the “Shares”) may be illiquid and/or subject to restrictions on their resale.
Prospective purchasers of the Shares offered should conduct their own due diligence on the Shares. If you do not understand the contents of this document you should consult an authorized financial adviser.
172
Table of Contents
The validity of the issuance of our shares of Class A common stock offered by this prospectus will be passed upon for us by Stroock & Stroock & Lavan LLP, New York, New York. Certain legal matters relating to this offering will be passed upon for the underwriters by Cahill Gordon & Reindel LLP, New York, New York.
The balance sheet of PBF Energy Inc. as of December 31, 2011 included in this prospectus has been audited by Deloitte & Touche LLP, an independent registered public accounting firm, as stated in their report appearing herein. Such balance sheet is included in reliance upon the report of such firm given upon their authority as experts in accounting and auditing.
The consolidated financial statements of PBF Energy Company LLC and subsidiaries (combined and consolidated with PBF Investments LLC and affiliates) as of December 31, 2011 and 2010 and for each of the three years in the period ended December 31, 2011, included in this prospectus, have been audited by Deloitte & Touche LLP, an independent registered public accounting firm, as stated in their report appearing herein. Such financial statements are included in reliance upon the report of such firm given upon their authority as experts in accounting and auditing.
The financial statements of the Paulsboro Refining Business as of December 16, 2010 and for the period from January 1, 2010 through December 16, 2010 and for the year ended December 31, 2009, have been included herein and in the registration statement in reliance upon the report of KPMG LLP, independent registered public accounting firm, appearing elsewhere herein, and upon the authority of said firm as experts in accounting and auditing.
The statement of assets acquired and liabilities assumed of the Toledo Refinery as of December 31, 2010 and the related statements of revenues and direct expenses for each of the two years in the period ended December 31, 2010, appearing in this prospectus and registration statement have been audited by Ernst & Young LLP, independent auditors, as set forth in their report thereon appearing elsewhere herein, and are included in reliance upon such report given on the authority of such firm as experts in accounting and auditing.
WHERE YOU CAN FIND MORE INFORMATION
We have filed with the SEC a registration statement on Form S-1 with respect to the shares of Class A common stock offered hereby. This prospectus, which constitutes a part of the registration statement, does not contain all of the information set forth in the registration statement, or the exhibits and schedules which are part of the registration statement. For further information about us and our Class A common stock, you should refer to the registration statement and to its exhibits and schedules.
You may read and copy any document we file at the SEC’s public reference facility at 100 F Street, N.E., Washington, D.C. 20549. You may also obtain copies of the documents at prescribed rates by writing to the Public Reference Section of the SEC at 100 F Street, N.E., Washington, D.C. 20549. Please call the SEC at 1-800-SEC-0330 for further information on the public reference facility. Our SEC filings are also available to the public from the SEC’s website at http://www.sec.gov, and at our website at http://www.pbfenergy.com. Information on our website does not constitute a part of this prospectus.
173
Table of Contents
Upon completion of this offering, we will become subject to the information and periodic reporting requirements of the Exchange Act and will file periodic reports, proxy statements and other information with the SEC. Such periodic reports, proxy statements and other information will be available for inspection and copying at the SEC’s public reference rooms and the website of the SEC referred to above.
We intend to furnish our Class A common stockholders annual reports containing audited consolidated financial statements and will make available copies of quarterly reports for the first three quarters of each year containing unaudited interim consolidated financial information.
174
Table of Contents
F-1
Table of Contents
REPORT OF INDEPENDENT REGISTERED PUBLIC ACCOUNTING FIRM
To the Board of Directors and Stockholder of
PBF Energy Inc.
Parsippany, New Jersey
We have audited the accompanying balance sheet of PBF Energy Inc. (the “Company”) as of December 31, 2011. This financial statement is the responsibility of the Company’s management. Our responsibility is to express an opinion on this financial statement based on our audit.
We conducted our audit in accordance with the standards of the Public Company Accounting Oversight Board (United States). Those standards require that we plan and perform the audit to obtain reasonable assurance about whether the financial statement is free of material misstatement. The Company is not required to have, nor were we engaged to perform, an audit of its internal control over financial reporting. Our audit included consideration of internal control over financial reporting as a basis for designing audit procedures that are appropriate in the circumstances, but not for the purpose of expressing an opinion on the effectiveness of the Company’s internal control over financial reporting. Accordingly, we express no such opinion. An audit also includes examining, on a test basis, evidence supporting the amounts and disclosures in the financial statement, assessing the accounting principles used and significant estimates made by management, as well as evaluating the overall financial statement presentation. We believe that our audit provides a reasonable basis for our opinion.
In our opinion, such balance sheet presents fairly, in all material respects, the financial position of PBF Energy Inc. as of December 31, 2011, in conformity with accounting principles generally accepted in the United States of America.
/s/ Deloitte & Touche LLP
Parsippany, New Jersey
May 14, 2012
F-2
Table of Contents
BALANCE SHEETS
| ASSETS | September 30, 2012 |
December 31, 2011 |
||||||
| (Unaudited) | ||||||||
| Cash |
$ | 100 | $ | 100 | ||||
|
|
|
|
|
|||||
| Total Assets |
$ | 100 | $ | 100 | ||||
|
|
|
|
|
|||||
| Commitments and contingencies |
||||||||
| STOCKHOLDER'S EQUITY |
||||||||
| Common Stock, par value $0.001 per share, 1,000 shares authorized, 100 issued and outstanding |
$ | — | $ | — | ||||
| Additional paid-in capital |
100 | 100 | ||||||
|
|
|
|
|
|||||
| Total stockholder's equity |
$ | 100 | $ | 100 | ||||
|
|
|
|
|
|||||
See notes to balance sheet
F-3
Table of Contents
NOTES TO BALANCE SHEETS
1—ORGANIZATION
PBF Energy Inc. (the “Corporation”) was formed as a Delaware corporation on November 7, 2011. Pursuant to a reorganization into a holding corporation structure, the Corporation intends to become a holding corporation and its sole assets are expected to be an equity interest in PBF Energy Company LLC. The Corporation expects to be the managing member of PBF Energy Company LLC and will operate and control all of the businesses affairs of PBF Energy Company LLC and, through PBF Energy Company LLC and its subsidiaries, continue to conduct the business now conducted by these subsidiaries.
2—SUMMARY OF SIGNIFICANT ACCOUNTING POLICIES
Basis of Accounting
The Balance Sheets have been prepared in accordance with accounting principles generally accepted in the United States of America. Separate statements of income, changes in stockholders’ equity and cash flows have not been presented in the financial statements because there have been no activities of this entity other than those related to its formation.
3—STOCKHOLDER’S EQUITY
The Corporation is authorized to issue 1,000 shares of common stock, par value $0.001 per share. The Corporation has issued 100 shares of common stock in exchange for $100, all of which were held by PBF Energy Company LLC at September 30, 2012 (unaudited) and December 31, 2011.
4—SUBSEQUENT EVENTS
Subsequent events for the Balance Sheet as of December 31, 2011 have been evaluated through May 14, 2012, the date the financial statement was available to be issued. Subsequent events for the Balance Sheet as of September 30, 2012 (unaudited) have been evaluated through November 6, 2012, the date the financial statement was available to be issued.
F-4
Table of Contents
REPORT OF INDEPENDENT REGISTERED PUBLIC ACCOUNTING FIRM
To the Board of Directors and Members of
PBF Energy Company LLC and subsidiaries:
We have audited the accompanying combined and consolidated balance sheets of PBF Energy Company LLC and subsidiaries (combined and consolidated with PBF Investments LLC and affiliates which are both under common ownership and common management) (the “Company”) as of December 31, 2011 and 2010, and the related combined and consolidated statements of operations and comprehensive income (loss), changes in members’ equity, and cash flows for each of the three years in the period ended December 31, 2011. These financial statements are the responsibility of the Company’s management. Our responsibility is to express an opinion on these financial statements based on our audits.
We conducted our audits in accordance with the standards of the Public Company Accounting Oversight Board (United States). Those standards require that we plan and perform the audit to obtain reasonable assurance about whether the financial statements are free of material misstatement. The Company is not required to have, nor were we engaged to perform, an audit of its internal control over financial reporting. Our audits included consideration of internal control over financial reporting as a basis for designing audit procedures that are appropriate in the circumstances, but not for the purpose of expressing an opinion on the effectiveness of the Company’s internal control over financial reporting. Accordingly, we express no such opinion. An audit also includes examining, on a test basis, evidence supporting the amounts and disclosures in the financial statements, assessing the accounting principles used and significant estimates made by management, as well as evaluating the overall financial statement presentation. We believe that our audits provide a reasonable basis for our opinion.
In our opinion, such combined and consolidated financial statements present fairly, in all material respects, the financial position of PBF Energy Company LLC and subsidiaries (combined and consolidated with PBF Investments LLC and affiliates) as of December 31, 2011 and 2010, and the results of their operations and their cash flows for each of the three years in the period ended December 31, 2011, in conformity with accounting principles generally accepted in the United States of America.
/s/ Deloitte & Touche LLP
Parsippany, New Jersey
May 14, 2012
F-5
Table of Contents
PBF ENERGY COMPANY LLC AND SUBSIDIARIES
(COMBINED AND CONSOLIDATED WITH PBF INVESTMENTS LLC AND AFFILIATES)
CONSOLIDATED BALANCE SHEETS
(IN THOUSANDS, EXCEPT UNIT DATA)
| December 31, 2011 | December 31, 2010 | |||||||
| ASSETS | ||||||||
| Current assets | ||||||||
| Cash and cash equivalents |
$ | 50,166 | $ | 155,457 | ||||
| Accounts receivable, net |
316,252 | 36,937 | ||||||
| Inventories |
1,516,727 | 376,629 | ||||||
| Prepaid expenses and other current assets |
63,359 | 11,106 | ||||||
|
|
|
|
|
|||||
| Total current assets |
1,946,504 | 580,129 | ||||||
| Property, plant and equipment, net |
1,513,947 | 639,565 | ||||||
| Deferred charges and other assets, net |
160,658 | 54,699 | ||||||
|
|
|
|
|
|||||
| Total assets |
$ | 3,621,109 | $ | 1,274,393 | ||||
|
|
|
|
|
|||||
| LIABILITIES AND MEMBERS’ EQUITY |
||||||||
| Current liabilities |
||||||||
| Accounts payable |
$ | 286,067 | $ | 36,302 | ||||
| Accrued expenses |
1,180,812 | 366,515 | ||||||
| Current portion of long-term debt |
4,014 | 1,250 | ||||||
| Deferred revenue |
189,234 | 66,339 | ||||||
|
|
|
|
|
|||||
| Total current liabilities |
1,660,127 | 470,406 | ||||||
|
|
|
|
|
|||||
| Economic Development Authority loan |
20,000 | 20,000 | ||||||
| Long-term debt |
780,851 | 303,814 | ||||||
| Other long-term liabilities |
49,213 | 21,512 | ||||||
|
|
|
|
|
|||||
| Total liabilities |
2,510,191 | 815,732 | ||||||
|
|
|
|
|
|||||
| Commitments and contingencies |
||||||||
| Series B Units, no par or stated value, 1,000,000 issued and outstanding as of December 31, 2011 and 2010. |
3,303 | 1,922 | ||||||
| MEMBERS’ EQUITY |
||||||||
| Series A Units, no par or stated value , 92,257,812 and 51,393,114 issued and outstanding at December 31, 2011 and 2010, respectively. |
923,841 | 514,309 | ||||||
| Retained earnings (accumulated deficit) |
186,150 | (56,521 | ) | |||||
| Accumulated other comprehensive loss |
(2,376 | ) | (1,049 | ) | ||||
|
|
|
|
|
|||||
| Total members’ equity |
1,107,615 | 456,739 | ||||||
|
|
|
|
|
|||||
| Total liabilities, Series B Units, and members’ equity |
$ | 3,621,109 | $ | 1,274,393 | ||||
|
|
|
|
|
|||||
See notes to consolidated financial statements.
F-6
Table of Contents
PBF ENERGY COMPANY LLC AND SUBSIDIARIES
(COMBINED AND CONSOLIDATED WITH PBF INVESTMENTS LLC AND AFFILIATES)
CONSOLIDATED STATEMENTS OF OPERATIONS AND COMPREHENSIVE INCOME (LOSS)
(IN THOUSANDS)
| Years Ended December 31, | ||||||||||||
| 2011 | 2010 | 2009 | ||||||||||
| Revenues |
$ | 14,960,338 | $ | 210,671 | $ | 228 | ||||||
| Costs and expenses |
||||||||||||
| Cost of sales, excluding depreciation |
13,855,163 | 203,971 | — | |||||||||
| Operating expenses, excluding depreciation |
658,831 | 25,140 | — | |||||||||
| General and administrative expenses |
86,183 | 15,859 | 6,294 | |||||||||
| Acquisition related expenses |
728 | 6,051 | — | |||||||||
| Depreciation and amortization expense |
53,743 | 1,402 | 44 | |||||||||
|
|
|
|
|
|
|
|||||||
| 14,654,648 | 252,423 | 6,338 | ||||||||||
|
|
|
|
|
|
|
|||||||
| Income (loss) from operations |
305,690 | (41,752 | ) | (6,110 | ) | |||||||
| Other income (expense) |
||||||||||||
| Change in fair value of catalyst leases |
7,316 | (1,217 | ) | — | ||||||||
| Change in fair value of contingent consideration |
(5,215 | ) | — | — | ||||||||
| Interest (expense) income, net |
(65,120 | ) | (1,388 | ) | 10 | |||||||
|
|
|
|
|
|
|
|||||||
| Net income (loss) |
$ | 242,671 | $ | (44,357 | ) | $ | (6,100 | ) | ||||
|
|
|
|
|
|
|
|||||||
| Consolidated statements of comprehensive income (loss) |
||||||||||||
| Net income (loss) |
$ | 242,671 | $ | (44,357 | ) | $ | (6,100 | ) | ||||
| Unrealized gain (loss) on available for sale securities |
5 | 3 | (13 | ) | ||||||||
| Defined benefit plans unrecognized net gain (loss) |
(1,332 | ) | (1,034 | ) | 5 | |||||||
|
|
|
|
|
|
|
|||||||
| Comprehensive income (loss) |
$ | 241,344 | $ | (45,388 | ) | $ | (6,108 | ) | ||||
|
|
|
|
|
|
|
|||||||
See notes to consolidated financial statements.
F-7
Table of Contents
PBF ENERGY COMPANY LLC AND SUBSIDIARIES
(COMBINED AND CONSOLIDATED WITH PBF INVESTMENTS LLC AND AFFILIATES)
CONSOLIDATED STATEMENTS OF CHANGES IN MEMBERS’ EQUITY
(IN THOUSANDS EXCEPT UNIT DATA)
| PBF Energy Company LLC Members | ||||||||||||||||||||||||||||
| Series A Units |
Series A | PBF Investments LLC |
Accumulated Other Comprehensive Loss |
Retained Earnings (Accumulated Deficit) |
Non Controlling Interest |
Total Members’ Equity |
||||||||||||||||||||||
| Balance December 31, 2008 |
— | $ | — | $ | 10,384 | $ | (10 | ) | $ | (6,229 | ) | $ | 20,665 | $ | 24,810 | |||||||||||||
| Member distributions |
— | — | (8 | ) | — | — | — | (8 | ) | |||||||||||||||||||
| Net loss |
— | — | — | — | (6,100 | ) | — | (6,100 | ) | |||||||||||||||||||
| Unrealized loss on marketable securities |
— | — | — | (13 | ) | — | — | (13 | ) | |||||||||||||||||||
| Defined benefit plan unrecognized net gain |
— | — | — | 5 | — | — | 5 | |||||||||||||||||||||
|
|
|
|
|
|
|
|
|
|
|
|
|
|
|
|||||||||||||||
| Balance at December 31, 2009 |
— | — | 10,376 | (18 | ) | (12,329 | ) | 20,665 | 18,694 | |||||||||||||||||||
| Equity reorganization |
3,087,600 | 30,876 | (10,376 | ) | — | 165 | (20,665 | ) | — | |||||||||||||||||||
| Member capital contributions |
48,305,514 | 483,055 | — | — | — | — | 483,055 | |||||||||||||||||||||
| Stock based compensation |
— | 378 | — | — | — | — | 378 | |||||||||||||||||||||
| Net loss |
— | — | — | — | (44,357 | ) | — | (44,357 | ) | |||||||||||||||||||
| Unrealized gain on marketable securities |
— | — | — | 3 | — | — | 3 | |||||||||||||||||||||
| Defined benefit plan unrecognized net loss |
— | — | — | (1,034 | ) | — | — | (1,034 | ) | |||||||||||||||||||
|
|
|
|
|
|
|
|
|
|
|
|
|
|
|
|||||||||||||||
| Balance at December 31, 2010 |
51,393,114 | 514,309 | — | (1,049 | ) | (56,521 | ) | — | 456,739 | |||||||||||||||||||
| Member capital contributions |
40,864,698 | 408,397 | — | — | — | — | 408,397 | |||||||||||||||||||||
| Stock based compensation |
— | 1,135 | — | — | — | — | 1,135 | |||||||||||||||||||||
| Net income |
— | — | — | — | 242,671 | — | 242,671 | |||||||||||||||||||||
| Unrealized gain on marketable securities |
— | — | — | 5 | — | — | 5 | |||||||||||||||||||||
| Defined benefit plan unrecognized net loss |
— | — | — | (1,332 | ) | — | — | (1,332 | ) | |||||||||||||||||||
|
|
|
|
|
|
|
|
|
|
|
|
|
|
|
|||||||||||||||
| Balance at December 31, 2011 |
92,257,812 | $ | 923,841 | $ | — | $ | (2,376 | ) | $ | 186,150 | $ | — | $ | 1,107,615 | ||||||||||||||
|
|
|
|
|
|
|
|
|
|
|
|
|
|
|
|||||||||||||||
See notes to consolidated financial statements.
F-8
Table of Contents
PBF ENERGY COMPANY LLC AND SUBSIDIARIES
(COMBINED AND CONSOLIDATED WITH PBF INVESTMENTS LLC AND AFFILIATES)
CONSOLIDATED STATEMENTS OF CASH FLOWS
(IN THOUSANDS)
| Years Ended December 31, | ||||||||||||
| 2011 | 2010 | 2009 | ||||||||||
| Cash flows from operating activities |
||||||||||||
| Net income (loss) |
$ | 242,671 | $ | (44,357 | ) | $ | (6,100 | ) | ||||
| Adjustments to reconcile net income (loss) to net cash from operating activities: |
||||||||||||
| Depreciation and amortization |
56,919 | 1,530 | 43 | |||||||||
| Stock based compensation |
2,516 | 2,300 | — | |||||||||
| Change in fair value of catalyst leases |
(7,316 | ) | 1,217 | — | ||||||||
| Change in fair value of contingent consideration |
5,215 | — | — | |||||||||
| Non-cash change in inventory repurchase obligations |
25,329 | 2,043 | — | |||||||||
| Loss on disposition of property, plant and equipment |
— | 56 | — | |||||||||
| Pension and other post retirement benefit costs |
9,768 | 372 | 376 | |||||||||
| Changes in operating assets and liabilities, net of effects of acquisitions |
||||||||||||
| Accounts receivable |
(279,315 | ) | (36,438 | ) | 67 | |||||||
| Inventories |
(512,054 | ) | 14,126 | — | ||||||||
| Other current assets |
(56,953 | ) | (8,649 | ) | (74 | ) | ||||||
| Accounts payable |
249,765 | 23,294 | 22 | |||||||||
| Accrued expenses |
395,093 | 40,474 | — | |||||||||
| Deferred revenue |
122,895 | 3,000 | — | |||||||||
| Other assets and liabilities |
(5,251 | ) | (176 | ) | (167 | ) | ||||||
|
|
|
|
|
|
|
|||||||
| Net cash from operating activities |
249,282 | (1,208 | ) | (5,833 | ) | |||||||
|
|
|
|
|
|
|
|||||||
| Cash flows from investing activities |
||||||||||||
| Acquisition of Toledo refinery, net of cash received for sale of assets |
(168,156 | ) | — | — | ||||||||
| Acquisition of Paulsboro refinery and pipeline |
— | (204,911 | ) | — | ||||||||
| Acquisition of Delaware City refinery |
— | (224,275 | ) | — | ||||||||
| Expenditures for property, plant and equipment |
(488,721 | ) | (72,118 | ) | (70 | ) | ||||||
| Expenditures for deferred turnaround costs |
(62,823 | ) | — | — | ||||||||
| Expenditures for other assets |
(23,339 | ) | ||||||||||
| Proceeds from sale of assets |
4,700 | — | — | |||||||||
| Other |
(854 | ) | (8 | ) | (8 | ) | ||||||
|
|
|
|
|
|
|
|||||||
| Net cash used in investing activities |
(739,193 | ) | (501,312 | ) | (78 | ) | ||||||
|
|
|
|
|
|
|
|||||||
| Cash flows from financing activities |
||||||||||||
| Proceeds from members’ capital contributions |
408,397 | 483,055 | — | |||||||||
| Proceeds from long-term debt |
488,894 | 125,000 | — | |||||||||
| Members’ contribution for purchase of Series A units held by Petroplus Marketing AG |
— | 91,000 | — | |||||||||
| Proceeds from catalyst lease |
18,624 | 17,740 | — | |||||||||
| Proceeds from Economic Development Authority loan |
— | 20,000 | — | |||||||||
| Repayment of seller note for inventory |
(299,645 | ) | — | — | ||||||||
| Repayments of long-term debt |
(220,401 | ) | — | — | ||||||||
| Purchase of Series A units held by Petroplus Marketing AG on behalf of members |
— | (91,000 | ) | — | ||||||||
| Deferred financing costs and other |
(11,249 | ) | (6,589 | ) | (8 | ) | ||||||
|
|
|
|
|
|
|
|||||||
| Net cash provided by (used in) financing activities |
384,620 | 639,206 | (8 | ) | ||||||||
|
|
|
|
|
|
|
|||||||
| Net increase (decrease) in cash and cash equivalents |
(105,291 | ) | 136,686 | (5,919 | ) | |||||||
| Cash and cash equivalents, beginning of period |
155,457 | 18,771 | 24,690 | |||||||||
|
|
|
|
|
|
|
|||||||
| Cash and cash equivalents, end of period |
$ | 50,166 | $ | 155,457 | $ | 18,771 | ||||||
|
|
|
|
|
|
|
|||||||
(Continued)
See notes to consolidated financial statements.
F-9
Table of Contents
PBF ENERGY COMPANY LLC AND SUBSIDIARIES
(COMBINED AND CONSOLIDATED WITH PBF INVESTMENTS LLC AND AFFILIATES)
CONSOLIDATED STATEMENTS OF CASH FLOWS (CONTINUED)
(IN THOUSANDS)
| Years Ended December 31, | ||||||||||||
| 2011 | 2010 | 2009 | ||||||||||
| Supplemental cash flow disclosures |
||||||||||||
| Non-cash activities: |
||||||||||||
| Promissory note issued for Toledo refinery acquisition |
$ | 200,000 | $ | — | $ | — | ||||||
| Senior secured seller note issued for Paulsboro refinery acquisition |
— | 160,000 | — | |||||||||
| Seller note issued for acquisition of inventory |
299,645 | — | — | |||||||||
| Fair value of Toledo refinery contingent consideration |
117,017 | — | — | |||||||||
| Accrued construction in progress |
5,909 | 40,429 | — | |||||||||
| Non-cash impact of inventory supply and offtake agreements on inventory and accrued expenses |
322,399 | 292,353 | — | |||||||||
| Cash paid during the period for: |
||||||||||||
| Interest (including capitalized interest of $13,027 in 2011) |
67,020 | — | — | |||||||||
See notes to consolidated financial statements.
F-10
Table of Contents
PBF ENERGY COMPANY LLC AND SUBSIDIARIES
(COMBINED AND CONSOLIDATED WITH PBF INVESTMENTS LLC AND AFFILIATES)
NOTES TO CONSOLIDATED FINANCIAL STATEMENTS
(AMOUNTS IN THOUSANDS, EXCEPT BARREL, UNIT, WARRANT, AND OPTION DATA)
1—DESCRIPTION OF BUSINESS AND BASIS OF PRESENTATION
PBF Energy Company LLC, a Delaware limited liability company, together with its consolidated subsidiaries (the “Company” or “PBF”), owns and operates oil refineries and related facilities in North America. Delaware City Refining Company LLC, Delaware Pipeline Company LLC, PBF Power Marketing LLC, Paulsboro Refining Company LLC, Paulsboro Natural Gas Pipeline Company LLC and Toledo Refining Company LLC are PBF’s principal operating subsidiaries and are all wholly-owned subsidiaries of PBF Holding Company LLC (“Holdings”), which is a wholly-owned subsidiary of PBF Energy Company LLC.
All of the Company’s operations are in the United States. The Company’s three oil refineries are all engaged in the refining of crude oil and other feedstocks into petroleum products, and have been aggregated to form one reportable segment. To generate earnings and cash flows from operations, the Company is primarily dependent upon processing crude oil and selling refined petroleum products at margins sufficient to cover fixed and variable costs and other expenses. Crude oil and refined petroleum products are commodities and factors largely out of the Company’s control can cause prices to vary over time. The potential margin volatility can have a material effect on the Company’s financial position, earnings and cash flow.
Reorganization
PBF Investments LLC (“PBFI”) was formed effective March 1, 2008 and served as the sole member of PBF GP LLC (the “General Partner”) and owner of Class B Units in PBF Energy Partners LP (the “Partnership”). The members of PBFI also owned Class A units of the Partnership, which was presented as a noncontrolling interest by PBFI. The entities were formed to pursue acquisitions of crude oil refineries in North America. During 2010, the entities were reorganized. In March 2010, Holdings was formed as a subsidiary of the Partnership. Effective June 1, 2010, the Partnership was converted to a limited liability company and renamed PBF Energy Company LLC. Also on June 1, 2010, the Partnership Class B Units owned by the members of PBFI were contributed to PBF and the Partnership Class B Units were cancelled. The Partnership Class A Units were also cancelled and the members of PBFI received Series A Units in PBF equal to the value of their original Class A and B Units in the Partnership. PBFI was then contributed by PBF to Holdings and PBFI became a subsidiary of Holdings. The reorganization represents a series of transactions among entities under common control of the members. Accordingly, the historical operations of PBFI are combined with Holdings for all periods presented and the transactions that affected the reorganization were reported at historical cost.
2—SUMMARY OF SIGNIFICANT ACCOUNTING POLICIES
Principles of Consolidation and Presentation
The accompanying consolidated financial statements include the accounts of PBFI, the General Partner, and the Partnership until June 1, 2010, the date of the reorganization and the accounts of PBF and its wholly-owned subsidiaries subsequent to the reorganization. All intercompany accounts and transactions have been eliminated in consolidation. For the period from March 1, 2008 to December 16, 2010, the Company was considered to be in the development stage. With the acquisition of the Paulsboro Refinery and commencement of refining operations on December 17, 2010, it ceased to be a development stage company.
Use of Estimates
The preparation of the financial statements in conformity with U.S. generally accepted accounting principles requires management to make estimates and assumptions that affect the reported amounts of assets, liabilities, revenues and expenses and the related disclosures. Actual results could differ from those estimates.
F-11
Table of Contents
PBF ENERGY COMPANY LLC AND SUBSIDIARIES
(COMBINED AND CONSOLIDATED WITH PBF INVESTMENTS LLC AND AFFILIATES)
NOTES TO CONSOLIDATED FINANCIAL STATEMENTS
(AMOUNTS IN THOUSANDS, EXCEPT BARREL, UNIT, WARRANT, AND OPTION DATA)
2—SUMMARY OF SIGNIFICANT ACCOUNTING POLICIES (Continued)
Cash and Cash Equivalents
The Company considers all highly liquid investments with original maturities of three months or less to be cash equivalents. The carrying amount of the cash equivalents approximates fair value due to the short-term maturity of those instruments.
Concentrations of Credit Risk
For the year ended December 31, 2011, Morgan Stanley Capital Group Inc. (“MSCG”) and Sunoco, Inc. (R&M) (“Sunoco”) accounted for 52% and 12% of the Company’s revenues, respectively. As of December 31, 2011, Sunoco and Statoil Marketing and Trading (US) Inc. (“Statoil”) accounted for 19% and 11% of accounts receivables, respectively.
MSCG accounted for 90% of total sales for the year ended December 31, 2010 and 36% of total trade accounts receivable as of December 31, 2010.
Revenue, Deferred Revenue and Accounts Receivable
The Company sells various refined products through its refinery subsidiaries and recognizes revenue related to the sale of products when there is persuasive evidence of an agreement, the sales prices are fixed or determinable, collectability is reasonably assured and when products are shipped or delivered in accordance with their respective agreements. Revenue for services is recorded when the services have been provided. The Company’s Toledo refinery has a products offtake agreement with Sunoco under which Sunoco purchases approximately one-third of the refinery’s daily gasoline production. The Toledo refinery also sells its products through short-term contracts or on the spot market.
The Company’s Paulsboro and Delaware City refineries sell light finished products, certain intermediates and lube base oils to MSCG under products offtake agreements with each refinery (the “Offtake Agreements”). On a daily basis, MSCG purchases and pays for the refineries’ production of light finished products as they are produced, delivered to the refineries’ storage tanks, and legal title passes to MSCG. Revenue on these product sales is deferred until they are shipped out of the storage facility by MSCG.
Under the Offtake Agreements, the Company’s Paulsboro and Delaware City refineries also enter into purchase and sale transactions of certain intermediates and lube base oils whereby MSCG purchases and pays for the refineries’ production of certain intermediates and lube products as they are produced and legal title passes to MSCG. The intermediate products are held in the refineries’ storage tanks until they are needed for further use in the refining process. The intermediates may also be sold to third parties. The refineries have the right to repurchase lube products and do so to supply other third parties with that product. When the refineries need intermediates or repurchase lube products, the products are drawn out of the storage tanks, title passes back to the refineries and MSCG is paid for those products. These transactions occur at the daily market price for the related products. These transactions are considered to be made in contemplation of each other and, accordingly, do not result in the recognition of a sale when title passes from the refineries to MSCG. Inventory remains at cost and the net cash receipts result in a liability that is recorded at market price for the volumes held in storage with any change in the market price being recorded in costs of sales. The liability represents the amount the Company expects to pay to repurchase the volumes held in storage. The Company recorded a $22,082 non-cash charge related to this liability in 2011.
F-12
Table of Contents
PBF ENERGY COMPANY LLC AND SUBSIDIARIES
(COMBINED AND CONSOLIDATED WITH PBF INVESTMENTS LLC AND AFFILIATES)
NOTES TO CONSOLIDATED FINANCIAL STATEMENTS
(AMOUNTS IN THOUSANDS, EXCEPT BARREL, UNIT, WARRANT, AND OPTION DATA)
2—SUMMARY OF SIGNIFICANT ACCOUNTING POLICIES (Continued)
Revenue, Deferred Revenue and Accounts Receivable (Continued)
While MSCG has legal title, it has the right to encumber and/or sell these products and any such sales by MSCG result in sales being recognized by the refineries when products are shipped out of the storage facility. As the exclusive vendor of intermediate products to the refineries, MSCG has the obligation to provide the intermediate products to the refineries as they are needed. Accordingly, sales by MSCG to others have been limited and are only made with the Company’s or its subsidiaries’ approval.
The Company’s Paulsboro and Delaware City refineries sell and purchase feedstocks under a supply agreement with Statoil (the “Crude Supply Agreements”). Statoil purchases the refineries’ production of certain feedstocks or purchases feedstocks from third parties on the refineries’ behalf. Legal title to the feedstocks is held by Statoil and the feedstocks are held in the refineries’ storage tanks until they are needed for further use in the refining process. At that time, the products are drawn out of the storage tanks and purchased by the refineries. These purchases and sales are settled monthly at the daily market prices related to those products. These transactions are considered to be made in contemplation of each other and, accordingly, do not result in the recognition of a sale when title passes from the refineries to Statoil. Inventory remains at cost and the net cash receipts result in a liability which is discussed further in the Inventory note below.
Accounts receivable are carried at invoiced amounts. An allowance for doubtful accounts is established, if required, to report such amounts at their estimated net realizable value. In estimating probable losses, management reviews accounts that are past due and determines if there are any known disputes. There was no allowance for doubtful accounts at December 31, 2011 and 2010.
Excise taxes on sales of refined products that are collected from customers and remitted to various governmental agencies are reported on a net basis.
Inventory
Inventories are carried at the lower of cost or market. The cost of crude oil, feedstocks, blendstocks and refined products are determined under the last-in first-out (“LIFO”) method using the dollar value LIFO method with any increments valued based on average purchase prices during the year. The cost of supplies and other inventories is determined principally on the weighted average cost method.
The Company’s Paulsboro and Delaware City refineries acquire substantially all of their crude oil from Statoil under the Crude Supply Agreements whereby the Company takes title to the crude oil as it is delivered to the processing units, however, the Company is obligated to purchase all the crude oil held by Statoil on the Company’s behalf upon termination of the agreement at the then market price. The Company is also obligated to purchase a fixed volume of feedstocks from Statoil on the later of December 31, 2012 or when the arrangement is terminated based on a forward market price of West Texas Intermediate crude oil. As a result of the purchase obligations, the Company records the inventory of crude oil and feedstocks in the refineries’ storage facilities. The Company has deemed the purchase obligations to be contracts that contain derivatives that change in value based on changes in commodity prices. Such changes in the fair value of these derivatives are included in cost of sales.
The Company’s Toledo refinery acquires substantially all of its crude oil from MSCG under a crude oil supply agreement (the “Toledo Crude Oil Supply Agreement”). For the period from March 1, 2011 to May 31,
F-13
Table of Contents
PBF ENERGY COMPANY LLC AND SUBSIDIARIES
(COMBINED AND CONSOLIDATED WITH PBF INVESTMENTS LLC AND AFFILIATES)
NOTES TO CONSOLIDATED FINANCIAL STATEMENTS
(AMOUNTS IN THOUSANDS, EXCEPT BARREL, UNIT, WARRANT, AND OPTION DATA)
2—SUMMARY OF SIGNIFICANT ACCOUNTING POLICIES (Continued)
Inventory (Continued)
2011, the Company took title to the crude oil as it was delivered to the refinery processing units. The Company had custody and risk of loss for MSCG’s crude oil stored on the refinery premises. As a result, the Company recorded the crude oil in the Toledo refinery’s storage facilities as inventory with a corresponding accrued liability. The Toledo Crude Oil Supply Agreement was replaced effective June 1, 2011. Under the new agreement, the Company takes title to crude oil at various pipeline locations for delivery to the refinery or sale to third parties. The Company records the crude oil inventory when it receives title. Payment for the crude oil is due to MSCG under the Toledo Crude Oil Supply Agreement three days after the crude oil is delivered to the Toledo refinery processing units or upon sale to a third party.
Property, Plant, and Equipment
Property, plant and equipment additions are recorded at cost. The Company capitalizes costs associated with the preliminary, pre-acquisition and development/construction stages of a major construction project. The Company capitalizes the interest cost associated with major construction projects based on the effective interest rate of total borrowings. The Company also capitalizes costs incurred in the acquisition and development of software for internal use, including the costs of software, materials, consultants and payroll-related costs for employees incurred in the application development stage.
Depreciation is computed using the straight-line method over the following estimated useful lives:
| Process units and equipment |
5-25 years | |
| Pipeline and equipment |
5-20 years | |
| Buildings |
25-40 years | |
| Computers, furniture and fixtures |
3-15 years | |
| Leasehold improvements |
20 years |
Maintenance and repairs are charged to operating expenses as they are incurred. Improvements and betterments, which extend the lives of the assets, are capitalized.
Deferred Charges and Other Assets, Net
Deferred charges and other assets include refinery turnaround costs, catalyst, precious metals catalyst, linefill, deferred financing costs and intangible assets.
Refinery turnaround costs, which are incurred in connection with planned major maintenance activities, are capitalized when incurred and amortized on a straight-line basis over the period of time estimated to lapse until the next turnaround occurs (generally 3 to 5 years).
Precious metals catalyst and linefill are considered indefinite-lived assets as they are not expected to deteriorate in their prescribed functions. Such assets are assessed for impairment in connection with the Company’s review of its long-lived assets as indicators of impairment develop.
Deferred financing costs are capitalized when incurred and amortized over the life of the loan (1 to 5 years).
F-14
Table of Contents
PBF ENERGY COMPANY LLC AND SUBSIDIARIES
(COMBINED AND CONSOLIDATED WITH PBF INVESTMENTS LLC AND AFFILIATES)
NOTES TO CONSOLIDATED FINANCIAL STATEMENTS
(AMOUNTS IN THOUSANDS, EXCEPT BARREL, UNIT, WARRANT, AND OPTION DATA)
2—SUMMARY OF SIGNIFICANT ACCOUNTING POLICIES (Continued)
Deferred Charges and Other Assets, Net (Continued)
Intangible assets with finite lives primarily consist of catalyst, emission credits and permits and are amortized over their estimated useful lives of 3 to 10 years.
Long-Lived Assets and Definite-Lived Intangibles
The Company reviews its long-lived assets for impairment whenever events or changes in circumstances indicate the carrying value may not be recoverable. Impairment is evaluated by comparing the carrying value of the long-lived assets to the estimated undiscounted future cash flows expected to result from use of the assets and their ultimate disposition. If such analysis indicates that the carrying value of the long-lived assets is not considered to be recoverable, the carrying value is reduced to the fair value. There have been no impairment indicators and therefore, no impairment reviews were performed in the year ended December 31, 2011.
Impairment assessments inherently involve judgment as to assumptions about expected future cash flows and the impact of market conditions on those assumptions. Although management would utilize assumptions that it believes are reasonable, future events and changing market conditions may impact management’s assumptions, which could produce different results.
Asset Retirement Obligations
The Company records an asset retirement obligation at fair value for the estimated cost to retire a tangible long-lived asset at the time the Company incurs that liability, which is generally when the asset is purchased, constructed, or leased. The Company records the liability when it has a legal or contractual obligation to incur costs to retire the asset and when a reasonable estimate of the fair value of the liability can be made. If a reasonable estimate cannot be made at the time the liability is incurred, the Company will record the liability when sufficient information is available to estimate the liability’s fair value. Certain of the Company’s asset retirement obligations are based on its legal obligation to perform remedial activity at its refinery sites when it permanently ceases operations of the long-lived assets. The Company therefore considers the settlement date of these obligations to be indeterminable. Accordingly, the Company cannot calculate an associated asset retirement liability for these obligations at this time. The Company will measure and recognize the fair value of these asset retirement obligations when the settlement date is determinable.
Environmental Matters
Liabilities for future remediation costs are recorded when environmental assessments and/or remedial efforts are probable and the costs can be reasonably estimated. Other than for assessments, the timing and magnitude of these accruals generally are based on the completion of investigations or other studies or a commitment to a formal plan of action. Environmental liabilities are based on best estimates of probable future costs using currently available technology and applying current regulations, as well as the Company’s own internal environmental policies. The measurement of environmental remediation liabilities may be discounted to reflect the time value of money if the aggregate amount and timing of cash payments of the liabilities are fixed or reliably determinable. The actual settlement of the Company’s liability for environmental matters could materially differ from its estimates due to a number of uncertainties such as the extent of contamination, changes in environmental laws and regulations, potential improvements in remediation technologies and the participation of other responsible parties.
F-15
Table of Contents
PBF ENERGY COMPANY LLC AND SUBSIDIARIES
(COMBINED AND CONSOLIDATED WITH PBF INVESTMENTS LLC AND AFFILIATES)
NOTES TO CONSOLIDATED FINANCIAL STATEMENTS
(AMOUNTS IN THOUSANDS, EXCEPT BARREL, UNIT, WARRANT, AND OPTION DATA)
2—SUMMARY OF SIGNIFICANT ACCOUNTING POLICIES (Continued)
Stock-Based Compensation
Stock-based compensation includes the accounting effect of Series A warrants issued to employees in connection with their acquisition of Series A units, options to acquire Series A units granted to certain employees, and Series B units that were granted to certain members of management. The estimated fair value of the Series A warrants and options is based on the Black-Scholes option pricing model and the fair value of the Series B units is estimated based on a Monte Carlo simulation model. The estimated fair value is amortized as stock-based compensation expense on a straight-line method over the vesting period and included in general and administration expense.
Income Taxes
As a limited liability company, the members are required to include their proportionate share of the Company’s taxable income or loss on their respective income tax returns. Accordingly, there is no benefit or provision for Federal or State income tax in the accompanying financial statements.
The Federal and state tax returns for all years since inception (March 1, 2008) are subject to examination by the respective tax authorities.
Pension and Other Post-Retirement Benefits
The Company recognizes an asset for the overfunded status or a liability for the underfunded status of its pension and post-retirement benefit plans. The funded status is recorded within other long-term liabilities. Changes in the plans’ funded status are recognized in other comprehensive income in the period the change occurs.
Fair Value Measurement
A fair value hierarchy (Level 1, Level 2, or Level 3) is used to categorize fair value amounts based on the quality of inputs used to measure fair value. Accordingly, fair values derived from Level 1 inputs utilize quoted prices in active markets for identical assets or liabilities. Fair values derived from Level 2 inputs are based on quoted prices for similar assets and liabilities in active markets, and inputs other than quoted prices that are either directly or indirectly observable for the asset or liability. Level 3 inputs are unobservable inputs for the asset or liability, and include situations where there is little, if any, market activity for the asset or liability. The Company uses appropriate valuation techniques based on the available inputs to measure the fair values of its applicable assets and liabilities. When available, the Company measures fair value using Level 1 inputs because they generally provide the most reliable evidence of fair value. In some valuations, the inputs may fall into different levels in the hierarchy. In these cases, the asset or liability level within the fair value hierarchy is based on the lowest level of input that is significant to the fair value measurements.
Financial Instruments
The estimated fair value of financial instruments has been determined based on the Company’s assessment of available market information and appropriate valuation methodologies. The Company’s non-derivative financial instruments that are included in current assets and current liabilities are recorded at cost in the consolidated balance sheets. The estimated fair value of these financial instruments approximates their carrying value due to their short-term nature. Derivative instruments are recorded at fair value in the consolidated balance sheets.
F-16
Table of Contents
PBF ENERGY COMPANY LLC AND SUBSIDIARIES
(COMBINED AND CONSOLIDATED WITH PBF INVESTMENTS LLC AND AFFILIATES)
NOTES TO CONSOLIDATED FINANCIAL STATEMENTS
(AMOUNTS IN THOUSANDS, EXCEPT BARREL, UNIT, WARRANT, AND OPTION DATA)
2—SUMMARY OF SIGNIFICANT ACCOUNTING POLICIES (Continued)
Financial Instruments (Continued)
The Company’s catalyst lease obligation and derivatives related to the Company’s crude oil and feedstocks purchase obligations are measured and recorded at fair value using Level 2 inputs on a recurring basis, based on observable market prices.
At December 31, 2011, the fair values of the Company’s term loan, revolving loan, and promissory notes approximate their carrying value, as these borrowings bear interest based upon short-term floating market interest rates.
Derivative Instruments
The Company is exposed to market risk, primarily related to changes in commodity prices for the crude oil and feedstocks used in the refining process as well as the prices of the refined products sold. The accounting treatment for commodity contracts depends on the intended use of the particular contract and on whether or not the contract meets the definition of a derivative. Non-derivative contracts are recorded at the time of delivery.
All derivative instruments, not designated as normal purchases or sales, are recorded in the balance sheet as either assets or liabilities measured at their fair values. Changes in the fair value of derivative instruments that either are not designated or do not qualify for hedge accounting treatment or normal purchase or normal sale accounting are recognized currently in earnings. Contracts qualifying for the normal purchase and sales exemption are accounted for upon settlement. Cash flows related to derivative instruments that are not designated or do not qualify for hedge accounting treatment are included in operating activities.
The Company designates certain derivative instruments as fair value hedges of a particular risk associated with a recognized asset or liability. At the inception of the hedge transaction, the Company documents the relationship between the hedging instrument and the hedged item, as well as its risk management objective and strategy for undertaking various hedge transactions. Derivative gains and losses related to these fair value hedges, including hedge ineffectiveness, are recorded in cost of sales along with the change in fair value of the hedged asset or liability attributable to the hedged risk. Cash flows related to derivative instruments that are designated as fair value hedges are included in operating activities.
Economic hedges are hedges not designated as fair value or cash flow hedges for accounting purposes that are used to (i) manage price volatility in certain refinery feedstock and refined product inventories, and (ii) manage price volatility in certain forecasted refinery feedstock, refined product, and refined product sales. These instruments are recorded at fair value and changes in the fair value of the derivative instruments are recognized currently in cost of sales.
Derivative accounting is complex and requires management judgment in the following respects: identification of derivatives and embedded derivatives, determination of the fair value of derivatives, documentation of hedge relationships, assessment and measurement of hedge ineffectiveness and election and designation of the normal purchases and sales exception. All of these judgments, depending upon their timing and effect, can have a significant impact on the Company’s earnings.
F-17
Table of Contents
PBF ENERGY COMPANY LLC AND SUBSIDIARIES
(COMBINED AND CONSOLIDATED WITH PBF INVESTMENTS LLC AND AFFILIATES)
NOTES TO CONSOLIDATED FINANCIAL STATEMENTS
(AMOUNTS IN THOUSANDS, EXCEPT BARREL, UNIT, WARRANT, AND OPTION DATA)
3—ACQUISITIONS
Toledo Acquisition
On March 1, 2011, a subsidiary of the Company completed the acquisition of the Toledo refinery in Ohio from Sunoco, Inc. (R&M). The Toledo refinery has a crude oil throughput capacity of 170,000 barrels per day. The purchase price for the refinery was $400,000, subject to certain adjustments, and was comprised of $200,000 in cash and a $200,000 promissory note provided by Sunoco. The note bears interest at the lower of LIBOR plus 8%, or 10% (8.5% at December 31, 2011) and is due in March 2013. The terms also include participation payments beginning in the year ending December 31, 2011 through the year ending December 31, 2016 not to exceed $125,000 in the aggregate. Participation payments are based on 25% of the purchased assets’ earnings before interest, taxes, depreciation and amortization, as defined in the agreement (“EBITDA”) in excess of an annual threshold EBITDA of $125,000 (prorated for 2011 and 2016). Each participation payment is due no later than one hundred and twenty days after the close of the respective calendar year end for the years 2011 through 2016.
The Company purchased certain finished and intermediate products for approximately $299,645 with the proceeds from a note provided by Sunoco (the “Toledo Inventory Note Payable”). The note had an interest rate at the lower of LIBOR plus 5.5%, or 7.5% and was repaid on May 31, 2011. The Company also purchased crude oil inventory for $338,395, which it concurrently sold to MSCG for its market value of $369,999. The net cash received from this transaction was recorded as a reduction in the total purchase price.
The Toledo acquisition was accounted for as a business combination. The estimated purchase price of $784,818 includes the estimated fair value of future participation payments (contingent consideration). The fair value of the contingent consideration was estimated using a discounted cash flow analysis, a Level 3 measurement, as more fully described at Note 16. The following table summarizes the amounts recognized for assets acquired and liabilities assumed as of the acquisition date.
The total purchase price and the estimated fair values of the assets and liabilities at the acquisition date were as follows:
| Purchase Price |
||||
| Net cash |
$ | 168,156 | ||
| Seller promissory note |
200,000 | |||
| Seller note for inventory |
299,645 | |||
| Estimated fair value of contingent consideration |
117,017 | |||
|
|
|
|||
| $ | 784,818 | |||
|
|
|
|||
| Fair
Value Allocation |
||||
| Current assets |
$ | 305,645 | ||
| Land |
8,065 | |||
| Property, plant and equipment |
452,084 | |||
| Other assets |
24,640 | |||
| Current liabilities |
(5,616 | ) | ||
|
|
|
|||
| $ | 784,818 | |||
|
|
|
|||
F-18
Table of Contents
PBF ENERGY COMPANY LLC AND SUBSIDIARIES
(COMBINED AND CONSOLIDATED WITH PBF INVESTMENTS LLC AND AFFILIATES)
NOTES TO CONSOLIDATED FINANCIAL STATEMENTS
(AMOUNTS IN THOUSANDS, EXCEPT BARREL, UNIT, WARRANT, AND OPTION DATA)
3—ACQUISITIONS (Continued)
Toledo Acquisition (Continued)
The Company’s consolidated financial statements for the year ended December 31, 2011 include the results of operations of the Toledo refinery since March 1, 2011. The actual results for the Toledo refinery for the period from March 1, 2011 to December 31, 2011, are shown below. The revenues and net income of the Company assuming the acquisition had occurred on January 1, 2010, are shown below on a pro forma basis. The pro forma information does not purport to present what the Company’s actual results would have been had the acquisition occurred on January 1, 2010, or is the financial information indicative of the results of future operations. The unaudited pro forma financial information includes the depreciation and amortization expense related to the acquisition and interest expense associated with the Toledo acquisition financing.
| Revenues | Net Income | |||||||
| Actual results for March 1, 2011 to December 31, 2011 |
$ | 6,113,055 | $ | 489,243 | ||||
| Supplemental pro forma for January 1, 2011 to December 31, 2011 |
$ | 15,961,529 | $ | 328,142 | ||||
| Supplemental pro forma for January 1, 2010 to December 31, 2010 |
$ | 10,251,394 | $ | (53,199 | ) | |||
Paulsboro Refinery Acquisition
In September 2010, subsidiaries of the Company entered into two stock purchase agreements with subsidiaries of Valero Energy Corporation (“Valero”) to acquire its Paulsboro, New Jersey refining business. The purchase price of $364,911 included $357,657 for the refinery, which has a crude oil throughput capacity of 180,000 barrels per day, and an associated natural gas pipeline and $7,254 in net working capital. The acquisition was completed on December 17, 2010 and financed with $204,911 in cash, and the issuance of a $160,000 promissory note with Valero. The note bears interest at LIBOR + 7% (8.3% at December 31, 2011) and was scheduled to mature in December 2011. The Company exercised its unilateral option to extend the note for six months at LIBOR + 9%.
The acquisition was accounted for as a business combination. The purchase price was allocated to the assets acquired and liabilities assumed based on their estimated fair values. The following summarizes the estimated fair values of the assets and liabilities at the acquisition date:
| Allocation | ||||
| Restricted cash |
$ | 12,122 | ||
| Current assets |
27,990 | |||
| Land |
25,185 | |||
| Property, plant and equipment |
256,100 | |||
| Construction in progress |
62,298 | |||
| Other assets |
14,074 | |||
| Current liabilities |
(12,932 | ) | ||
| Environmental liabilities |
(12,653 | ) | ||
| Post retirement benefit obligation |
(7,273 | ) | ||
|
|
|
|||
| Purchase price, excluding inventory |
$ | 364,911 | ||
|
|
|
|||
In connection with the Paulsboro refinery acquisition, $130,344 of crude oil and feedstocks and $165,093 of certain light finished products, intermediates, and lube base oils were purchased by Statoil and MSCG on the
F-19
Table of Contents
PBF ENERGY COMPANY LLC AND SUBSIDIARIES
(COMBINED AND CONSOLIDATED WITH PBF INVESTMENTS LLC AND AFFILIATES)
NOTES TO CONSOLIDATED FINANCIAL STATEMENTS
(AMOUNTS IN THOUSANDS, EXCEPT BARREL, UNIT, WARRANT, AND OPTION DATA)
3—ACQUISITIONS (Continued)
Paulsboro Refinery Acquisition (Continued)
Company’s behalf in connection with the Crude Supply Agreement and the Offtake Agreement, respectively. As of the acquisition date, the Company recorded the inventory subject to these transactions and a corresponding liability for crude oil, feedstocks, intermediates, and lube base oils and deferred revenue for light finished products. No gain or loss was recognized on these transactions, nor did they result in the recognition of revenue. Although these transactions were entered into in contemplation of the acquisition of the Paulsboro refinery, they have been excluded from the table above as the Company did not consider them to be part of the acquisition itself.
Delaware City Acquisition
In April 2010, subsidiaries of the Company entered into an asset purchase agreement with subsidiaries of Valero to acquire refining and pipeline assets of Valero’s Delaware City refinery. The acquired assets included the idled refinery, which has a crude oil throughput capacity of 190,000 barrels per day, associated terminal and pipeline, and a power plant complex. The acquisition was completed on June 1, 2010 for $220,000 in cash plus $4,275 in acquisition-related costs.
The acquisition of the Delaware City refining and pipeline assets was accounted for as an acquisition of assets. The purchase price was allocated to the assets acquired and liabilities assumed based on their estimated relative fair value. The refinery and pipeline assets were idle at the time of the acquisition. The results of operations, which include certain minor terminal operations and substantial capital improvement activities to prepare the refinery and power plant for restart, have been included in the Company’s consolidated financial statements since June 1, 2010. The Company commenced restarting the refinery in June 2011 and the refinery became fully operational in October 2011.
The following summarizes the purchase price allocation:
| Allocation | ||||
| Current assets |
$ | 13,015 | ||
| Assets held for sale |
4,700 | |||
| Land |
28,600 | |||
| Property, plant and equipment |
156,006 | |||
| Other assets |
21,954 | |||
|
|
|
|||
| Total purchase price |
$ | 224,275 | ||
|
|
|
|||
The financial results of the Delaware City assets and the Paulsboro refinery have been included in the Company’s consolidated financial statements since June 1, 2010 and December 17, 2010, respectively. As a result, the consolidated results of operations for the year ended December 31, 2011 include the results of both refineries for the entire period. The revenues and net loss associated with Paulsboro for the year ended December 31, 2010, and the consolidated pro forma revenue and net loss of the combined entity assuming the Paulsboro acquisition had occurred on January 1, 2009, are shown in the table below. The pro forma information does not purport to present what the Company’s actual results would have been had the acquisition occurred on January 1, 2009, nor is the financial information indicative of the results of future operations. This unaudited pro forma financial information includes depreciation and amortization expense related to the acquisition and interest
F-20
Table of Contents
PBF ENERGY COMPANY LLC AND SUBSIDIARIES
(COMBINED AND CONSOLIDATED WITH PBF INVESTMENTS LLC AND AFFILIATES)
NOTES TO CONSOLIDATED FINANCIAL STATEMENTS
(AMOUNTS IN THOUSANDS, EXCEPT BARREL, UNIT, WARRANT, AND OPTION DATA)
3—ACQUISITIONS (Continued)
Delaware City Acquisition (Continued)
expense associated with the Paulsboro acquisition financing. In addition, the 2010 unaudited supplementary pro forma loss was adjusted to exclude an $895,642 nonrecurring charge related to the impairment of refinery assets recorded in conjunction with the sale of Paulsboro to the Company.
| Revenues | Net Loss | |||||||
| Actual results for December 17, 2010 to December 31, 2010 |
$ | 205,997 | $ | (10,606 | ) | |||
| Supplemental pro forma for January 1, 2010 to December 31, 2010 |
$ | 4,919,660 | $ | (128,890 | ) | |||
| Supplemental pro forma for January 1, 2009 to December 31, 2009 |
$ | 3,549,745 | $ | (189,279 | ) | |||
Acquisition Expenses
The Company incurred $728, $6,051 and $0 during 2011, 2010 and 2009 respectively for consulting and legal expenses related to acquisitions and non-consummated acquisitions.
4—INVENTORIES
Inventories consisted of the following:
| December 31, 2011 | ||||||||||||
| Titled Inventory |
Inventory Supply and Offtake Arrangements |
Total | ||||||||||
| Crude oil and feedstocks |
$ | 369,377 | $ | 317,652 | $ | 687,029 | ||||||
| Refined products and blendstocks |
384,902 | 419,613 | 804,515 | |||||||||
| Warehouse stock and other |
25,183 | — | 25,183 | |||||||||
|
|
|
|
|
|
|
|||||||
| $ | 779,462 | $ | 737,265 | $ | 1,516,727 | |||||||
|
|
|
|
|
|
|
|||||||
| December 31, 2010 | ||||||||||||
| Titled Inventory |
Inventory Supply and Offtake Arrangements |
Total | ||||||||||
| Crude oil and feedstocks |
$ | — | $ | 167,271 | $ | 167,271 | ||||||
| Refined products and blendstocks |
13,196 | 180,284 | 193,480 | |||||||||
| Warehouse stock and other |
15,878 | — | 15,878 | |||||||||
|
|
|
|
|
|
|
|||||||
| $ | 29,074 | $ | 347,555 | $ | 376,629 | |||||||
|
|
|
|
|
|
|
|||||||
Inventory under inventory supply and offtake arrangements includes crude oil stored at the Company’s Paulsboro and Delaware City refineries’ storage facilities that the Company will purchase as it is consumed in connection with the Crude Supply Agreements; feedstocks and blendstocks sold to counterparties that the Company will repurchase for further blending into finished products; lube products sold to a counterparty that the Company will repurchase; and light finished products sold to a counterparty in connection with the Offtake Agreement and stored in the Paulsboro and Delaware City refineries’ storage facilities pending shipment by the counterparty.
F-21
Table of Contents
PBF ENERGY COMPANY LLC AND SUBSIDIARIES
(COMBINED AND CONSOLIDATED WITH PBF INVESTMENTS LLC AND AFFILIATES)
NOTES TO CONSOLIDATED FINANCIAL STATEMENTS
(AMOUNTS IN THOUSANDS, EXCEPT BARREL, UNIT, WARRANT, AND OPTION DATA)
4—INVENTORIES (Continued)
At December 31, 2011 and 2010, the replacement value of inventories exceeded the LIFO carrying value by approximately $115,624 and $6,800, respectively.
5—PROPERTY, PLANT AND EQUIPMENT, NET
Property, plant and equipment consisted of the following:
| December 31, 2011 |
December 31, 2010 |
|||||||
| Land |
$ | 61,850 | $ | 53,785 | ||||
| Process units, pipelines and equipment |
1,353,487 | 408,505 | ||||||
| Buildings and leasehold improvements |
2,836 | 2,628 | ||||||
| Computers, furniture and fixtures |
14,098 | 4,444 | ||||||
| Construction in progress |
122,904 | 171,463 | ||||||
|
|
|
|
|
|||||
| 1,555,175 | 640,825 | |||||||
| Less—Accumulated depreciation |
(41,228 | ) | (1,260 | ) | ||||
|
|
|
|
|
|||||
| $ | 1,513,947 | $ | 639,565 | |||||
|
|
|
|
|
|||||
At December 31, 2010, the Delaware City refinery and pipeline were not yet in service and, accordingly, depreciation relating to those assets, with the exception of assets relating to terminal services, had not commenced. The Company commenced the restart of the Delaware City refinery during June 2011 and began depreciating the assets placed in service effective July 1, 2011. Depreciation expense for the years ended December 31, 2011, 2010 and 2009 was $39,968, $1,259 and $44, respectively. The Company capitalized $13,027, $0 and $0 in interest during 2011, 2010 and 2009, respectively, in connection with construction in progress.
6—DEFERRED CHARGES AND OTHER ASSETS, NET
Deferred charges and other assets, net consisted of the following:
| December 31, 2011 |
December 31, 2010 |
|||||||
| Catalyst |
$ | 68,201 | $ | 29,659 | ||||
| Deferred turnaround costs, net |
56,338 | 554 | ||||||
| Deferred financing costs, net |
13,980 | 5,905 | ||||||
| Restricted cash |
12,104 | 12,122 | ||||||
| Linefill |
8,042 | 3,140 | ||||||
| Intangible assets, net |
1,703 | 3,072 | ||||||
| Other |
290 | 247 | ||||||
|
|
|
|
|
|||||
| $ | 160,658 | $ | 54,699 | |||||
|
|
|
|
|
|||||
The Company recorded amortization expense related to deferred turnaround costs and catalyst of $11,922, $61 and $0 for the years ended December 31, 2011, 2010 and 2009, respectively.
F-22
Table of Contents
PBF ENERGY COMPANY LLC AND SUBSIDIARIES
(COMBINED AND CONSOLIDATED WITH PBF INVESTMENTS LLC AND AFFILIATES)
NOTES TO CONSOLIDATED FINANCIAL STATEMENTS
(AMOUNTS IN THOUSANDS, EXCEPT BARREL, UNIT, WARRANT, AND OPTION DATA)
6—DEFERRED CHARGES AND OTHER ASSETS, NET (Continued)
Intangible assets, net consisted of the following as of December 31, 2011:
| Gross Amount |
Accumulated Amortization |
Net Amount |
||||||||||
| Permits |
$ | 3,585 | $ | (1,998 | ) | $ | 1,587 | |||||
| Emission credits |
116 | — | 116 | |||||||||
|
|
|
|
|
|
|
|||||||
| $ | 3,701 | $ | (1,998 | ) | $ | 1,703 | ||||||
|
|
|
|
|
|
|
|||||||
Intangible assets, net consisted of the following as of December 31, 2010:
| Gross Amount |
Accumulated Amortization |
Net Amount |
||||||||||
| Permits |
$ | 3,100 | $ | (144 | ) | $ | 2,956 | |||||
| Emission credits |
116 | — | 116 | |||||||||
|
|
|
|
|
|
|
|||||||
| $ | 3,216 | $ | (144 | ) | $ | 3,072 | ||||||
|
|
|
|
|
|
|
|||||||
7—ACCRUED EXPENSES
Accrued expenses consisted of the following:
| December 31, 2011 |
December 31, 2010 |
|||||||
| Inventory supply and offtake arrangements |
$ | 641,588 | $ | 294,396 | ||||
| Inventory-related accruals |
203,636 | 19,324 | ||||||
| Current portion of fair value of contingent consideration for refinery acquisition |
100,380 | — | ||||||
| Customer deposits |
59,017 | — | ||||||
| Accrued salaries and benefits |
48,300 | — | ||||||
| Excise and sales tax payable |
36,635 | — | ||||||
| Accrued utilities |
17,615 | — | ||||||
| Accrued transportation costs |
18,110 | — | ||||||
| Renewable energy credit obligation |
7,092 | — | ||||||
| Accrued construction in progress |
5,909 | 40,429 | ||||||
| Accrued interest |
1,894 | 1,313 | ||||||
| Other |
40,636 | 11,053 | ||||||
|
|
|
|
|
|||||
| $ | 1,180,812 | $ | 366,515 | |||||
|
|
|
|
|
|||||
8—DELAWARE ECONOMIC DEVELOPMENT AUTHORITY LOAN
In June 2010, in connection with the Delaware City acquisition, the Delaware Economic Development Authority (the “Authority”) granted a subsidiary of the Company a $20,000 loan to assist with operating costs and the cost of restarting the refinery. The loan is represented by a zero interest rate note and the entire unpaid principal amount is payable in full on March 1, 2017, unless the loan is converted to a grant.
F-23
Table of Contents
PBF ENERGY COMPANY LLC AND SUBSIDIARIES
(COMBINED AND CONSOLIDATED WITH PBF INVESTMENTS LLC AND AFFILIATES)
NOTES TO CONSOLIDATED FINANCIAL STATEMENTS
(AMOUNTS IN THOUSANDS, EXCEPT BARREL, UNIT, WARRANT, AND OPTION DATA)
8—DELAWARE ECONOMIC DEVELOPMENT AUTHORITY LOAN (Continued)
The loan converts to a grant in tranches of up to $4,000 annually over a five year period, starting at the one year anniversary of the “certified restart date” as defined in the agreement and certified by the Authority. In order for the loan to be converted to a grant, the Company is required to utilize at least 600,000 man hours of labor in connection with the reconstruction and restarting of the Delaware City refinery, expend at least $125,000 in qualified capital expenditures, commence refinery operations, and maintain certain employment levels, all as defined in the agreement. As of December 31, 2011, the Company believes it has satisfied the conditions for the loan to convert to a grant pending confirmation from the Authority.
The Company recorded the loan as a long-term liability pending approval from the Authority that it has met the requirements to convert the loan to a grant.
9—CREDIT FACILITY AND LONG-TERM DEBT
Letter of Credit Facility
Subsidiaries of the Company maintain a short-term letter of credit facility under which the Company can obtain letters of credit of up to $480,000 consisting of a committed amount of $350,000 and an uncommitted amount of $130,000 to support certain of the Company’s crude oil purchases. The uncommitted portion of the letter of credit facility was temporarily increased from $130,000 to $370,000 for the period from July 29, 2011 to December 31, 2011. The facility matures on April 24, 2012. The Company is charged letter of credit issuance fees on each letter of credit, plus a fee on the aggregate unused portion of the committed letter of credit facility. At December 31, 2011, the Company had $241,500 of letters of credit issued under the letter of credit facility.
In addition, the Company had $3,037 of letters of credit issued with a financial institution not party to the letter of credit facility to support certain purchases in the ordinary course of business.
Paulsboro Refinery Acquisition Financing
In connection with the acquisition of the Paulsboro Refinery, subsidiaries of the Company issued a senior secured note (“Paulsboro Promissory Note”) to Valero in the amount of $160,000 which is secured by the refinery assets. The note was scheduled to mature in December 2011 and bears interest at LIBOR plus 7% (8.3% at December 31, 2011) and can be prepaid at any time without penalty. In December 2011, the Company exercised its unilateral option to extend the note until June 2012 at an interest rate of LIBOR plus 9%. The Paulsboro Promissory Note was included in Long-term debt at December 31, 2011 as the promissory note was repaid in connection with the issuance of long-term notes in February 2012.
Term Loan
In December 2010, subsidiaries of the Company entered into a term loan agreement (“Term Loan”) in the amount of $125,000 with a syndicate of lenders and with UBS Securities, LLC acting as agent. The Term Loan matures in December 2014 and is payable in quarterly installments of $313, followed by a final payment of $121,250 payable at maturity. The Term Loan can be prepaid at any time without penalty.
Interest on the Term Loan is payable quarterly in arrears, at the option of the Company, at either the Alternate Base Rate plus 6%, or the Adjusted LIBOR Rate plus 7% (as both terms are defined in the agreement). The Adjusted LIBOR Rate is subject to a minimum of 2%. The interest rate at December 31, 2011 was 9%.
F-24
Table of Contents
PBF ENERGY COMPANY LLC AND SUBSIDIARIES
(COMBINED AND CONSOLIDATED WITH PBF INVESTMENTS LLC AND AFFILIATES)
NOTES TO CONSOLIDATED FINANCIAL STATEMENTS
(AMOUNTS IN THOUSANDS, EXCEPT BARREL, UNIT, WARRANT, AND OPTION DATA)
9—CREDIT FACILITY AND LONG-TERM DEBT (Continued)
Revolving Loan
In December 2010, subsidiaries of the Company entered into an asset based revolving credit agreement (“Revolving Loan”) for a maximum amount of $100,000 with a syndicate of lenders and with UBS Securities, LLC acting as agent. The Revolving Loan was amended on May 31, 2011 to increase the maximum availability to $500,000. The Revolving Loan matures on May 31, 2016. Advances under the Revolving Loan cannot exceed the lesser of $500,000 or the borrowing base, as defined in the agreement. The Revolving Loan can be prepaid, without penalty, at any time.
Interest on the Revolving Loan is payable quarterly in arrears, at the option of the Company, either at the Alternate Base Rate plus the Applicable Margin, or at the Adjusted LIBOR Rate plus the Applicable Margin, all as defined in the agreement. The Applicable Margin ranges from 1.00% to 1.50% for Alternate Base Rate Loans and from 2.00% to 2.50% for Adjusted LIBOR Rate Loans, depending on the Average Daily Excess Availability. In addition, the Company is required to pay a Commitment Fee which ranges from 0.375% to 0.5% depending on the unused amount of the commitment. The Company is also required to pay an LC Participation Fee on each outstanding letter of credit issued under the Revolving Loan equal to the Applicable Margin applied to Adjusted LIBOR Rate Loans, plus a Fronting Fee equal to 0.125%. The interest rate at December 31, 2011 was 4.3%.
The Revolving Loan has a financial covenant which requires that at any time Excess Availability, as defined in the agreement, is less than the greater of (i) 17.5% of the lesser of the then Borrowing Base and the then current aggregate Revolving Commitments of the Lenders, or (ii) $35,000, the Company will not permit the Consolidated Fixed Charge Coverage Ratio, determined as of the last day of the most recently completed quarter, to be less than 1.1 to 1.0.
At December 31, 2011, the Company had outstanding loans of $270,000 and $39,832 of standby letters of credit issued under the Revolving Loan. There were no Alternate Base Rate Loans or Adjusted LIBOR Rate Loans outstanding under the Revolving Loan at December 31, 2010.
Delaware City Construction Financing
In October 2010, the Company entered into a project management and financing agreement for a capital project at the Delaware City refinery. On August 5, 2011 the Delaware City construction advances in the amount of $20,000 were converted to a term financing payable in equal monthly installments of $530 over a period of sixty months beginning September 1, 2011 (“Construction Financing”). The amortization schedule is structured to provide the lender with a 12% per annum after-tax internal rate of return. As of December 31, 2011, the estimated fair value of the Construction Financing was $24,424. The estimated fair value, categorized as a Level 2 measurement, was calculated based on the present value of future expected payments utilizing market interest rates for similar classes of debt.
Toledo Promissory Note
In March 2011, the Company entered into a $200,000 secured promissory note with the seller of the Toledo refinery (“Toledo Promissory Note”) to finance the acquisition of the Toledo Refinery. The Toledo Promissory Note bears interest at the lower of LIBOR plus 8%, or 10% (8.5% at December 31, 2011) and matures in full in March 2013. The Toledo Promissory Note can be prepaid without penalty at any time.
F-25
Table of Contents
PBF ENERGY COMPANY LLC AND SUBSIDIARIES
(COMBINED AND CONSOLIDATED WITH PBF INVESTMENTS LLC AND AFFILIATES)
NOTES TO CONSOLIDATED FINANCIAL STATEMENTS
(AMOUNTS IN THOUSANDS, EXCEPT BARREL, UNIT, WARRANT, AND OPTION DATA)
9—CREDIT FACILITY AND LONG-TERM DEBT (Continued)
Catalyst Leases
In October 2010, a subsidiary of the Company entered into an agreement pursuant to which the precious metals catalyst located at the Company’s Delaware City refinery with a book value of $16,100 was sold for $17,474, net of $266 in facility fees. The catalyst will be leased back for three one-year periods. The lease fee for the first one year period was $1,076, payable quarterly. The lease fee is reset annually based on current market conditions. The Company is required to repurchase the catalyst at its market value at lease termination. The Company treated the transaction as a financing arrangement, and the lease fees are recorded as interest expense over the lease term. The lease fee for the second one year period beginning in October 2011 is $946, payable quarterly.
Effective July 1, 2011, a subsidiary of the Company entered into an agreement pursuant to which the precious metals catalyst located at the Company’s Toledo refinery was sold for $18,345, net of a facility fee of $279. The catalyst will be leased back for three one-year periods. The lease fee for the first one year period is $997, payable quarterly. The lease fee is reset annually based on current market conditions. The Company is required to repurchase the catalyst at its market value at lease termination. The Company treated the transaction as a financing arrangement, and the lease fees are recorded as interest expense over the lease term. On July 1, 2011, the Company used $18,345 in net proceeds from the Toledo catalyst lease to repay a portion of the Toledo Promissory Note.
The Company has elected the fair value option for accounting for its catalyst repurchase obligations as the Company’s liability is directly impacted by the change in value of the underlying catalyst. The fair value of these repurchase obligations as reflected in the table below is measured using Level 2 inputs.
Long-term debt outstanding consisted of the following:
| December 31, 2011 |
December 31, 2010 |
|||||||
| Paulsboro Promissory Note |
$ | 160,000 | $ | 160,000 | ||||
| Revolving Loan |
270,000 | — | ||||||
| Term Loan |
123,750 | 125,000 | ||||||
| Toledo Promissory Note |
181,655 | — | ||||||
| Catalyst leases |
30,266 | 18,958 | ||||||
| Construction Financing |
19,194 | 1,106 | ||||||
|
|
|
|
|
|||||
| 784,865 | 305,064 | |||||||
| Less—Current maturities |
(4,014 | ) | (1,250 | ) | ||||
|
|
|
|
|
|||||
| Long-term debt |
$ | 780,851 | $ | 303,814 | ||||
|
|
|
|
|
|||||
F-26
Table of Contents
PBF ENERGY COMPANY LLC AND SUBSIDIARIES
(COMBINED AND CONSOLIDATED WITH PBF INVESTMENTS LLC AND AFFILIATES)
NOTES TO CONSOLIDATED FINANCIAL STATEMENTS
(AMOUNTS IN THOUSANDS, EXCEPT BARREL, UNIT, WARRANT, AND OPTION DATA)
9—CREDIT FACILITY AND LONG-TERM DEBT (Continued)
Catalyst Leases (Continued)
Debt maturing in the next five years and thereafter is as follows:
| Year Ending December 31, |
||||
| 2012 |
$ | 164,014 | ||
| 2013 |
201,340 | |||
| 2014 |
140,560 | |||
| 2015 |
5,012 | |||
| 2016 |
273,939 | |||
| Thereafter |
— | |||
|
|
|
|||
| $ | 784,865 | |||
|
|
|
10—OTHER LONG-TERM LIABILITIES
Other long-term liabilities consisted of the following:
| December 31, | ||||||||
| 2011 | 2010 | |||||||
| Noncurrent portion of fair value of contingent consideration for refinery acquisition |
$ | 21,852 | $ | — | ||||
| Environmental liabilities |
10,398 | 12,122 | ||||||
| Post retiree medical plan |
8,912 | 7,253 | ||||||
| Defined benefit pension plan liabilities |
6,651 | 1,611 | ||||||
| Asset retirement obligation |
400 | 526 | ||||||
| Other |
1,000 | — | ||||||
|
|
|
|
|
|||||
| $ | 49,213 | $ | 21,512 | |||||
|
|
|
|
|
|||||
11—SERIES B UNITS AND MEMBERS’ EQUITY
Series B Units
Series B units are issuable by the Board of Directors only to persons who are employed by or providing services to the Company or its subsidiaries. The maximum number of Series B units authorized to be issued is 1,000,000. Series B units are intended to be “profits interests” within the meaning of Revenue Procedures 93-27 and 2001-43 of the Internal Revenue Service and have a stated value of zero at the time of issuance. Series B unit holders are not entitled to vote and are only entitled to share in distributions and other payments after the Series A unit holders receive back all of their amounts invested in accordance with the LLC Agreement. Series B units are classified outside of equity due to certain put rights that can be triggered as a result of a Series B holders death or disability, which is outside the Company’s control. The activity for compensatory Series B units is described in Note 12-Stock-based compensation.
Series A Units and Warrants
Series A units are issuable at a price of $10 per unit, unless determined otherwise by the Board of Directors. The allocation of profits and losses and distributions to Series A unit holders is governed by the Limited Liability
F-27
Table of Contents
PBF ENERGY COMPANY LLC AND SUBSIDIARIES
(COMBINED AND CONSOLIDATED WITH PBF INVESTMENTS LLC AND AFFILIATES)
NOTES TO CONSOLIDATED FINANCIAL STATEMENTS
(AMOUNTS IN THOUSANDS, EXCEPT BARREL, UNIT, WARRANT, AND OPTION DATA)
11—MEMBERS’ EQUITY (Continued)
Series A Units and Warrants (Continued)
Company Agreement of PBF Energy Company, LLC, as amended (the “LLC Agreement”). Series A unit holders have voting rights. Series A units purchased by members of management include compensatory and non-compensatory warrants to purchase membership interests in the Company or a subsidiary thereof whose shares, units or membership interests are contemplated to be subject to an initial public offering. During the years ended December 31, 2011 and 2010, the Company issued 40,864,698 and 48,305,514 Series A Units, respectively, at a price of $10.00 per unit. Also during 2011 and 2010, in connection with the sale of Series A units to certain members of management, the Company issued 1,127,638 and 1,613,080 non-compensatory Series A warrants, respectively, with an exercise price of $10.00 per unit, all of which were outstanding and exercisable as of December 31, 2011. The weighted-average remaining contractual term of the non-compensatory warrants was 8.9 years as of that date. The activity for compensatory Series A warrants and options is described in Note 12-Stock-based compensation.
In connection with the reorganization described in Note 1-Organization and Description of Business, the Company issued 3,087,600 Series A units with a value of $10 per unit on June 1, 2010 in exchange for all Class A and Class B units in PBF Energy Partners LP. The exchange of Series A units for the Class A and Class B units in PBF Energy Partners LP was made on a value for value basis and there was no effect on the Statement of operations as a result of the reorganization.
In October 2010, certain of the members of PBF contributed $91,000 to the Company which the Company used to purchase the Series A units of another member on their behalf.
12—STOCK-BASED COMPENSATION
Stock-based compensation expense included in general and administrative expenses consisted of the following:
| Years Ended December 31, |
||||||||||||
| 2011 | 2010 | 2009 | ||||||||||
| Series A compensatory warrants and options |
$ | 1,135 | $ | 378 | $ | — | ||||||
| Series B units |
1,381 | 1,922 | — | |||||||||
|
|
|
|
|
|
|
|||||||
| $ | 2,516 | $ | 2,300 | $ | — | |||||||
|
|
|
|
|
|
|
|||||||
The Company granted compensatory warrants to employees in connection with their purchase of Series A units. One-quarter of the Series A compensatory warrants were exercisable at the date of grant and the remaining three-quarters become exercisable over equal annual installments on each of the first three anniversaries of the grant date subject to acceleration in certain circumstances. They are exercisable for ten years from the date of grant.
A total of 620,000 options to purchase Series A units were granted to certain employees, management and directors in 2011. Options granted to a director in the amount of 25,000 vested immediately and the remainder vest over equal annual installments on each of the first three anniversaries of the grant date subject to acceleration in certain circumstances. The options are exercisable for ten years from the date of grant.
F-28
Table of Contents
PBF ENERGY COMPANY LLC AND SUBSIDIARIES
(COMBINED AND CONSOLIDATED WITH PBF INVESTMENTS LLC AND AFFILIATES)
NOTES TO CONSOLIDATED FINANCIAL STATEMENTS
(AMOUNTS IN THOUSANDS, EXCEPT BARREL, UNIT, WARRANT, AND OPTION DATA)
12—STOCK-BASED COMPENSATION (Continued)
The estimated fair value of compensatory warrants and options granted during the year ended December 31, 2011 and 2010 was determined using the Black-Scholes pricing model with the following weighted-average assumptions:
| Years Ended December 31, | ||||||||
| 2011 | 2010 | |||||||
| Expected life (in years) |
5.75 | 5.75 | ||||||
| Expected volatility |
40.00 | % | 42.30 | % | ||||
| Dividend yield |
1.06 | % | 1.84 | % | ||||
| Risk-free rate of return |
2.43 | % | 2.25 | % | ||||
| Exercise price |
$ | 10.00 | $ | 10.00 | ||||
The total estimated fair value of Series A compensatory warrants and options granted in 2011 and 2010 was $2,116 and $1,179, respectively, and the weighted average per unit value was $1.81 and $1.71, respectively. Unrecognized compensation expense related to Series A compensatory warrants and options at December 31, 2011 was $1,824, which will be recognized ratably over the next three years.
The following table summarizes activity for Series A compensatory warrants and options for the year ended December 31, 2011 and 2010. There were no stock-based awards granted in 2009.
| Number of Series A Compensatory Warrants and Options |
Weighted Average Exercise Price |
Weighted Average Remaining Contractual Life (in years) |
||||||||||
| Stock-based awards, outstanding January 1, 2010 |
— | $ | — | — | ||||||||
|
|
|
|
|
|
|
|||||||
| Granted |
691,320 | 10.00 | 10.00 | |||||||||
| Exercised |
— | — | — | |||||||||
| Forfeited |
— | — | — | |||||||||
|
|
|
|
|
|
|
|||||||
| Outstanding at December 31, 2010 |
691,320 | $ | 10.00 | 9.74 | ||||||||
|
|
|
|
|
|
|
|||||||
| Granted |
1,171,759 | 10.00 | 10.00 | |||||||||
| Exercised |
(25,000 | ) | 10.00 | — | ||||||||
| Forfeited |
(2,500 | ) | 10.00 | — | ||||||||
|
|
|
|
|
|
|
|||||||
| Outstanding at December 31, 2011 |
1,835,579 | $ | 10.00 | 8.99 | ||||||||
|
|
|
|
|
|
|
|||||||
| Exercisable and vested at December 31, 2011 |
508,600 | $ | 10.00 | 8.85 | ||||||||
| Exercisable and vested at December 31, 2010 |
172,830 | $ | 10.00 | 9.74 | ||||||||
| Expected to vest at December 31, 2011 |
1,835,579 | $ | 10.00 | 8.99 | ||||||||
At December 31, 2011 and 2010, members of management of the Company had also purchased an aggregate of 2,740,718 and 1,613,080 non-compensatory Series A warrants, respectively, with an exercise price of $10.00 per unit, all of which were exercisable.
One-quarter of the Series B Units vested at the time of grant and the remaining three-quarters vest in equal annual installments on each of the first three anniversaries of the grant date, subject to accelerated vesting upon
F-29
Table of Contents
PBF ENERGY COMPANY LLC AND SUBSIDIARIES
(COMBINED AND CONSOLIDATED WITH PBF INVESTMENTS LLC AND AFFILIATES)
NOTES TO CONSOLIDATED FINANCIAL STATEMENTS
(AMOUNTS IN THOUSANDS, EXCEPT BARREL, UNIT, WARRANT, AND OPTION DATA)
12—STOCK-BASED COMPENSATION (Continued)
certain events. Unrecognized compensation expense related to PBF Series B units at December 31, 2011 was $1,807, which will be recognized ratably over the next three years.
The following table summarizes activity for Series B units for the year ended December 31, 2011 and 2010:
| Number of Series B units |
Weighted Average Grant Date Fair Value |
|||||||
| Non-vested units at January 1, 2010 |
— | $ | — | |||||
|
|
|
|
|
|||||
| Allocated |
950,000 | 5.11 | ||||||
| Vested |
(237,500 | ) | 5.11 | |||||
| Forfeited |
— | — | ||||||
|
|
|
|
|
|||||
| Non-vested units at December 31, 2010 |
712,500 | $ | 5.11 | |||||
|
|
|
|
|
|||||
| Allocated |
50,000 | 5.11 | ||||||
| Vested |
(262,500 | ) | 5.11 | |||||
| Forfeited |
— | — | ||||||
|
|
|
|
|
|||||
| Non-vested units at December 31, 2011 |
500,000 | $ | 5.11 | |||||
|
|
|
|
|
|||||
13—RELATED PARTY TRANSACTIONS
The Company engaged Fuel Strategies International, Inc, the principal of which is the brother of the Executive Chairman of the Board of Directors of the Company, to provide consulting services relating to petroleum coke and commercial operations. For the years ended December 31, 2011, 2010 and 2009, the Company incurred charges of $462, $303, and $0 respectively, under this agreement.
The Company has an agreement with a company, which is owned by the Executive Chairman of the Board of Directors, for the use of an airplane. The Company pays a charter rate that is the lowest rate this aircraft is chartered to third-parties. For the years ended December 31, 2011, 2010 and 2009, the Company incurred charges of $821, $393, and $0, respectively, related to use of this plane.
14—COMMITMENTS AND CONTINGENCIES
Lease and Other Commitments
The Company leases office space, office equipment, refinery facilities and equipment, and tank cars under non-cancelable operating leases. Total rent expense was $29,233, $1,078, and $225 for the years ended December 31, 2011, 2010, and 2009 respectively. The Company is party to agreements which provide for the treatment of wastewater and the supply of hydrogen and steam for the Paulsboro and Toledo refineries. The Company made purchases of $30,773, $0 and $0 under these supply agreements for the years ended December 31, 2011, 2010 and 2009, respectively.
F-30
Table of Contents
PBF ENERGY COMPANY LLC AND SUBSIDIARIES
(COMBINED AND CONSOLIDATED WITH PBF INVESTMENTS LLC AND AFFILIATES)
NOTES TO CONSOLIDATED FINANCIAL STATEMENTS
(AMOUNTS IN THOUSANDS, EXCEPT BARREL, UNIT, WARRANT, AND OPTION DATA)
14—COMMITMENTS AND CONTINGENCIES (Continued)
Lease and Other Commitments (Continued)
The fixed and determinable amounts of the obligations under these agreements and total minimum future annual rentals, exclusive of related costs, are approximately:
| Year Ending December 31, |
||||
| 2012 |
$ | 39,395 | ||
| 2013 |
33,436 | |||
| 2014 |
29,683 | |||
| 2015 |
28,967 | |||
| 2016 |
27,582 | |||
| Thereafter |
70,629 | |||
|
|
|
|||
| $ | 229,692 | |||
|
|
|
Employment Agreements
During 2010, PBFI entered into one-year employment agreements with members of executive management and certain other key personnel that include automatic annual renewals, unless canceled. Under some of the agreements, certain of the executives would receive a lump sum payment of between one and a half to 2.99 times of their base salary and continuation of certain employee benefits for the same period upon termination by the Company Without Cause, or by the employee For Good Reason, or upon a Change in Control, as defined in the agreements. Upon death or disability, certain of the Company’s executives, or their estates, would receive a lump sum payment of one half of their base salary.
Remediation Liabilities
The Company’s refineries are subject to extensive and frequently changing federal, state and local laws and regulations, including, but not limited to, those relating to the discharge of materials into the environment or that otherwise relate to the protection of the environment, waste management and the characteristics and the compositions of fuels. Compliance with existing and anticipated laws and regulations can increase the overall cost of operating the Company’s refineries, including remediation, operating costs and capital costs to construct, maintain and upgrade equipment and facilities.
In connection with the Paulsboro acquisition, the Company assumed certain environmental remediation obligations. The environmental liability of $12,086 recorded as of December 31, 2011 ($12,122 as of December 31, 2010) represents the present value of expected future costs discounted at a rate of 8%. At December 31, 2011 the undiscounted liability is $18,202 and the Company expects to make aggregate payments for this liability of $7,914 over the next five years. A trust fund for this liability in the amount of $12,104, acquired in the Paulsboro acquisition, is recorded as restricted cash in deferred charges and other assets, net.
In connection with the acquisition of the Delaware City assets, Valero remains responsible for certain pre-acquisition environmental obligations up to $20,000 and the predecessor to Valero in ownership of the refinery retains other historical obligations.
In connection with the Delaware City assets and Paulsboro Refinery acquisitions, the Company and Valero purchased ten year, $75,000 environmental insurance policies to insure against unknown environmental liabilities at each site.
F-31
Table of Contents
PBF ENERGY COMPANY LLC AND SUBSIDIARIES
(COMBINED AND CONSOLIDATED WITH PBF INVESTMENTS LLC AND AFFILIATES)
NOTES TO CONSOLIDATED FINANCIAL STATEMENTS
(AMOUNTS IN THOUSANDS, EXCEPT BARREL, UNIT, WARRANT, AND OPTION DATA)
14—COMMITMENTS AND CONTINGENCIES (Continued)
Remediation Liabilities (Continued)
In connection with the Toledo Refinery acquisition, Sunoco remains responsible for environmental remediation for conditions that existed on the closing date for twenty years from March 1, 2011.
15—EMPLOYEE BENEFIT PLANS
Defined Contribution Plan
The Company’s defined contribution plan covers all employees. Employees are eligible to participate as of the first day of the month following 30 days of service. Participants can make basic contributions up to 50 percent of their annual salary subject to Internal Revenue Service limits. The Company matches participants’ contributions at the rate of 200 percent of the first 3 percent of each participant’s total basic contribution based on the participant’s total annual salary. The Company’s contribution to the qualified defined contribution plans was $7,204, $196 and $119 for the years ended December 31, 2011, 2010 and 2009, respectively.
Defined Benefit and Post Retiree Medical Plans
The Company sponsors a noncontributory defined benefit pension plan (the “Qualified Plan”) with a policy to fund pension liabilities in accordance with the limits imposed by the Employee Retirement Income Security Act of 1974 (“ERISA”) and Federal income tax laws. In addition, the Company sponsors a supplemental pension plan covering certain employees, which provides incremental payments that would have been payable from the Company’s principal pension plan, were it not for limitations imposed by income tax regulations. The funded status is measured as the difference between plan assets at fair value and the projected benefit obligation which is to be recognized in the balance sheet. The plan assets and benefit obligations are measured as of the balance sheet date.
The non-union Delaware City employees and all Paulsboro employees became eligible to participate in the Company’s defined benefit plans as of the respective acquisition dates. The union Delaware City employees became eligible to participate in the Company’s defined benefit plans upon commencement of normal operations. The Company did not assume any of the employees’ pension liability accrued prior to the respective acquisitions.
The Company formed the Post Retirement Medical Plan on December 31, 2010 to provide health care coverage continuation from date of retirement to age 65 for qualifying employees associated with the Paulsboro acquisition. The Company credited the qualifying employees with their prior service under Valero which resulted in the recognition of a liability for the projected benefit obligation.
F-32
Table of Contents
PBF ENERGY COMPANY LLC AND SUBSIDIARIES
(COMBINED AND CONSOLIDATED WITH PBF INVESTMENTS LLC AND AFFILIATES)
NOTES TO CONSOLIDATED FINANCIAL STATEMENTS
(AMOUNTS IN THOUSANDS, EXCEPT BARREL, UNIT, WARRANT, AND OPTION DATA)
15—EMPLOYEE BENEFIT PLANS (Continued)
Defined Benefit and Post Retiree Medical Plans (Continued)
The changes in the benefit obligation, the changes in fair value of plan assets, and the funded status of the Company’s Pension and Post Retirement Medical Plans as of and for the years ended December 31, 2011 and 2010 were as follows:
| Pension Plans | Post Retirement Medical Plan |
|||||||||||||||
| 2011 | 2010 | 2011 | 2010 | |||||||||||||
| Change in benefit obligation: |
||||||||||||||||
| Benefit obligation at beginning of year |
$ | 2,052 | $ | 703 | $ | 7,273 | $ | — | ||||||||
| Service cost |
8,678 | 347 | 540 | — | ||||||||||||
| Interest cost |
140 | 40 | 381 | — | ||||||||||||
| Plan amendments |
— | 125 | — | — | ||||||||||||
| Direct benefit payments |
— | (71 | ) | — | — | |||||||||||
| Actuarial loss (gain) |
539 | 908 | 718 | — | ||||||||||||
| Acquisition |
— | — | — | 7,273 | ||||||||||||
|
|
|
|
|
|
|
|
|
|||||||||
| Projected benefit obligation at end of year |
$ | 11,409 | $ | 2,052 | $ | 8,912 | $ | 7,273 | ||||||||
|
|
|
|
|
|
|
|
|
|||||||||
| Change in plan assets: |
||||||||||||||||
| Fair value of plan assets at beginning of year |
$ | 441 | $ | 324 | $ | — | $ | — | ||||||||
| Actual return on plan assets |
(83 | ) | 13 | — | — | |||||||||||
| Benefits paid |
— | (71 | ) | — | — | |||||||||||
| Employer contributions |
4,400 | 175 | — | — | ||||||||||||
|
|
|
|
|
|
|
|
|
|||||||||
| Fair value of plan assets at end of year |
$ | 4,758 | $ | 441 | $ | — | $ | — | ||||||||
|
|
|
|
|
|
|
|
|
|||||||||
| Reconciliation of funded status: |
||||||||||||||||
| Fair value of plan assets at end of year |
$ | 4,758 | $ | 441 | $ | — | $ | — | ||||||||
| Less benefit obligations at end of year |
11,409 | 2,052 | 8,912 | 7.723 | ||||||||||||
|
|
|
|
|
|
|
|
|
|||||||||
| Funded status at end of year |
$ | (6,651 | ) | $ | (1,611 | ) | $ | (8,912 | ) | $ | (7,273 | ) | ||||
|
|
|
|
|
|
|
|
|
|||||||||
The accumulated benefit obligations for the Company’s Pension Plans exceed the fair value of the assets of those plans at December 31, 2011 and 2010. The accumulated benefit obligation for the defined benefit plans approximated $8,979 and $1,551 at December 31, 2011 and 2010, respectively.
Benefit payments, which reflect expected future services, that the Company expects to pay are as follows for the years ended December 31:
| Pension Benefits |
Post Retirement Medical Plan |
|||||||
| 2012 |
$ | 277 | $ | 61 | ||||
| 2013 |
2,195 | 140 | ||||||
| 2014 |
1,578 | 241 | ||||||
| 2015 |
2,853 | 389 | ||||||
| 2016 |
3,582 | 496 | ||||||
| Years 2017-2021 |
35,786 | 5,422 | ||||||
F-33
Table of Contents
PBF ENERGY COMPANY LLC AND SUBSIDIARIES
(COMBINED AND CONSOLIDATED WITH PBF INVESTMENTS LLC AND AFFILIATES)
NOTES TO CONSOLIDATED FINANCIAL STATEMENTS
(AMOUNTS IN THOUSANDS, EXCEPT BARREL, UNIT, WARRANT, AND OPTION DATA)
15—EMPLOYEE BENEFIT PLANS (Continued)
Defined Benefit and Post Retiree Medical Plans (Continued)
The Company’s funding policy for its defined benefit plans is to contribute amounts sufficient to meet legal funding requirements, plus any additional amounts that may be appropriate considering the funded status of the plans, tax consequences, the cash flow generated by the Company and other factors. The Company plans to contribute approximately $5,200 to the Company’s Pension Plans during 2012.
The components of net periodic benefit cost were as follows for the years ended December 31, 2011, 2010 and 2009:
| Pension Benefits | Post Retirement Medical Plan | |||||||||||||||||||||||
| 2011 | 2010 | 2009 | 2011 | 2010 | 2009 | |||||||||||||||||||
| Components of net period benefit cost: |
||||||||||||||||||||||||
| Service cost |
$ | 8,678 | $ | 347 | $ | 369 | $ | 540 | $ | — | $ | — | ||||||||||||
| Interest cost |
140 | 40 | 14 | 381 | — | — | ||||||||||||||||||
| Expected return on plan assets |
(38 | ) | (15 | ) | (8 | ) | — | — | — | |||||||||||||||
| Amortization of prior service cost |
11 | — | 1 | — | — | — | ||||||||||||||||||
| Amortization of actuarial loss |
56 | — | — | — | — | — | ||||||||||||||||||
|
|
|
|
|
|
|
|
|
|
|
|
|
|||||||||||||
| Net periodic benefit cost |
$ | 8,847 | $ | 372 | $ | 376 | $ | 921 | $ | — | $ | — | ||||||||||||
|
|
|
|
|
|
|
|
|
|
|
|
|
|||||||||||||
The pre-tax amounts recognized in other comprehensive income (loss) for the years ended December 31, 2011 and 2010 were as follows:
| Pension Benefits | Post Retirement Medical Plan |
|||||||||||||||
| 2011 | 2010 | 2011 | 2010 | |||||||||||||
| Prior service costs |
$ | — | $ | (125 | ) | $ | — | $ | — | |||||||
| Net actuarial loss (gain) |
(661 | ) | (909 | ) | (738 | ) | — | |||||||||
| Amortization of losses |
67 | — | — | — | ||||||||||||
|
|
|
|
|
|
|
|
|
|||||||||
| Total changes in other comprehensive loss |
$ | (594 | ) | $ | (1,034 | ) | $ | (738 | ) | $ | — | |||||
|
|
|
|
|
|
|
|
|
|||||||||
The pre-tax amounts in accumulated other comprehensive loss as of December 31, 2011 and 2010 that have not yet been recognized as components of net periodic costs were as follows:
| Pension Benefits | Post Retirement Medical Plan |
|||||||||||||||
| 2011 | 2010 | 2011 | 2010 | |||||||||||||
| Prior service costs |
$ | (114 | ) | $ | (125 | ) | $ | — | $ | — | ||||||
| Net actuarial loss |
(1,519 | ) | (914 | ) | (738 | ) | — | |||||||||
|
|
|
|
|
|
|
|
|
|||||||||
| Total |
$ | (1,633 | ) | $ | (1,039 | ) | $ | (738 | ) | $ | — | |||||
|
|
|
|
|
|
|
|
|
|||||||||
F-34
Table of Contents
PBF ENERGY COMPANY LLC AND SUBSIDIARIES
(COMBINED AND CONSOLIDATED WITH PBF INVESTMENTS LLC AND AFFILIATES)
NOTES TO CONSOLIDATED FINANCIAL STATEMENTS
(AMOUNTS IN THOUSANDS, EXCEPT BARREL, UNIT, WARRANT, AND OPTION DATA)
15—EMPLOYEE BENEFIT PLANS (Continued)
Defined Benefit and Post Retiree Medical Plans (Continued)
The following pre-tax amounts included in accumulated other comprehensive loss as of December 31, 2011 are expected to be recognized as components of net period benefit cost during the year ended December 31, 2012:
| Pension Benefits |
Post Retirement Medical Plan |
|||||||
| Amortization of prior service costs |
$ | 11 | $ | — | ||||
| Amortization of net actuarial loss |
30 | — | ||||||
|
|
|
|
|
|||||
| Total |
$ | 41 | $ | — | ||||
|
|
|
|
|
|||||
The weighted average assumptions used to determine the benefit obligations as of December 31, 2011 and 2010 were as follows:
| Pension Benefits | Post Retirement Medical Plan | |||||||||||||||
| 2011 | 2010 | 2011 | 2010 | |||||||||||||
| Discount rate |
4.45 | % | 5.25 | % | 4.45 | % | 5.25 | % | ||||||||
| Rate of compensation increase |
4 | % | 4 | % | — | — | ||||||||||
The discount rate assumptions used to determine the defined benefit and Post Retirement Medical plans obligations as of December 31, 2011 and 2010 were based on the Mercer Yield Curve. The Mercer Yield Curve is developed from a portfolio of high-quality investment grade bonds. To determine the discount rate, each year’s projected cash flow for the defined benefit and Post Retirement Medical plans is discounted at a spot (zero-coupon) rate appropriate for that maturity; the discount rate is the single equivalent rate that produces the same discounted present value.
The weighted average assumptions used to determine the net periodic benefit costs for the years ended December 31, 2011, 2010 and 2009 were as follows:
| Pension Benefits | Post Retirement Medical Plan |
|||||||||||||||||||||||
| 2011 | 2010 | 2009 | 2011 | 2010 | 2009 | |||||||||||||||||||
| Discount rate |
5.25 | % | 6 | % | 6 | % | 5.25 | % | — | — | ||||||||||||||
| Expected long-term rate of return on plan assets |
4.25 | % | 4 | % | 4 | % | — | — | — | |||||||||||||||
| Rate of compensation increase |
4 | % | 4 | % | 4 | % | — | — | — | |||||||||||||||
The assumed health care cost trend rates as of December 31, 2011 and 2010 were as follows:
| Post Retirement Medical Plan |
||||||||
| 2011 | 2010 | |||||||
| Health care cost trend rate assumed for next year |
7 | % | 7 | % | ||||
| Rate to which the cost trend rate was assumed to decline (the ultimate trend rate) |
4.5 | % | 4.5 | % | ||||
| Year that the rate reached the ultimate trend rate |
2024 | 2024 | ||||||
F-35
Table of Contents
PBF ENERGY COMPANY LLC AND SUBSIDIARIES
(COMBINED AND CONSOLIDATED WITH PBF INVESTMENTS LLC AND AFFILIATES)
NOTES TO CONSOLIDATED FINANCIAL STATEMENTS
(AMOUNTS IN THOUSANDS, EXCEPT BARREL, UNIT, WARRANT, AND OPTION DATA)
15—EMPLOYEE BENEFIT PLANS (Continued)
Defined Benefit and Post Retiree Medical Plans (Continued)
Assumed health care costs trend rates have a significant effect on the amounts reported for retiree health care plans. A one percentage-point change in assumed health care costs trend rates would have the following effects on the medical postretirement benefits:
| 1% Increase |
1% Decrease |
|||||||
| Effect on total of service and interest cost components |
$ | 172 | $ | (146 | ) | |||
| Effect on accumulated postretirement benefit obligation |
978 | (865 | ) | |||||
The tables below present the fair values of the assets of the Company’s Qualified Plan as of December 31, 2011 and 2010 by level of fair value hierarchy. Assets categorized in Level 1 of the hierarchy are measured at fair value using a market approach based on published net asset values of mutual funds. As noted above, the Company’s post retirement medical plan is funded on a pay-as-you-go basis and has no assets.
| Fair Value Measurements
Using Quoted Prices in Active Markets (Level 1) |
||||||||
| December 31, | ||||||||
| 2011 | 2010 | |||||||
| Government securities: |
||||||||
| Vanguard Intermediate-Term Treasury Fund |
$ | 4,758 | $ | 440 | ||||
| Cash and cash equivalents |
— | 1 | ||||||
|
|
|
|
|
|||||
| Total |
$ | 4,758 | $ | 441 | ||||
|
|
|
|
|
|||||
The Company’s investment strategy for its Qualified Plan is to achieve a reasonable return on assets that supports the plan’s interest credit rating, subject to a moderate level of portfolio risk that provides liquidity. Consistent with these financial objectives as of December 31, 2011, the plan assets were 100% intermediate fixed income investments. The overall expected long-term rate of return on plan assets for the Qualified Plan is based on the Company’s view of long-term expectations and asset mix.
F-36
Table of Contents
PBF ENERGY COMPANY LLC AND SUBSIDIARIES
(COMBINED AND CONSOLIDATED WITH PBF INVESTMENTS LLC AND AFFILIATES)
NOTES TO CONSOLIDATED FINANCIAL STATEMENTS
(AMOUNTS IN THOUSANDS, EXCEPT BARREL, UNIT, WARRANT, AND OPTION DATA)
16—FAIR VALUE MEASUREMENTS
The tables below present information about the Company’s financial assets and liabilities measured and recorded at fair value on a recurring basis and indicate the fair value hierarchy of the inputs utilized to determine the fair values as of December 31, 2011 and 2010.
| As of December 31, 2011 | ||||||||||||||||
| Level 1 | Level 2 | Level 3 | Total | |||||||||||||
| Assets: |
||||||||||||||||
| Money market funds |
$ | 666 | $ | — | $ | — | $ | 666 | ||||||||
| Commodity contracts |
72 | — | — | 72 | ||||||||||||
| Liabilities: |
||||||||||||||||
| Catalyst lease obligations |
— | 30,266 | — | 30,266 | ||||||||||||
| Derivatives included with inventory supply arrangement obligations |
— | 3,070 | — | 3,070 | ||||||||||||
| Contingent consideration for refinery acquisition |
— | — | 122,232 | 122,232 | ||||||||||||
| As of December 31, 2010 | ||||||||||||||||
| Level 1 | Level 2 | Level 3 | Total | |||||||||||||
| Assets: |
||||||||||||||||
| Money market funds |
$ | 140,007 | $ | — | $ | — | $ | 140,007 | ||||||||
| Liabilities: |
||||||||||||||||
| Derivatives included with inventory supply arrangement obligations |
— | 2,043 | — | 2,043 | ||||||||||||
| Catalyst lease obligation |
— | 18,958 | — | 18,958 | ||||||||||||
The valuation methods used to measure financial instruments at fair value are as follows:
| • | Money market funds categorized in Level 1 of the fair value hierarchy are measured at fair value based on quoted market prices and included within cash and cash equivalents. |
| • | The commodity contracts categorized in Level 1 of the fair value hierarchy are measured at fair value based on quoted prices in an active market. |
| • | The derivatives included with inventory supply arrangement obligations and the catalyst lease liabilities are categorized in Level 2 of the fair value hierarchy and are measured at fair value using a market approach based upon future commodity prices for similar instruments quoted in active markets. |
| • | The contingent consideration for refinery acquisition incurred at December 31, 2011, is categorized in Level 3 of the fair value hierarchy and is estimated using a discounted cash flow model based on management’s estimate of the future cash flows of the Toledo refinery; a risk free rate of return of 0.16%; credit rate spread of 4.38%; and a discount rate of 4.54%. |
F-37
Table of Contents
PBF ENERGY COMPANY LLC AND SUBSIDIARIES
(COMBINED AND CONSOLIDATED WITH PBF INVESTMENTS LLC AND AFFILIATES)
NOTES TO CONSOLIDATED FINANCIAL STATEMENTS
(AMOUNTS IN THOUSANDS, EXCEPT BARREL, UNIT, WARRANT, AND OPTION DATA)
16—FAIR VALUE MEASUREMENTS (Continued)
The table below summarizes the changes in fair value measurements categorized in Level 3 of the fair value hierarchy:
| Year ended December 31, 2011 |
||||
| Balance at beginning of period |
$ | — | ||
| Purchases |
(117,017 | ) | ||
| Unrealized loss included in earnings |
(5,215 | ) | ||
| Transfers into Level 3 |
— | |||
| Transfers out of Level 3 |
— | |||
|
|
|
|||
| Balance at end of period |
$ | (122,232 | ) | |
|
|
|
|||
There were no transfers between levels during the year ended December 31, 2011.
17—DERIVATIVE INSTRUMENTS AND HEDGING ACTIVITIES
The Company uses derivative instruments to mitigate certain exposures to commodity price risk. The Company’s Crude Supply Agreement contains purchase obligations for certain volumes of crude oil and other feedstocks. The Company is also party to a supply agreement that contains purchase obligations for certain volumes of stored intermediates inventory. The purchase obligations related to crude oil and feedstocks are derivative instruments that have been designated as fair value hedges in order to hedge the commodity price volatility of certain refinery inventory beginning July 1, 2011. The purchase obligations related to stored intermediates inventory are derivative instruments that have not been designated as hedges. The fair value of these purchase obligation derivatives is based on market prices of crude oil and intermediates in the future. The level of activity for these derivatives is based on the level of operating inventories. As of December 31, 2011, there were approximately 3,101,333 barrels of crude oil and feedstocks (approximately 1,845,298 barrels at December 31, 2010) outstanding under these derivative instruments designated as fair value hedges and approximately 117,848 barrels of intermediates inventory (0 barrels at December 31, 2010) outstanding under these derivative instruments not designated as hedges. These volumes represent the notional value of the contract.
The Company also enters into economic hedges primarily consisting of commodity derivative instruments that are not designated as fair value hedges and are used to manage price volatility in certain crude oil and feedstock inventories as well as crude oil, feedstock, and refined product sales or purchases. The objective in entering into economic hedges is consistent with the objectives discussed above for fair value hedges. As of December 31, 2011, there were approximately 7,000 and 349,000 barrels of crude oil and refined products, respectively, outstanding under short and long term future commodity derivative instruments not designated as fair value hedges, representing the notional value of the contracts.
F-38
Table of Contents
PBF ENERGY COMPANY LLC AND SUBSIDIARIES
(COMBINED AND CONSOLIDATED WITH PBF INVESTMENTS LLC AND AFFILIATES)
NOTES TO CONSOLIDATED FINANCIAL STATEMENTS
(AMOUNTS IN THOUSANDS, EXCEPT BARREL, UNIT, WARRANT, AND OPTION DATA)
17—DERIVATIVE INSTRUMENTS AND HEDGING ACTIVITIES (Continued)
The following tables provide information about the fair values of these derivative instruments as of December 31, 2011 and 2010 and the line items in the consolidated balance sheet in which the fair values are reflected. See Note 16 for additional information related to the fair values of derivative instruments.
| Description |
Balance Sheet Location | Fair
Value Asset/(Liability) |
||||
| Derivatives designated as hedging instruments: |
||||||
| December 31, 2011: |
||||||
| Derivatives included with inventory supply arrangement obligations |
Accrued expenses | $ | (1,465 | ) | ||
| December 31, 2010: |
||||||
| Derivatives included with inventory supply arrangement obligations |
Accrued expenses | $ | — | |||
| Derivatives not designated as hedging instruments: |
||||||
| December 31, 2011: |
||||||
| Derivatives included with inventory supply arrangement obligations |
Accrued expenses | $ | (1,605 | ) | ||
| Commodity contracts |
Accounts receivable | $ | 72 | |||
| December 31, 2010: |
||||||
| Derivatives included with inventory supply arrangement obligations |
Accrued expenses | $ | (2,043 | ) | ||
| Commodity contracts |
Accounts receivable | $ | — | |||
The Company’s policy is to net the fair value of the derivative included with inventory supply arrangement obligations against the liability related to inventory supply arrangements with the same counterparty as the legal right of offset exists.
F-39
Table of Contents
PBF ENERGY COMPANY LLC AND SUBSIDIARIES
(COMBINED AND CONSOLIDATED WITH PBF INVESTMENTS LLC AND AFFILIATES)
NOTES TO CONSOLIDATED FINANCIAL STATEMENTS
(AMOUNTS IN THOUSANDS, EXCEPT BARREL, UNIT, WARRANT, AND OPTION DATA)
17—DERIVATIVE INSTRUMENTS AND HEDGING ACTIVITIES (Continued)
The following tables provide information about the gain or loss recognized in income on these derivative instruments and the line items in the consolidated financial statements in which such gains and losses are reflected. There was no gain or loss recognized on derivative instruments in 2009.
| Description |
Location of Gain
or (Loss) Recognized in Income on Derivatives |
Gain or (Loss) Recognized in Income on Derivatives |
||||||
| Derivatives designated as hedging instruments: |
||||||||
| For the year ended December 31, 2011: |
||||||||
| Derivatives included with inventory supply arrangement obligations |
Cost of sales | $ | (6,076 | ) | ||||
| For the year ended December 31, 2010: |
||||||||
| Derivatives included with inventory supply arrangement obligations |
Cost of sales | $ | — | |||||
| Derivatives not designated as hedging instruments: |
||||||||
| For the year ended December 31, 2011: |
||||||||
| Derivatives included with inventory supply arrangement obligations |
Cost of sales | $ | 2,829 | |||||
| Commodity contracts |
Cost of sales | $ | 5,604 | |||||
| For the year ended December 31, 2010: |
||||||||
| Derivatives included with inventory supply arrangement obligations |
Cost of sales | $ | (2,043 | ) | ||||
| Commodity contracts |
Cost of sales | $ | — | |||||
| Hedged items designated in fair value hedges: |
||||||||
| For the year ended December 31, 2011: |
||||||||
| Crude oil and feedstock inventory |
Cost of sales | $ | 6,558 | |||||
| For the year ended December 31, 2010: |
||||||||
| Crude oil and feedstock inventory |
Cost of sales | $ | — | |||||
Ineffectiveness related to the Company’s fair value hedges for the year ended December 31, 2011 resulted in a gain of $482. The Company did not apply hedge accounting to any of its derivative instruments prior to July 1, 2011.
F-40
Table of Contents
PBF ENERGY COMPANY LLC AND SUBSIDIARIES
(COMBINED AND CONSOLIDATED WITH PBF INVESTMENTS LLC AND AFFILIATES)
NOTES TO CONSOLIDATED FINANCIAL STATEMENTS
(AMOUNTS IN THOUSANDS, EXCEPT BARREL, UNIT, WARRANT, AND OPTION DATA)
18—REVENUES
The following table provides information relating to the Company’s revenues from external customers for each product or group of similar products for the years ended:
| December 31, 2011 | December 31, 2010 | |||||||
| Gasoline and distillates |
$ | 13,182,234 | $ | 175,083 | ||||
| Lubricants |
525,095 | 13,718 | ||||||
| Asphalt and residual oils |
441,638 | 8,739 | ||||||
| Liquefied petroleum gases |
430,435 | 5,739 | ||||||
| Chemicals |
344,311 | — | ||||||
| Other |
36,625 | 7,392 | ||||||
|
|
|
|
|
|||||
| $ | 14,960,338 | $ | 210,671 | |||||
|
|
|
|
|
|||||
Total revenues for the year ended December 31, 2009 were not material as the Company was a development stage company.
19—SUBSEQUENT EVENTS
These financial statements were approved by management and available for issuance on May 14, 2012. Management has evaluated subsequent events through this date.
Paulsboro Catalyst Lease
Effective January 6, 2012, a subsidiary of the Company entered into a one year agreement under which the catalyst precious metals located at the Company’s Paulsboro refinery was sold for $9,453. The catalyst will be consigned back to the Company through December 2012 for an aggregate fee of $267, payable upon termination of the agreement. The Company is required to repurchase the catalyst at market value at lease termination or physically deliver the consigned volume of catalyst to the counterparty. The Company treated the transaction as a financing arrangement, and the fees are recorded as interest expense over the consignment term. The Company used $9,453 in proceeds from the Paulsboro Catalyst lease to repay a portion of the Paulsboro Promissory Note.
Notes Offering
On February 9, 2012, the Company completed the offering of $675,500 aggregate principal amount of new 8.25% Senior Secured Notes due 2020. The net proceeds, after deducting original issue discount, the initial purchasers’ discounts and commissions and the fees and expenses of the offering, were used to repay all of the outstanding indebtedness plus accrued interest owed under the Toledo Promissory Note, the Paulsboro Promissory Note, and the Term Loan, as well as to reduce the outstanding balance of our Revolving Loan. The Senior Secured Notes are secured on a first-priority basis by substantially all of the present and future assets of Holdings and its subsidiaries (other than assets securing the Revolving Loan). The Company’s Executive Chairman of the Board of Directors, and certain of his affiliates and family members, and certain of our other executives, purchased $25,500 aggregate principal amount of these Senior Secured Notes.
Revolving Loan Amendment
On March 13, 2012, the Revolving Loan was amended to increase the maximum availability to $750,000.
F-41
Table of Contents
PBF ENERGY COMPANY LLC AND SUBSIDIARIES
(COMBINED AND CONSOLIDATED WITH PBF INVESTMENTS LLC AND AFFILIATES)
NOTES TO CONSOLIDATED FINANCIAL STATEMENTS
(AMOUNTS IN THOUSANDS, EXCEPT BARREL, UNIT, WARRANT, AND OPTION DATA)
19—SUBSEQUENT EVENTS (Continued)
Letter of Credit Facility
On April 24, 2012, the Company renewed and expanded the short-term letters of credit facility. Under the expanded facility, the Company can obtain letters of credit up to $750,000 consisting of a committed amount of $500,000 and an uncommitted amount of $250,000 to support certain of the Company’s crude oil purchases. The facility matures on April 23, 2013.
F-42
Table of Contents
REPORT OF INDEPENDENT REGISTERED PUBLIC ACCOUNTING FIRM
To the Board of Directors of PBF Holding Company LLC:
We have audited the accompanying balance sheet of the Paulsboro Refining Business as of December 16, 2010, and the related statements of income, changes in net parent investment, and cash flows for the period from January 1 through December 16, 2010 and for the year ended December 31, 2009. These financial statements are the responsibility of the management of the Paulsboro Refining Business. Our responsibility is to express an opinion on these financial statements based on our audits.
We conducted our audits in accordance with the standards of the Public Company Accounting Oversight Board (United States). Those standards require that we plan and perform the audit to obtain reasonable assurance about whether the financial statements are free of material misstatement. An audit includes consideration of internal control over financial reporting as a basis for designing audit procedures that are appropriate in the circumstances, but not for the purpose of expressing an opinion on the effectiveness of the Paulsboro Refining Business’ internal control over financial reporting. Accordingly, we express no such opinion. An audit also includes examining, on a test basis, evidence supporting the amounts and disclosures in the financial statements, assessing the accounting principles used and significant estimates made by management, as well as evaluating the overall financial statement presentation. We believe that our audits provide a reasonable basis for our opinion.
In our opinion, the financial statements referred to above present fairly, in all material respects, the financial position of the Paulsboro Refining Business as of December 16, 2010, and the results of its operations and its cash flows for the period from January 1 through December 16, 2010 and for the year ended December 31, 2009, in conformity with U.S. generally accepted accounting principles.
/s/ KPMG LLP
San Antonio, Texas
June 23, 2011
F-43
Table of Contents
BALANCE SHEET
(In thousands)
| December 16, 2010 |
||||
| ASSETS | ||||
| Current assets: |
||||
| Restricted cash |
12,122 | |||
| Accounts receivable, net |
686 | |||
| Inventories |
155,332 | |||
| Prepaid expenses |
829 | |||
|
|
|
|||
| Total current assets |
168,969 | |||
|
|
|
|||
| Property, plant and equipment, at cost |
341,236 | |||
| Accumulated depreciation |
— | |||
|
|
|
|||
| Property, plant and equipment, net |
341,236 | |||
|
|
|
|||
| Total assets |
$ | 510,205 | ||
|
|
|
|||
| LIABILITIES AND NET PARENT INVESTMENT |
||||
| Current liabilities: |
||||
| Current portion of capital lease obligation |
$ | 27 | ||
| Accounts payable |
12,950 | |||
| Accrued expenses |
6,046 | |||
| Taxes other than income taxes |
162 | |||
|
|
|
|||
| Total current liabilities |
19,185 | |||
|
|
|
|||
| Capital lease obligation, less current portion |
107 | |||
|
|
|
|||
| Other long-term liabilities |
23,290 | |||
|
|
|
|||
| Commitments and contingencies |
||||
| Net parent investment |
467,623 | |||
|
|
|
|||
| Total liabilities and net parent investment |
$ | 510,205 | ||
|
|
|
|||
See accompanying notes to the financial statements.
F-44
Table of Contents
STATEMENTS OF INCOME
(In thousands)
| Period from January 1, 2010 through December 16, 2010 |
Year Ended December 31, |
|||||||
| 2009 | ||||||||
| Operating revenues |
$ | 4,708,989 | $ | 3,549,517 | ||||
|
|
|
|
|
|||||
| Costs and expenses: |
||||||||
| Cost of sales |
4,487,825 | 3,419,460 | ||||||
| Operating expenses |
259,768 | 266,319 | ||||||
| General and administrative expenses |
14,606 | 15,594 | ||||||
| Asset impairment loss |
895,642 | 8,478 | ||||||
| Depreciation and amortization expense |
66,361 | 65,103 | ||||||
|
|
|
|
|
|||||
| Total costs and expenses |
5,724,202 | 3,774,954 | ||||||
|
|
|
|
|
|||||
| Operating income (loss) |
(1,015,213 | ) | (225,437 | ) | ||||
| Interest and other income and expense, net |
500 | 1,249 | ||||||
|
|
|
|
|
|||||
| Income (loss) before income tax expense (benefit) |
(1,014,713 | ) | (224,188 | ) | ||||
| Income tax expense (benefit) |
(322,962 | ) | (86,586 | ) | ||||
|
|
|
|
|
|||||
| Net income (loss) |
$ | (691,751 | ) | $ | (137,602 | ) | ||
|
|
|
|
|
|||||
See accompanying notes to the financial statements.
F-45
Table of Contents
STATEMENTS OF CHANGES IN NET PARENT INVESTMENT
(In thousands)
| Balance as of December 31, 2008 |
1,042,881 | |||
| Net loss |
(137,602 | ) | ||
| Net cash advances from parent |
177,989 | |||
|
|
|
|||
| Balance as of December 31, 2009 |
1,083,268 | |||
| Net loss |
(691,751 | ) | ||
| Net cash advances from parent |
76,106 | |||
|
|
|
|||
| Balance as of December 16, 2010 |
$ | 467,623 | ||
|
|
|
See accompanying notes to the financial statements.
F-46
Table of Contents
STATEMENTS OF CASH FLOWS
(In thousands)
| Period
from January 1, 2010 Through December 16, 2010 |
Year
Ended December 31, 2009 |
|||||||
| Cash flows from operating activities: |
||||||||
| Net income (loss) |
$ | (691,751 | ) | $ | (137,602 | ) | ||
| Adjustments to reconcile net income (loss) to net cash provided by (used in) operating activities: |
||||||||
| Depreciation and amortization expense |
66,361 | 65,103 | ||||||
| Asset impairment loss |
895,642 | 8,478 | ||||||
| Deferred income tax expense (benefit) |
(283,470 | ) | 13,808 | |||||
| Changes in current assets and current liabilities |
(8,663 | ) | (4,906 | ) | ||||
| Other, net |
(11,840 | ) | (6,814 | ) | ||||
|
|
|
|
|
|||||
| Net cash provided by (used in) operating activities |
(33,721 | ) | (61,933 | ) | ||||
|
|
|
|
|
|||||
| Cash flows from investing activities: |
||||||||
| Capital expenditures |
(20,122 | ) | (96,754 | ) | ||||
| Deferred turnaround and catalyst costs |
(17,011 | ) | (19,260 | ) | ||||
| Other investing activities, net |
(5,229 | ) | (19 | ) | ||||
|
|
|
|
|
|||||
| Net cash used in investing activities |
(42,362 | ) | (116,033 | ) | ||||
|
|
|
|
|
|||||
| Cash flows from financing activities: |
||||||||
| Capital lease payments |
(25 | ) | (25 | ) | ||||
| Net cash advances from (repayments to) parent |
76,106 | 177,989 | ||||||
|
|
|
|
|
|||||
| Net cash provided by (used in) financing activities |
76,081 | 177,964 | ||||||
|
|
|
|
|
|||||
| Net decrease in cash |
(2 | ) | (2 | ) | ||||
| Cash at beginning of period |
2 | 4 | ||||||
|
|
|
|
|
|||||
| Cash at end of period |
$ | — | $ | 2 | ||||
|
|
|
|
|
|||||
See accompanying notes to the financial statements.
F-47
Table of Contents
NOTES TO FINANCIAL STATEMENTS
1. BUSINESS DESCRIPTION
The Paulsboro Refining Business (the Business) includes the operations of the Paulsboro Refinery and related assets. The Paulsboro Refinery is located on 950 acres in Paulsboro, New Jersey, approximately 15 miles south of Philadelphia on the Delaware River. The refinery has a total throughput capacity, including crude oil and other feedstocks, of approximately 185,000 barrels per day. The refinery’s main processing facilities include a crude unit, a coker, a propane deasphalting unit, a fluid catalytic cracking unit, a continuous catalytic desulfurization unit, and a sulfur recovery unit. The refinery processed primarily sour crude oils into a wide slate of products including gasolines, distillates, lube oil basestocks and lube extracts, asphalt, fuel oil, petroleum coke, propane and sulfur. Feedstocks and refined products were typically transported by tanker and barge via refinery-owned dock facilities along the Delaware River, Buckeye Pipeline Company’s product distribution system into western Pennsylvania and Ohio, a local truck rack owned by NuStar Energy L.P., railcars, and the Colonial pipeline, which allowed products to be sold into the New York Harbor market.
The Paulsboro Refinery was acquired by a subsidiary of Valero Energy Corporation (Valero) from Mobil Oil Corporation (Mobil) on September 16, 1998. References to Valero or Parent herein may refer to Valero Energy Corporation or one or more of its direct or indirect subsidiaries that were not included in the financial statements of the Business, as the context requires.
As described in Note 3, the Business was sold to PBF Holding Company LLC (PBF Holding) on December 17, 2010. These financial statements include the operations of the Business through December 16, 2010.
2. SUMMARY OF SIGNIFICANT ACCOUNTING POLICIES
Basis of Presentation
These financial statements have been prepared in accordance with applicable United States generally accepted accounting principles (GAAP). The financial statements reflect Valero’s historical cost basis in the Business.
The financial statements include allocations and estimates of general and administrative costs of Valero that were attributable to the operations of the Business. The Business purchased its crude oil and other feedstocks from and sold its refined products to Valero. Purchases of feedstock by the Business from Valero were recorded at the cost paid to third parties by Valero, and sales of refined products from the Business to Valero were recorded at intercompany transfer prices, which were market prices adjusted by quality, location, and other differentials on the date of the sale. Management believes that the assumptions, estimates, and allocations used to prepare these financial statements are reasonable. However, the amounts reflected in these financial statements may not necessarily be indicative of the revenues, costs, and expenses that would have resulted if the Business had been operated as a separate entity.
The Business’ results of operations may have been affected by seasonal factors, such as the demand for petroleum products, which vary during the year, or industry factors that may be specific to a particular period, such as industry supply capacity and refinery turnarounds. In addition, the Business’ results of operations were dependent on Valero’s feedstock acquisition and refined product marketing activities.
Management has evaluated subsequent events that occurred after December 16, 2010 through June 23, 2011, the date these financial statements were issued. Any material subsequent events that occurred during this time have been properly recognized or disclosed in these financial statements.
F-48
Table of Contents
PAULSBORO REFINING BUSINESS
NOTES TO FINANCIAL STATEMENTS—(Continued)
Use of Estimates
The preparation of financial statements in conformity with GAAP requires management to make estimates and assumptions that affect the amounts reported in the financial statements and accompanying notes. Actual results could differ from those estimates. On an ongoing basis, management reviewed its estimates based on currently available information. Changes in facts and circumstances could result in revised estimates.
Inventories
Inventories represent inventories located at the refinery and consisted of refinery feedstocks purchased for processing, refined products, and materials and supplies. Inventories were carried at the lower of cost or market. The cost of refinery feedstocks purchased for processing and refined products were determined under the last-in, first-out (LIFO) method using the dollar-value LIFO method, with any increments valued based on purchase prices at the end of the year. The cost of materials and supplies was determined under the weighted-average cost method.
Property, Plant and Equipment
Property, plant and equipment were stated at cost. Additions to property, plant and equipment, including capitalized interest and certain costs allocable to construction and property purchases, were recorded at cost.
The costs of minor property units (or components of property units), net of salvage value, retired or abandoned were charged or credited to accumulated depreciation under the composite method of depreciation. Gains or losses on sales or other dispositions of major units of property were recorded in income and were reported in depreciation and amortization expense.
Depreciation of property, plant and equipment was recorded on a straight-line basis over the estimated useful lives of the related facilities primarily using the composite method of depreciation. Leasehold improvements and assets acquired under capital leases were amortized using the straight-line method over the shorter of the lease term or the estimated useful life of the related asset. The Business recorded additional accumulated depreciation of $354,829 in recognition of the asset impairment discussed below and in Note 3.
Deferred Charges and Other Assets
Deferred charges and other assets included the following:
| • | refinery turnaround costs, which were incurred in connection with planned major maintenance activities at the Paulsboro Refinery and which were deferred when incurred and amortized on a straight-line basis over the period of time estimated to lapse until the next turnaround occurs; |
| • | fixed-bed catalyst costs, representing the cost of catalyst that was changed out at periodic intervals when the quality of the catalyst has deteriorated beyond its prescribed function, which were deferred when incurred and amortized on a straight-line basis over the estimated useful life of the specific catalyst; and |
| • | process royalty costs, which were deferred when incurred and amortized over the life of the specific royalty. |
Impairment and Disposal of Long-Lived Assets
Long-lived assets were tested for recoverability whenever events or changes in circumstances indicated that the carrying amount might not be recoverable. A long-lived asset is not recoverable if its carrying amount exceeds the sum of the undiscounted cash flows expected to result from its use and eventual disposition. If a
F-49
Table of Contents
PAULSBORO REFINING BUSINESS
NOTES TO FINANCIAL STATEMENTS—(Continued)
long-lived asset is not recoverable, an impairment loss is recognized in an amount by which its carrying amount exceeds its fair value, with fair value determined based on discounted estimated net cash flows or other appropriate methods. On December 16, 2010, the Business recorded an asset impairment charge of $896 million as a result of Valero’s sale of the Business to PBF Holding on December 17, 2010.
Environmental Matters
Liabilities for future remediation costs were recorded when environmental assessments and/or remedial efforts were probable and the costs could be reasonably estimated. Other than for assessments, the timing and magnitude of these accruals generally were based on the completion of investigations or other studies or a commitment to a formal plan of action. Environmental liabilities were based on best estimates of probable undiscounted future costs over a 20-year time period using currently available technology and applying current regulations, as well as the Business’ own internal environmental policies. Amounts recorded for environmental liabilities were not reduced by possible recoveries from third parties.
Asset Retirement Obligations
The Business had asset retirement obligations with respect to certain of its refinery assets due to various legal obligations to clean and/or dispose of various component parts at the time they were retired. As of December 31, 2010, the Business had recorded asset retirement obligations related to certain pond closures and a landfill closure.
In addition to these recorded asset retirement obligations, the Business had asset retirement obligations with respect to certain other component parts of its refinery assets. However, those component parts could be used for extended and indeterminate periods of time as long as they were properly maintained and/or upgraded. It was management’s practice and current intent to maintain those refinery assets and continue making improvements to those assets based on technological advances. As a result, management believed that those refinery assets had an indeterminate life for purposes of estimating asset retirement obligations because dates or ranges of dates upon which such refinery assets would be retired cannot be reasonably estimated at this time. When a date or range of dates can be reasonably estimated for the retirement of any component part of those refinery assets, an estimate of the cost of performing the retirement activities will be determined and a liability will be recorded for the fair value of that cost using established present value techniques.
Net Parent Investment
The net parent investment represents a net amount consisting of the Parent’s initial investment in the Business and subsequent adjustments resulting from the operations of the Business and various transactions between the Business and Valero. The Business participated in the Parent’s centralized cash management program under which all of the Business’ cash receipts were remitted to and all cash disbursements were funded by the Parent. Other transactions affecting the net parent investment include general and administrative expenses incurred by Valero and allocated to the Business. There were no terms of settlement or interest charges associated with the net parent investment.
Revenue Recognition
Revenues were recorded by the Business upon delivery of the refined products to the Parent, which was the point at which title to the products was transferred.
F-50
Table of Contents
PAULSBORO REFINING BUSINESS
NOTES TO FINANCIAL STATEMENTS—(Continued)
Cost of Sales
Cost of sales included the cost of feedstock acquired for processing by the Business, including transportation costs to deliver the feedstock to the refinery.
Operating Expenses
Operating expenses consisted primarily of labor costs of refinery personnel, maintenance, fuel and power costs, chemical and catalyst costs, and third-party services. Such expenses were recognized as incurred.
Stock-Based Compensation
Employees of the Business participate in various employee benefit plans of the Parent, including certain stock-based compensation plans as discussed in Note 9. Compensation expense for awards under the stock-based compensation plans was based on the fair value of the awards granted and was recognized in the statements of income on a straight-line basis over the requisite service period of each award. For new grants that had retirement-eligibility provisions, the Business used the substantive vesting period approach, under which compensation cost was recognized immediately for awards granted to retirement-eligible employees or over the period from the grant date to the date retirement eligibility was achieved if that date was expected to occur before the nominal vesting periods of the awards was fulfilled.
Income Taxes
Income taxes were accounted for under the asset and liability method. Under this method, deferred tax assets and liabilities were recognized for the future tax consequences attributable to differences between the financial statement carrying amounts of existing assets and liabilities and their respective tax bases. Deferred amounts were measured using enacted tax rates expected to apply to taxable income in the year those temporary differences were expected to be recovered or settled.
The Business paid the Parent the amount of its current federal income tax liability as determined under a tax-sharing arrangement with the Parent; the accrual and payment of the current federal income tax liability was recorded in net parent investment in the financial statements in the year incurred. The current state income tax liability of the Business was reflected in income taxes payable.
Historically, the Business’ results of operations were included in the consolidated federal income tax return filed by Valero and were included in state income tax returns of subsidiaries of Valero. The income tax provision represented the current and deferred income taxes that would have resulted if the Business were a stand-alone taxable entity filing its own income tax returns. Accordingly, the calculations of the current and deferred income tax provision necessarily require certain assumptions, allocations, and estimates that management believed were reasonable to reflect the tax reporting for the Business as a stand-alone taxpayer.
The Business elected to classify any interest expense and penalties related to the underpayment of income taxes in income tax expense.
Segment Disclosures
The Business operated in only one segment, the refining segment of the oil and gas industry.
Financial Instruments
The Business’ financial instruments included cash, receivables, and payables. The estimated fair values of these financial instruments approximated their carrying amounts.
F-51
Table of Contents
PAULSBORO REFINING BUSINESS
NOTES TO FINANCIAL STATEMENTS—(Continued)
3. SALE OF BUSINESS
On December 17, 2010, the Business was sold to PBF Holding for $661 million of proceeds, of which $160 million consisted of a short-term note. Working capital, consisting primarily of inventory, was included as part of this transaction. On December 16, 2010, the Business recorded an impairment charge of $896 million to reflect the reduction in the carrying value of its assets.
4. INVENTORIES
Inventories consisted of the following (in thousands):
| December 16, 2010 |
||||
| Refinery feedstocks |
$ | 50,604 | ||
| Refined products and blendstocks |
92,664 | |||
| Materials and supplies |
12,064 | |||
|
|
|
|||
| Inventories |
$ | 155,332 | ||
|
|
|
|||
A reduction in inventory volumes during the period from January 1, 2010 through December 16, 2010 and for the year ended December 31, 2009 resulted in a liquidation of LIFO inventory layers that were established in prior years. The effect of these liquidations was to decrease cost of sales by $20.8 million and $33.6 million for the period from January 1, 2010 through December 16, 2010 and for the year ended December 31, 2009, respectively.
As of December 16, 2010, the replacement cost (market value) of LIFO inventories exceeded their LIFO carrying amounts by approximately $171.3 million.
5. PROPERTY, PLANT AND EQUIPMENT
Major classes of property, plant and equipment consisted of the following (in thousands):
| Estimated Useful Lives |
December 16, 2010 |
|||||||
| Land |
$ | 7,564 | ||||||
| Crude oil processing facilities |
25 years | 1,410,361 | ||||||
| Buildings |
40 – 42 years | 3,005 | ||||||
| Precious metals |
5,231 | |||||||
| Other |
5 – 20 years | 51,518 | ||||||
| Construction in progress |
63,664 | |||||||
| Asset impairment |
(1,200,107 | ) | ||||||
|
|
|
|||||||
| Property, plant and equipment, at cost |
341,236 | |||||||
| Accumulated depreciation |
— | |||||||
|
|
|
|||||||
| Property, plant and equipment, net |
$ | 341,236 | ||||||
|
|
|
|||||||
The Business leased an oxygen facility under a capital lease that is discussed further in Note 8. The capital lease, which is included above in “other,” had a net book value of $0.2 million, net of accumulated amortization of $0.1 million, as of December 16, 2010.
Depreciation expense for the period from January 1, 2010 through December 16, 2010 and for the year ended December 31, 2009 was $52.1 million and $52.1 million, respectively.
F-52
Table of Contents
PAULSBORO REFINING BUSINESS
NOTES TO FINANCIAL STATEMENTS—(Continued)
Management continually evaluated all of the refinery’s capital projects in progress during their construction, which at times resulted in the cancellation of certain of such projects. The cancellation of various capital projects became more significant in 2009, as the economic slowdown that began in 2008 continued throughout 2009, thereby impacting demand for refined products and putting significant pressure on refined product margins. For the year ended December 31, 2009, project costs totaling $8.5 million were written off.
In addition to capital projects that were written off, construction activity on various other projects were suspended until market conditions and cash flows improved. As of December 16, 2010, various projects with a total cost of approximately $56 million had been temporarily suspended. These costs were written off and included in the asset impairment charge discussed in Note 3.
6. ACCRUED EXPENSES AND OTHER LONG-TERM LIABILITIES
Accrued expenses and other long-term liabilities as of December 16, 2010 consisted of the following (in thousands):
| Accrued Expenses |
Other Long-Term Liabilities |
|||||||
| 2010 | 2010 | |||||||
| Asset retirement obligations |
$ | 3,500 | $ | 7,867 | ||||
| Environmental liabilities |
1,405 | 11,459 | ||||||
| Legal and regulatory liabilities |
625 | 1,983 | ||||||
| Uncertain income tax position liabilities |
— | 1,981 | ||||||
| Employee wage and benefit costs |
501 | — | ||||||
| Other |
15 | — | ||||||
|
|
|
|
|
|||||
| Total |
$ | 6,046 | $ | 23,290 | ||||
|
|
|
|
|
|||||
Environmental Liabilities
In connection with the acquisition of the Paulsboro Refinery in 1998, Valero assumed certain environmental liabilities including, but not limited to, certain remediation obligations related primarily to clean-up costs associated with groundwater contamination, landfill closure and post-closure monitoring costs, and tank farm spill prevention costs.
The table below reflects the changes in the environmental liabilities of the Business (in thousands):
| Period from January 1 through December 16, 2010 |
Year
Ended December 31, 2009 |
|||||||
| Balance as of beginning of period |
$ | 15,008 | $ | 16,516 | ||||
| Additions to liability |
700 | — | ||||||
| Payments, net of third-party recoveries |
(2,844 | ) | (1,508 | ) | ||||
|
|
|
|
|
|||||
| Balance as of end of period |
$ | 12,864 | $ | 15,008 | ||||
|
|
|
|
|
|||||
F-53
Table of Contents
PAULSBORO REFINING BUSINESS
NOTES TO FINANCIAL STATEMENTS—(Continued)
Asset Retirement Obligations
The table below reflects the changes in asset retirement obligations of the Business (in thousands):
| Period from January 1 through December 16, 2010 |
Year
Ended December 31, 2009 |
|||||||
| Balance as of beginning of period |
$ | 11,807 | $ | 12,361 | ||||
| Settlements |
(440 | ) | (554 | ) | ||||
|
|
|
|
|
|||||
| Balance as of end of period |
$ | 11,367 | $ | 11,807 | ||||
|
|
|
|
|
|||||
7. COMMITMENTS AND CONTINGENCIES
Leases
The Business had long-term operating lease commitments for office facilities and office equipment. In most cases, the Business expects that in the normal course of business, its leases will be renewed or replaced by other leases.
The Business leased an oxygen facility under an agreement accounted for as a capital lease. The lease expires in May 2015.
As of December 16, 2010, future minimum rentals for leases having initial or remaining noncancelable lease terms in excess of one year were as follows (in thousands):
| Operating Leases |
Capital Lease |
|||||||
| 2011 |
$ | 1,574 | $ | 34 | ||||
| 2012 |
1,587 | 34 | ||||||
| 2013 |
1,610 | 34 | ||||||
| 2014 |
1,634 | 34 | ||||||
| 2015 |
1,657 | 14 | ||||||
| Remainder |
1,965 | — | ||||||
|
|
|
|
|
|||||
| Total minimum rental payments |
$ | 10,027 | 150 | |||||
|
|
|
|||||||
| Less interest expense |
(16 | ) | ||||||
|
|
|
|||||||
| Capital lease obligation |
$ | 134 | ||||||
|
|
|
|||||||
Rental expense for all operating leases was $12.0 million and $14.5 million for the period ended December 16, 2010 and for the year ended December 31, 2009, respectively.
Litigation Matters
MTBE Litigation
As of June 23, 2011, Valero and several of its subsidiaries are named in numerous cases involving claims related to MTBE contamination in groundwater based on the manufacture, marketing and supply of gasoline containing MTBE. With respect to the historic operations at the Paulsboro Refinery, ten of these cases may
F-54
Table of Contents
PAULSBORO REFINING BUSINESS
NOTES TO FINANCIAL STATEMENTS—(Continued)
involve allegations of liability for gasoline containing MTBE manufactured at the Paulsboro Refinery. The Valero subsidiary that previously owned the Paulsboro Refinery has been named in four of the cases along with Valero and other Valero subsidiaries and has potential liability in the other six cases. In connection with the sale of the Business, Valero retained the liability for these matters. The plaintiffs are generally water providers, governmental authorities, and private water companies alleging that refiners and marketers of MTBE and gasoline containing MTBE are liable for manufacturing or distributing a defective product. Valero has been named in these lawsuits together with many other refining industry companies. Valero is being sued primarily as a refiner and distributor of MTBE and gasoline containing MTBE. Valero does not own or operate gasoline station facilities in most of the geographic locations in which damage is alleged to have occurred. The lawsuits generally seek individual, unquantified compensatory and punitive damages, injunctive relief, and attorneys’ fees. All but one of the cases are pending in federal court and most are consolidated for pre-trial proceedings in the U.S. District Court for the Southern District of New York (Multi-District Litigation Docket No. 1358, In re: Methyl-Tertiary Butyl Ether Products Liability Litigation). Discovery is open in all cases. Valero believes that it has strong defenses to all claims and is vigorously defending the lawsuits. Although Valero has recorded a loss contingency liability with respect to the MTBE litigation portfolio, the Business had not recorded a liability for this litigation.
Other Litigation
The Business was also a party to other claims and legal proceedings arising in the ordinary course of business. Management believed that there was only a remote likelihood that future costs related to known contingent liabilities related to these legal proceedings would have a material adverse impact on the results of operations or financial position of the Business.
8. EMPLOYEE BENEFIT PLANS
Employees who work for the Business were included in the various employee benefit plans of the Parent. These plans included qualified, non-contributory defined benefit retirement plans, defined contribution plans, employee and retiree medical, dental, and life insurance plans, incentive plans (i.e., stock options, restricted stock, and bonuses), and other such benefits. For the incentive plans, the Business was charged with the bonus, stock option, and restricted stock expense directly attributable to its employees. For the purposes of these financial statements, the Business was considered to be participating in multi-employer benefit plans of the Parent.
The Business’ allocated share of the Parent’s employee benefit plan expenses were as follows (in thousands):
| Period from January 1 through December 16, 2010 |
Year
Ended December 31, 2009 |
|||||||
| Defined benefit plans excluding incentive plans |
$ | 13,361 | $ | 21,529 | ||||
| Incentive plans |
6,305 | 4,298 | ||||||
Employee benefit plan expenses incurred by the Business were included in operating expenses with the related payroll costs.
F-55
Table of Contents
PAULSBORO REFINING BUSINESS
NOTES TO FINANCIAL STATEMENTS—(Continued)
9. INCOME TAXES
The amounts presented below relate only to the Business and were calculated as if the Business filed separate federal and state income tax returns.
Components of income tax expense (benefit) were as follows (in thousands):
| Period from January 1 through December 16, 2010 |
Year
Ended December 31, 2009 |
|||||||
| Current: |
||||||||
| Federal |
$ | (39,492 | ) | $ | (100,394 | ) | ||
| State |
— | — | ||||||
|
|
|
|
|
|||||
| Total current |
(39,492 | ) | (100,394 | ) | ||||
|
|
|
|
|
|||||
| Deferred: |
||||||||
| Federal |
(247,514 | ) | 33,353 | |||||
| State |
(35,955 | ) | (19,545 | ) | ||||
|
|
|
|
|
|||||
| Total deferred |
(283,470 | ) | 13,808 | |||||
|
|
|
|
|
|||||
| Income tax expense (benefit) |
$ | (322,962 | ) | $ | (86,586 | ) | ||
|
|
|
|
|
|||||
The following is a reconciliation of total income tax expense (benefit) to income taxes computed by applying the U.S. statutory federal income tax rate (35% for all periods presented) to income (loss) before income tax expense (benefit) (in thousands):
| Period from January 1 through December 16, 2010 |
Year
Ended December 31, 2009 |
|||||||
| Federal income tax expense (benefit) at the U.S. statutory rate |
$ | (355,150 | ) | $ | (78,466 | ) | ||
| U.S. state income tax expense (benefit), net of U.S. federal income tax effect |
(23,371 | ) | (12,704 | ) | ||||
| U.S. manufacturing deduction |
2,540 | 4,200 | ||||||
| Change in valuation allowance |
52,644 | — | ||||||
| Other, net |
375 | 384 | ||||||
|
|
|
|
|
|||||
| Income tax expense (benefit) |
$ | (322,962 | ) | $ | (86,586 | ) | ||
|
|
|
|
|
|||||
F-56
Table of Contents
PAULSBORO REFINING BUSINESS
NOTES TO FINANCIAL STATEMENTS—(Continued)
The tax effects of significant temporary differences representing deferred income tax assets and liabilities were as follows (in thousands):
| December 16, 2010 |
||||
| Deferred income tax assets: |
||||
| Tax credit carryforwards |
$ | 1,300 | ||
| Net operating losses (NOL) |
22,795 | |||
| Environmental liabilities |
5,255 | |||
| Compensation and employee benefit liabilities |
4,481 | |||
| Property, plant and equipment |
70,007 | |||
| Other assets |
3,664 | |||
|
|
|
|||
| Total deferred income tax assets |
107,502 | |||
| Less: Valuation allowance |
(88,444 | ) | ||
|
|
|
|||
| Net deferred tax asset |
19,058 | |||
|
|
|
|||
| Deferred income tax liabilities: |
||||
| Inventories |
(19,016 | ) | ||
| Other |
(42 | ) | ||
|
|
|
|||
| Total deferred income tax liabilities |
(19,058 | ) | ||
|
|
|
|||
| Net deferred income tax liabilities |
$ | — | ||
|
|
|
|||
The Business had the following income tax credit and loss carryforwards as of December 16, 2010 (in thousands):
| Amount | Expiration | |||||||
| U.S. state NOL (gross amount) |
$ | 389,651 | 2029 through 2030 | |||||
| U.S. state credits |
2,000 | 2016 through 2017 | ||||||
The Business recorded a valuation allowance as of December 16, 2010 due to uncertainties related to its ability to utilize some of its deferred income taxes, primarily consisting of certain state NOLs, state credits, and federal deferred tax assets. The valuation allowance was based on estimates of taxable income in the various jurisdictions in which the Business operated and the period over which deferred income taxes would be recoverable. The realization of net deferred income tax assets recorded as of December 16, 2010 was primarily dependent upon the ability of the Business to generate future taxable income in certain states. Because the Business was sold on December 17, 2010 and no gain was recognized from the sale, no future taxable income will be generated, and therefore the Business recorded a valuation allowance.
The following is a reconciliation of the change in unrecognized tax benefits, excluding the effect of related penalties and interest and the federal tax effect of state unrecognized tax benefits (in millions):
| Period from January 1 through December 16, 2010 |
Year
Ended December 31, 2009 |
|||||||
| Balance as of beginning of period |
$ | 1,668 | $ | 2,234 | ||||
| Reductions for tax positions related to prior years |
(510 | ) | (566 | ) | ||||
|
|
|
|
|
|||||
| Balance as of end of period |
$ | 1,158 | $ | 1,668 | ||||
|
|
|
|
|
|||||
F-57
Table of Contents
PAULSBORO REFINING BUSINESS
NOTES TO FINANCIAL STATEMENTS—(Continued)
10. SUPPLEMENTAL CASH FLOW INFORMATION
In order to determine net cash provided by (used in) operating activities, net income (loss) was adjusted by, among other things, changes in current assets and current liabilities as follows (in thousands):
| Period from January 1 through December 16, 2010 |
Year
Ended December 31, 2009 |
|||||||
| Decrease (increase) in current assets: |
||||||||
| Restricted cash |
$ | (12,122 | ) | $ | — | |||
| Accounts receivable |
(110 | ) | (218 | ) | ||||
| Inventories |
21,230 | 32,933 | ||||||
| Prepaid expenses |
412 | (214 | ) | |||||
| Increase (decrease) in current liabilities: |
||||||||
| Accounts payable |
(11,885 | ) | (30,982 | ) | ||||
| Accrued expenses |
(6,140 | ) | 8,026 | |||||
| Taxes other than income taxes |
(48 | ) | (123 | ) | ||||
| Income taxes payable |
— | (14,328 | ) | |||||
|
|
|
|
|
|||||
| Changes in current assets and current liabilities |
$ | (8,663 | ) | $ | (4,906 | ) | ||
|
|
|
|
|
|||||
The above changes in current assets and current liabilities differ from changes between amounts reflected in the applicable balance sheets for the respective periods for the following reasons:
| • | the amounts shown above exclude changes in cash, deferred income taxes, and current portion of capital lease obligation, and |
| • | amounts accrued for capital expenditures and deferred turnaround and catalyst costs were reflected in investing activities when such amounts were paid. |
Cash flows related to income taxes and interest were as follows (in thousands):
| Period from January 1 through December 16, 2010 |
Year
Ended December 31, 2009 |
|||||||
| Income taxes paid, net of tax refunds received |
$ | (39,492 | ) | $ | (86,066 | ) | ||
| Interest paid (net of amount capitalized) |
7 | 9 | ||||||
11. RELATED-PARTY TRANSACTIONS
Related-party transactions of the Business included the purchase of feedstocks by the Business from Valero, operating revenues received by the Business from its sales of refined products to Valero, and the allocation of insurance and security costs and certain general and administrative costs from Valero to the Business. Purchases of feedstock by the Business from Valero were recorded at the cost paid to third parties by Valero. Sales of refined products from the Business to Valero were recorded at intercompany transfer prices, which were market prices adjusted by quality, location, and other differentials on the date of the sale. General and administrative costs were charged by Valero to the Business based on management’s determination of such costs attributable to the operations of the Business. However, such related-party transactions cannot be presumed to be carried out on an arm’s length basis as the requisite conditions of competitive, free-market dealings may not exist. For purposes of these financial statements, payables and receivables related to transactions between the Business and Valero were included as a component of the net parent investment.
F-58
Table of Contents
PAULSBORO REFINING BUSINESS
NOTES TO FINANCIAL STATEMENTS—(Continued)
The Business participated in the Parent’s centralized cash management program under which cash receipts and cash disbursements were processed through the Parent’s cash accounts with a corresponding credit or charge to an intercompany account. This intercompany account was included in the net parent investment.
As discussed above, Valero provided the Business with certain general and administrative services, including the centralized corporate functions of legal, accounting, treasury, environmental, engineering, information technology, and human resources. For these services, Valero charged the Business a portion of its total general and administrative expenses incurred in the U.S. The general and administrative expenses represented the amount of such costs allocated to the Business for the periods presented, with this allocation based on investments in property, operating revenues, and payroll expenses. Management believed that the amount of general and administrative expenses allocated to the Business was a reasonable approximation of the costs related to the Business.
The following table summarizes the related-party transactions of the Business (in thousands):
| Period from January 1 through December 16, 2010 |
Year
Ended December 31, 2009 |
|||||||
| Revenues. |
$ | 4,708,989 | $ | 3,549,517 | ||||
| Cost of sales |
4,485,451 | 3,412,896 | ||||||
| Operating expenses |
3,071 | 3,542 | ||||||
| General and administrative expenses |
14,606 | 15,594 | ||||||
F-59
Table of Contents
REPORT OF INDEPENDENT AUDITORS
To the Board of Directors of
Sunoco, Inc.
We have audited the accompanying statement of assets acquired and liabilities assumed of the Toledo Refinery (the Toledo, Ohio manufacturing complex of Sunoco, Inc. (R&M) as described in Note 1) as of December 31, 2010 and the related statements of revenues and direct expenses for each of the two years in the period ended December 31, 2010. These statements are the responsibility of Sunoco, Inc. (R&M)’s management. Our responsibility is to express an opinion on these statements based on our audits.
We conducted our audits in accordance with auditing standards generally accepted in the United States. Those standards require that we plan and perform the audit to obtain reasonable assurance about whether the statements are free of material misstatement. We were not engaged to perform an audit of the Toledo Refinery’s internal control over financial reporting. Our audits included consideration of internal control over financial reporting as a basis for designing audit procedures that are appropriate in the circumstances, but not for the purpose of expressing an opinion on the effectiveness of the Toledo Refinery’s internal control over financial reporting. Accordingly, we express no such opinion. An audit also includes examining, on a test basis, evidence supporting the amounts and disclosures in the financial statements, assessing the accounting principles used and significant estimates made by management, and evaluating the overall financial statement presentation. We believe that our audits provide a reasonable basis for our opinion.
As described in Note 1, the accompanying statements reflect the assets acquired and liabilities assumed pursuant to the sales agreement between Sunoco, Inc. (R&M) and Toledo Refining Company LLC dated December 1, 2010 and the revenues and direct expenses of the Toledo Refinery, and are not intended to be a complete presentation of the Toledo Refinery’s financial position or results of operations.
In our opinion, the statements referred to above present fairly, in all material respects, the statement of assets acquired and liabilities assumed of the Toledo Refinery at December 31, 2010 and the statements of revenues and direct expenses for each of the two years in the period ended December 31, 2010, in conformity with U.S. generally accepted accounting principles.
/s/ Ernst & Young LLP
Philadelphia, Pennsylvania
September 12, 2011
F-60
Table of Contents
Statements of Revenues and Direct Expenses
(Thousands of Dollars)
| For the Years Ended December 31, |
||||||||
| 2010 | 2009 | |||||||
| Revenues |
||||||||
| Sales and other operating revenue |
||||||||
| (including consumer excise taxes): |
||||||||
| Unaffiliated customers |
$ | 3,594,463 | $ | 2,784,251 | ||||
| Affiliated customers |
2,067,599 | 1,560,220 | ||||||
| Other losses, net |
(690 | ) | (3,980 | ) | ||||
|
|
|
|
|
|||||
| 5,661,372 | 4,340,491 | |||||||
| Direct Expenses |
||||||||
| Cost of products sold |
4,992,219 | 3,759,672 | ||||||
| Operating expenses |
198,963 | 217,687 | ||||||
| Consumer excise taxes |
330,328 | 342,422 | ||||||
| Selling, general and administrative expenses |
29,836 | 28,204 | ||||||
| Depreciation and amortization |
60,446 | 45,364 | ||||||
| Provision for asset write-downs and other matters |
3,578 | 17,864 | ||||||
|
|
|
|
|
|||||
| 5,615,370 | 4,411,213 | |||||||
| Revenues in excess of (less than) direct expenses |
$ | 46,002 | $ | (70,722 | ) | |||
|
|
|
|
|
|||||
(See Accompanying Notes)
F-61
Table of Contents
Statement of Assets Acquired and Liabilities Assumed
(Thousands of Dollars)
| At December 31, | ||||
| 2010 | ||||
| Assets Acquired: |
||||
| Inventories |
$ | 60,890 | ||
| Property, plant, and equipment, net |
866,628 | |||
| Deferred charges and other assets |
4,091 | |||
|
|
|
|||
| Total Assets Acquired |
$ | 931,609 | ||
|
|
|
|||
| Liabilities Assumed: |
||||
| Liabilities associated with vacation accrual |
$ | 3,013 | ||
| Asset retirement obligations |
4,374 | |||
|
|
|
|||
| Total Liabilities Assumed |
$ | 7,387 | ||
|
|
|
|||
(See Accompanying Notes)
F-62
Table of Contents
NOTES TO THE STATEMENT OF ASSETS ACQUIRED AND LIABILITIES ASSUMED AND
THE RELATED STATEMENTS OF REVENUES AND DIRECT EXPENSES
1. Summary of Significant Accounting Policies
Description of Business
The accompanying statement of assets acquired and liabilities assumed and the related statements of revenues and direct expenses consist of the accounts of and related-party allocations to the Toledo Refinery (the “Refinery”), a 170 thousand barrel per day refining and manufacturing complex located in Toledo, Ohio. On March 1, 2011, Sunoco, Inc. (R&M), a wholly owned subsidiary of Sunoco, Inc. (collectively, “Sunoco”) completed the sale of the Refinery to Toledo Refining Company LLC (“TRC”) a wholly owned subsidiary of PBF Holding Company LLC. Sunoco received net proceeds of $1,037,224 thousand consisting of $545,766 thousand in cash at closing, a $200,000 thousand two-year note receivable, and a $285,199 thousand note receivable and $6,259 thousand in cash related to working capital adjustments subsequent to closing which were both paid in May 2011. In addition, the sale also includes a participation payment of up to $125,000 thousand based on the future profitability of the Refinery. Sunoco has not recorded any amount related to the contingent consideration in accordance with its accounting policy election on such amounts. The sale consisted primarily of property, plant, and equipment and related crude and refined product inventories. The $200,000 thousand two-year note receivable is secured by the long-lived Refinery assets included in the sale.
In its current configuration, the Refinery processes sweet crude oils to manufacture petroleum and chemical products which are generally sold to wholesale and industrial customers.
Basis of Presentation
The accompanying statement of assets acquired and liabilities assumed and the related statements of revenues and direct expenses reflect historical cost-basis amounts of the Refinery and include charges from Sunoco for direct costs and allocations of corporate overhead. The Refinery utilized certain shared resources of Sunoco prior to the sale to TRC. As such, for the purposes of preparing these statements, Sunoco made certain allocations to the Refinery. While the basis of these allocations was considered reasonable by Sunoco, actual amounts incurred by the Refinery could differ significantly if the Refinery were operated on a stand-alone basis and/or by another party. The financial information included herein may not necessarily reflect what the assets acquired and liabilities assumed of the Refinery would have been if the Refinery had been a separate stand-alone entity during the periods presented.
The statements of revenues and direct expenses reflect revenue and related direct expenses specifically identified to the Refinery and therefore exclude certain other items such as interest income, interest expense and income taxes which are not directly related to the Refinery. The statement of assets acquired and liabilities assumed includes only items which are being acquired or assumed by TRC pursuant to the sales agreement between Sunoco, Inc. (R&M) and TRC dated December 1, 2010. As such, it excludes certain assets and liabilities associated with the Refinery such as accounts receivable, accounts payable, accrued liabilities, retirement liabilities and deferred taxes. In addition, as this financial information is not intended to represent the Refinery’s complete financial position and results of operations for the periods presented, it does not include statements of cash flows or changes in equity or all disclosures required by generally accepted accounting principles.
Use of Estimates
The statement of assets acquired and liabilities assumed and the related statements of revenues and direct expenses were derived from the accounts of Sunoco. The preparation of financial statements in conformity with U.S. generally accepted accounting principles requires management to make estimates and assumptions that affect the amounts reported in these statements. Actual amounts and results could differ from these estimates.
F-63
Table of Contents
TOLEDO REFINERY
NOTES TO THE STATEMENT OF ASSETS ACQUIRED AND LIABILITIES ASSUMED AND
THE RELATED STATEMENTS OF REVENUES AND DIRECT EXPENSES—(Continued)
Revenue Recognition
The Refinery sells various refined products (including gasoline, middle distillates and petrochemicals) and unfinished product streams.
Revenues related to the sale of these items are recognized when title passes. Title passage generally occurs when products are shipped or delivered in accordance with the terms of the respective sales agreements. In addition, revenues are not recognized until sales prices are fixed or determinable and collectability is reasonably assured.
Consumer excise taxes on sales of refined products are included in both revenues and direct expenses, with no effect on revenues in excess of (less than) direct expenses.
Shipping and Handling Costs
Shipping and handling costs charged to customers are included in sales and other operating revenue in the statements of revenues and direct expenses. Shipping and handling costs incurred by the Refinery are included in cost of products sold in the statements of revenues and direct expenses.
Inventories
Inventories are valued at the lower of cost or market. Crude oil and refined product inventories reflect an allocation to the Refinery of the Refinery’s share of Sunoco’s crude oil and refined product inventories, the cost of which has been determined using the last-in, first-out method (“LIFO”). Under this allocation methodology, cost of products sold includes the actual crude oil and refined product acquisition costs of the Refinery. Such costs are adjusted to reflect actual increases or decreases in crude oil and refined product inventory quantities of the Refinery, which are valued based on the changes in Sunoco’s LIFO inventory layers during the respective year. The cost of materials, supplies and other inventories is determined using principally the average cost method.
Property, Plant and Equipment
Property, plant and equipment are stated at cost. These amounts exclude interest costs that were capitalized by Sunoco as all such financing was carried out on a Sunoco consolidated basis. Additions to property, plant and equipment, including replacements and improvements, are recorded at cost. Normal repair and maintenance expenditures are charged to expense as incurred. Refinery assets are generally depreciated using the straight-line method based on the estimated useful lives of the related assets. While the useful lives of all depreciable assets range from 3 to 25 years, the useful lives of production assets are principally 25 years. The Refinery, including all assets acquired and liabilities assumed by TRC with the sale, was classified as an asset held for sale in Sunoco’s consolidated financial statements as of December 1, 2010. In connection therewith, depreciation and amortization expense of $5,641 thousand was not recognized in December 2010 in accordance with accounting guidance related to assets held for sale.
Impairment of Long-Lived Assets
Long-lived assets, other than those held for sale, are reviewed for impairment whenever events or changes in circumstances indicate that the carrying amount of the assets may not be recoverable. An asset is considered to be impaired when the undiscounted estimated net cash flows expected to be generated by the asset are less than its carrying amount. The impairment recognized is the amount by which the carrying amount exceeds the fair value of the impaired asset.
F-64
Table of Contents
TOLEDO REFINERY
NOTES TO THE STATEMENT OF ASSETS ACQUIRED AND LIABILITIES ASSUMED AND
THE RELATED STATEMENTS OF REVENUES AND DIRECT EXPENSES—(Continued)
A decision to dispose of an asset may necessitate an impairment review. If the criteria of assets held for sale are met, an impairment would be recognized for any excess of the aggregate carrying amount of assets and liabilities included in the disposal group over their fair value less cost to sell. The Refinery, including long-lived assets, crude oil, refined product and materials and supplies inventories and goodwill, were classified as held for sale in Sunoco’s consolidated financial statements effective December 1, 2010. The aggregate fair value less cost to sell exceeded the related carrying amount of the disposal group and, as a result, no impairment was recognized.
Environmental Remediation
The Refinery accrues environmental remediation costs for work where an assessment has indicated that cleanup costs are probable and reasonably estimable. Such accruals are undiscounted and are based on currently available information, estimated timing of remedial actions and related inflation assumptions, existing technology and presently enacted laws and regulations. If a range of probable environmental cleanup costs exists, the minimum of the range is accrued unless some other point in the range is more likely in which case the most likely amount in the range is accrued.
Maintenance Shutdowns
Maintenance and repair costs in excess of $500 thousand incurred in connection with major maintenance shutdowns are capitalized when incurred and amortized over the period benefited by the maintenance activities.
Asset Retirement Obligations
The Refinery establishes accruals for the fair value of conditional asset retirement obligations (i.e., legal obligations to perform asset retirement activities in which the timing and/or method of settlement are conditional on a future event that may or may not be within the control of the entity) if the fair value can be reasonably estimated. The Refinery has additional legal asset retirement obligations for which it is not possible to estimate when such obligations will be settled. Consequently, the retirement obligations for these assets cannot be measured at this time.
2. Related Party Transactions
Cash Management
The Refinery is part of Sunoco’s centralized cash management system whereby all cash receipts are transferred to, and all cash disbursements are funded by, Sunoco through the net parent investment account. There are no interest charges or other fees attributable to this activity.
Sales to Related Parties
The Refinery sells finished refined products and unfinished product streams to affiliated refineries and the marketing business of Sunoco. The Refinery also sells chemical products to Sun Petrochemicals Company, an unconsolidated marketing joint venture between Sunoco, Inc. (R&M) and Suncor, Inc.
Crude Oil and Refined Product Purchases
The Refinery purchases all of its crude oil and refined products (purchased for sale or use as feedstocks) from Sunoco. Crude oil purchases for the years 2010 and 2009 amounted to $4,220,687 and $2,696,754
F-65
Table of Contents
TOLEDO REFINERY
NOTES TO THE STATEMENT OF ASSETS ACQUIRED AND LIABILITIES ASSUMED AND
THE RELATED STATEMENTS OF REVENUES AND DIRECT EXPENSES—(Continued)
thousand, respectively. Refined product purchases for the years 2010 and 2009, including purchases of product refined by Sunoco, amounted to $524,322 and $814,552 thousand, respectively. These expenses are included in cost of products sold in the statements of revenues and direct expenses. Crude oil and refined product acquisition costs are adjusted to reflect actual increases or decreases in crude oil and refined product inventory quantities for the Refinery, which are valued based on the changes in Sunoco’s LIFO inventory layers during each respective year.
Transportation and Terminalling Expenses
In 2002, Sunoco entered into a pipelines and terminals storage and throughput agreement and various other agreements with Sunoco Logistics Partners L.P., a master limited partnership (“Sunoco Logistics”). Sunoco had a 31% interest, including a 2% interest as the sole general partner, at December 31, 2010. Under these agreements, Sunoco Logistics charges fees for services provided that, in Sunoco management’s opinion, are comparable to those charged in arm’s-length, third-party transactions.
All crude oil is received into the Refinery via pipelines owned and operated by Sunoco Logistics. Crude oil transportation expenses are included in the total crude oil costs in the amounts paid to Sunoco as described above. Charges to the Refinery for services provided by Sunoco Logistics related to terminalling services for 2010 and 2009 amounted to $5,803 and $6,358 thousand, respectively. These expenses are included in cost of products sold in the statements of revenues and direct expenses.
Employee Costs and Other Allocated Expenses
Employees who either work at the Refinery or work primarily to support the Refinery participate in certain Sunoco incentive compensation and employee benefit plans. These include performance-based compensation plans, non-contributory defined benefit retirement plans, defined contribution 401(k) plans, employee and retiree medical, dental and life insurance plans and other such benefits. The Refinery’s share of allocated Sunoco incentive compensation and employee benefit plan expenses for these employees amounted to $11,644 and $17,119 thousand in 2010 and 2009, respectively. Such expenses are primarily allocated by payroll costs. These expenses are reflected in cost of products sold in the statements of revenues and direct expenses.
Costs and expenses in the statements of revenues and direct expenses include costs allocated by Sunoco to the Refinery for the years 2010 and 2009 totaling $33,734 and $30,880 thousand, respectively. These expenses include costs of centralized refining functions including crude acquisition, product distribution and optimization, as well as corporate functions used to support Sunoco’s refining operations, including legal, accounting, treasury, engineering, information technology, insurance and other corporate services. Such charges by Sunoco, if not separately determinable, are primarily allocated to each of Sunoco’s refineries based on the proportional crude run capacity at each refinery.
3. Provision for Asset Write-Downs and Other Matters
In 2009, Sunoco management implemented a business improvement initiative to reduce costs and improve business processes. In connection therewith, the Refinery recorded a $7,197 thousand provision for pension and postretirement settlement and curtailment losses, employee terminations and other related costs. In 2010, the Refinery recorded an additional $3,578 thousand provision primarily for pension settlement losses.
During 2009, the Refinery also recorded a $10,667 thousand provision in connection with Sunoco’s decision to discontinue certain capital projects.
F-66
Table of Contents
TOLEDO REFINERY
NOTES TO THE STATEMENT OF ASSETS ACQUIRED AND LIABILITIES ASSUMED AND
THE RELATED STATEMENTS OF REVENUES AND DIRECT EXPENSES—(Continued)
4. Inventories
The components of inventories were as follows (in thousands of dollars):
| December 31, | ||||
| 2010 | ||||
| Crude oil |
$ | 37,051 | ||
| Petroleum products |
12,061 | |||
| Materials, supplies and other |
11,778 | |||
|
|
|
|||
| $ | 60,890 | |||
|
|
|
|||
The current replacement cost of all inventories valued at LIFO exceeded their carrying value by $650,549 thousand at December 31, 2010. Average crude oil acquisition costs were $81 and $63 per barrel for the years ended December 31, 2010 and 2009, respectively. The increase (decrease) in crude oil inventory quantities were 433 and (811) thousand barrels for the years ended December 31, 2010 and 2009, which were valued at the cost of Sunoco’s consolidated LIFO crude oil inventory change of $34 per barrel for each of 2010 and 2009. If the cost of the crude oil inventory change had been equal to the average crude oil acquisition costs for the years ended December 31, 2010 and 2009, cost of products sold would have increased (decreased) by ($20,351) and $23,519 thousand, respectively. Average third party refined products acquisition costs were $89 and $71 per barrel for the years ended December 31, 2010 and 2009, respectively. The increase (decrease) in refined products inventory quantities were (59) and 66 thousand barrels for the years ended December 31, 2010 and 2009, which were valued at the cost of Sunoco’s consolidated LIFO refined products inventory change of $5 and $39 per barrel for the respective years. If the cost of the refined products inventory change had been equal to the average third party refined products acquisition costs for the years ended December 31, 2010 and 2009, cost of products sold would have increased (decreased) by $4,956 and ($2,112) thousand, respectively.
5. Property, Plant and Equipment
The components of property, plant and equipment were as follows (in thousands of dollars):
| December 31, | ||||
| 2010 | ||||
| Land and land improvements |
$ | 2,268 | ||
| Plant, equipment and other |
1,249,569 | |||
| Construction-in-progress |
12,252 | |||
|
|
|
|||
| 1,264,089 | ||||
| Less: Accumulated depreciation and amortization |
(397,461 | ) | ||
|
|
|
|||
| $ | 866,628 | * | ||
|
|
|
|||
| * | Includes unamortized capital maintenance shutdown costs of $56,690 thousand at December 31, 2010. |
F-67
Table of Contents
TOLEDO REFINERY
NOTES TO THE STATEMENT OF ASSETS ACQUIRED AND LIABILITIES ASSUMED AND
THE RELATED STATEMENTS OF REVENUES AND DIRECT EXPENSES—(Continued)
6. Commitments and Contingent Liabilities
Leases and Other Commitments
The Refinery, as lessee, has noncancelable operating leases for a variety of machinery and equipment. Total rental expense for 2010 and 2009 amounted to $971 and $1,817 thousand, respectively.
Sunoco is a party under an agreement which provides for future payments to secure wastewater treatment services at the Refinery.
The fixed and determinable amounts of the obligation under this agreement are as follows (in thousands of dollars):
| Year ending December 31: |
||||
| 2011 |
$ | 4,069 | ||
| 2012 |
4,069 | |||
| 2013 |
4,069 | |||
| 2014 |
4,069 | |||
| 2015 |
4,069 | |||
| 2016 through 2018 |
10,172 | |||
|
|
|
|||
| Total |
30,517 | |||
| Less: Amount representing interest |
(6,696 | ) | ||
|
|
|
|||
| $ | 23,821 | |||
|
|
|
Payments under these agreements, including variable components, totaled $11,512 and $11,710 thousand for the years 2010 and 2009, respectively.
Environmental Remediation Activities
The Refinery is subject to extensive and frequently changing federal, state and local laws and regulations, including, but not limited to, those relating to the discharge of materials into the environment or that otherwise relate to the protection of the environment, waste management and the characteristics and compositions of fuels. As with the industry generally, compliance with existing and anticipated laws and regulations increases the overall cost of operating the Refinery, including remediation, operating costs and capital costs to construct, maintain and upgrade equipment and facilities.
Charges for environmental remediation totaled $268 and $404 thousand in 2010 and 2009, respectively and are included in operating expenses in the statements of revenues and direct expenses.
The Refinery’s expenses for environmental remediation activities reflect management’s estimates of the most likely costs that will be incurred over an extended period to remediate identified conditions for which the costs are both probable and reasonably estimable. Engineering studies, historical experience and other factors are used to identify and evaluate remediation alternatives and their related costs in determining the estimated expenses for environmental remediation activities. Losses attributable to unasserted claims are also reflected in the expenses to the extent they are probable of occurrence and reasonably estimable.
Total future costs for environmental remediation activities identified above will depend upon, among other things, the determination of the extent of the contamination at the Refinery, the timing and nature of required
F-68
Table of Contents
TOLEDO REFINERY
NOTES TO THE STATEMENT OF ASSETS ACQUIRED AND LIABILITIES ASSUMED AND
THE RELATED STATEMENTS OF REVENUES AND DIRECT EXPENSES—(Continued)
remedial actions, the technology available and needed to meet the various existing legal requirements, the availability of insurance coverage, the nature and extent of future environmental laws and regulations and inflation rates. Management believes it is reasonably possible (i.e., less than probable but greater than remote) that additional environmental remediation losses will be incurred. At December 31, 2010, the aggregate of the estimated additional reasonably possible losses totaled approximately $3,100 thousand. Furthermore, the recognition of additional losses, if and when they were to occur, would likely extend over many years and, therefore, likely would not have a material impact on the Refinery’s financial position.
Under various environmental laws, including the Resource Conservation and Recovery Act (“RCRA”) (which relates to solid and hazardous waste treatment, storage and disposal), the Refinery has initiated corrective remedial action. The Refinery has consistently assumed continued industrial use and a containment/remediation strategy focused on eliminating unacceptable risks to human health or the environment. The remediation expenses reflect that strategy. Expenses include amounts to prevent off-site migration and to contain the impact on the facility property, as well as to address known, discrete areas requiring remediation within the Refinery. Activities include closure of RCRA solid waste management units, recovery of hydrocarbons, handling of impacted soil, mitigation of surface water impacts and prevention of off-site migration.
Conclusion
The Refinery is a party to certain pending and threatened claims. Although the ultimate outcome of these claims cannot be ascertained at this time, it is reasonably possible that some portion of them could be resolved unfavorably. Management believes that these matters could have a significant impact on results of operations for any future quarter or year. However, management does not believe that any expenses which may arise pertaining to such matters would be material in relation to the financial position of the Refinery at December 31, 2010.
7. Subsequent Events
Subsequent events have been evaluated through September 12, 2011, the date the statements were available to be issued.
F-69
Table of Contents
PBF ENERGY COMPANY LLC AND SUBSIDIARIES
CONDENSED CONSOLIDATED BALANCE SHEETS
(UNAUDITED, IN THOUSANDS, EXCEPT UNIT DATA)
| September 30, 2012 | December 31, 2011 | |||||||
| ASSETS | ||||||||
| Current assets | ||||||||
| Cash and cash equivalents |
$ | 170,048 | $ | 50,166 | ||||
| Accounts receivable, net |
496,241 | 316,252 | ||||||
| Inventories |
1,479,728 | 1,516,727 | ||||||
| Prepaid expenses and other current assets |
26,388 | 63,359 | ||||||
|
|
|
|
|
|||||
| Total current assets |
2,172,405 | 1,946,504 | ||||||
| Property, plant and equipment, net |
1,574,712 | 1,513,947 | ||||||
| Deferred charges and other assets, net |
185,390 | 160,658 | ||||||
|
|
|
|
|
|||||
| Total assets |
$ | 3,932,507 | $ | 3,621,109 | ||||
|
|
|
|
|
|||||
| LIABILITIES AND EQUITY |
||||||||
| Current liabilities |
||||||||
| Accounts payable |
$ | 246,914 | $ | 286,067 | ||||
| Accrued expenses |
1,082,143 | 1,180,812 | ||||||
| Current portion of long-term debt |
— | 4,014 | ||||||
| Deferred revenue |
202,953 | 189,234 | ||||||
|
|
|
|
|
|||||
| Total current liabilities |
1,532,010 | 1,660,127 | ||||||
|
|
|
|
|
|||||
| Economic Development Authority loan |
20,000 | 20,000 | ||||||
| Long-term debt |
712,961 | 780,851 | ||||||
| Other long-term liabilities |
29,949 | 49,213 | ||||||
|
|
|
|
|
|||||
| Total liabilities |
2,294,920 | 2,510,191 | ||||||
|
|
|
|
|
|||||
| Commitments and contingencies Series B Units, no par or stated value, 1,000,000 issued and outstanding as of September 30, 2012 and December 31, 2011 |
4,261 | 3,303 | ||||||
| MEMBERS’ EQUITY |
||||||||
| Series A Units, 92,257,812 issued and outstanding as of September 30, 2012 and December 31, 2011, no par or stated value |
924,840 | 923,841 | ||||||
| Retained earnings |
710,843 | 186,150 | ||||||
| Accumulated other comprehensive loss |
(2,357 | ) | (2,376 | ) | ||||
|
|
|
|
|
|||||
| Total members’ equity |
1,633,326 | 1,107,615 | ||||||
|
|
|
|
|
|||||
| Total liabilities, series B units, and members’ equity |
$ | 3,932,507 | $ | 3,621,109 | ||||
|
|
|
|
|
|||||
See notes to condensed consolidated financial statements
F-70
Table of Contents
PBF ENERGY COMPANY LLC AND SUBSIDIARIES
CONDENSED CONSOLIDATED STATEMENTS OF OPERATIONS
AND COMPREHENSIVE INCOME
(UNAUDITED, IN THOUSANDS)
| Nine Months Ended September 30, | ||||||||
| 2012 | 2011 | |||||||
| Revenues |
$ | 15,188,327 | $ | 10,183,897 | ||||
| Costs and expenses |
||||||||
| Cost of sales, excluding depreciation |
13,871,884 | 9,147,063 | ||||||
| Operating expenses, excluding depreciation |
537,880 | 457,722 | ||||||
| General and administrative expenses |
78,042 | 71,533 | ||||||
| (Gain) on sale of asset |
(2,430 | ) | — | |||||
| Acquisition related expenses |
— | 684 | ||||||
| Depreciation and amortization expense |
67,419 | 35,636 | ||||||
|
|
|
|
|
|||||
| 14,552,795 | 9,712,638 | |||||||
|
|
|
|
|
|||||
| Income from operations |
635,532 | 471,259 | ||||||
| Other income (expense) |
||||||||
| Change in fair value of catalyst lease |
(6,929 | ) | 4,848 | |||||
| Change in fair value of contingent consideration |
(2,076 | ) | (4,829 | ) | ||||
| Interest (expense) income, net |
(86,753 | ) | (44,127 | ) | ||||
|
|
|
|
|
|||||
| Net income |
$ | 539,774 | $ | 427,151 | ||||
|
|
|
|
|
|||||
| Consolidated statements of comprehensive income |
||||||||
| Net income |
$ | 539,774 | $ | 427,151 | ||||
| Other comprehensive income |
||||||||
| Unrealized gain on available for sale securities |
2 | 11 | ||||||
| Amortization of defined benefit plans unrecognized net gain |
17 | — | ||||||
|
|
|
|
|
|||||
| Total other comprehensive income |
19 | 11 | ||||||
|
|
|
|
|
|||||
| Comprehensive income |
$ | 539,793 | $ | 427,162 | ||||
|
|
|
|
|
|||||
See notes to condensed consolidated financial statements.
F-71
Table of Contents
PBF ENERGY COMPANY LLC AND SUBSIDIARIES
CONDENSED CONSOLIDATED STATEMENTS OF CHANGES IN MEMBERS’ EQUITY
(UNAUDITED, IN THOUSANDS, EXCEPT UNIT DATA)
| Series A Units |
Series A | Accumulated Other Comprehensive Loss |
Retained Earnings (Accumulated Deficit) |
Total Members’ Equity |
||||||||||||||||
| Balance December 31, 2010 |
51,393,114 | $ | 514,309 | $ | (1,049 | ) | $ | (56,521 | ) | $ | 456,739 | |||||||||
| Member capital contributions |
40,864,698 | 408,397 | — | — | 408,397 | |||||||||||||||
| Stock based compensation |
— | 913 | — | — | 913 | |||||||||||||||
| Net income |
— | — | — | 427,151 | 427,151 | |||||||||||||||
| Unrealized gain on marketable securities |
— | — | 11 | — | 11 | |||||||||||||||
|
|
|
|
|
|
|
|
|
|
|
|||||||||||
| Balance at September 30, 2011 |
92,257,812 | $ | 923,619 | $ | (1,038 | ) | $ | 370,630 | $ | 1,293,211 | ||||||||||
|
|
|
|
|
|
|
|
|
|
|
|||||||||||
| Balance at December 31, 2011 |
92,257,812 | $ | 923,841 | $ | (2,376 | ) | $ | 186,150 | $ | 1,107,615 | ||||||||||
| Exercise of Series A options |
— | 250 | — | — | 250 | |||||||||||||||
| Stock based compensation |
— | 749 | — | — | 749 | |||||||||||||||
| Member distribution |
— | — | — | (15,081 | ) | (15,081 | ) | |||||||||||||
| Net income |
— | — | — | 539,774 | 539,774 | |||||||||||||||
| Unrealized gain on marketable securities |
— | — | 2 | — | 2 | |||||||||||||||
| Defined benefit plan unrecognized net gain |
— | — | 17 | — | 17 | |||||||||||||||
|
|
|
|
|
|
|
|
|
|
|
|||||||||||
| Balance at September 30, 2012 |
92,257,812 | $ | 924,840 | $ | (2,357 | ) | $ | 710,843 | $ | 1,633,326 | ||||||||||
|
|
|
|
|
|
|
|
|
|
|
|||||||||||
See notes to condensed consolidated financial statements.
F-72
Table of Contents
PBF ENERGY COMPANY LLC AND SUBSIDIARIES
CONDENSED CONSOLIDATED STATEMENTS OF CASH FLOWS
(UNAUDITED, IN THOUSANDS)
| Nine Months Ended September 30, | ||||||||
| 2012 | 2011 | |||||||
| Cash flows from operating activities |
||||||||
| Net income |
$ | 539,774 | $ | 427,151 | ||||
| Adjustments to reconcile net income to net cash from operating activities: |
||||||||
| Depreciation and amortization |
71,144 | 37,822 | ||||||
| Stock based compensation |
1,707 | 1,911 | ||||||
| Change in fair value of catalyst leases |
6,929 | (4,848 | ) | |||||
| Change in fair value of contingent consideration |
2,076 | 4,829 | ||||||
| Non-cash change in inventory repurchase obligations |
5,126 | (4,932 | ) | |||||
| Write-off of unamortized deferred financing fees |
4,391 | — | ||||||
| Gain on sale of assets |
(2,430 | ) | — | |||||
| Pension and other post retirement benefit costs |
9,513 | 7,156 | ||||||
| Changes in operating assets and liabilities, net of effects of acquisitions |
||||||||
| Accounts receivable |
(179,989 | ) | (257,381 | ) | ||||
| Inventories |
85,179 | (647,174 | ) | |||||
| Other current assets |
36,971 | (14,316 | ) | |||||
| Accounts payable |
(39,153 | ) | 410,334 | |||||
| Accrued expenses |
(56,404 | ) | 397,775 | |||||
| Deferred revenue |
13,719 | 109,307 | ||||||
| Other assets and liabilities |
(29,731 | ) | — | |||||
|
|
|
|
|
|||||
| Net cash from operating activities |
468,822 | 467,634 | ||||||
|
|
|
|
|
|||||
| Cash flows from investing activities |
||||||||
| Acquisition of Toledo refinery, net of cash received for sale of assets |
— | (168,156 | ) | |||||
| Expenditures for property, plant, and equipment |
(102,004 | ) | (447,063 | ) | ||||
| Expenditures for refinery turnaround costs |
(27,501 | ) | (56,971 | ) | ||||
| Expenditures for other assets |
(7,731 | ) | (23,256 | ) | ||||
| Proceeds from sale of assets |
3,381 | 4,700 | ||||||
|
|
|
|
|
|||||
| Net cash used in investing activities |
(133,855 | ) | (690,746 | ) | ||||
|
|
|
|
|
|||||
| Cash flows from financing activities |
||||||||
| Proceeds from member contributions |
— | 408,397 | ||||||
| Proceeds from exercise of Series A options |
250 | — | ||||||
| Proceeds from senior secured notes |
665,806 | — | ||||||
| Proceeds from long-term debt |
430,000 | 343,697 | ||||||
| Proceeds from catalyst lease |
9,452 | 18,624 | ||||||
| Distribution to members |
(15,081 | ) | — | |||||
| Repayment of seller note for inventory |
— | (299,645 | ) | |||||
| Repayments of long-term debt |
(1,184,597 | ) | (169,282 | ) | ||||
| Payment of contingent consideration related to acquisition of Toledo refinery |
(103,642 | ) | — | |||||
| Deferred financing costs and other |
(17,273 | ) | (9,529 | ) | ||||
|
|
|
|
|
|||||
| Net cash provided by (used in) financing activities |
(215,085 | ) | 292,262 | |||||
|
|
|
|
|
|||||
| Net increase in cash and cash equivalents |
119,882 | 69,150 | ||||||
| Cash and cash equivalents, beginning of period |
50,166 | 155,457 | ||||||
|
|
|
|
|
|||||
| Cash and cash equivalents, end of period |
$ | 170,048 | $ | 224,607 | ||||
|
|
|
|
|
|||||
(Continued)
See notes to condensed consolidated financial statements.
F-73
Table of Contents
PBF ENERGY COMPANY LLC AND SUBSIDIARIES
CONDENSED CONSOLIDATED STATEMENTS OF CASH FLOWS
(UNAUDITED, IN THOUSANDS)
(Continued)
| Nine Months Ended September 30, | ||||||||
| 2012 | 2011 | |||||||
| Supplemental cash flow disclosures |
||||||||
| Non-cash activities: |
||||||||
| Promissory note issued for Toledo refinery acquisition |
$ | — | $ | 200,000 | ||||
| Seller note issued for acquisition of inventory |
— | 299,645 | ||||||
| Fair value of Toledo refinery contingent consideration |
— | 117,017 | ||||||
| Accrued construction in progress |
11,710 | 6,090 | ||||||
| Non-cash impact of inventory supply and offtake agreements on inventory and accrued expenses |
48,180 | 359,746 | ||||||
See notes to condensed consolidated financial statements.
F-74
Table of Contents
PBF ENERGY COMPANY LLC AND SUBSIDIARIES
NOTES TO CONDENSED CONSOLIDATED FINANCIAL STATEMENTS
(UNAUDITED, AMOUNTS IN THOUSANDS, EXCEPT BARREL, UNIT, WARRANT AND
OPTION DATA)
1—DESCRIPTION OF BUSINESS AND BASIS OF PRESENTATION
PBF Energy Company LLC, a Delaware limited liability company, together with its consolidated subsidiaries (the “Company” or “PBF”), owns and operates oil refineries and related facilities in North America. Delaware City Refining Company LLC, Delaware Pipeline Company LLC, PBF Power Marketing LLC, Paulsboro Refining Company LLC, Paulsboro Natural Gas Pipeline Company LLC and Toledo Refining Company LLC are PBF’s principal operating subsidiaries and are all wholly-owned subsidiaries of PBF Holding Company LLC (“Holdings”), which is a wholly-owned subsidiary of PBF.
All of the Company’s operations are in the United States. The Company’s three oil refineries are all engaged in the refining of crude oil and other feedstocks into petroleum products, and have been aggregated to form one reportable segment. To generate earnings and cash flows from operations, the Company is primarily dependent upon processing crude oil and selling refined petroleum products at margins sufficient to cover fixed and variable costs and other expenses. Crude oil and refined petroleum products are commodities and factors largely out of the Company’s control can cause prices to vary over time. The potential margin volatility can have a material effect on the Company’s financial position, earnings and cash flow.
The accompanying unaudited condensed consolidated financial statements include the accounts of PBF and its wholly-owned subsidiaries. All intercompany accounts and transactions have been eliminated in consolidation. These unaudited condensed consolidated financial statements of the Company have been prepared in accordance with U.S. generally accepted accounting principles (“GAAP”) for interim financial information. Accordingly, they do not include all of the information and notes required by U.S. GAAP for complete financial statements. In the opinion of management, all adjustments (consisting of normal recurring accruals) considered necessary for a fair presentation of the financial position and the results of operations and cash flows for the periods presented have been included. These interim condensed consolidated financial statements should be read in conjunction with the audited combined and consolidated financial statements and notes thereto for the year ended December 31, 2011. The results of operations for the nine months ended September 30, 2012 are not indicative of the results to be expected for the full year.
2—RECENTLY ISSUED ACCOUNTING PRONOUNCEMENTS
In May 2011, the Financial Accounting Standards Board (“FASB”) issued ASU 2011-04 to clarify guidance relating to fair value measurements. The amended guidance also expands the disclosure requirements for entities’ fair value measurements, particularly those relating to measurements based upon significant unobservable inputs. The Company adopted the amended fair value measurement guidance on January 1, 2012 resulting in additional disclosures.
In June 2011, the FASB issued ASU No. 2011-05, which changes the required presentation of other comprehensive income. Under the new guidelines, entities are required to present net income and other comprehensive income, along with the components of net income and other comprehensive income, in either one continuous statement of comprehensive income or in two separate but consecutive statements of net income and comprehensive income. The accounting standards update eliminates the option of presenting the components of other comprehensive income within the statement of changes in stockholders’ equity. For the nine month periods ended September 30, 2012, the Company presented the components of net income and total comprehensive income in its condensed consolidated statements of operations and comprehensive income.
F-75
Table of Contents
PBF ENERGY COMPANY LLC AND SUBSIDIARIES
NOTES TO CONDENSED CONSOLIDATED FINANCIAL STATEMENTS
(UNAUDITED, AMOUNTS IN THOUSANDS, EXCEPT BARREL, UNIT, WARRANT AND
OPTION DATA)
3—ACQUISITIONS
Toledo Acquisition
On March 1, 2011, a subsidiary of the Company completed the acquisition of the Toledo refinery in Ohio from Sunoco, Inc. (R&M) (“Sunoco”). The Toledo refinery has a crude oil throughput capacity of 170,000 barrels per day. The purchase price for the refinery was $400,000, subject to certain adjustments, and was comprised of $200,000 in cash and a $200,000 promissory note provided by Sunoco. The note was repaid in full in February 2012. The terms of the transaction also include participation payments beginning in the year ending December 31, 2011 through the year ending December 31, 2016 not to exceed $125,000 in the aggregate. Participation payments are based on 25% of the purchased assets’ earnings before interest, taxes, depreciation and amortization, as defined in the agreement (“EBITDA”) in excess of an annual threshold EBITDA of $125,000 (prorated for 2011 and 2016). Each participation payment is due no later than one hundred and twenty days after the close of the respective calendar year end for the years 2011 through 2016. The Company paid $103,643 to Sunoco in April 2012 related to the amount of contingent consideration earned in 2011.
The Company purchased certain finished and intermediate products for approximately $299,645 with the proceeds from a note provided by Sunoco (the “Toledo Inventory Note Payable”). The note had an interest rate at the lower of LIBOR plus 5.5%, or 7.5% and was repaid on May 31, 2011. The Company also purchased crude oil inventory for $338,395, which it concurrently sold to Morgan Stanley Capital Group Inc. (“MSCG”) for its market value of $369,999. The net cash received from this transaction was recorded as a reduction in the total purchase price.
The Toledo acquisition was accounted for as a business combination. The estimated purchase price of $784,818 includes the estimated fair value of future participation payments (contingent consideration). The fair value of the contingent consideration was estimated using a discounted cash flow analysis, a Level 3 measurement, as more fully described at Note 11. The following table summarizes the amounts recognized for assets acquired and liabilities assumed as of the acquisition date.
The total purchase price and the estimated fair values of the assets and liabilities at the acquisition date were as follows:
| Purchase Price |
||||
| Net cash |
$ | 168,156 | ||
| Seller promissory note |
200,000 | |||
| Seller note for inventory |
299,645 | |||
| Estimated fair value of contingent consideration |
117,017 | |||
|
|
|
|||
| $ | 784,818 | |||
|
|
|
|||
| Fair Value Allocation |
||||
| Current assets |
$ | 305,645 | ||
| Land |
8,065 | |||
| Property, plant and equipment |
452,084 | |||
| Other assets |
24,640 | |||
| Current liabilities |
(5,616 | ) | ||
|
|
|
|||
| $ | 784,818 | |||
|
|
|
|||
F-76
Table of Contents
PBF ENERGY COMPANY LLC AND SUBSIDIARIES
NOTES TO CONDENSED CONSOLIDATED FINANCIAL STATEMENTS
(UNAUDITED, AMOUNTS IN THOUSANDS, EXCEPT BARREL, UNIT, WARRANT AND
OPTION DATA)
3—ACQUISITIONS (Continued)
Toledo Acquisition (Continued)
The Company’s condensed consolidated financial statements for the nine months ended September 30, 2011 include the results of operations of the Toledo refinery since March 1, 2011. The actual results for the Toledo refinery for the period from March 1, 2011 to September 30, 2011, are shown below. The revenues and net income of the Company assuming the acquisition had occurred on January 1, 2011, are shown below on a pro forma basis. The pro forma information does not purport to present what the Company’s actual results would have been had the acquisition occurred on January 1, 2011, nor is the financial information indicative of the results of future operations. The unaudited pro forma financial information includes the depreciation and amortization expense related to the acquisition and interest expense associated with the Toledo acquisition financing.
| Revenues | Net Income | |||||||
| Actual results for March 1, 2011 to September 30, 2011 |
$ | 4,402,186 | $ | 461,886 | ||||
| Supplemental pro forma for January 1, 2011 to September 30, 2011 |
$ | 11,185,088 | $ | 512,622 | ||||
4—INVENTORIES
Inventories consisted of the following:
| September 30, 2012 | ||||||||||||
| Titled Inventory |
Inventory Supply and Offtake Arrangements |
Total | ||||||||||
| Crude oil and feedstocks |
$ | 288,282 | $ | 363,715 | $ | 651,997 | ||||||
| Refined products and blendstocks |
399,411 | 397,439 | 796,850 | |||||||||
| Warehouse stock and other |
30,881 | — | 30,881 | |||||||||
|
|
|
|
|
|
|
|||||||
| $ | 718,574 | $ | 761,154 | $ | 1,479,728 | |||||||
|
|
|
|
|
|
|
|||||||
| December 31, 2011 | ||||||||||||
| Titled Inventory |
Inventory Supply and Offtake Arrangements |
Total | ||||||||||
| Crude oil and feedstocks |
$ | 369,377 | $ | 317,652 | $ | 687,029 | ||||||
| Refined products and blendstocks |
384,902 | 419,613 | 804,515 | |||||||||
| Warehouse stock and other |
25,183 | — | 25,183 | |||||||||
|
|
|
|
|
|
|
|||||||
| $ | 779,462 | $ | 737,265 | $ | 1,516,727 | |||||||
|
|
|
|
|
|
|
|||||||
Inventory under inventory supply and offtake arrangements includes crude oil stored at the Company’s Paulsboro and Delaware City refineries’ storage facilities that the Company will purchase as it is consumed in connection with its crude supply agreements; feedstocks and blendstocks sold to counterparties that the Company will repurchase for further blending into finished products; lube products sold to a counterparty that the Company will repurchase; and light finished products sold to a counterparty in connection with the offtake agreement and stored in the Paulsboro and Delaware City refineries’ storage facilities pending shipment by the counterparty. On September 17, 2012, the Company gave notice to Statoil Marketing and Trading (US) Inc. (“Statoil”), the counterparty to its crude supply agreements for its Paulsboro and Delaware City refineries, that it would terminate the crude supply agreement for its Paulsboro refinery effective March 31, 2013.
F-77
Table of Contents
PBF ENERGY COMPANY LLC AND SUBSIDIARIES
NOTES TO CONDENSED CONSOLIDATED FINANCIAL STATEMENTS
(UNAUDITED, AMOUNTS IN THOUSANDS, EXCEPT BARREL, UNIT, WARRANT AND
OPTION DATA)
4—INVENTORIES (Continued)
At September 30, 2012 and December 31, 2011, the replacement value of inventories exceeded the LIFO carrying value by approximately $158,757 and $115,624, respectively.
5—DEFERRED CHARGES AND OTHER ASSETS, NET
Deferred charges and other assets, net consisted of the following:
| September 30, 2012 |
December 31, 2011 |
|||||||
| Deferred turnaround costs, net |
$ | 72,224 | $ | 56,338 | ||||
| Catalyst |
67,585 | 68,201 | ||||||
| Deferred financing costs, net |
23,668 | 13,980 | ||||||
| Restricted cash |
12,113 | 12,104 | ||||||
| Linefill |
8,042 | 8,042 | ||||||
| Intangible assets, net |
1,297 | 1,703 | ||||||
| Other |
461 | 290 | ||||||
|
|
|
|
|
|||||
| $ | 185,390 | $ | 160,658 | |||||
|
|
|
|
|
|||||
6—ACCRUED EXPENSES
Accrued expenses consisted of the following:
| September 30, 2012 |
December 31, 2011 |
|||||||
| Inventory supply and offtake arrangements |
$ | 685,038 | $ | 641,588 | ||||
| Inventory-related accruals |
205,439 | 203,636 | ||||||
| Accrued salaries and benefits |
35,997 | 48,300 | ||||||
| Excise and sales tax payable |
26,371 | 36,635 | ||||||
| Customer deposits |
26,276 | 59,017 | ||||||
| Accrued transportation costs |
21,356 | 18,110 | ||||||
| Fair value of contingent consideration for refinery acquisition |
20,665 | 100,380 | ||||||
| Accrued utilities |
13,360 | 17,615 | ||||||
| Accrued construction in progress |
11,710 | 5,909 | ||||||
| Accrued interest |
9,030 | 1,894 | ||||||
| Renewable energy credit obligation |
3,528 | 7,092 | ||||||
| Other |
23,373 | 40,636 | ||||||
|
|
|
|
|
|||||
| $ | 1,082,143 | $ | 1,180,812 | |||||
|
|
|
|
|
|||||
The Company has the obligation to repurchase certain intermediates and lube products under the products offtake agreements with MSCG that are held in the Company’s refinery storage tanks. A liability included in Inventory supply and offtake arrangements is recorded at market price for the volumes held in storage consistent with the terms of the offtake agreements with any change in the market price being recorded in costs of sales. The liability represents the amount the Company expects to pay to repurchase the volumes held in storage. The Company recorded non-cash charges of $17,309 and $4,672 related to this liability in the nine months ended September 30, 2012 and 2011, respectively.
F-78
Table of Contents
PBF ENERGY COMPANY LLC AND SUBSIDIARIES
NOTES TO CONDENSED CONSOLIDATED FINANCIAL STATEMENTS
(UNAUDITED, AMOUNTS IN THOUSANDS, EXCEPT BARREL, UNIT, WARRANT AND
OPTION DATA)
7—CREDIT FACILITY AND LONG-TERM DEBT
Letter of Credit Facility
The Company and certain of its subsidiaries maintain a short-term letter of credit facility, which was renewed and expanded in April 2012, under which the Company can obtain letters of credit of up to $750,000 consisting of a committed amount of $500,000 and an uncommitted amount of $250,000 to support certain of the Company’s crude oil purchases. The Company is charged letter of credit issuance fees on each letter of credit, plus a fee on the aggregate unused portion of the committed letter of credit facility. At September 30, 2012 and December 31, 2011, the Company had $248,200 and $241,500 of letters of credit issued under the letter of credit facility, respectively.
Senior Secured Notes
On February 9, 2012, the Company completed the offering of $675,500 aggregate principal amount of 8.25% Senior Secured Notes due 2020. The net proceeds, after deducting the original issue discount, the initial purchasers’ discounts and commissions, and the fees and expenses of the offering, were used to repay all of the outstanding indebtedness plus accrued interest owed under the Toledo Promissory Note, the Paulsboro Promissory Note, and the Term Loan, as well as to reduce the outstanding balance of our Revolving Loan. The Company’s Executive Chairman of the Board of Directors, and certain of his affiliates and family members, and certain of our other executives, purchased $25,500 aggregate principal amount of these Senior Secured Notes. At September 30, 2012, the fair value of the Senior Secured Notes, categorized as a level 2 measurement, approximates $719,488.
The Senior Secured Notes are secured on a first-priority basis by substantially all of the present and future assets of Holdings and its subsidiaries (other than assets securing the Revolving Loan). As of September 30, 2012, payment of the Senior Secured Notes is jointly and severally guaranteed by all of the Company’s subsidiaries. The Company has optional redemption rights to repurchase all or a portion of the Senior Secured Notes at varying prices no less than 100% of the principal amounts of the notes plus accrued and unpaid interest. The holders of the Senior Secured Notes have repurchase options exercisable only upon a change in control, certain asset sale transactions, or in event of a default as defined in the indenture agreement. In addition, the Senior Secured Notes contain covenant restrictions limiting certain types of additional debt, equity issuances, and payments. The Company is in compliance with the covenants as of September 30, 2012.
Revolving Loan
In September 2012, the Company amended its asset based revolving credit agreement (“Revolving Loan”) to a maximum availability of $965,000. The Revolving Loan matures on May 31, 2016. Advances under the Revolving Loan cannot exceed the lesser of $965,000 or the Borrowing Base, as defined in the agreement. The Revolving Loan can be prepaid, without penalty, at any time. Interest on the Revolving Loan is payable quarterly in arrears, at the option of the Company, either at the Alternate Base Rate plus the Applicable Margin, or at the Adjusted LIBOR Rate plus the Applicable Margin, all as defined in the agreement. The Applicable Margin ranges from 1.00% to 1.50% for Alternate Base Rate Loans and from 2.00% to 2.50% for Adjusted LIBOR Rate Loans, depending on the Average Daily Excess Availability. In addition, the Company is required to pay a Commitment Fee which ranges from 0.375% to 0.5% depending on the unused amount of the commitment. The Company is required to pay a LC Participation Fee on each outstanding letter of credit issued under the Revolving Loan equal to the Applicable Margin applied to Adjusted LIBOR Rate Loans, plus a Fronting Fee equal to 0.125%.
F-79
Table of Contents
PBF ENERGY COMPANY LLC AND SUBSIDIARIES
NOTES TO CONDENSED CONSOLIDATED FINANCIAL STATEMENTS
(UNAUDITED, AMOUNTS IN THOUSANDS, EXCEPT BARREL, UNIT, WARRANT AND
OPTION DATA)
7—CREDIT FACILITY AND LONG-TERM DEBT (Continued)
Revolving Loan (Continued)
The Revolving Loan has a financial covenant which requires that at any time Excess Availability, as defined in the agreement, is less than the greater of (i) 17.5% of the lesser of the Borrowing Base and the aggregate Revolving Commitments of the Lenders, or (ii) $35,000, the Company will not permit the Consolidated Fixed Charge Coverage Ratio, determined as of the last day of the most recently completed quarter, to be less than 1.1 to 1.0. The Company was in compliance with this covenant as of September 30, 2012.
At September 30, 2012, the Company had no outstanding loans and standby letters of credit of $35,952 issued under the Revolving Loan. At December 31, 2011, the Company had outstanding loans of $270,000 and standby letters of credit of $39,832 issued under the Revolving Loan.
Delaware City Construction Financing
In October 2010, the Company entered into a project management and financing agreement for a capital project at the Delaware City refinery. On August 5, 2011 the Delaware City construction advances in the amount of $20,000 were converted to a term financing payable in equal monthly installments of $530 over a period of sixty months beginning September 1, 2011 (“Construction Financing”). On August 31, 2012, the Company repaid all outstanding indebtness plus accrued interest owed on the Construction Financing. The Company recorded a loss of $2,797 in interest expense for the early retirement of debt for the nine months ended September 30, 2012.
Catalyst Leases
The Company has entered into agreements at each of its refineries whereby the Company sold certain of its catalyst precious metals to large financial institutions and then leased them back. The catalyst is required to be repurchased by the Company at market value at lease termination. The Company treated these transactions as financing arrangements, and the lease payments are recorded as interest expense over the agreements’ terms. The Company has elected the fair value option for accounting for its catalyst repurchase obligations as the Company’s liability is directly impacted by the change in value of the underlying catalyst. The fair value of these repurchase obligations as reflected in the table below is measured using Level 2 inputs.
The Paulsboro catalyst lease was entered into effective January 6, 2012 and has a one year term. Proceeds from the lease of $9,453 were used to repay a portion of the Paulsboro Promissory Note. The annual lease fee is $267, payable at maturity. The Paulsboro catalyst lease is included in Long-term debt as of September 30, 2012 as the Company has the ability and intent to refinance this debt through proceeds from a long-term obligation if the catalyst lease is not renewed at maturity.
The Toledo catalyst lease was entered into effective July 1, 2011 and has a three year term. Proceeds from the lease of $18,345, net of a facility fee of $279, were used to repay a portion of the Toledo Promissory Note. The lease fee for the first one year period was $997. The lease fee is payable quarterly and will be reset annually based on current market conditions. The lease fee for the second one year period is $967.
The Delaware City catalyst lease was entered into in October 2010 and has a three year term. Proceeds from the lease were $17,474, net of $266 in facility fees. The lease fee for the first one year period was $1,076. The lease fee is payable quarterly and resets annually based on current market conditions. The lease fee for the second one year period beginning in October 2011 is $946.
F-80
Table of Contents
PBF ENERGY COMPANY LLC AND SUBSIDIARIES
NOTES TO CONDENSED CONSOLIDATED FINANCIAL STATEMENTS
(UNAUDITED, AMOUNTS IN THOUSANDS, EXCEPT BARREL, UNIT, WARRANT AND
OPTION DATA)
7—CREDIT FACILITY AND LONG-TERM DEBT (Continued)
Long-term debt outstanding consisted of the following:
| September 30, 2012 |
December 31, 2011 |
|||||||
| Senior Secured Notes |
$ | 666,314 | $ | — | ||||
| Revolving Loan |
— | 270,000 | ||||||
| Toledo Promissory Note |
— | 181,655 | ||||||
| Paulsboro Promissory Note |
— | 160,000 | ||||||
| Term Loan |
— | 123,750 | ||||||
| Catalyst leases |
46,647 | 30,266 | ||||||
| Construction Financing |
— | 19,194 | ||||||
|
|
|
|
|
|||||
| 712,961 | 784,865 | |||||||
| Less—Current maturities |
— | (4,014 | ) | |||||
|
|
|
|
|
|||||
| Long-term debt |
$ | 712,961 | $ | 780,851 | ||||
|
|
|
|
|
|||||
8—OTHER LONG-TERM LIABILITIES
Other long-term liabilities consisted of the following:
| September 30, 2012 |
December 31, 2011 |
|||||||
| Noncurrent portion of fair value of contingent consideration for refinery acquisition |
$ | — | $ | 21,852 | ||||
| Environmental liabilities |
7,725 | 10,398 | ||||||
| Post retiree medical plan |
9,683 | 8,912 | ||||||
| Defined benefit pension plan liabilities |
11,276 | 6,651 | ||||||
| Asset retirement obligation |
265 | 400 | ||||||
| Other |
1,000 | 1,000 | ||||||
|
|
|
|
|
|||||
| $ | 29,949 | $ | 49,213 | |||||
|
|
|
|
|
|||||
The fair value of contingent consideration for refinery acquisition was reclassified to current liabilities as the obligation is expected to be settled within the next twelve months.
9—COMMITMENTS AND CONTINGENCIES
Remediation Liabilities
The Company’s refineries are subject to extensive and frequently changing federal, state and local laws and regulations, including, but not limited to, those relating to the discharge of materials into the environment or that otherwise relate to the protection of the environment, waste management and the characteristics and the compositions of fuels. Compliance with existing and anticipated laws and regulations can increase the overall cost of operating the refineries, including remediation, operating costs and capital costs to construct, maintain and upgrade equipment and facilities.
F-81
Table of Contents
PBF ENERGY COMPANY LLC AND SUBSIDIARIES
NOTES TO CONDENSED CONSOLIDATED FINANCIAL STATEMENTS
(UNAUDITED, AMOUNTS IN THOUSANDS, EXCEPT BARREL, UNIT, WARRANT AND
OPTION DATA)
9—COMMITMENTS AND CONTINGENCIES (Continued)
Remediation Liabilities (Continued)
In connection with the Paulsboro acquisition, the Company assumed certain environmental remediation obligations. The environmental liability of $10,090 recorded as of September 30, 2012 ($12,086 as of December 31, 2011) represents the present value of expected future costs discounted at a rate of 8%. The current portion of the environmental liability is recorded in accrued expenses and the non-current portion is recorded in other long-term liabilities. A trust fund related to this liability in the amount of $12,113 and $12,104, acquired in the Paulsboro acquisition, is recorded as restricted cash in deferred charges and other assets, net as of September 30, 2012 and December 31, 2011, respectively.
In connection with the acquisition of the Delaware City assets, Valero remains responsible for certain pre-acquisition environmental obligations up to $20,000 and the predecessor to Valero in ownership of the refinery retains other historical obligations.
In connection with the Delaware City assets and Paulsboro refinery acquisitions, the Company and Valero purchased ten year, $75,000 environmental insurance policies to insure against unknown environmental liabilities at each site. In connection with the Toledo refinery acquisition, Sunoco remains responsible for environmental remediation for conditions that existed on the closing date for twenty years from March 1, 2011.
In 2010, New York State adopted a Low-Sulfur Heating Oil mandate that beginning July 1, 2012 requires all heating oil sold in New York State to contain no more than 15 PPM sulfur. Not all of the heating oil we produce meets this specification. In addition, on June 1, 2012, the Environmental Protection Agency issued final amendments to the New Source Performance Standards (“NSPS”) for petroleum refineries, including standards for emissions of nitrogen oxides from process heaters and work practice standards and monitoring requirements for flares. The Company is evaluating the impact of the regulation and amended standards on its refinery operations. The Company cannot currently estimate the cost that may be incurred, if any, to comply by July 1, 2015 with the amended NSPS.
The Company is also currently subject to certain other existing claims and proceedings. The Company believes that there is only a remote probability that future costs related to any of these known contingent liability exposures would have a material impact on its financial position or results of operations.
10—EMPLOYEE BENEFIT PLANS
The Company sponsors a noncontributory defined benefit pension plan (the “Qualified Plan”) with a policy to fund pension liabilities in accordance with the limits imposed by the Employee Retirement Income Security Act of 1974 (“ERISA”) and Federal income tax laws. In addition, the Company sponsors a supplemental pension plan covering certain employees, which provides incremental payments that would have been payable from the Company’s principal pension plan, were it not for limitations imposed by income tax regulations.
The non-union Delaware City employees and all Paulsboro employees became eligible to participate in the Company’s defined benefit plans as of the respective acquisition dates. The union Delaware City employees became eligible to participate in the Company’s defined benefit plans upon commencement of normal operations. The Company did not assume any of the employees’ pension liability accrued prior to the respective acquisitions.
The Company formed the Post Retirement Medical Plan on December 31, 2010 to provide health care coverage continuation from date of retirement to age 65 for qualifying employees associated with the Paulsboro
F-82
Table of Contents
PBF ENERGY COMPANY LLC AND SUBSIDIARIES
NOTES TO CONDENSED CONSOLIDATED FINANCIAL STATEMENTS
(UNAUDITED, AMOUNTS IN THOUSANDS, EXCEPT BARREL, UNIT, WARRANT AND
OPTION DATA)
10—EMPLOYEE BENEFIT PLANS (Continued)
acquisition. The Company credited the qualifying employees with their prior service under Valero which resulted in the recognition of a liability for the projected benefit obligation.
The components of net periodic benefit cost related to the Company’s defined benefit plans consisted of the following:
| Nine Months Ended September 30, | ||||||||
| 2012 | 2011 | |||||||
| Pension Benefits |
||||||||
| Components of net period benefit cost: |
||||||||
| Service cost |
$ | 8,578 | $ | 6,344 | ||||
| Interest cost |
376 | 103 | ||||||
| Expected return on plan assets |
(243 | ) | (32 | ) | ||||
| Amortization of prior service costs |
8 | 8 | ||||||
| Amortization of loss |
23 | 43 | ||||||
|
|
|
|
|
|||||
| Net periodic benefit cost |
$ | 8,742 | $ | 6,466 | ||||
|
|
|
|
|
|||||
| Nine Months Ended September 30, | ||||||||
| 2012 | 2011 | |||||||
| Post Retirement Medical Plan |
||||||||
| Components of net period benefit cost: |
||||||||
| Service cost |
$ | 475 | $ | 405 | ||||
| Interest cost |
296 | 285 | ||||||
|
|
|
|
|
|||||
| Net periodic benefit cost |
$ | 771 | $ | 690 | ||||
|
|
|
|
|
|||||
11—FAIR VALUE MEASUREMENTS
The tables below present information about the Company’s financial assets and liabilities measured and recorded at fair value on a recurring basis and indicate the fair value hierarchy of the inputs utilized to determine the fair values as of September 30, 2012 and December 31, 2011.
| As of September 30, 2012 | ||||||||||||||||
| Level 1 | Level 2 | Level 3 | Total | |||||||||||||
| Assets: |
||||||||||||||||
| Money market funds |
$ | 65,689 | $ | — | $ | — | $ | 65,689 | ||||||||
| Derivatives included with inventory supply arrangement obligations |
— | 10,727 | — | 10,727 | ||||||||||||
| Liabilities: |
||||||||||||||||
| Commodity contracts |
— | 477 | — | 477 | ||||||||||||
| Catalyst lease obligations |
— | 46,647 | — | 46,647 | ||||||||||||
| Contingent consideration for refinery acquisition |
— | — | 20,665 | 20,665 | ||||||||||||
F-83
Table of Contents
PBF ENERGY COMPANY LLC AND SUBSIDIARIES
NOTES TO CONDENSED CONSOLIDATED FINANCIAL STATEMENTS
(UNAUDITED, AMOUNTS IN THOUSANDS, EXCEPT BARREL, UNIT, WARRANT AND
OPTION DATA)
11—FAIR VALUE MEASUREMENTS (Continued)
| As of December 31, 2011 | ||||||||||||||||
| Level 1 | Level 2 | Level 3 | Total | |||||||||||||
| Assets: |
||||||||||||||||
| Money market funds |
$ | 666 | $ | — | $ | — | $ | 666 | ||||||||
| Commodity contracts |
72 | — | — | 72 | ||||||||||||
| Liabilities: |
||||||||||||||||
| Catalyst lease obligations |
— | 30,266 | — | 30,266 | ||||||||||||
| Derivatives included with inventory supply arrangement obligations |
— | 3,070 | — | 3,070 | ||||||||||||
| Contingent consideration for refinery acquisition |
— | — | 122,232 | 122,232 | ||||||||||||
The valuation methods used to measure financial instruments at fair value are as follows:
| • | Money market funds categorized in Level 1 of the fair value hierarchy are measured at fair value based on quoted market prices and included within cash and cash equivalents. |
| • | The commodity contracts categorized in Level 1 of the fair value hierarchy are measured at fair value based on quoted prices in an active market. The commodity contracts categorized in Level 2 of the fair value hierarchy are measured at fair value using a market approach based upon future commodity prices for similar instruments quoted in active markets. |
| • | The derivatives included with inventory supply arrangement obligations and the catalyst lease liabilities are categorized in Level 2 of the fair value hierarchy and are measured at fair value using a market approach based upon future commodity prices for similar instruments quoted in active markets. |
| • | The contingent consideration for refinery acquisition obligation at September 30, 2012 is categorized in Level 3 of the fair value hierarchy and is estimated using a discounted cash flow model based on management’s estimate of the future cash flows of the Toledo refinery; a risk free rate of return of 0.16%; credit rate spread of 4.38%; and a discount rate of 4.54%. The change in fair value of the obligation during the nine months ended September 30, 2012 was impacted primarily by the change in the time value of money discount as the obligation is expected to be paid in full by April 2013. A significant decrease in the estimated future cash flows used in the cash flow model would result in a decrease in the fair value for this liability. |
The table below summarizes the changes in fair value measurements categorized in Level 3 of the fair value hierarchy:
| Nine Months Ended September 30, | ||||||||
| 2012 | 2011 | |||||||
| Balance at beginning of period |
$ | 122,232 | $ | — | ||||
| Purchases |
— | 117,017 | ||||||
| Settlements |
(103,643 | ) | — | |||||
| Unrealized loss included in earnings |
2,076 | 4,829 | ||||||
| Transfers into Level 3 |
— | — | ||||||
| Transfers out of Level 3 |
— | — | ||||||
|
|
|
|
|
|||||
| Balance at end of period |
$ | 20,665 | $ | 121,846 | ||||
|
|
|
|
|
|||||
There were no transfers between levels during the nine months ended September 30, 2012 and 2011, respectively.
F-84
Table of Contents
PBF ENERGY COMPANY LLC AND SUBSIDIARIES
NOTES TO CONDENSED CONSOLIDATED FINANCIAL STATEMENTS
(UNAUDITED, AMOUNTS IN THOUSANDS, EXCEPT BARREL, UNIT, WARRANT AND
OPTION DATA)
12—DERIVATIVE INSTRUMENTS AND HEDGING ACTIVITIES
The Company uses derivative instruments to mitigate certain exposures to commodity price risk. The Company’s crude supply agreements contain purchase obligations for certain volumes of crude oil and other feedstocks. The Company was also party to an agreement that contained purchase obligations for certain volumes of stored intermediates inventory during the nine months ended September 30, 2012 and 2011, which was terminated during the first quarter of 2012. The purchase obligations related to crude oil and feedstocks are derivative instruments that have been designated as fair value hedges in order to hedge the commodity price volatility of certain refinery inventory beginning July 1, 2011. The fair value of these purchase obligation derivatives is based on market prices of crude oil and intermediates in the future. The level of activity for these derivatives is based on the level of operating inventories. As of September 30, 2012, there were 3,557,464 barrels of crude oil and feedstocks (3,101,333 barrels at December 31, 2011) outstanding under these derivative instruments designated as fair value hedges and no barrels (117,848 barrels at December 31, 2011) outstanding under these derivative instruments not designated as hedges. These volumes represent the notional value of the contract.
The Company also enters into economic hedges primarily consisting of commodity derivative contracts that are not designated as hedges and are used to manage price volatility in certain crude oil and feedstock inventories as well as crude oil, feedstock, and refined product sales or purchases. The objective in entering into economic hedges is consistent with the objectives discussed above for fair value hedges. As of September 30, 2012, there were 371,000 barrels of crude oil and 3,835,000 barrels of refined products (7,000 and 349,000, respectively, as of December 31, 2011), outstanding under short and long term future commodity derivative contracts not designated as hedges, representing the notional value of the contracts.
The following tables provide information about the fair values of these derivative instruments as of September 30, 2012 and December 31, 2011 and the line items in the consolidated balance sheet in which the fair values are reflected. See Note 11 for additional information related to the fair values of derivative instruments.
| Description |
Balance Sheet Location | Fair
Value Asset/(Liability) |
||||
| Derivatives designated as hedging instruments: |
||||||
| September 30, 2012: |
||||||
| Derivatives included with inventory supply arrangement obligations |
Accrued expenses | $ | 10,727 | |||
| December 31, 2011: |
||||||
| Derivatives included with inventory supply arrangement obligations |
Accrued expenses | $ | (1,465 | ) | ||
| Derivatives not designated as hedging instruments: |
||||||
| September 30, 2012: |
||||||
| Derivatives included with inventory supply arrangement obligations |
Accrued expenses | $ | — | |||
| Commodity contracts |
Accrued expenses | $ | (477 | ) | ||
| December 31, 2011: |
||||||
| Derivatives included with inventory supply arrangement obligations |
Accrued expenses | $ | (1,605 | ) | ||
| Commodity contracts |
Accounts receivable | $ | 72 | |||
F-85
Table of Contents
PBF ENERGY COMPANY LLC AND SUBSIDIARIES
NOTES TO CONDENSED CONSOLIDATED FINANCIAL STATEMENTS
(UNAUDITED, AMOUNTS IN THOUSANDS, EXCEPT BARREL, UNIT, WARRANT AND
OPTION DATA)
12—DERIVATIVE INSTRUMENTS AND HEDGING ACTIVITIES (Continued)
The Company’s policy is to net the fair value of the derivatives included with inventory supply arrangement obligations against the liability related to inventory supply arrangements with the same counterparty as the legal right of offset exists.
The following tables provide information about the gain or loss recognized in income on these derivative instruments and the line items in the consolidated financial statements in which such gains and losses are reflected.
| Description |
Location of Gain or (Loss) Recognized in Income on Derivatives |
Gain or (Loss) Recognized in Income on Derivatives |
||||||
| Derivatives designated as hedging instruments: |
||||||||
| For the nine months ended September 30, 2012: |
||||||||
| Derivatives included with inventory supply arrangement obligations |
Cost of sales | $ | 12,192 | |||||
| For the nine months ended September 30, 2011: |
||||||||
| Derivatives included with inventory supply arrangement obligations |
Cost of sales | $ | 18,125 | |||||
| Derivatives not designated as hedging instruments: |
||||||||
| For the nine months ended September 30, 2012: |
||||||||
| Derivatives included with inventory supply arrangement obligations |
Cost of sales | $ | (8 | ) | ||||
| Commodity contracts |
Cost of sales | $ | 30,636 | |||||
| For the nine months ended September 30, 2011: |
||||||||
| Derivatives included with inventory supply arrangement obligations |
Cost of sales | $ | 6,654 | |||||
| Commodity contracts |
Cost of sales | $ | 3,030 | |||||
| Hedged items designated in fair value hedges: |
||||||||
| For the nine months ended September 30, 2012: |
||||||||
| Crude oil and feedstock inventory |
Cost of sales | $ | (4,590 | ) | ||||
| For the nine months ended September 30, 2011: |
||||||||
| Crude oil and feedstock inventory |
Cost of sales | $ | (12,195 | ) | ||||
Ineffectiveness related to the Company’s fair value hedges resulted in a loss of $7,602 and $5,930 for the nine months ended September 30, 2012 and 2011, respectively. The gains and losses due to ineffectiveness were excluded from the assessment of hedge effectiveness. The Company did not apply hedge accounting to any of its derivative instruments prior to July 1, 2011.
F-86
Table of Contents
PBF ENERGY COMPANY LLC AND SUBSIDIARIES
NOTES TO CONDENSED CONSOLIDATED FINANCIAL STATEMENTS
(UNAUDITED, AMOUNTS IN THOUSANDS, EXCEPT BARREL, UNIT, WARRANT AND
OPTION DATA)
13—REVENUES
The following table provides information relating to the Company’s revenues from external customers for each product or group of similar products for the periods:
| Nine Months Ended September 30, | ||||||||
| 2012 | 2011 | |||||||
| Gasoline and distillates |
$ | 13,474,599 | $ | 8,894,941 | ||||
| Lubricants |
420,519 | 405,787 | ||||||
| Asphalt and residual oils |
305,786 | 315,716 | ||||||
| Liquefied petroleum gases |
260,967 | 309,597 | ||||||
| Chemicals |
499,292 | 238,692 | ||||||
| Clarified slurry oil |
217,908 | 15,016 | ||||||
| Other |
9,256 | 4,148 | ||||||
|
|
|
|
|
|||||
| $ | 15,188,327 | $ | 10,183,897 | |||||
|
|
|
|
|
|||||
14—SUBSEQUENT EVENTS
These financial statements were approved by management and available for issuance on November 6, 2012. Management has evaluated subsequent events through this date.
Revolving Loan Amendment
On October 26, 2012, the Revolving Loan was amended and restated to increase the maximum availability to $1,375,000 and extend the maturity date to October 26, 2017. In addition, the Applicable Margin, as defined in the agreement, was amended to a range of 0.75% to 1.50% for Alternative Base Rate Loans and 1.75% to 2.50% for Adjusted LIBOR Rate Loans, and the Commitment Fee, as defined in the agreement, was amended to a range of 0.375% to 0.5%, all depending on the Company’s debt rating.
Crude Supply Agreement
On October 29, 2012, the term of the Company’s crude supply agreement with Statoil for its Delaware City refinery (the “Delaware City crude supply agreement”) was extended to December 31, 2015. On October 31, 2012, the Delaware City crude supply agreement was amended and modified to among other things, allow the Company to directly purchase U.S. and Canadian onshore origin crude oil and feedstock that is delivered to the Delaware City refinery via rail independent of Statoil.
F-87
Table of Contents
Shares
PBF ENERGY INC.
Class A Common Stock
Citigroup
Morgan Stanley
Credit Suisse
Deutsche Bank Securities
UBS Investment Bank
Barclays
Through and including , 2012 (the 25th day after the date of this prospectus), all dealers effecting transactions in these securities, whether or not participating in this offering, may be required to deliver a prospectus. This is in addition to a dealer’s obligation to deliver a prospectus when acting as an underwriter and with respect to an unsold allotment or subscription.
Table of Contents
PART II
INFORMATION NOT REQUIRED IN PROSPECTUS
Item 13. Other Expenses of Issuance and Distribution
The following table sets forth the expenses incurred in connection with the issuance and distribution of the securities being registered under this Registration Statement, other than underwriting discounts and commissions. All amounts, except the SEC registration fee, the Financial Industry Regulatory Authority filing fee, the New York Stock Exchange Listing fee and the Transfer Agent fee, are estimated. All amounts will be paid by the Registrant:
| Securities and Exchange Commission Registration Fee |
$ | 11,460.00 | ||
| Financial Industry Regulatory Authority Filing Fee |
$ | 10,500.00 | ||
| New York Stock Exchange Listing Fee |
$ | * | ||
| Transfer Agent Fee |
$ | * | ||
| Blue Sky Fee |
$ | * | ||
| Printing and Engraving |
$ | * | ||
| Legal Fees and Expenses |
$ | * | ||
| Accounting Fees and Expenses |
$ | * | ||
| Miscellaneous |
$ | * | ||
| Total |
$ | * | ||
|
|
|
| * | To be filed by amendment. |
Item 14. Indemnification of Directors and Officers
Section 102 of the DGCL allows a corporation to eliminate the personal liability of directors to a corporation or its stockholders for monetary damages for a breach of a fiduciary duty as a director, except where the director breached his duty of loyalty, failed to act in good faith, engaged in intentional misconduct or knowingly violated a law, authorized the payment of a dividend or approved a stock repurchase or redemption in violation of Delaware corporate law or obtained an improper personal benefit.
Section 145 of the DGCL empowers a Delaware corporation to indemnify any person who was or is a party or is threatened to be made a party to any threatened, pending or completed action, suit or proceeding, whether civil, criminal, administrative or investigative (other than an action by or in the right of such corporation) by reason of the fact that such person is or was a director, officer, employee or agent of such corporation, or is or was serving at the request of such corporation as a director, officer, employee or agent of another corporation, partnership, joint venture, trust or other enterprise. The indemnity may include expenses (including attorneys’ fees), judgments, fines and amounts paid in settlement actually and reasonably incurred by such person in connection with such action, suit or proceeding, provided that such person acted in good faith and in a manner such person reasonably believed to be in or not opposed to the best interests of the corporation and, with respect to any criminal action or proceeding, had no reasonable cause to believe such person’s conduct was unlawful. A Delaware corporation may indemnify directors, officers, employees and other agents of such corporation in an action by or in the right of a corporation under the same conditions against expenses (including attorneys’ fees) actually and reasonably incurred by the person in connection with the defense and settlement of such action or suit, except that no indemnification is permitted without judicial approval if the person to be indemnified has been adjudged to be liable to the corporation. Where a present or former director or officer of the corporation is successful on the merits or otherwise in the defense of any action, suit or proceeding referred to above or in defense of any claim, issue or matter therein, the corporation must indemnify such person against the expenses (including attorneys’ fees) which he or she actually and reasonably incurred in connection therewith.
Section 174 of the DGCL provides, among other things, that a director who willfully or negligently approves of an unlawful payment of dividends or an unlawful stock purchase or redemption, may be held liable
II-1
Table of Contents
for such actions. A director who was either absent when the unlawful actions were approved or dissented at the time, may avoid liability by causing his or her dissent to such actions to be entered into the books containing the minutes of the meetings of the board of directors at the time such action occurred or immediately after such absent director receives notice of the unlawful acts.
The Registrant’s certificate of incorporation and bylaws contains provisions that provide for indemnification of officers and directors and their heirs and representatives to the full extent permitted by, and in the manner permissible under, the DGCL.
As permitted by Section 102(b)(7) of the DGCL, the Registrant’s certificate of incorporation contains a provision eliminating the personal liability of a director to the Registrant or its stockholders for monetary damages for breach of fiduciary duty as a director, subject to some exceptions.
The Registrant maintains, at its expense, a policy of insurance which insures its directors and officers, subject to exclusions and deductions as are usual in these kinds of insurance policies, against specified liabilities which may be incurred in those capacities.
The Registrant has entered into an indemnification agreement with each of its directors and executive officers. The indemnification agreements supplement existing indemnification provisions in the Registrant’s bylaws and in it the Registrant agrees, subject to certain exceptions, to the fullest extent then permitted by the DGCL, (1) to indemnify the director or executive officer and (2) to pay expenses incurred by the director or executive officer in any proceeding in advance of the final disposition of such proceeding, with the primary purpose of the agreements being to provide specific contractual assurances to the Registrant’s directors and executive officers in respect of these indemnification protections which could not be altered by future changes to the Registrant’s current bylaw indemnification provisions.
The underwriting agreement provides for indemnification by the underwriters of us and our officers and directors, and by us of the underwriters, for certain liabilities arising under the Securities Act or otherwise in connection with this offering.
Item 15. Recent Sales of Unregistered Securities
On November 9, 2011, the Registrant issued 100 shares of the Registrant’s common stock, par value $0.001 per share, to PBF LLC for $100.00. The issuance of such shares of common stock was not registered under the Securities Act, because the shares were offered and sold in a transaction exempt from registration under Section 4(2) of the Securities Act.
Item 16. Exhibits and Financial Statement Schedules
(a) Exhibits.
| Number |
Description | |||
| 1.1* | Underwriting Agreement | |||
| 3.1** | Form of Amended and Restated Certificate of Incorporation of PBF Energy Inc. | |||
| 3.2** | Form of Amended and Restated Bylaws of PBF Energy Inc. | |||
| 4.1** | Form of Amended and Restated Registration Rights Agreement | |||
| 4.2** | Indenture, dated as of February 9, 2012, among PBF Holding Company LLC, PBF Finance Corporation, the Guarantors party thereto, Wilmington Trust, National Association and Deutsche Bank Trust Company Americas | |||
II-2
Table of Contents
| Number |
Description | |||
| 5.1* | Opinion of Stroock & Stroock & Lavan LLP | |||
| 10.1†** | Asset Purchase Agreement, dated as of April 7, 2010, by and among The Premcor Refining Group Inc., The Premcor Pipeline Co., Delaware City Refining Company LLC and Delaware Pipeline Company LLC, as amended | |||
| 10.2†** | Stock Purchase Agreement, dated as of September 24, 2010, by and between Valero Refining and Marketing Company and PBF Holding Company LLC, as amended as of November 29, 2010 and December 17, 2010 | |||
| 10.3†** | Asset Sale and Purchase Agreement, dated as of December 2, 2010, by and between Toledo Refining Company, LLC and Sunoco, Inc. (R&M), as amended as of January 18, 2011, February 15, 2011 and February 28, 2011 | |||
| 10.4†** | Offtake Agreement, dated as of March 1, 2011, by and between Toledo Refining Company LLC and Sunoco, Inc. (R&M) | |||
| 10.4.1** | Assignment and Assumption Agreement, dated as of March 1, 2012, by and between Toledo Refining Company LLC, PBF Holding Company LLC, and Sunoco, Inc. (R&M) | |||
| 10.5†** | Products Offtake Agreement, dated as of December 14, 2010, by and between Morgan Stanley Capital Group Inc. and PBF Holding Company LLC (superseded by Exhibit 10.25, Amended and Restated Products Offtake Agreement, dated as of August 30, 2012, between Morgan Stanley Capital Group Inc., PBF Holding Company LLC and Paulsboro Refining Company LLC) | |||
| 10.6†** | Products Offtake Agreement, dated as of April 7, 2011, by and between Morgan Stanley Capital Group Inc. and Delaware City Refining Company LLC (superseded by Exhibit 10.24, Second Amended and Restated Products Offtake Agreement, dated as of July 30, 2012, between Morgan Stanley Capital Group Inc., Transmontaigne Product Services Inc., Delaware City Refining Company LLC and PBF Holding Company LLC) | |||
| 10.7†** | Crude Oil Acquisition Agreement, dated as of May 31, 2011, by and between Morgan Stanley Capital Group Inc. and Toledo Refining Company LLC (superseded by Exhibit 10.23, Amended and Restated Crude Oil Acquisition Agreement, dated as of March 1, 2012, by and between Morgan Stanley Capital Group Inc. and PBF Holding Company LLC) | |||
| 10.8†** | Crude Oil/Feedstock Supply/Delivery and Services Agreement, effective as of April 7, 2011, by and between Statoil Marketing & Trading (US) Inc. and Delaware City Refining Company LLC, as amended as of July 29, 2011 | |||
| 10.8.1** | Agreement on Modification to the DCR Crude Supply Agreement, effective as of October 31, 2012, by and between Statoil Marketing & Trading (US) Inc. and Delaware City Refining Company LLC | |||
| 10.9†** | Crude Oil/Feedstock Supply/Delivery and Services Agreement, effective as of December 16, 2010, by and between Statoil Marketing & Trading (US) Inc. and PBF Holding Company LLC, as amended as of January 7, 2011, April 26, 2011 and July 28, 2011 | |||
| 10.9.1†** | Fourth Amendment to Crude Oil/Feedstock Supply/Delivery and Services Agreement, entered into as of August 2, 2012, by and among Statoil Marketing & Trading (US) Inc., Paulsboro Refining Company LLC and PBF Holding Company LLC | |||
| 10.10** | Second Amended and Restated Letter of Credit Facility Agreement, dated as of April 24, 2012, by and among PBF Holding Company LLC, Paulsboro Refining Company LLC, Delaware City Refining Company LLC and BNP Paribas (Suisse) SA | |||
II-3
Table of Contents
| Number |
Description | |||
| 10.11** | Second Amended and Restated Revolving Credit Agreement dated as of October 26, 2012, among PBF Holding Company LLC, Delaware City Refining Company LLC, Paulsboro Refining Company LLC and Toledo Refining Company LLC, the lenders party thereto in their capacities as lenders thereunder, UBS AG, Stamford Branch, as Administrative Agent and Co-Collateral Agent, and Bank of America, N.A. and Wells Fargo Bank, N.A., as Co-Collateral Agents | |||
| 10.12** | Form of Second Amended and Restated Employment Agreement between PBF Investments LLC and Thomas D. O’Malley | |||
| 10.13** | Form of Amended and Restated Employment Agreement between PBF Investments LLC and Thomas J. Nimbley | |||
| 10.14** | Form of Second Amended and Restated Employment Agreement between PBF Investments LLC and Matthew C. Lucey | |||
| 10.15** | Form of Second Amended and Restated Employment Agreement between PBF Investments LLC and Donald F. Lucey | |||
| 10.16** | Form of Amended and Restated Employment Agreement between PBF Investments LLC and Michael D. Gayda | |||
| 10.17** | Form of Restated Warrant and Purchase Agreement between PBF Energy Company LLC and the officers party thereto, as amended | |||
| 10.18** | Form of Indemnification Agreement between PBF Energy Inc. and each of the executive officers and directors of PBF Energy Inc. | |||
| 10.19 | [Intentionally omitted] | |||
| 10.20** | Form of Tax Receivable Agreement | |||
| 10.21** | Form of Exchange Agreement | |||
| 10.22** | Form of Amended and Restated Limited Liability Company Agreement of PBF Energy Company LLC | |||
| 10.23†** | Amended and Restated Crude Oil Acquisition Agreement, dated as of March 1, 2012, by and between Morgan Stanley Capital Group Inc. and PBF Holding Company LLC | |||
| 10.23.1** | First Amendment to Amended and Restated Crude Oil Acquisition Agreement, dated as of June 28, 2012, by and between PBF Holding Company LLC and Morgan Stanley Capital Group Inc. | |||
| 10.23.2** | Second Amendment to Amended and Restated Crude Oil Acquisition Agreement, dated as of October 11, 2012, by and between PBF Holding Company LLC and Morgan Stanley Capital Group Inc. | |||
| 10.24†** | Second Amended and Restated Products Offtake Agreement, dated as of July 30, 2012, between Morgan Stanley Capital Group Inc., Transmontaigne Product Services Inc., Delaware City Refining Company LLC and PBF Holding Company LLC, amended as of September 1, 2012 | |||
| 10.24.1** | Second Amendment to Second Amended and Restated Products Offtake Agreement, dated as of October 11, 2012, between Morgan Stanley Capital Group Inc., Transmontaigne Product Services Inc., Delaware City Refining Company LLC and PBF Holding Company LLC | |||
| 10.25†** | Amended and Restated Products Offtake Agreement, dated as of August 30, 2012, between Morgan Stanley Capital Group Inc., PBF Holding Company LLC and Paulsboro Refining Company LLC | |||
| 10.25.1** | First Amendment to Amended and Restated Products Offtake Agreement, dated as of October 11, 2012, between Morgan Stanley Capital Group Inc., PBF Holding Company LLC and Paulsboro Refining Company LLC | |||
| 10.26** | Form of Stockholders’ Agreement of PBF Energy Inc. | |||
| 10.27** | PBF Energy Inc. 2012 Equity Incentive Plan | |||
| 10.28 | Form of Non-Qualified Stock Option Agreement | |||
| 21.1** | Subsidiaries of the Registrant | |||
II-4
Table of Contents
| Number |
Description | |
| 23.1 | Consent of Deloitte & Touche LLP | |
| 23.2 | Consent of Deloitte & Touche LLP | |
| 23.3 | Consent of Ernst & Young LLP | |
| 23.4 | Consent of KPMG LLP | |
| 23.5* | Consent of Stroock & Stroock & Lavan LLP (included in Exhibit 5.1) | |
| 24.1** | Power of Attorney (included on signature page) | |
| 24.2** | Power of Attorney of Spencer Abraham | |
| * | To be filed by amendment. |
| ** | Previously filed. |
| † | Portions of this exhibit were omitted and have been filed separately with the Secretary of the SEC pursuant to the Registrant’s application requesting confidential treatment under Rule 406 of the Securities Act. |
(b) Financial Statement Schedules
See the Index to Financial Statements included on page F-1 for a list of the financial statements included in this registration statement.
All schedules not identified above have been omitted because they are not required, are not applicable or the information is included in the selected consolidated financial data or notes contained in this registration statement.
Item 17. Undertakings
Insofar as indemnification for liabilities arising under the Securities Act may be permitted to directors, officers and controlling persons of the Registrant pursuant to the foregoing provisions, or otherwise, the Registrant has been advised that in the opinion of the SEC such indemnification is against public policy as expressed in the Securities Act and is, therefore, unenforceable. In the event that a claim for indemnification against such liabilities (other than the payment by the Registrant of expenses incurred or paid by a director, officer or controlling person of the Registrant in the successful defense of any action, suit or proceeding) is asserted by such director, officer or controlling person in connection with the securities being registered, the Registrant will, unless in the opinion of its counsel the matter has been settled by controlling precedent, submit to a court of appropriate jurisdiction the question whether such indemnification by it is against public policy as expressed in the Securities Act, and will be governed by the final adjudication of such issue.
The undersigned hereby undertakes that:
(a)(1) for purposes of determining any liability under the Securities Act, the information omitted from the form of prospectus filed as part of this registration statement in reliance upon Rule 430A and contained in a form of prospectus filed by the Registrant pursuant to Rule 424(b)(1) or (4) or 497(h) under the Securities Act, shall be deemed to be part of this Registration Statement as of the time it was declared effective;
(2) for the purpose of determining any liability under the Securities Act, each post-effective amendment that contains a form of prospectus shall be deemed to be a new registration statement relating to the securities offered therein, and the offering of such securities at that time shall be deemed to be the initial bona fide offering thereof;
(b) the undersigned will provide to the underwriters at the closing specified in the underwriting agreement, certificates in such denominations and registered in such names as required by the underwriters to permit prompt delivery to each purchaser.
II-5
Table of Contents
SIGNATURES
Pursuant to the requirements of the Securities Act of 1933, the Registrant has duly caused this registration statement to be signed on its behalf by the undersigned, thereunto duly authorized, in the Township of Parsippany-Troy Hills, State of New Jersey, on November 27, 2012.
| PBF ENERGY INC. | ||
| By: | /S/ JEFFREY DILL | |
| Name: | Jeffrey Dill | |
| Title: | Officer | |
Pursuant to the requirements of the Securities Act of 1933 this registration statement has been signed by the following persons in the capacities indicated, on November 27, 2012.
| Signature |
Title | |
| * Thomas J. Nimbley |
Chief Executive Officer (Principal Executive Officer) | |
| * Matthew C. Lucey |
Senior Vice President, Chief Financial Officer (Principal Financial Officer) | |
| * Karen B. Davis |
Chief Accounting Officer (Principal Accounting Officer) | |
| * Thomas D. O’Malley |
Executive Chairman of the Board of Directors | |
| * Spencer Abraham |
Director | |
| * Jefferson F. Allen |
Director | |
| * Martin J. Brand |
Director | |
| * Timothy H. Day |
Director | |
| * David I. Foley |
Director | |
| * Dennis Houston |
Director | |
| * Neil A. Wizel |
Director | |
| *By: |
||
| /S/ JEFFREY DILL Jeffrey Dill |
Attorney-in-fact for the persons indicated | |
II-6
Table of Contents
EXHIBIT INDEX
| Exhibit Number |
Description | |
| 1.1* | Underwriting Agreement | |
| 3.1** | Form of Amended and Restated Certificate of Incorporation of PBF Energy Inc. | |
| 3.2** | Form of Amended and Restated Bylaws of PBF Energy Inc. | |
| 4.1** | Form of Amended and Restated Registration Rights Agreement | |
| 4.2** | Indenture, dated as of February 9, 2012, among PBF Holding Company LLC, PBF Finance Corporation, the Guarantors party thereto, Wilmington Trust, National Association and Deutsche Bank Trust Company Americas | |
| 5.1* | Opinion of Stroock & Stroock & Lavan LLP | |
| 10.1†** | Asset Purchase Agreement, dated as of April 7, 2010, by and among The Premcor Refining Group Inc., The Premcor Pipeline Co., Delaware City Refining Company LLC and Delaware Pipeline Company LLC, as amended | |
| 10.2†** | Stock Purchase Agreement, dated as of September 24, 2010, by and between Valero Refining and Marketing Company and PBF Holding Company LLC, as amended as of November 29, 2010 and December 17, 2010 | |
| 10.3†** | Asset Sale and Purchase Agreement, dated as of December 2, 2010, by and between Toledo Refining Company, LLC and Sunoco, Inc. (R&M), as amended as of January 18, 2011, February 15, 2011 and February 28, 2011 | |
| 10.4†** | Offtake Agreement, dated as of March 1, 2011, by and between Toledo Refining Company LLC and Sunoco, Inc. (R&M) | |
| 10.4.1** | Assignment and Assumption Agreement, dated as of March 1, 2012, by and between Toledo Refining Company LLC, PBF Holding Company LLC, and Sunoco, Inc. (R&M) | |
| 10.5†** | Products Offtake Agreement, dated as of December 14, 2010, by and between Morgan Stanley Capital Group Inc. and PBF Holding Company LLC (superseded by Exhibit 10.25, Amended and Restated Products Offtake Agreement, dated as of August 30, 2012, between Morgan Stanley Capital Group Inc., PBF Holding Company LLC and Paulsboro Refining Company LLC) | |
| 10.6†** | Products Offtake Agreement, dated as of April 7, 2011, by and between Morgan Stanley Capital Group Inc. and Delaware City Refining Company LLC (superseded by Exhibit 10.24, Second Amended and Restated Products Offtake Agreement, dated as of July 30, 2012, between Morgan Stanley Capital Group Inc., Transmontaigne Product Services Inc., Delaware City Refining Company LLC and PBF Holding Company LLC) | |
| 10.7†** | Crude Oil Acquisition Agreement, dated as of May 31, 2011, by and between Morgan Stanley Capital Group Inc. and Toledo Refining Company LLC (superseded by Exhibit 10.23, Amended and Restated Crude Oil Acquisition Agreement, dated as of March 1, 2012, by and between Morgan Stanley Capital Group Inc. and PBF Holding Company LLC) | |
| 10.8†** | Crude Oil/Feedstock Supply/Delivery and Services Agreement, effective as of April 7, 2011, by and between Statoil Marketing & Trading (US) Inc. and Delaware City Refining Company LLC, as amended as of July 29, 2011 | |
| 10.8.1** | Agreement on Modification to the DCR Crude Supply Agreement, effective as of October 31, 2012, by and between Statoil Marketing & Trading (US) Inc. and Delaware City Refining Company LLC | |
| 10.9†** | Crude Oil/Feedstock Supply/Delivery and Services Agreement, effective as of December 16, 2010, by and between Statoil Marketing & Trading (US) Inc. and PBF Holding Company LLC, amended as of January 7, 2011, April 26, 2011 and July 28, 2011 | |
Table of Contents
| Exhibit Number |
Description | |
| 10.9.1†** | Fourth Amendment to Crude Oil/Feedstock Supply/Delivery and Services Agreement, entered into as of August 2, 2012, by and among Statoil Marketing & Trading (US) Inc., Paulsboro Refining Company LLC and PBF Holding Company LLC | |
| 10.10** | Second Amended and Restated Letter of Credit Facility Agreement, dated as of April 24, 2012, by and among PBF Holding Company LLC, Paulsboro Refining Company LLC, Delaware City Refining Company LLC and BNP Paribas (Suisse) SA | |
| 10.11** | Second Amended and Restated Revolving Credit Agreement dated as of October 26, 2012, among PBF Holding Company LLC, Delaware City Refining Company LLC, Paulsboro Refining Company LLC and Toledo Refining Company LLC, the lenders party thereto in their capacities as lenders thereunder, UBS AG, Stamford Branch, as Administrative Agent and Co-Collateral Agent, Bank of America, N.A. and Wells Fargo Bank, N.A., as Co-Collateral Agents | |
| 10.12** | Form of Second Amended and Restated Employment Agreement between PBF Investments LLC and Thomas D. O’Malley | |
| 10.13** | Form of Amended and Restated Employment Agreement between PBF Investments LLC and Thomas J. Nimbley | |
| 10.14** | Form of Second Amended and Restated Employment Agreement between PBF Investments LLC and Matthew C. Lucey | |
| 10.15** | Form of Second Amended and Restated Employment Agreement between PBF Investments LLC and Donald F. Lucey | |
| 10.16** | Form of Amended and Restated Employment Agreement between PBF Investments LLC and Michael D. Gayda | |
| 10.17** | Form of Restated Warrant and Purchase Agreement between PBF Energy Company LLC and the officers party thereto, as amended | |
| 10.18** | Form of Indemnification Agreement between PBF Energy Inc. and each of the executive officers and directors of PBF Energy Inc. | |
| 10.19 | [Intentionally omitted] | |
| 10.20** | Form of Tax Receivable Agreement | |
| 10.21** | Form of Exchange Agreement | |
| 10.22** | Form of Amended and Restated Limited Liability Company Agreement of PBF Energy Company LLC | |
| 10.23†** | Amended and Restated Crude Oil Acquisition Agreement, dated as of March 1, 2012, by and between Morgan Stanley Capital Group Inc. and PBF Holding Company LLC | |
| 10.23.1** | First Amendment to Amended and Restated Crude Oil Acquisition Agreement, dated as of June 28, 2012, by and between PBF Holding Company LLC and Morgan Stanley Capital Group Inc. | |
| 10.23.2** | Second Amendment to Amended and Restated Crude Oil Acquisition Agreement, dated as of October 11, 2012, by and between PBF Holding Company LLC and Morgan Stanley Capital Group Inc. | |
| 10.24†** | Second Amended and Restated Products Offtake Agreement, dated as of July 30, 2012, between Morgan Stanley Capital Group Inc., Transmontaigne Product Services Inc., Delaware City Refining Company LLC and PBF Holding Company LLC, amended as of September 1, 2012 | |
| 10.24.1** | Second Amendment to Second Amended and Restated Products Offtake Agreement, dated as of October 11, 2012, between Morgan Stanley Capital Group Inc., Transmontaigne Product Services Inc., Delaware City Refining Company LLC and PBF Holding Company LLC | |
| 10.25†** | Amended and Restated Products Offtake Agreement, dated as of August 30, 2012, between Morgan Stanley Capital Group Inc., PBF Holding Company LLC and Paulsboro Refining Company LLC |
Table of Contents
| Exhibit Number |
Description | |
| 10.25.1** | First Amendment to Amended and Restated Products Offtake Agreement, dated as of October 11, 2012, between Morgan Stanley Capital Group Inc., PBF Holding Company LLC and Paulsboro Refining Company LLC | |
| 10.26** | Form of Stockholders’ Agreement of PBF Energy Inc. | |
| 10.27** | PBF Energy Inc. 2012 Equity Incentive Plan | |
| 10.28 | Form of Non-Qualified Stock Option Agreement | |
| 21.1** | Subsidiaries of the Registrant | |
| 23.1 | Consent of Deloitte & Touche LLP | |
| 23.2 | Consent of Deloitte & Touche LLP | |
| 23.3 | Consent of Ernst & Young LLP | |
| 23.4 | Consent of KPMG LLP | |
| 23.5* | Consent of Stroock & Stroock & Lavan LLP (included in Exhibit 5.1) | |
| 24.1** | Power of Attorney (included on signature page) | |
| 24.2** | Power of Attorney of Spencer Abraham | |
| * | To be filed by amendment. |
| ** | Previously filed. |
| † | Portions of this exhibit were omitted and have been filed separately with the Secretary of the SEC pursuant to the Registrant’s application requesting confidential treatment under Rule 406 of the Securities Act. |