Attached files
| file | filename |
|---|---|
| 8-K - 8-K - ARCH RESOURCES, INC. | a12-27995_18k.htm |
Exhibit 99.1
|
|
Arch Coal, Inc. Investor Presentation November 2012 |
|
|
Slide 2 Forward-Looking Information This presentation contains “forward-looking statements” – that is, statements related to future, not past, events. In this context, forward-looking statements often address our expected future business and financial performance, and often contain words such as “expects,” “anticipates,” “intends,” “plans,” “believes,” “seeks,” or “will.” Forward-looking statements by their nature address matters that are, to different degrees, uncertain. For us, particular uncertainties arise from changes in the demand for our coal by the domestic electric generation industry; from legislation and regulations relating to the Clean Air Act and other environmental initiatives; from operational, geological, permit, labor and weather-related factors; from fluctuations in the amount of cash we generate from operations; from future integration of acquired businesses; and from numerous other matters of national, regional and global scale, including those of a political, economic, business, competitive or regulatory nature. These uncertainties may cause our actual future results to be materially different than those expressed in our forward-looking statements. We do not undertake to update our forward-looking statements, whether as a result of new information, future events or otherwise, except as may be required by law. For a description of some of the risks and uncertainties that may affect our future results, you should see the risk factors described from time to time in the reports we file with the Securities and Exchange Commission. |
|
|
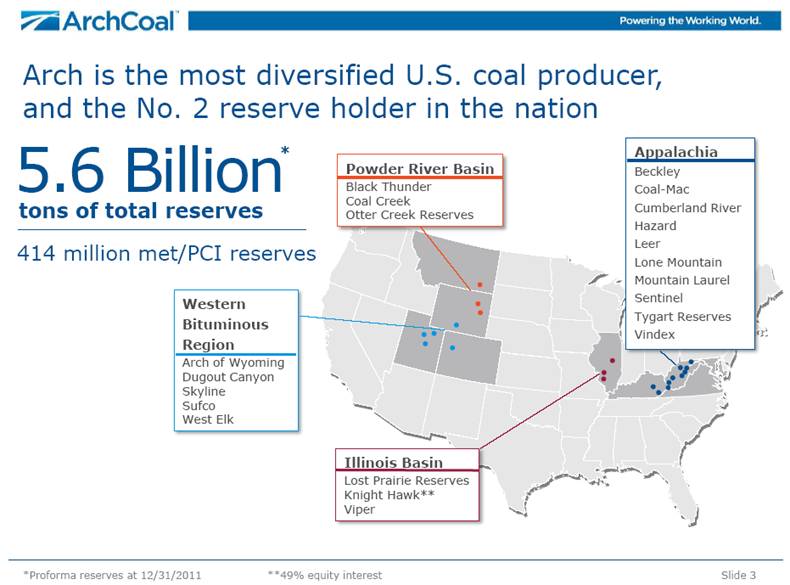
Slide 3 Arch is the most diversified U.S. coal producer, and the No. 2 reserve holder in the nation *Proforma reserves at 12/31/2011 **49% equity interest 5.6 Billion tons of total reserves 414 million met/PCI reserves Western Bituminous Region Arch of Wyoming Dugout Canyon Skyline Sufco West Elk Powder River Basin Black Thunder Coal Creek Otter Creek Reserves Illinois Basin Lost Prairie Reserves Knight Hawk** Viper Appalachia Beckley Coal-Mac Cumberland River Hazard Leer Lone Mountain Mountain Laurel Sentinel Tygart Reserves Vindex * |
|
|
Arch leads the U.S. coal industry in safety and environmental compliance Arch’s safety performance is four times better than the U.S. coal industry average Arch is deeply committed to further improving its industry-leading safety and environmental performances since integrating International Coal Group Slide 4 Sources: ACI, MSHA, State environmental agencies ACI Environmental Compliance (SMCRA violations based on state reports) Lost-Time Safety Incident Rate (per 200,000 employee-hours worked) Arch 5-year avg. = 0.63 Industry 5-year avg. = 2.64 ICG Acquisition ICG Acquisition 15 ‘07 YTD 2012 |
|
|
Arch has a balanced and diversified mine portfolio While Arch’s sales volumes are weighted toward low-cost Powder River Basin coal, the company’s revenue stream is diversified between eastern (increasingly metallurgical) and western regions – and cash margins are very well balanced among all core operating regions. Slide 5 Sales Volumes (YTD 2012, in percent) Revenues (YTD 2012, in percent) Cash Margins (YTD 2012, in percent) Powder River Basin Appalachia Western Bituminous & other thermal 73% 45% 25% 35% 40% |
|
|
Arch has a leading, low-cost western thermal portfolio with meaningful available capacity Arch has a strong position in the PRB, the nation’s largest coal supply basin High-Btu, low-sulfur product Available, excess capacity of 35 million tons versus 2011 levels Expect PRB to expand domestically Pursuing export growth off West Coast Arch is the leading producer in the Western Bituminous Region Supply to remain constrained in region Targeting exports via Gulf/West Coast Slide 6 Sources: ACI, MSHA Western Bituminous Region (2011 production, in millions of tons) Southern Powder River Basin (2011 production, in millions of tons) |
|
|
Sources: Peer earnings and SEC filings, ACI Arch’s Appalachian portfolio is low in cost — and is geared toward higher-margin met assets Slide 7 Appalachian Metallurgical Sales Mix (Based on 2011 production) Appalachian Cash Costs (YTD 2012 reported costs, $/ton) +50% expected future met sales mix |
|
|
Slide 8 Arch continues to advance development of the Leer mine to build out its metallurgical coal franchise Preparation plant is online Continuous miners are in operation First train loaded 10/23/12 Longwall expected to start-up in the third quarter of 2013 Cash costs expected within Arch’s current cost range or lower – with anticipated high-vol A realizations in the triple digits Prep Plant & Train Loadout |
|
|
Arch’s platform in the Illinois Basin provides future opportunities Viper Mine is low-cost and highly competitive Arch owns a 49% equity stake in Knight Hawk, which sold over four million tons in 2011 Arch has built a large portfolio of low-chlorine assets in the basin All required permits received for the Lost Prairie Reserves, setting the stage for potential development in the future Slide 9 Sources: ACI, Ventyx *49% equity interest Legacy Arch Assets Former ICG Assets River Docks ACI Headquarters Illinois Basin Viper Mine Lost Prairie Reserves Knight Hawk* Macoupin Reserves 722 Million tons of reserves |
|
|
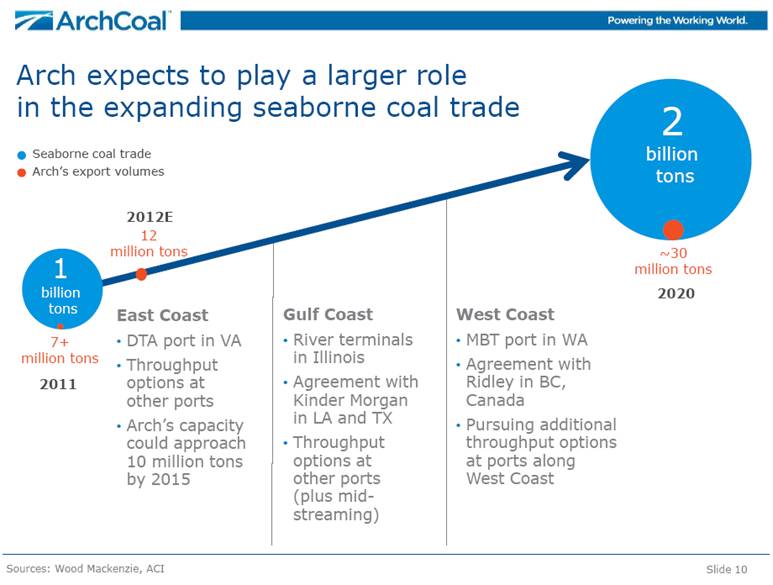
Slide 10 Arch expects to play a larger role in the expanding seaborne coal trade East Coast DTA port in VA Throughput options at other ports Arch’s capacity could approach 10 million tons by 2015 Sources: Wood Mackenzie, ACI 2020 2 billion tons 7+ million tons 1 billion tons 2011 ~30 million tons Seaborne coal trade Arch’s export volumes West Coast MBT port in WA Agreement with Ridley in BC, Canada Pursuing additional throughput options at ports along West Coast Gulf Coast River terminals in Illinois Agreement with Kinder Morgan in LA and TX Throughput options at other ports (plus mid-streaming) 12 million tons 2012E |
|
|
Arch maintains very low legacy liabilities as compared to major peers Slide 11 Sources: ACI estimates, public data Annual Expense of Legacy Liabilities (12/31/11, in millions) Legacy Liabilities of Largest U.S. Coal Companies (12/31/11, in millions) $4,525 $2,510 $1,954 $652 |
|
|
Slide 12 Arch follows a disciplined capital allocation strategy that is scalable based on market conditions Capital Expenditures (in millions) 2013P Spending By Category ($350 million) Maintenance |
|
|
Arch is holding the line on cost escalation despite weak coal market conditions Slide 13 *Represents the mid-point of cost guidance given in ACI’s quarterly earnings releases Powder River Basin Cost Guidance* (2012E, cash costs per ton) Western Bituminous Cost Guidance* (2012E, cash costs per ton) Appalachia Cost Guidance* (2012E, cash costs per ton) $0.85 per ton reduction $1.25 $1.00 per ton reduction per ton reduction |
|
|
Arch has added $600 million of cash on hand Arch completed a comprehensive financing plan to provide an incremental $600 million of cash on the balance sheet $250 million incremental senior secured term loan, under existing $1.4 billion term loan agreement $375 million senior unsecured notes Concurrently, Arch addressed terms in its existing senior secured revolving credit facility Reducing borrowing capacity under revolver to $350 million from $600 million in conjunction with term loan increase Amended covenants Slide 14 Cash and Investments (in millions) Total Liquidity Available (in millions) Cash Unused borrowing capacity $1,016 $650 $1,246 $1,481 *Proforma amounts as of 9/30/2012 adjusted for new financing |
|
|
Arch has further increased its cash position while maintaining its current maturity profile Arch has no long-term debt maturities until 2016 $1.5 billion in total liquidity Amended revolving credit facility to provide additional financial flexibility No change in the company’s net debt-to-capital ratio Slide 15 **Proforma amounts as of 9/30/2012 adjusted for new financing Pro Forma Debt Maturity Profile** (in $ millions) Short-term debt Existing, unsecured bonds Term loan New financing $375 new senior notes $250 incremental term loan $1.2 billion in cash and investments *2016 bonds are callable in August 2013 |
|
|
Arch is well-positioned to benefit as coal markets improve Current downturn is primarily cyclical, and Arch’s diversified operations, competitive cost position and enhanced liquidity position will allow it to emerge as an even stronger player Slide 16 Flexible Capital Structure Current Focus Manage capital Control costs Rationalize supply Continue met development Maximize value of asset base As Cycle Turns Reduce leverage Invest in the business via organic and strategic growth Return capital to stakeholders Maximize value of asset base |
|
|
Outlook for Coal Markets |
|
|
Slide 18 Global metallurgical markets are in the process of bottoming out We believe global metallurgical markets are over supplied by 10 million to 15 million metric tonnes today, and recent benchmark settlement prices have fallen below the cost of many producers. Supply has responded, with reductions in Australia, the U.S. and elsewhere — and further cuts are underway. Benchmark Hard Coking Coal Price (in US $/metric tonne) Sources: AME, CRV, ACI and Bank of America Merrill Lynch (estimates based on publicly available information) Cumulative Announced Supply Reductions to Date in 2012 (in millions of tonnes) 1Q12 2Q12 3Q12 4Q12 1Q12 2Q12 3Q12 4Q12 ~30 5 |
|
|
We expect continued strength in met coal markets – based on projected growth in global steel consumption Slide 19 World steel consumption is projected to increase more than 40 percent from expected 2012 level of 1.6 billion tonnes World Steel Production (in billions of tonnes of crude steel) Sources: ACI, World Steel Association and Steel Business Briefing Global Metallurgical Coal Use (in billions of tonnes of coal) + 2000 2020 2.2 0 .8 Demand for met coal will be driven by increased utilization at existing steel plants and the projected build-out of new steel capacity |
|
|
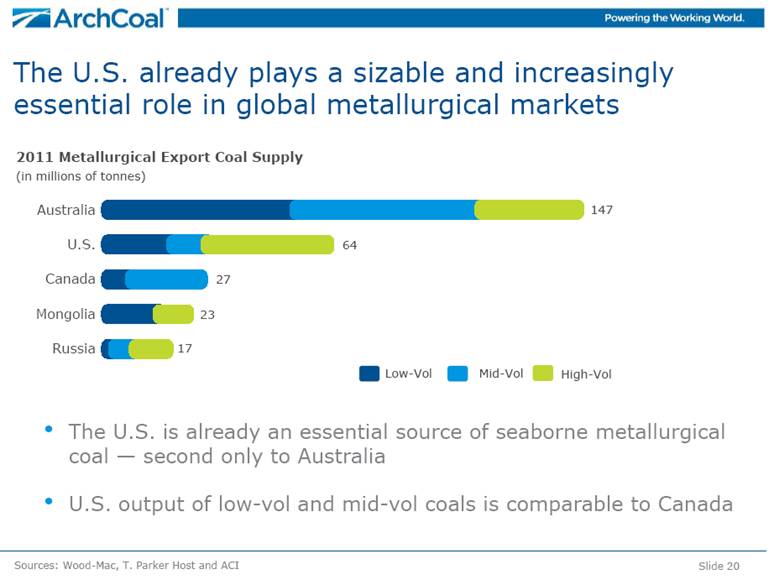
The U.S. already plays a sizable and increasingly essential role in global metallurgical markets Slide 20 Sources: Wood-Mac, T. Parker Host and ACI 2011 Metallurgical Export Coal Supply (in millions of tonnes) Low-Vol Mid-Vol High-Vol The U.S. is already an essential source of seaborne metallurgical coal — second only to Australia U.S. output of low-vol and mid-vol coals is comparable to Canada |
|
|
Slide 21 Nations around the world are building coal plants to fuel electricity needs Sources: ACI and Platts International, estimates based on plants currently under construction or planned Africa Europe CIS Countries Middle East Other Asia 31 United States 6 Latin America 5 China 118 97 India 8 3 16 4 Under construction 288 GW 850 mm tonnes Total by 2015 470 GW 1.4 bn tonnes New Coal-Fueled Generation Coming Online by 2015 Capacity under construction, in GW, from 2012-2015 |
|
|
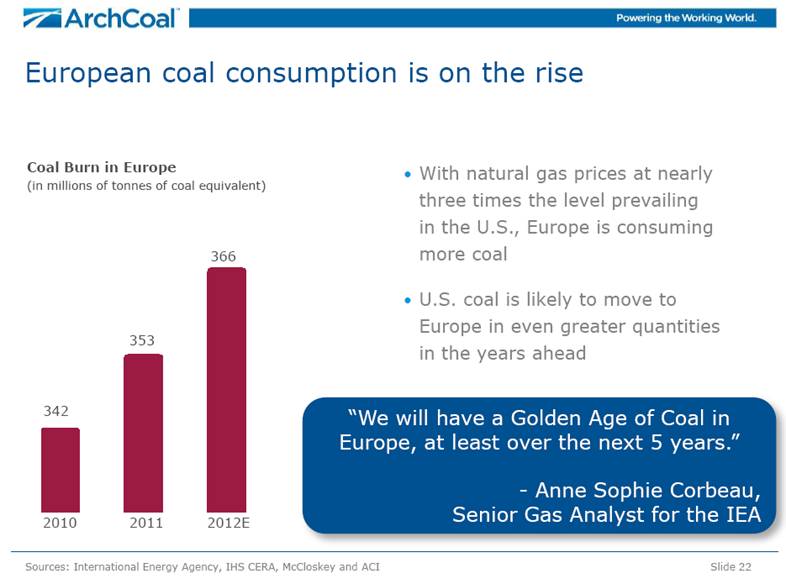
European coal consumption is on the rise With natural gas prices at nearly three times the level prevailing in the U.S., Europe is consuming more coal U.S. coal is likely to move to Europe in even greater quantities in the years ahead Slide 22 Sources: International Energy Agency, IHS CERA, McCloskey and ACI Coal Burn in Europe (in millions of tonnes of coal equivalent) 2010 2011 2012E “We will have a Golden Age of Coal in Europe, at least over the next 5 years.” - Anne Sophie Corbeau, Senior Gas Analyst for the IEA |
|
|
Slide 23 China and India are projected to import 1.5 billion tonnes of coal by 2030 Significant growth in seaborne coal export supply will be required to meet the growing demands of the industrial revolution in Asia. Seaborne Coal Imports (in millions of tonnes) China India Sources: ACI, Wood Mackenzie |
|
|
Planned U.S. port expansions will support a more than doubling of coal exports over the next five years to serve global markets NS/Lamberts 32 DTA 20 CNX Marine 16 Pier IX 14 PA 9 CSX/Curtis Bay 9 Ridley** 4 Westshore** 4 MBT 15 SSA Marine 15 Other Northwest 10 CA 2 Mobile 18 Other AL 5 Charleston 8 U.S. Exports (in millions of tons) Sources: ACI, NMA, Port Terminal Presentations *Includes overland shipments to Canada/Mexico **Capacity available for U.S. sourced volumes Slide 24 Deepwater 10 Other Texas 5 IMT 17 United 11 Burnside 10 Convent 8 Mid-streaming 20 Great Lakes 8 West Coast 50 Southwest 15 Gulf Coast 66 East Coast 100 Midwest 8 Southeast 31 Actual Projected Capacity |
|
|
In U.S. coal markets, stockpiles are expected to stabilize by year end Slide 25 Sources: EIA and ACI After a record build by May 2012, coal stockpiles at U.S. generators could decline to 177 million tons at year end – on par with past two years Coal stockpiles still ~25 million tons above target From 2007-2011, a normal drawdown of stockpiles in winter was 15 million tons In the winter of 2011/12, there was actually a build of 19 million tons Estimated Coal Stockpile Levels at U.S. Power Generators (in millions of tons, at December 31) 150-155 million ton target |
|
|
Slide 26 112 123 156 131 142 77 112 123 156 131 (in millions of tons) 2011 2012E change 2013P change Power generation use 928 (102) U.S. coal exports 106 +19 Industrial use 50 (3) Domestic metallurgical 21 +1 U.S. demand 1,105 ~(85) Domestic supply* 1,095 (78) Imports 12 (5) U.S. supply 1,107 ~(83) Year-end stockpiles 175 +2 We expect improving trends in 2013, leading to a further correction in U.S. coal stockpiles Sources: EIA, IHS CERA and ACI *Includes waste coal Arch expects U.S. coal consumption to increase by more than 50 million tons in 2013 Some well-respected third-party sources are projecting an even stronger recovery, with demand rebounding back to 2011 levels in 2013 |
|
|
Powder River Basin coal has a compelling story when compared to natural gas Slide 27 Sources: ACI, EIA, Ventyx PRB Parity with Natural Gas* (coal = $ per ton; gas = $ per million Btu) *Assumes transportation charge of $20 to $25 per ton; incremental VOM non-fuel costs; and appropriate heat rate differentials for NGCC plants and coal plants. PRB is the most cost competitive fossil fuel source in the U.S. Opportunity for PRB prices to increase even in a low-priced natural gas environment Natural Gas |
|
|
Slide 28 In the U.S., EPA regulations will force coal plant retirements — but at-risk plants are already operating at very low capacity factors Sources: ACI, Ventyx and EIA *Projected 2012 consumption based on 1Q12 data U.S. Coal Fleet (in gigawatts of capacity) Coal Consumption by At-Risk Plants (in millions of tons) Capacity at risk of retiring by 2018 Expected capacity to remain online |
|
|
Growing U.S. population trends should boost retail/commercial power demand. A manufacturing renaissance in the U.S. could also spark industrial load again. These demand drivers should increase coal plant capacity utilization to levels achieved in the past, offsetting any impact from coal plant retirements. Growth in U.S. coal consumption at surviving plants could offset the impact of coal plant retirements Slide 29 U.S. Population (in millions of people) U.S. Industrial Load (in million megawatt hours) U.S. Coal Plant Utilization (Remaining 280 gigawatts) 300 325 2010 2020 Sources: Ventyx , U.S. Census Bureau and ACI 1.0 0.8 ? +100-150 million tons |
|
|
Arch Coal, Inc. Investor Presentation November 2012 |