Attached files
| file | filename |
|---|---|
| 8-K - 8-K - STAAR SURGICAL CO | v329270_8k.htm |
(NASDAQ: STAA) Non - Deal Road Show November 27 - 29, 2012 ® “Fastest growing refractive technology in the world.”
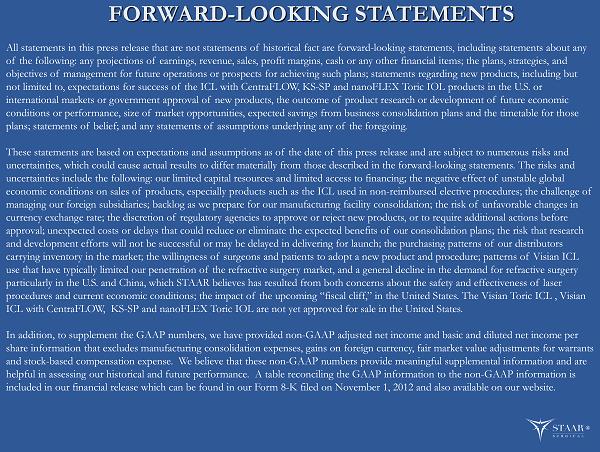
FORWARD - LOOKING STATEMENTS All statements in this press release that are not statements of historical fact are forward - looking statements, including statem ents about any of the following: any projections of earnings, revenue, sales, profit margins, cash or any other financial items; the plans, str ategies, and objectives of management for future operations or prospects for achieving such plans; statements regarding new products, incl udi ng but not limited to, expectations for success of the ICL with CentraFLOW, KS - SP and nanoFLEX Toric IOL products in the U.S. or international markets or government approval of new products, the outcome of product research or development of future econom ic conditions or performance, size of market opportunities, expected savings from business consolidation plans and the timetable fo r those plans; statements of belief; and any statements of assumptions underlying any of the foregoing. These statements are based on expectations and assumptions as of the date of this press release and are subject to numerous r isk s and uncertainties, which could cause actual results to differ materially from those described in the forward - looking statements. The risks and uncertainties include the following: our limited capital resources and limited access to financing; the negative effect of un sta ble global economic conditions on sales of products, especially products such as the ICL used in non - reimbursed elective procedures; the ch allenge of managing our foreign subsidiaries; backlog as we prepare for our manufacturing facility consolidation; the risk of unfavorabl e c hanges in currency exchange rate; the discretion of regulatory agencies to approve or reject new products, or to require additional act ion s before approval; unexpected costs or delays that could reduce or eliminate the expected benefits of our consolidation plans; the ris k t hat research and development efforts will not be successful or may be delayed in delivering for launch; the purchasing patterns of our dis tri butors carrying inventory in the market; the willingness of surgeons and patients to adopt a new product and procedure; patterns of Vis ian ICL use that have typically limited our penetration of the refractive surgery market, and a general decline in the demand for refractive surgery particularly in the U.S. and China, which STAAR believes has resulted from both concerns about the safety and effectiveness o f l aser procedures and current economic conditions; the impact of the upcoming “fiscal cliff,” in the United States. The Visian Toric ICL , Visian ICL with CentraFLOW, KS - SP and nanoFLEX Toric IOL are not yet approved for sale in the United States. In addition, to supplement the GAAP numbers, we have provided non - GAAP adjusted net income and basic and diluted net income per share information that excludes manufacturing consolidation expenses, gains on foreign currency, fair market value adjustment s f or warrants and stock - based compensation expense. We believe that these non - GAAP numbers provide meaningful supplemental information and ar e helpful in assessing our historical and future performance. A table reconciling the GAAP information to the non - GAAP informatio n is included in our financial release which can be found in our Form 8 - K filed on November 1, 2012 and also available on our website. ®

STAAR Positioned Well for Strong Top Line and Bottom Line Growth Two Large M arket O pportunities Sustainable Competitive Advantages New Product O fferings in 2012/2013 Robust New Product Pipeline Strong Balance Sheet Manufacturing Consolidations L ead to Big S avings S tarting in 2014 ®
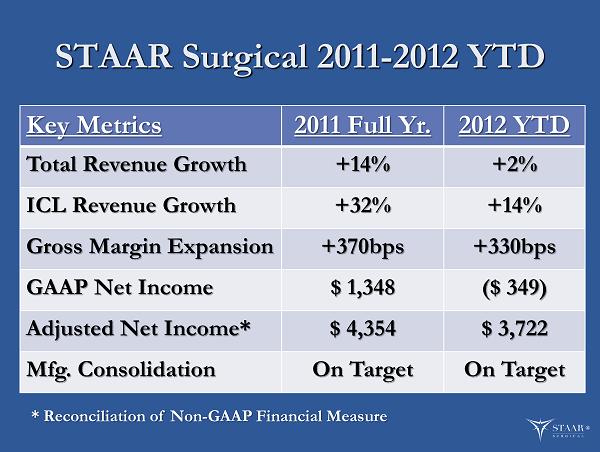
STAAR Surgical 2011 - 2012 YTD Key Metrics 2011 Full Yr. 2012 YTD Total Revenue Growth +14% +2% ICL Revenue Growth +32% +14% Gross Margin Expansion +370bps +330bps GAAP Net Income $ 1,348 ($ 349) Adjusted Net Income* $ 4,354 $ 3,722 Mfg. Consolidation On Target On Target ® * Reconciliation of Non - GAAP Financial Measure
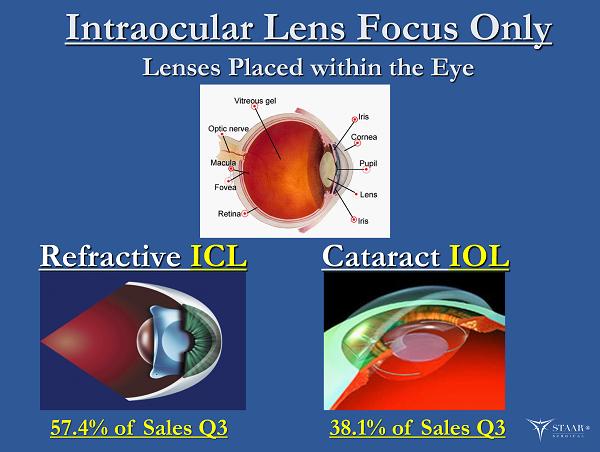
Intraocular Lens Focus Only Lenses Placed within the Eye Cataract IOL Refractive ICL 57.4% of Sales Q3 38.1% of Sales Q3 ®

STAAR’s Value Driver The Visian ICL In 2011 $32 million sales/$60M end customer Growth rate 14% YTD 2012 85% Gross Margins New Product Launches $3 Billion Addressable Market Currently about 2% Market Share 10% average share in Focused Markets would yield nearly $300M of end customer revenues ®
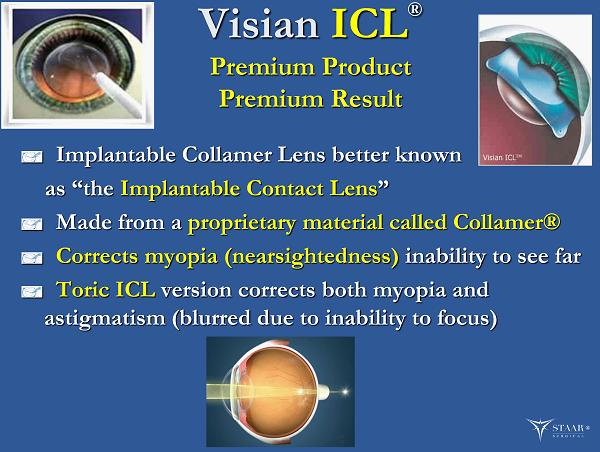
Visian ICL ® Premium Product Premium Result Implantable Collamer Lens better known as “the I mplantable Contact Lens ” Made from a proprietary material called Collamer® Corrects myopia (nearsightedness) inability to see far Toric ICL version corrects both myopia and astigmatism (blurred due to inability to focus) ®
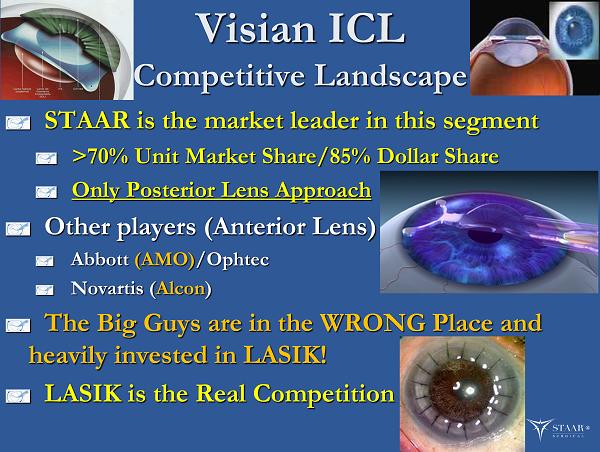
Visian ICL Competitive Landscape STAAR is the market leader in this segment >70% Unit Market Share/85% Dollar Share Only Posterior Lens Approach Other players (Anterior Lens) Abbott (AMO) /Ophtec Novartis ( Alcon ) The Big Guys are in the WRONG Place and heavily invested in LASIK! LASIK is the Real Competition ®

ICL vs. LASIK Small micro incision Adds a lens into the eye Permanent but removable No induced dry eye Future options preserved Incision over 1 inch - long Burns material away Cannot be reversed Potential dry eye induced May reduce future options Plus eyes in which LASIK is contraindicated . ®
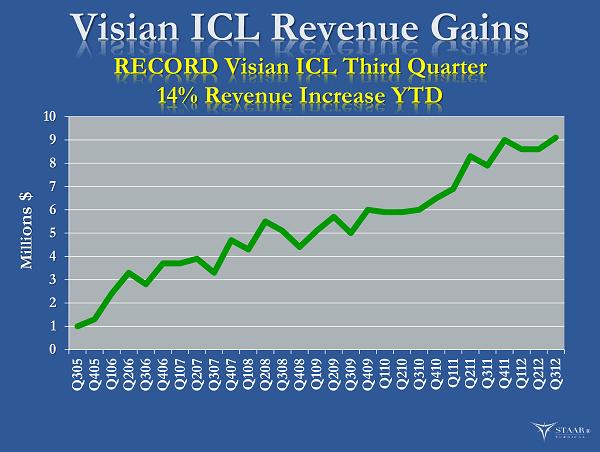
Visian ICL Revenue Gains R ECORD Visian ICL Third Quarter 14% Revenue Increase YTD 0 1 2 3 4 5 6 7 8 9 10 Q305 Q405 Q106 Q206 Q306 Q406 Q107 Q207 Q307 Q407 Q108 Q208 Q308 Q408 Q109 Q209 Q309 Q409 Q110 Q210 Q310 Q410 Q111 Q211 Q311 Q411 Q112 Q212 Q312 Milli ons $ ®
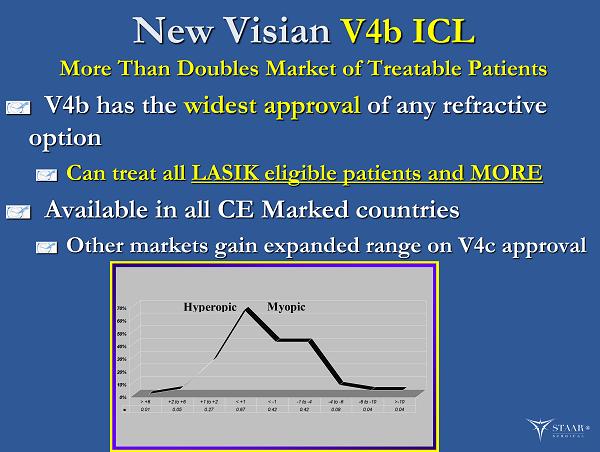
New Visian V4b ICL More Than Doubles Market of Treatable Patients V4b has the widest approval of any refractive option Can treat all LASIK eligible patients and MORE Available in all CE Marked countries Other markets gain expanded range on V4c approval ® 0% 10% 20% 30% 40% 50% 60% 70% 0.01 0.05 0.27 0.67 0.42 0.42 0.08 0.04 0.04 > +6 +2 to +6 +1 to +2 < +1 < -1 -1 to -4 -4 to -6 -6 to -10 >-10 Hyperopic Myopic
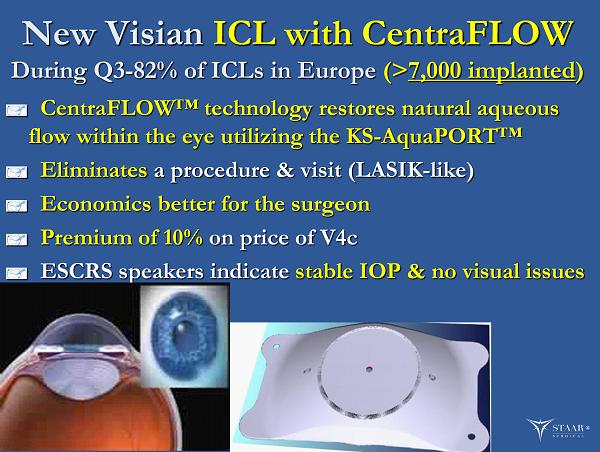
New Visian ICL with CentraFLOW During Q3 - 82% of ICLs in Europe (> 7,000 implanted ) CentraFLOW™ technology restores natural aqueous flow within the eye utilizing the KS - AquaPORT™ Eliminates a procedure & visit (LASIK - like ) Economics better for the surgeon P remium of 10% on price of V4c ESCRS speakers indicate stable IOP & no visual issues ®
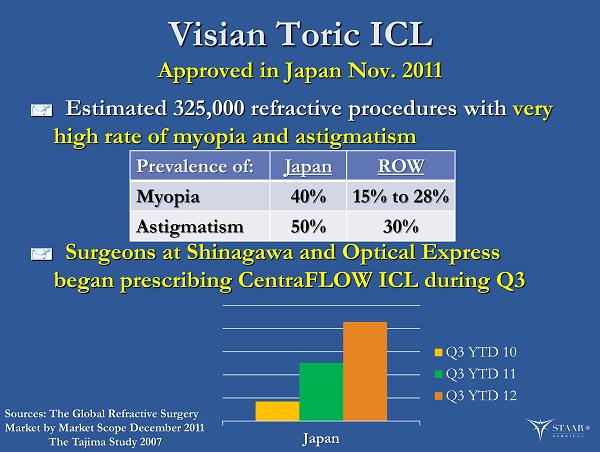
Visian Toric ICL Approved in Japan Nov. 2011 Estimated 325,000 refractive procedures with very high rate of myopia and astigmatism Surgeons at Shinagawa and Optical Express began prescribing CentraFLOW ICL during Q3 Prevalence of: Japan ROW Myopia 40% 15% to 28% Astigmatism 50% 30% Sources: The Global Refractive Surgery Market by Market Scope December 2011 The Tajima Study 2007 ® Japan Q3 YTD 10 Q3 YTD 11 Q3 YTD 12
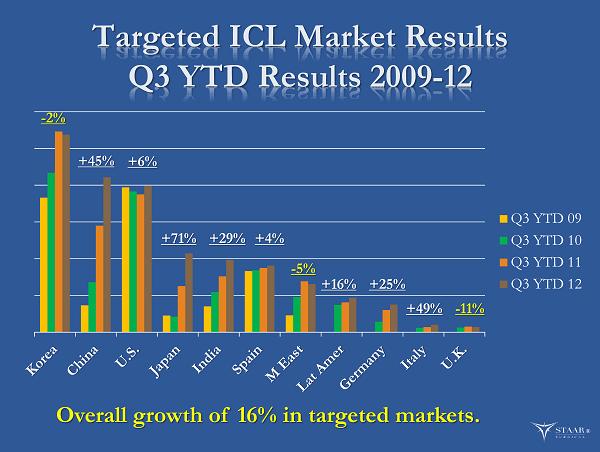
Targeted ICL Market Results Q3 YTD Results 2009 - 12 Q3 YTD 09 Q3 YTD 10 Q3 YTD 11 Q3 YTD 12 ® Overall growth of 16% in targeted markets. - 2% +45% +6% +71% +29% +4% - 5% +16% +25% +49% - 11%
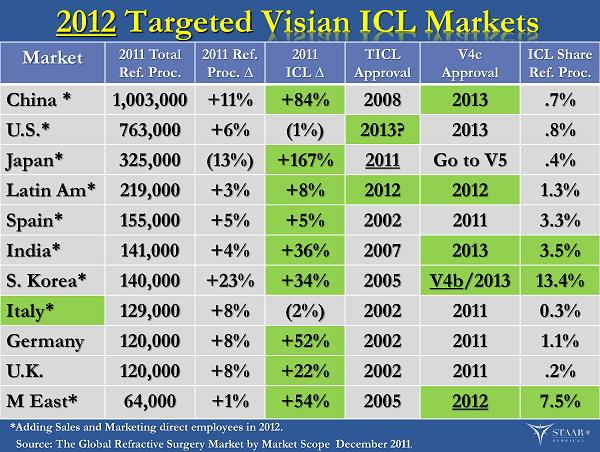
2012 Targeted Visian ICL Markets Market 2011 Total Ref. Proc. 2011 Ref. Proc. ∆ 2011 ICL ∆ TICL Approval V4c Approval ICL Share Ref. Proc. China * 1,003,000 +11% +84% 2008 2013 .7% U.S. * 763,000 +6% (1%) 2013? 2013 .8% Japan * 325,000 (13%) +167% 2011 Go to V5 .4% Latin Am * 219,000 +3% +8% 2012 2012 1.3% Spain * 155,000 +5% +5% 2002 2011 3.3% India * 141,000 +4% +36% 2007 2013 3.5% S. Korea * 140,000 +23% +34% 2005 V4b /2013 13.4% Italy * 129,000 +8% (2%) 2002 2011 0.3% Germany 120,000 +8% +52% 2002 2011 1.1% U.K. 120,000 +8% +22% 2002 2011 .2% M East * 64,000 +1% +54% 2005 2012 7.5% Source: The Global Refractive Surgery Market by Market Scope December 2011 . *Adding Sales and Marketing direct employees in 2012. ®
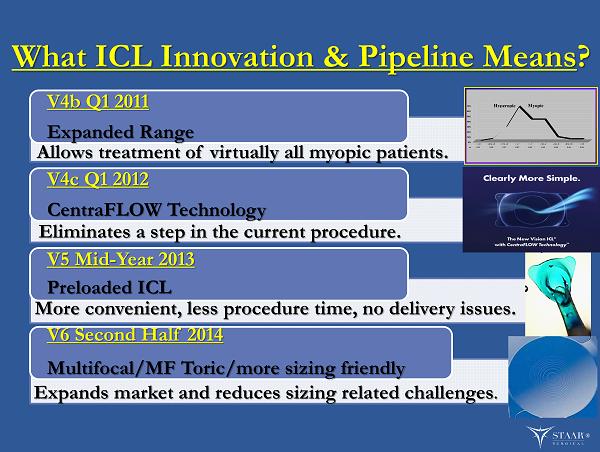
What ICL Innovation & Pipeline Means ? V4b Q1 2011 Expanded Range V4c Q1 2012 CentraFLOW Technology V5 Mid - Year 2013 Preloaded ICL V6 Second Half 2014 Multifocal/MF Toric/more sizing friendly ® Allows treatment of virtually all myopic patients. Eliminates a step in the current procedure. More convenient, less procedure time, no delivery issues. 0% 10% 20% 30% 40% 50% 60% 70% 0.01 0.05 0.27 0.67 0.42 0.42 0.08 0.04 0.04 > +6 +2 to +6 +1 to +2 < +1 < -1 -1 to -4 -4 to -6 -6 to -10 >-10 Hyperopic Myopic Expands market and reduces sizing related challenges .
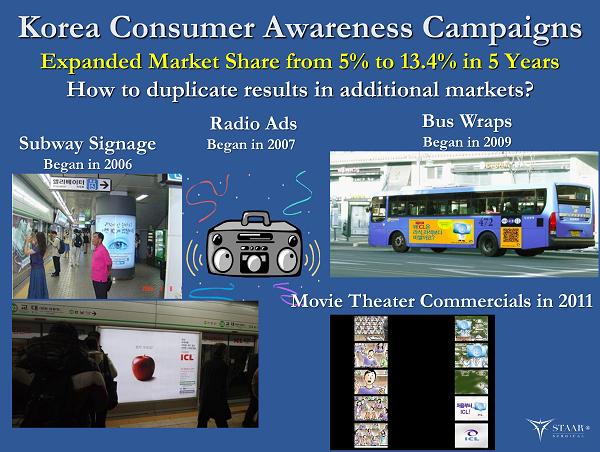
Korea Consumer Awareness Campaigns Expanded Market Share from 5% to 13.4% in 5 Years How to duplicate results in additional markets? Subway Signage Began in 2006 Radio Ads Began in 2007 Bus Wraps Began in 2009 Movie Theater Commercials in 2011 ®

Consumer Awareness A ctivities Online Marketing Objectives ICL Awareness, Adoption, Evangelism Online Advertising Acquire traffic and interested patients New Consumer Oriented ICL website Direct patient interest to ICL surgeons Practice development ICL in office displays Staff training ®
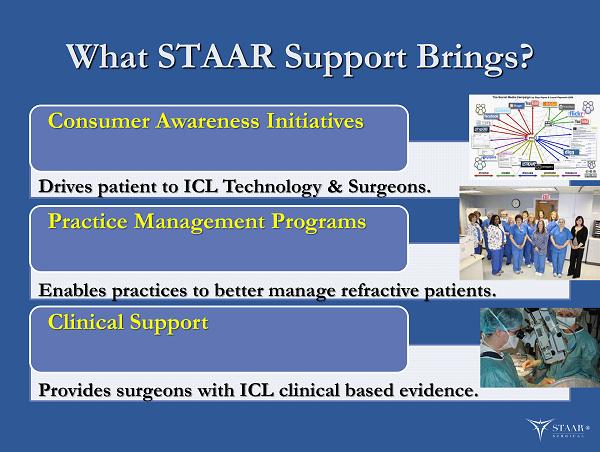
What STAAR Support Brings? Consumer Awareness Initiatives Practice Management Programs Clinical Support ® Drives patient to ICL Technology & Surgeons. Enables practices to better manage refractive patients. Provides surgeons with ICL clinical based evidence.
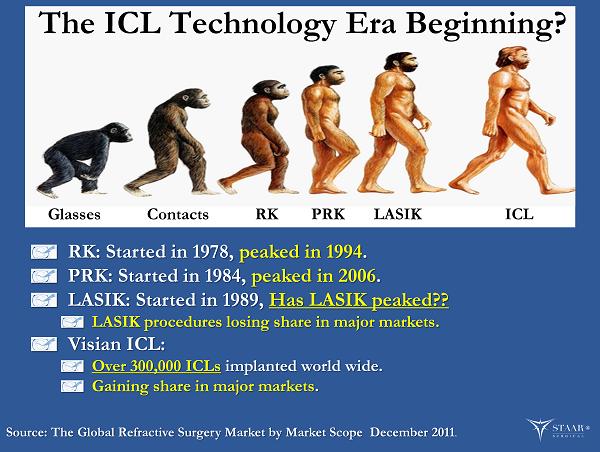
Glasses Contacts RK PRK LASIK ICL RK: Started in 1978, peaked in 1994 . PRK: Started in 1984, peaked in 2006 . LASIK: Started in 1989, Has LASIK peaked?? LASIK procedures losing share in major markets. Visian ICL: Over 300,000 ICLs implanted world wide. Gaining share in major markets . Source: The Global Refractive Surgery Market by Market Scope December 2011 . The ICL Technology Era Beginning? ®
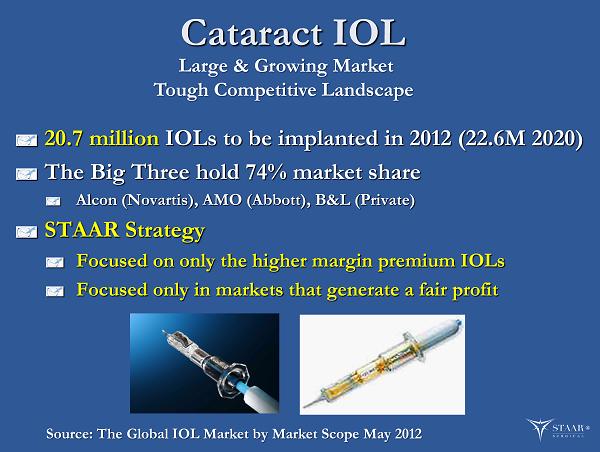
Cataract IOL 20.7 million IOLs to be implanted in 2012 (22.6M 2020) The Big Three hold 74% market share Alcon (Novartis), AMO (Abbott), B&L (Private) STAAR Strategy Focused on only the higher margin premium IOLs Focused only in markets that generate a fair profit Source: The Global IOL Market by Market Scope May 2012 Large & Growing Market Tough Competitive Landscape ®
Unique Collamer ® Material Proprietary hydrophilic material produces superior quality of vision (competitive advantage) 40% water content produces: Reduced glare or halo effect/No glistenings Four active material patents (first expires 2015 with some blocking patents till 2017) M anufacturing know - how most important (18 yrs ) We make our own raw material for Collamer Highly regulated area in both mfg. and pathway to approval Preliminary CAST data suggests “accommodation” potential ®
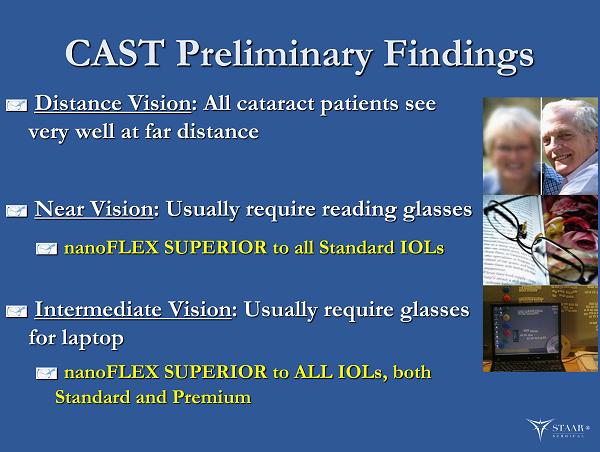
CAST Preliminary Findings Distance Vision : All cataract patients see very well at far distance Near Vision : Usually require reading glasses nanoFLEX SUPERIOR to all Standard IOLs Intermediate Vision : Usually require glasses for laptop nanoFLEX SUPERIOR to ALL IOLs, both Standard and Premium ®
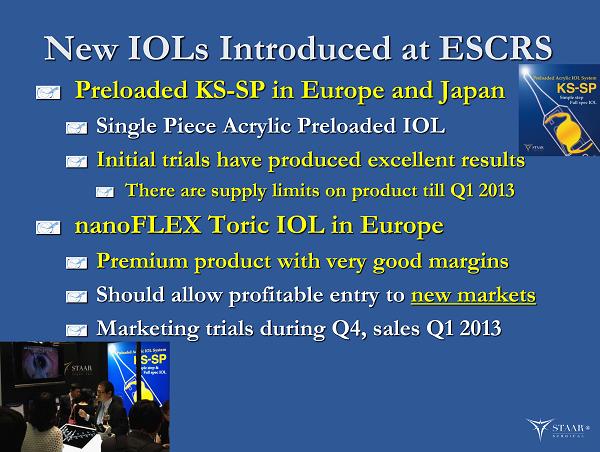
New IOLs Introduced at ESCRS Preloaded KS - SP in Europe and Japan Single Piece A crylic P reloaded IOL Initial trials have produced excellent results There are supply limits on product till Q1 2013 nanoFLEX Toric IOL in Europe Premium product with very good margins Should allow profitable entry to new markets Marketing trials during Q4, sales Q1 2013 ®
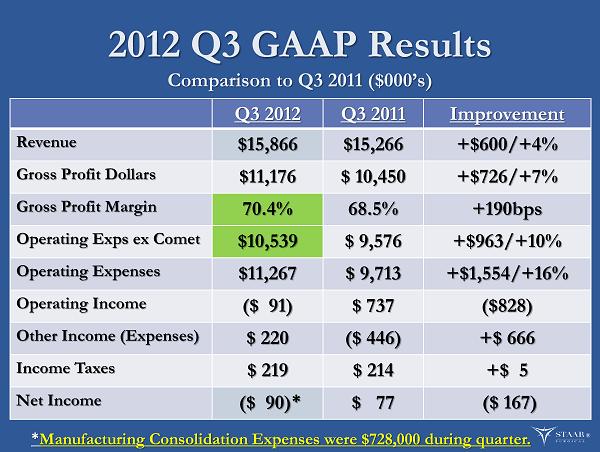
2012 Q3 GAAP Results Comparison to Q3 2011 ($000’s) Q3 2012 Q3 2011 Improvement Revenue $15,866 $15,266 +$600/+4% Gross Profit Dollars $11,176 $ 10,450 +$726/+7% Gross Profit Margin 70.4% 68.5% +190 bps Operating Exps ex Comet $10,539 $ 9,576 +$963/+10% Operating Expenses $11,267 $ 9,713 +$1,554/+16% Operating Income ($ 91) $ 737 ($828) Other Income (Expenses) $ 220 ($ 446) +$ 666 Income Taxes $ 219 $ 214 +$ 5 Net Income ($ 90 ) * $ 77 ($ 167 ) ® * Manufacturing Consolidation Expenses were $728,000 during quarter.
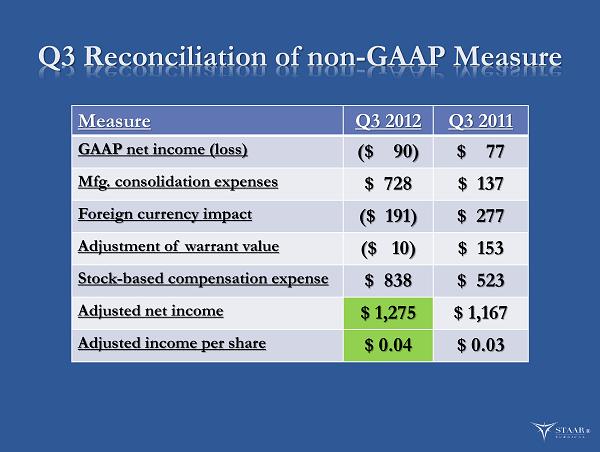
Q3 Reconciliation of non - GAAP M easure Measure Q3 2012 Q3 2011 GAAP net income (loss) ($ 90) $ 77 Mfg. consolidation expenses $ 728 $ 137 Foreign currency impact ($ 191) $ 277 Adjustment of warrant value ($ 10) $ 153 Stock - based compensation expense $ 838 $ 523 Adjusted net income $ 1,275 $ 1,167 Adjusted income per share $ 0.04 $ 0.03 ®

Expanding Gross Margins With ICL Product Mix Gains 0.0% 10.0% 20.0% 30.0% 40.0% 50.0% 60.0% 70.0% 80.0% 2007 2008 2009 2010 2011 YTD 2012 GM% IOL Mix ICL Mix Gross margins have expanded from 49.0% to 70.4%. Q3 Mix: ICLs at 57.4% and IOLs at 38.1%. ®
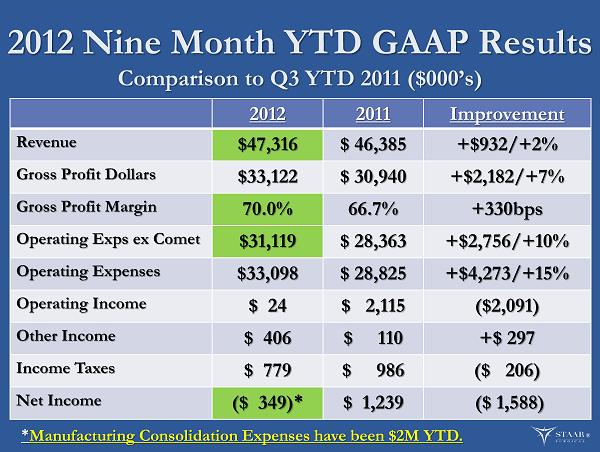
2012 Nine Month YTD GAAP Results Comparison to Q3 YTD 2011 ($000’s) 2012 2011 Improvement Revenue $47,316 $ 46,385 +$932/+2% Gross Profit Dollars $33,122 $ 30,940 +$2,182/+7% Gross Profit Margin 70.0% 66.7% +330 bps Operating Exps ex Comet $31,119 $ 28,363 +$2,756/+10% Operating Expenses $33,098 $ 28,825 +$4,273/+15% Operating Income $ 24 $ 2,115 ($2,091) Other Income $ 406 $ 110 +$ 297 Income Taxes $ 779 $ 986 ($ 206) Net Income ($ 349 ) * $ 1,239 ($ 1,588 ) ® * Manufacturing Consolidation Expenses have been $2M YTD.
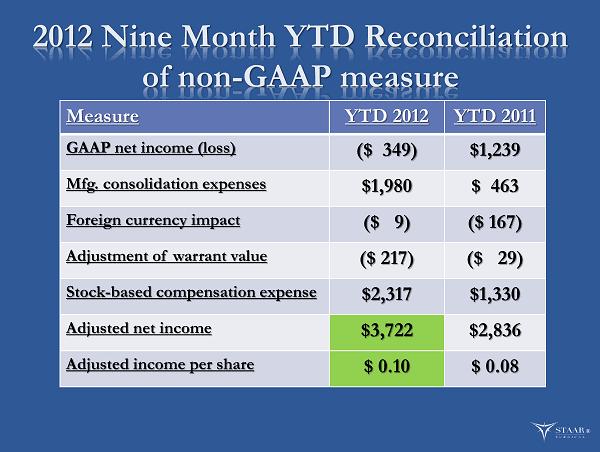
2012 Nine Month YTD Reconciliation of non - GAAP measure Measure YTD 2012 YTD 2011 GAAP net income (loss) ($ 349) $ 1,239 Mfg. consolidation expenses $ 1,980 $ 463 Foreign currency impact ($ 9) ($ 167) Adjustment of warrant value ($ 217) ($ 29) Stock - based compensation expense $2,317 $1,330 Adjusted net income $ 3,722 $2,836 Adjusted income per share $ 0.10 $ 0.08 ®

“The Cash Story” Record nearly $20M in Cash Q3 2012 Q3 2011 Net income (loss) ($ 90) $ 77 Non - cash $ 1,446 $ 1,320 Working capital $ 1,124 $ 1,102 Cash provided by operations $ 2,480 $ 2,499 Cash used in investing activities ($ 329) ($ 514) Cash provided by financing activities ($ 30) $ 1,583 Exchange $ 88 $ 187 Increase in cash $ 2,209 $ 3,755 Cash, at beginning of period $17,544 $ 13,000 Cash, at end of period $19,753 $16,755 ®
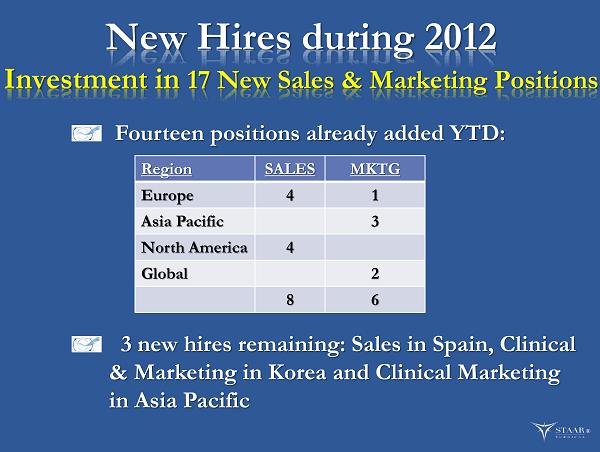
New Hires during 2012 Investment in 17 New Sales & Marketing Positions ® Region SALES MKTG Europe 4 1 Asia Pacific 3 North America 4 Global 2 8 6 Fourteen positions already added YTD: 3 new hires remaining: Sales in Spain, Clinical & Marketing in Korea and Clinical Marketing in Asia Pacific

STAAR Balance Sheet Profitable non - GAAP & Generating Cash $2.5M generated from operations in Q3 $19.8M in Cash end of Q3 Company Debt Free Only a working line of credit in Japan $121M in NOLs (Worth $1 a share) 36 million diluted shares outstanding 1.4 million warrants at approximately $4 ®
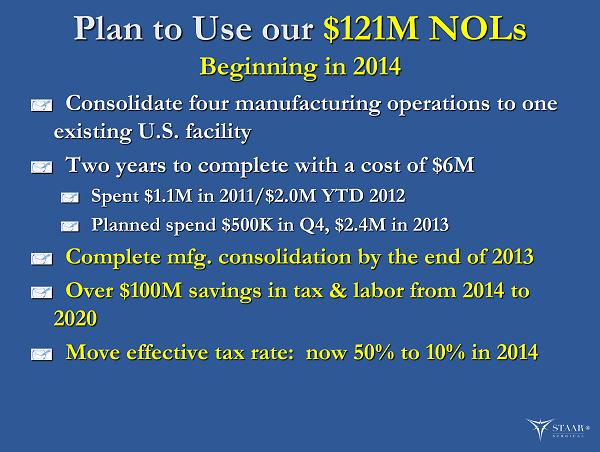
Plan to Use our $121M NOLs Beginning in 2014 Consolidate four manufacturing operations to one existing U.S. facility Two years to complete with a cost of $6M Spent $1.1M in 2011/$2.0M YTD 2012 Planned spend $500K in Q4, $2.4M in 2013 Complete mfg. consolidation by the end of 2013 Over $100M savings in tax & labor from 2014 to 2020 Move effective tax rate: now 50% to 10% in 2014 ®
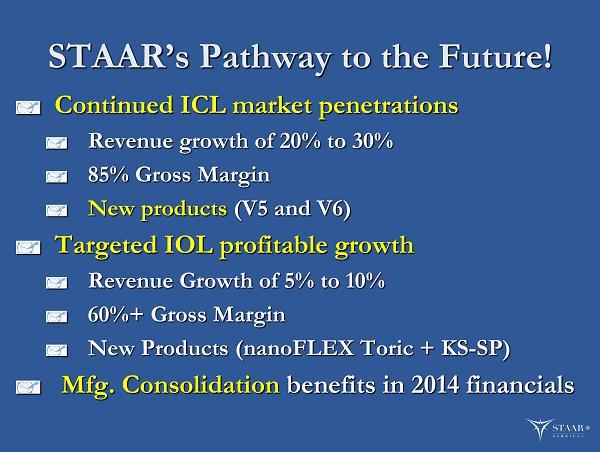
STAAR’s Pathway to the Future! Continued ICL market penetrations Revenue growth of 20% to 30% 85% Gross Margin New products (V5 and V6) Targeted IOL profitable growth Revenue Growth of 5% to 10% 60 %+ Gross Margin New Products (nanoFLEX Toric + KS - SP) Mfg. Consolidation benefits in 2014 financials ®
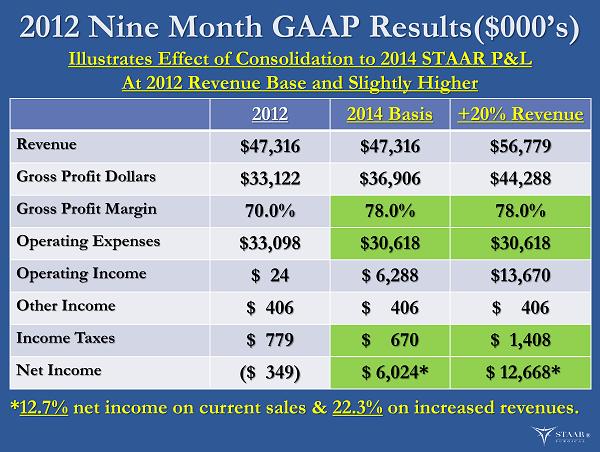
2012 Nine Month GAAP Results ($000’s ) Illustrates Effect of Consolidation to 2014 STAAR P&L At 2012 Revenue Base and Slightly Higher 2012 2014 Basis +20% Revenue Revenue $47,316 $47,316 $56,779 Gross Profit Dollars $33,122 $36,906 $44,288 Gross Profit Margin 70.0% 78.0% 78.0% Operating Expenses $33,098 $30,618 $30,618 Operating Income $ 24 $ 6,288 $13,670 Other Income $ 406 $ 406 $ 406 Income Taxes $ 779 $ 670 $ 1,408 Net Income ($ 349 ) $ 6,024* $ 12,668* ® * 12.7% net income on current sales & 22.3% on increased revenues.

(NASDAQ: STAA) Non - Deal Road Show November 27 - 29, 2012 ® “Fastest growing refractive technology in the world.”