Attached files
| file | filename |
|---|---|
| 8-K - FORM 8-K - Nationstar Mortgage Holdings Inc. | d443748d8k.htm |
Exhibit 99.1
|
|

Exhibit 99.1
2012 FBR Fall Investor Conference
November 27, 2012
Financial data as of September 30, 2012
|
|

Forward Looking Statements
Any statements in this presentation that are not historical or current facts are forward-looking statements. Forward-looking statements include, without limitation, statements concerning plans, objectives, goals, projections, strategies, future events or performance, and underlying assumptions and other statements, which are not statements of historical facts. Forward-looking statements convey Nationstar Mortgage Holdings Inc.’s (“Nationstar”) current expectations or forecasts of future events. When used in this presentation, the words “anticipate,” “appears,” “believe,” “foresee,” “intend,” “should,” “expect,” “estimate,” “target,” “project,” “plan,” “may,” “could,” “will,” “are likely” and similar expressions are intended to identify forward-looking statements These statements involve predictions of our future financial condition, performance, plans and strategies, and are thus dependent on a number of factors including, without limitation, assumptions and data that may be imprecise or incorrect. Specific factors that may impact performance or other predictions of future actions have, in many but not all cases, been identified in connection with specific forward-looking statements. Forward-looking statements involve known and unknown risks, uncertainties and other factors that may cause Nationstar’s actual results, performance or achievements to be materially different from any future results, performances or achievements expressed or implied by the forward-looking statements. Certain of these risks and uncertainties are described in the “Risk Factors” section of Nationstar Mortgage LLC’s Form 10-K for the year ended December 31, 2011, Nationstar Mortgage Holdings Inc.’s Form 10-Q for the quarter ended June 30, 2012, and other reports filed with the SEC, which are available at the SEC’s website at http://www.sec.gov. We caution you not to place undue reliance on these forward-looking statements that speak only as of the date they were made. Unless required by law, Nationstar undertakes no obligation to publicly update or revise any forward-looking statements to reflect circumstances or events after the date of this presentation.
1
|
|
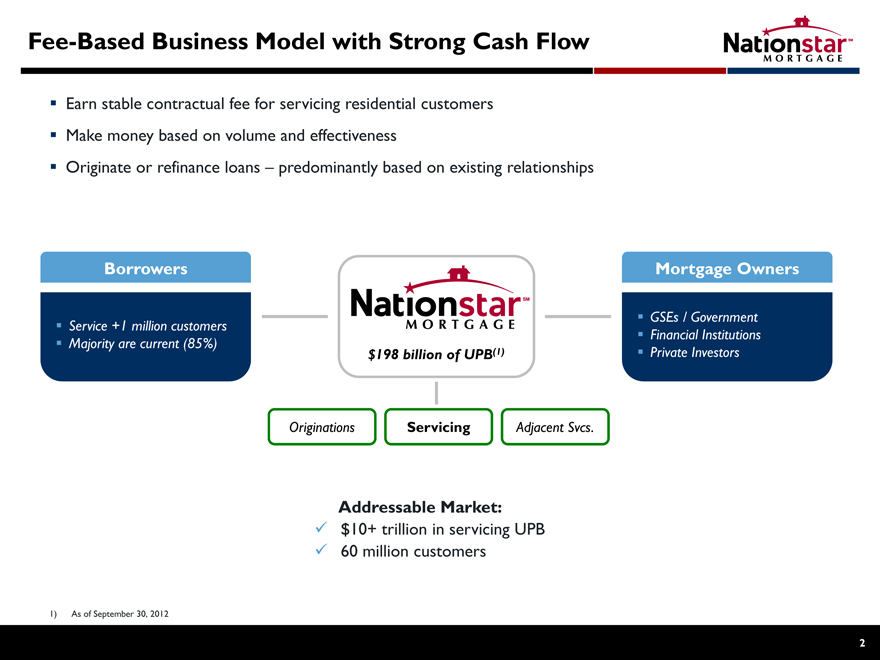
Fee-Based Business Model with Strong Cash Flow
Earn stable contractual fee for servicing residential customers Make money based on volume and effectiveness
Originate or refinance loans – predominantly based on existing relationships
Borrowers
Service +1 million customers Majority are current (85%)
Mortgage Owners
GSEs / Government Financial Institutions Private Investors
$198 billion of UPB(1)
Originations Servicing Adjacent Svcs.
Addressable Market: $10+ trillion in servicing UPB 60 million customers
1) As of September 30, 2012
2
|
|
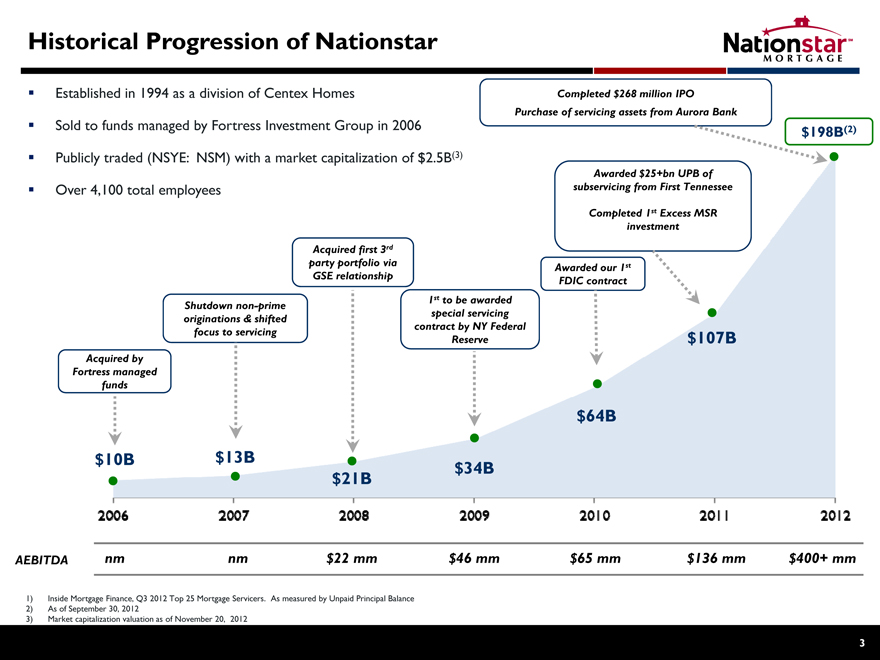
Historical Progression of Nationstar
Established in 1994 as a division of Centex Homes
Sold to funds managed by Fortress Investment Group in 2006 Publicly traded (NSYE: NSM) with a market capitalization of $2.5B(3) Over 4,100 total employees
Completed $268 million IPO
Purchase of servicing assets from Aurora Bank
$198B(2)
Awarded $25+bn UPB of subservicing from First Tennessee
Completed 1st Excess MSR investment
Acquired by Fortress managed funds
Shutdown non-prime originations & shifted focus to servicing
Acquired first 3rd party portfolio via GSE relationship
1st to be awarded special servicing contract by NY Federal Reserve
Awarded our 1st FDIC contract
$10B $13B
$21B
$34B
$64B
$107B
2006 2007 2008 2009 2010 2011 2012
AEBITDA nm nm $22 mm $46 mm $65 mm $136 mm $400+ mm
1) Inside Mortgage Finance, Q3 2012 Top 25 Mortgage Servicers. As measured by Unpaid Principal Balance
2) As of September 30, 2012
3) Market capitalization valuation as of November 20, 2012
3
|
|
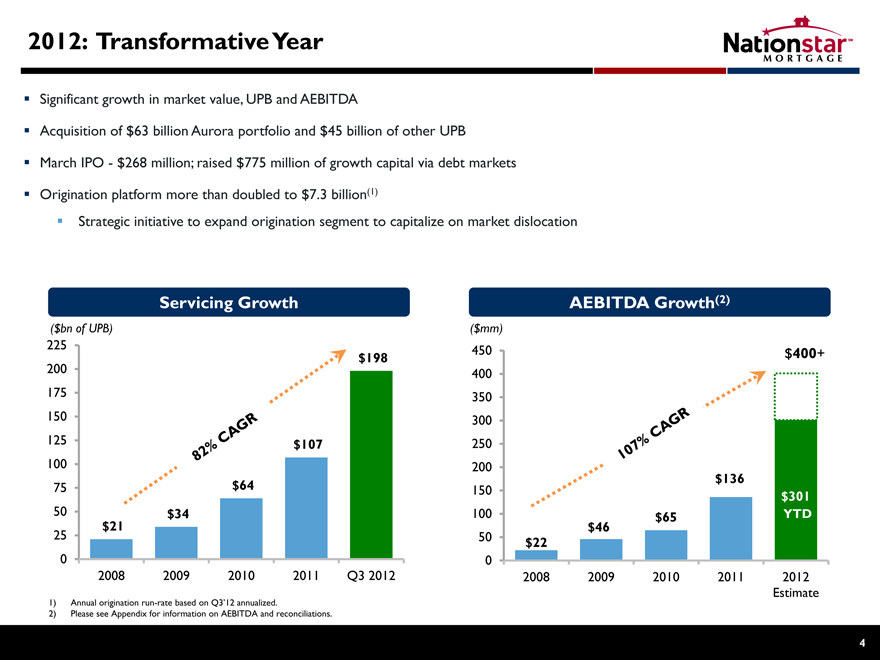
2012: Transformative Year
Significant growth in market value, UPB and AEBITDA
Acquisition of $63 billion Aurora portfolio and $45 billion of other UPB
March IPO—$268 million; raised $775 million of growth capital via debt markets
Origination platform more than doubled to $7.3 billion(1)
Strategic initiative to expand origination segment to capitalize on market dislocation
Servicing Growth
($bn of UPB)
225
$198
200
175
150
125 $107
100
75 $64
50 $34
25 $21
0
2008 2009 2010 2011 Q3 2012
AEBITDA Growth(2)
($mm)
450 $400+
400
350
300
250
200
$136
150 $301
100 $65 YTD
$46
50 $22
0
2008 2009 2010 2011 2012
Estimate
1) Annual origination run-rate based on Q3’12 annualized.
2) Please see Appendix for information on AEBITDA and reconciliations.
4
|
|
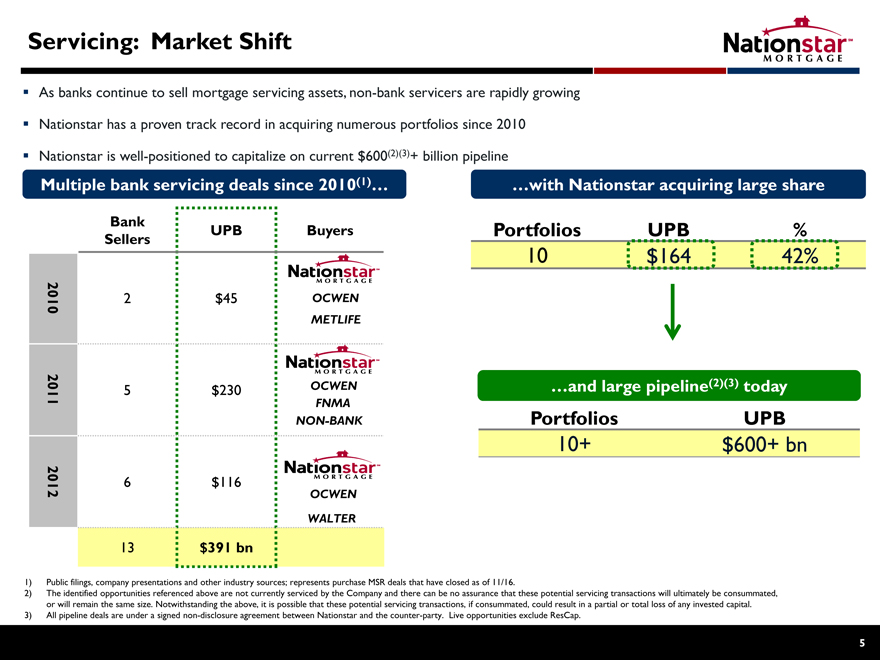
Servicing: Market Shift
As banks continue to sell mortgage servicing assets, non-bank servicers are rapidly growing Nationstar has a proven track record in acquiring numerous portfolios since 2010 Nationstar is well-positioned to capitalize on current $600(2)(3)+ billion pipeline
Multiple bank servicing deals since 2010(1)…
…with Nationstar acquiring large share
Bank UPB Buyers
Sellers
2010 2$45 OCWEN
METLIFE
2011 5 $230 OCWEN
FNMA
NON-BANK
2
012 6 $116 OCWEN
WALTER
13 $391 bn
Portfolios UPB %
10 $164 42%
…and large pipeline(2)(3) today
Portfolios UPB
10+ $600+ bn
1) Public filings, company presentations and other industry sources; represents purchase MSR deals that have closed as of 11/16.
2) The identified opportunities referenced above are not currently serviced by the Company and there can be no assurance that these potential servicing transactions will ultimately be consummated, or will remain the same size. Notwithstanding the above, it is possible that these potential servicing transactions, if consummated, could result in a partial or total loss of any invested capital.
3) All pipeline deals are under a signed non-disclosure agreement between Nationstar and the counter-party. Live opportunities exclude ResCap.
5
|
|
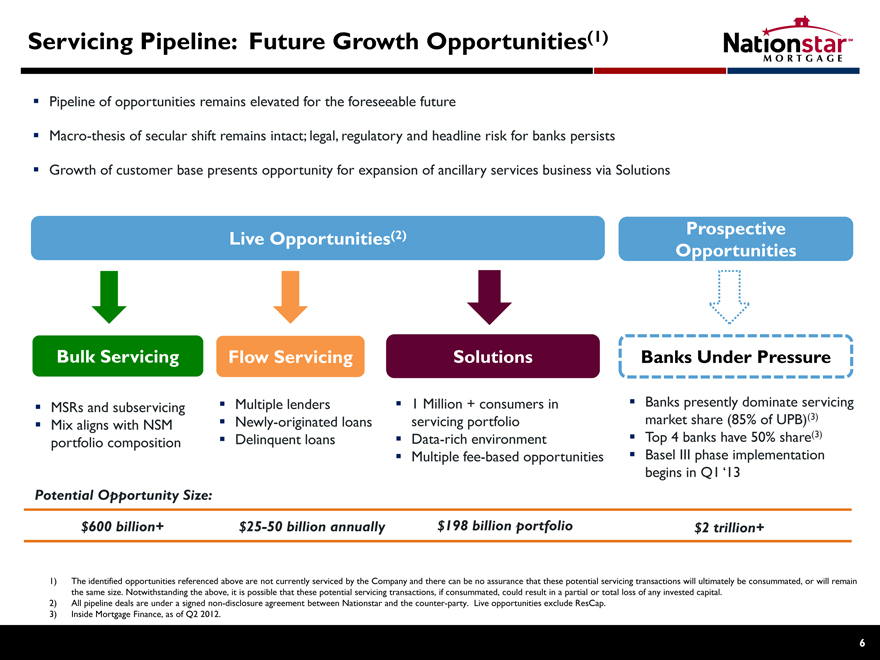
Servicing Pipeline: Future Growth Opportunities(1)
Pipeline of opportunities remains elevated for the foreseeable future
Macro-thesis of secular shift remains intact; legal, regulatory and headline risk for banks persists
Growth of customer base presents opportunity for expansion of ancillary services business via Solutions
Live Opportunities(2)
Prospective
Opportunities
Bulk Servicing Flow Servicing Solutions Banks Under Pressure
MSRs and subservicing Mix aligns with NSM portfolio composition
Multiple lenders Newly-originated loans Delinquent loans
1 Million + consumers in servicing portfolio Data-rich environment Multiple fee-based opportunities
Banks presently dominate servicing market share (85% of UPB)(3) Top 4 banks have 50% share(3) Basel III phase implementation begins in Q1 ‘13
Potential Opportunity Size:
$600 billion+ $25-50 billion annually $198 billion portfolio $2 trillion+
1) The identified opportunities referenced above are not currently serviced by the Company and there can be no assurance that these potential servicing transactions will ultimately be consummated, or will remain the same size. Notwithstanding the above, it is possible that these potential servicing transactions, if consummated, could result in a partial or total loss of any invested capital.
2) All pipeline deals are under a signed non-disclosure agreement between Nationstar and the counter-party. Live opportunities exclude ResCap.
3) Inside Mortgage Finance, as of Q2 2012.
6
|
|
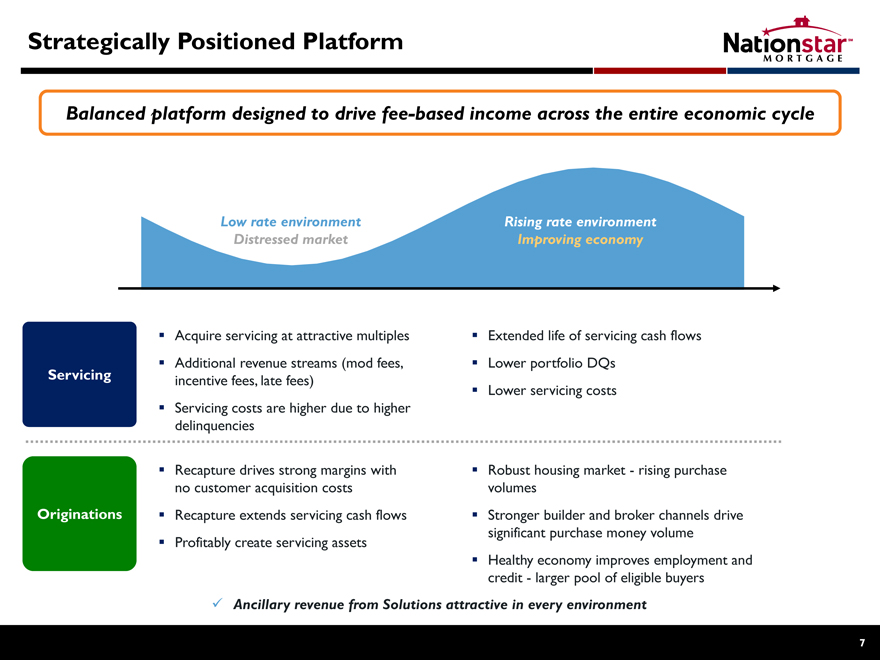
Strategically Positioned Platform
Balanced platform designed to drive fee-based income across the entire economic cycle
Low rate environment Distressed market
Rising rate environment Improving economy
Servicing
Originations
Acquire servicing at attractive multiples Additional revenue streams (mod fees, incentive fees, late fees) Servicing costs are higher due to higher delinquencies
Extended life of servicing cash flows Lower portfolio DQs Lower servicing costs
Recapture drives strong margins with no customer acquisition costs Recapture extends servicing cash flows Profitably create servicing assets
Robust housing market—rising purchase volumes Stronger builder and broker channels drive significant purchase money volume Healthy economy improves employment and credit—larger pool of eligible buyers
Ancillary revenue from Solutions attractive in every environment
7
|
|
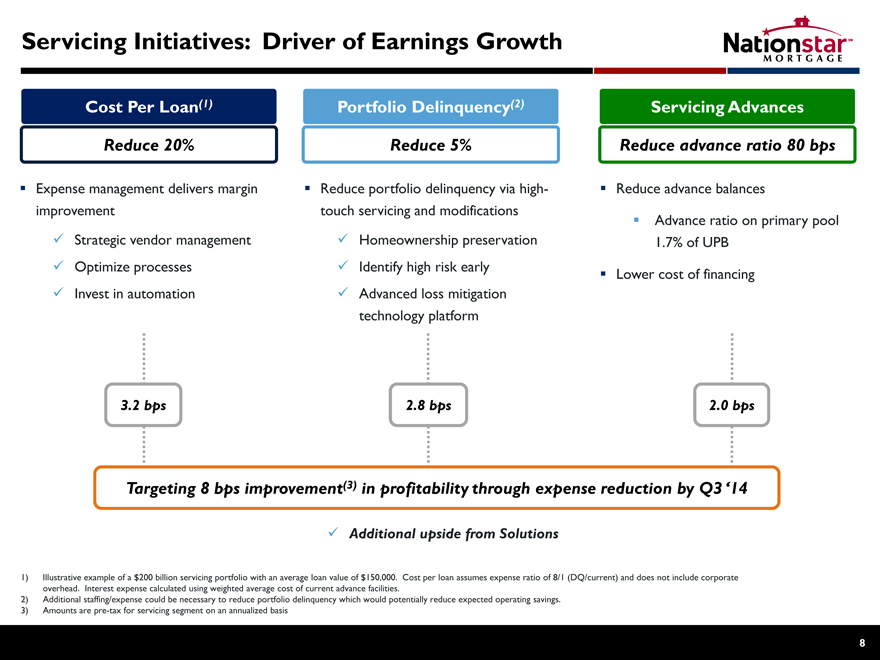
Servicing Initiatives: Driver of Earnings Growth
Cost Per Loan(1)
Reduce 20%
Portfolio Delinquency(2)
Reduce 5%
Servicing Advances
Reduce advance ratio 80 bps
Expense management delivers margin improvement
Strategic vendor management Optimize processes Invest in automation
Reduce portfolio delinquency via high-touch servicing and modifications
Homeownership preservation
Identify high risk early
Advanced loss mitigation
technology platform
Reduce advance balances
Advance ratio on primary pool
1.7% of UPB
Lower cost of financing
3.2 bps 2.8 bps 2.0 bps
Targeting 8 bps improvement(3) in profitability through expense reduction by Q3 ‘14
Additional upside from Solutions
1) Illustrative example of a $200 billion servicing portfolio with an average loan value of $150,000. Cost per loan assumes expense ratio of 8/1 (DQ/current) and does not include corporate overhead. Interest expense calculated using weighted average cost of current advance facilities.
2) Additional staffing/expense could be necessary to reduce portfolio delinquency which would potentially reduce expected operating savings.
3) Amounts are pre-tax for servicing segment on an annualized basis
8
|
|
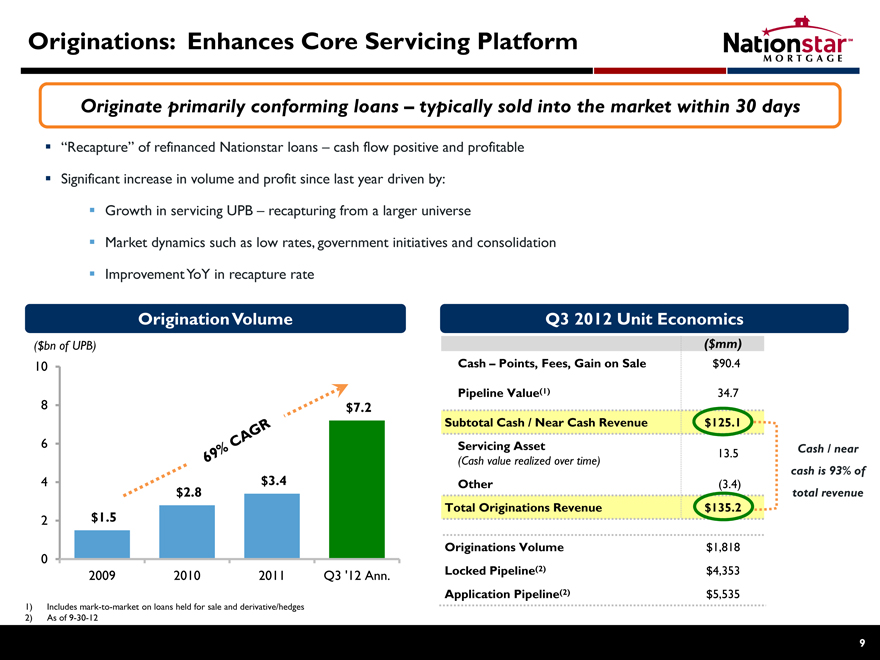
Originations: Enhances Core Servicing Platform
Originate primarily conforming loans – typically sold into the market within 30 days
“Recapture” of refinanced Nationstar loans – cash flow positive and profitable
Significant increase in volume and profit since last year driven by:
Growth in servicing UPB – recapturing from a larger universe
Market dynamics such as low rates, government initiatives and consolidation
Improvement YoY in recapture rate
Origination Volume
($bn of UPB)
10
64% CAGR
8 $7.2
6
4 $3.4 $2.8
2 $1.5
0
2009 2010 2011 Q3 ‘12 Ann.
Q3 2012 Unit Economics
($mm)
Cash – Points, Fees, Gain on Sale $90.4
Pipeline Value(1) 34.7
Subtotal Cash / Near Cash Revenue $125.1
Servicing Asset 13.5
(Cash value realized over time)
Other (3.4)
Total Originations Revenue $135.2
Originations Volume $1,818
Locked Pipeline(2) $4,353
Application Pipeline(2) $5,535
Cash / near cash is 93% of total revenue
1) Includes mark-to-market on loans held for sale and derivative/hedges
2) As of 9-30-12
9
|
|
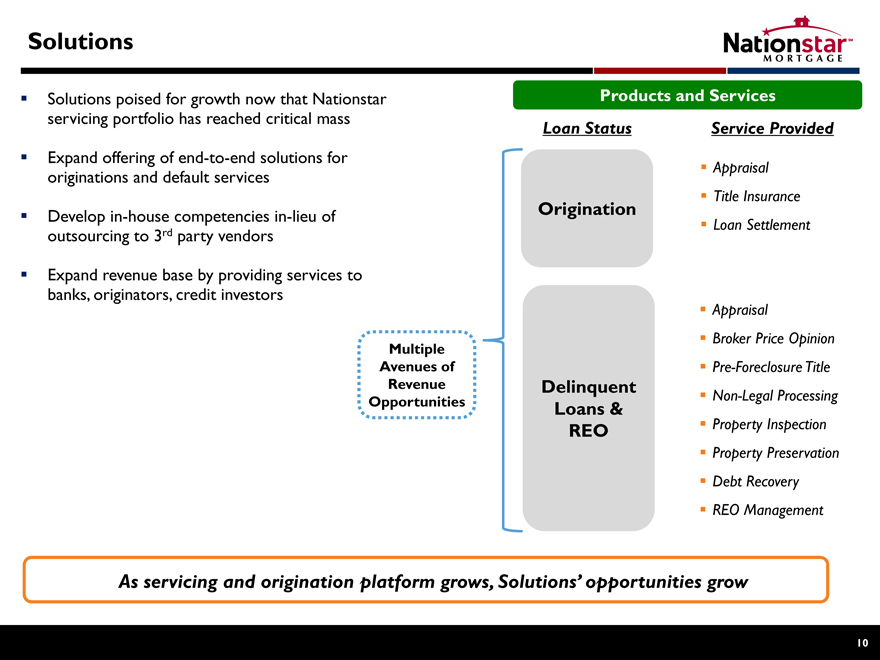
Solutions
Solutions poised for growth now that Nationstar servicing portfolio has reached critical mass
Expand offering of end-to-end solutions for originations and default services
Develop in-house competencies in-lieu of outsourcing to 3rd party vendors
Expand revenue base by providing services to banks, originators, credit investors
Multiple Avenues of Revenue Opportunities
Products and Services
Loan Status Service Provided
Origination
Appraisal Title Insurance Loan Settlement
Delinquent Loans & REO
Appraisal
Broker Price Opinion Pre-Foreclosure Title Non-Legal Processing Property Inspection Property Preservation Debt Recovery REO Management
As servicing and origination platform grows, Solutions’ opportunities grow
10
|
|
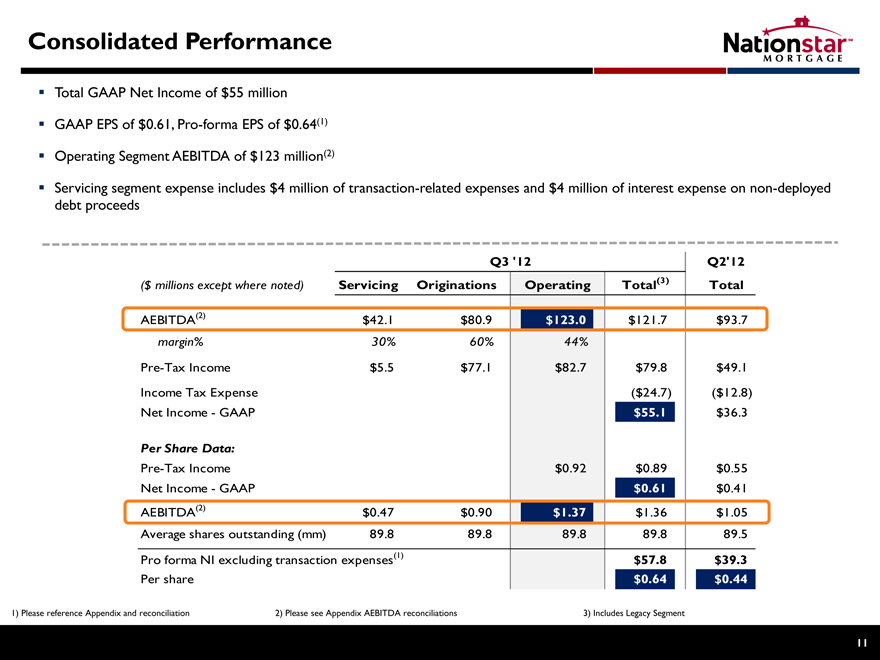
Consolidated Performance
Total GAAP Net Income of $55 million GAAP EPS of $0.61, Pro-forma EPS of $0.64(1) Operating Segment AEBITDA of $123 million(2)
Servicing segment expense includes $4 million of transaction-related expenses and $4 million of interest expense on non-deployed debt proceeds
Q3 ‘12 Q2’12
($ millions except where noted) Servicing Originations Operating Total(3) Total
AEBITDA(2) $42.1 $80.9 $123.0 $121.7 $93.7
margin% 30% 60% 44%
Pre-Tax Income $5.5 $77.1 $82.7 $79.8 $49.1
Income Tax Expense ($24.7) ($12.8)
Net Income—GAAP $55.1 $36.3
Per Share Data:
Pre-Tax Income ($0.05) $0.68 $0.92 $0.89 $0.55
Net Income—GAAP $0.61 $0.41
AEBITDA(2) $0.47 $0.90 $1.37 $1.36 $1.05
Average shares outstanding (mm) 89.8 89.8 89.8 89.8 89.5
Pro forma NI excluding transaction expenses(1) $57.8 $39.3
Per share $0.64 $0.44
1) Please reference Appendix and reconciliation 2) Please see Appendix AEBITDA reconciliations 3) Includes Legacy Segment
11
|
|

Appendix
|
|
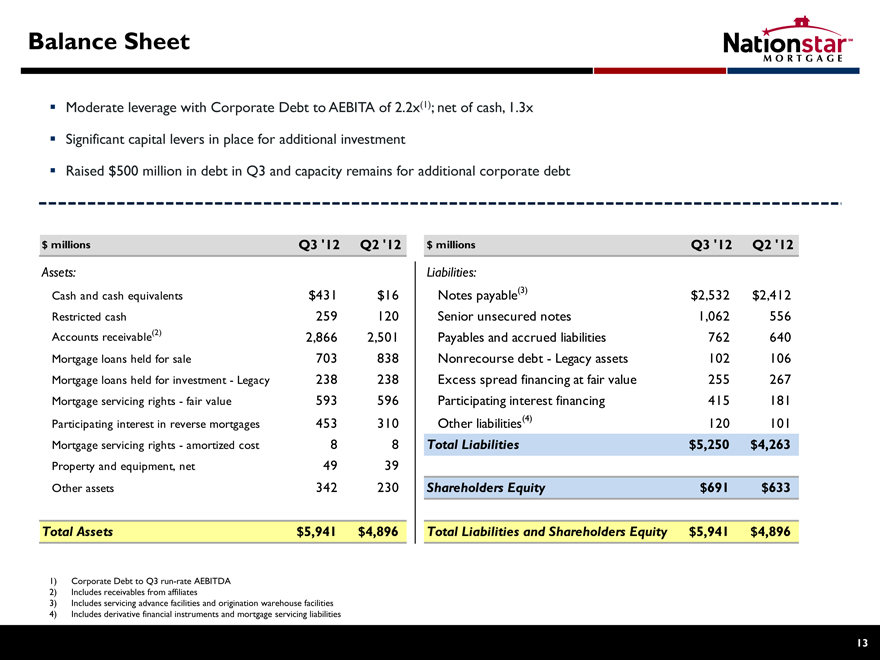
Balance Sheet
Moderate leverage with Corporate Debt to AEBITA of 2.2x(1); net of cash, 1.3x Significant capital levers in place for additional investment Raised $500 million in debt in Q3 and capacity remains for additional corporate debt
$ millions Q3 ‘12 Q2 ‘12
Assets:
Cash and cash equivalents $431 $16
Restricted cash 259 120
Accounts receivable(2) 2,866 2,501
Mortgage loans held for sale 703 838
Mortgage loans held for investment—Legacy 238 238
Mortgage servicing rights—fair value 593 596
Participating interest in reverse mortgages 453 310
Mortgage servicing rights—amortized cost 8 8
Property and equipment, net 49 39
Other assets 342 230
Total Assets $5,941 $4,896
$ millions Q3 ‘12 Q2 ‘12
Liabilities:
Notes payable(3) $2,532 $2,412
Senior unsecured notes 1,062 556
Payables and accrued liabilities 762 640
Nonrecourse debt—Legacy assets 102 106
Excess spread financing at fair value 255 267
Participating interest financing 415 181
Other liabilities(4) 120 101
Total Liabilities $5,250 $4,263
Shareholders Equity $691 $633
Total Liabilities and Shareholders Equity $5,941 $4,896
1) Corporate Debt to Q3 run-rate AEBITDA
2) Includes receivables from affiliates
3) Includes servicing advance facilities and origination warehouse facilities
4) Includes derivative financial instruments and mortgage servicing liabilities
13
|
|
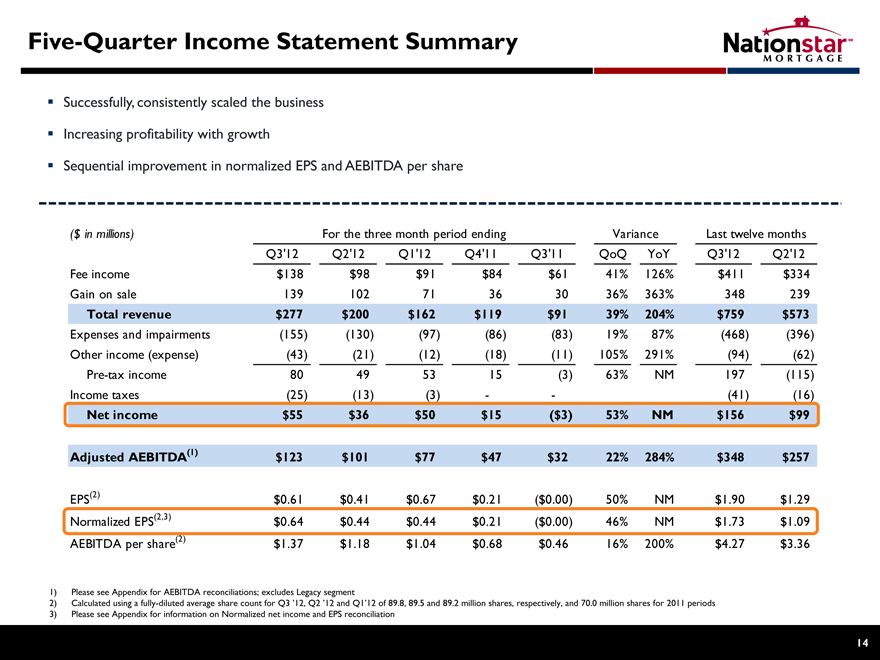
Five-Quarter Income Statement Summary
Successfully, consistently scaled the business
Increasing profitability with growth
Sequential improvement in normalized EPS and AEBITDA per share
($ in millions) For the three month period ending Variance Last twelve months
Q3’12 Q2’12 Q1’12 Q4’11 Q3’11 QoQ YoY Q3’12 Q2’12
Fee income $138 $98 $91 $84 $61 41% 126% $411 $334
Gain on sale 139 102 71 36 30 36% 363% 348 239
Total revenue $277 $200 $162 $119 $91 39% 204% $759 $573
Expenses and impairments (155) (130) (97) (86) (83) 19% 87% (468) (396)
Other income (expense) (43) (21) (12) (18) (11) 105% 291% (94) (62)
Pre-tax income 80 49 53 15 (3) 63% NM 197 (115)
Income taxes (25) (13) (3)—- (41) (16)
Net income $55 $36 $50 $15 ($3) 53% NM $156 $99
Adjusted AEBITDA(1) $123 $101 $77 $47 $32 22% 284% $348 $257
EPS(2) $0.61 $0.41 $0.67 $0.21 ($0.00) 50% NM $1.90 $1.29
Normalized EPS(2,3) $0.64 $0.44 $0.44 $0.21 ($0.00) 46% NM $1.73 $1.09
AEBITDA per share(2) $1.37 $1.18 $1.04 $0.68 $0.46 16% 200% $4.27 $3.36
1) Please see Appendix for AEBITDA reconciliations; excludes Legacy segment
2) Calculated using a fully-diluted average share count for Q3 ‘12, Q2 ‘12 and Q1’12 of 89.8, 89.5 and 89.2 million shares, respectively, and 70.0 million shares for 2011 periods
3) Please see Appendix for information on Normalized net income and EPS reconciliation
14
|
|
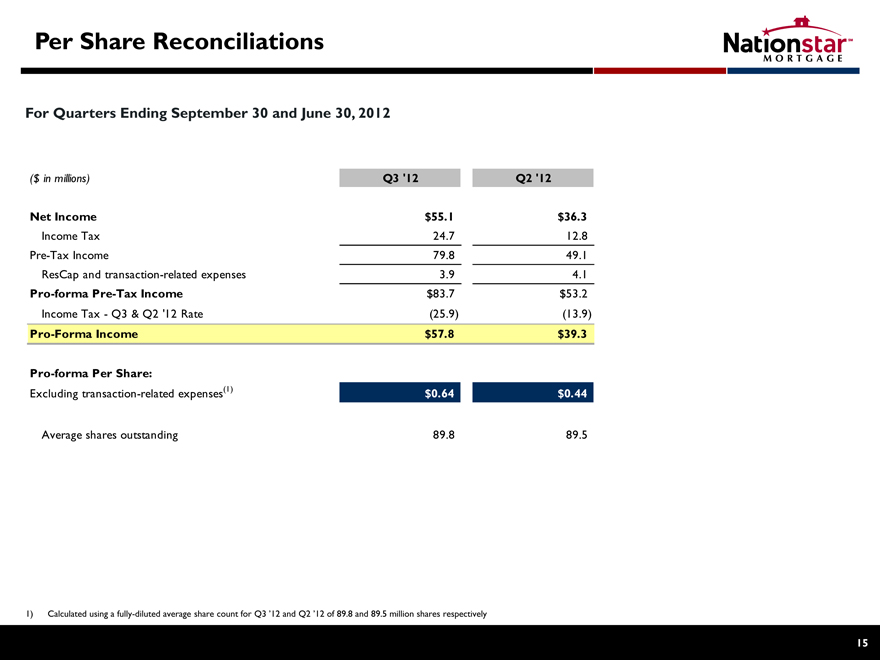
Per Share Reconciliations
For Quarters Ending September 30 and June 30, 2012
($ in millions) Q3 ‘12 Q2 ‘12
Net Income $55.1 $36.3
Income Tax 24.7 12.8
Pre-Tax Income 79.8 49.1
ResCap and transaction-related expenses 3.9 4.1
Pro-forma Pre-Tax Income $83.7 $53.2
Income Tax—Q3 & Q2 ‘12 Rate (25.9) (13.9)
Pro-Forma Income $57.8 $39.3
Pro-forma Per Share:
Excluding transaction-related expenses(1) $0.64 $0.44
Average shares outstanding 89.8 89.5
1) Calculated using a fully-diluted average share count for Q3 ‘12 and Q2 ‘12 of 89.8 and 89.5 million shares respectively
15
|
|
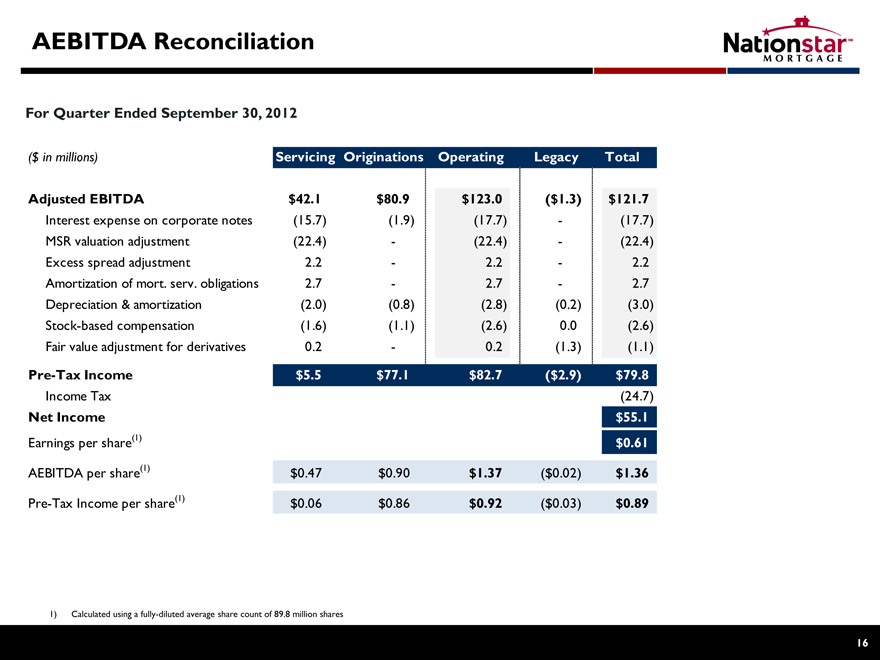
AEBITDA Reconciliation
For Quarter Ended September 30, 2012
($ in millions) Servicing Originations Operating Legacy Total
Adjusted EBITDA $42.1 $80.9 $123.0 ($1.3) $121.7
Interest expense on corporate notes (15.7) (1.9) (17.7)—(17.7)
MSR valuation adjustment (22.4)—(22.4)—(22.4)
Excess spread adjustment 2.2—2.2—2.2
Amortization of mort. serv. obligations 2.7—2.7—2.7
Depreciation & amortization (2.0) (0.8) (2.8) (0.2) (3.0)
Stock-based compensation (1.6) (1.1) (2.6) 0.0 (2.6)
Fair value adjustment for derivatives 0.2—0.2 (1.3) (1.1)
Pre-Tax Income $5.5 $77.1 $82.7 ($2.9) $79.8
Income Tax (24.7)
Net Income $55.1
Earnings per share(1) $0.61
AEBITDA per share(1) $0.47 $0.90 $1.37 ($0.02) $1.36
Pre-Tax Income per share(1) $0.06 $0.86 $0.92 ($0.03) $0.89
1) Calculated using a fully-diluted average share count of 89.8 million shares
16
|
|

AEBITDA Reconciliation (continued)
For Quarter Ended June 30, 2012
($ in millions) Servicing Originations Operating Legacy Total
Adjusted EBITDA $37.4 $63.8 $101.2 ($7.5) $93.7
Interest expense on corporate notes (13.5)—(13.5)—(13.5)
MSR valuation adjustment (20.9)—(20.9)—(20.9)
Excess spread adjustment (2.4)—(2.4)—(2.4)
Amortization of mort. serv. obligations (0.0)—(0.0)—(0.0)
Depreciation & amortization (1.2) (0.5) (1.8) (0.1) (1.9)
Stock-based compensation (4.1) (2.2) (6.4) 0.7 (5.6)
Fair value adjustment for derivatives 0.2—0.2 (0.5) (0.4)
Pre-Tax Income ($4.7) $61.1 $56.4 ($7.4) $49.1
Income Tax (12.8)
Net Income $36.3
Earnings per share(1) $0.41
AEBITDA per share(1) $0.42 $0.71 $1.13 ($0.08) $1.05
Pre-Tax Income per share(1) ($0.05) $0.68 $0.63 ($0.08) $0.55
1) Calculated using a fully-diluted average share count of 89.5 million shares
17
|
|
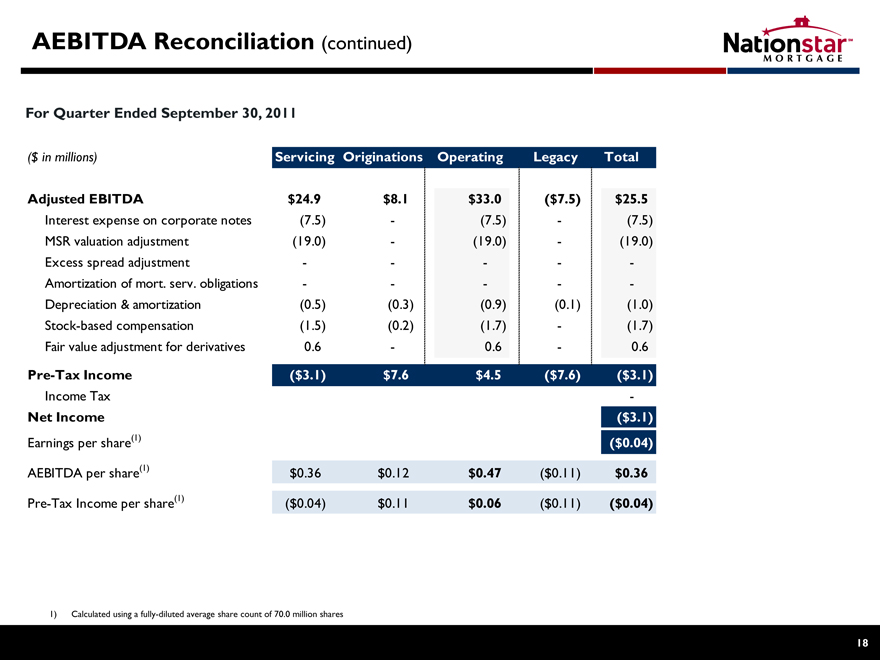
AEBITDA Reconciliation (continued)
For Quarter Ended September 30, 2011
($ in millions) Servicing Originations Operating Legacy Total
Adjusted EBITDA $24.9 $8.1 $33.0 ($7.5) $25.5
Interest expense on corporate notes (7.5)—(7.5)—(7.5)
MSR valuation adjustment (19.0)—(19.0)—(19.0)
Excess spread adjustment———-
Amortization of mort. serv. obligations———-
Depreciation & amortization (0.5) (0.3) (0.9) (0.1) (1.0)
Stock-based compensation (1.5) (0.2) (1.7)—(1.7)
Fair value adjustment for derivatives 0.6—0.6—0.6
Pre-Tax Income ($3.1) $7.6 $4.5 ($7.6) ($3.1)
Income Tax -
Net Income ($3.1)
Earnings per share(1) ($0.04)
AEBITDA per share(1) $0.36 $0.12 $0.47 ($0.11) $0.36
Pre-Tax Income per share(1) ($0.04) $0.11 $0.06 ($0.11) ($0.04)
1) Calculated using a fully-diluted average share count of 70.0 million shares
18
|
|
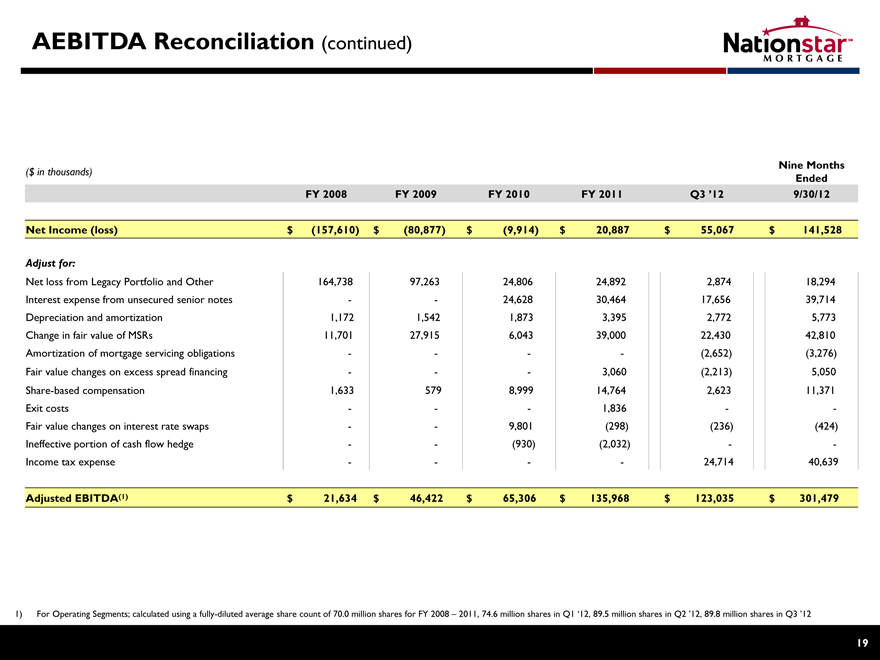
AEBITDA Reconciliation (continued)
($ in thousands) Nine Months
Ended
FY 2008 FY 2009 FY 2010 FY 2011 Q3 ‘12 9/30/12
Net Income (loss) $ (157,610) $ (80,877) $ (9,914) $ 20,887 $ 55,067 $ 141,528
Adjust for:
Net loss from Legacy Portfolio and Other 164,738 97,263 24,806 24,892 2,874 18,294
Interest expense from unsecured senior notes —— 24,628 30,464 17,656 39,714
Depreciation and amortization 1,172 1,542 1,873 3,395 2,772 5,773
Change in fair value of MSRs 11,701 27,915 6,043 39,000 22,430 42,810
Amortization of mortgage servicing obligations ————(2,652) (3,276)
Fair value changes on excess spread financing ——— 3,060 (2,213) 5,050
Share-based compensation 1,633 579 8,999 14,764 2,623 11,371
Exit costs ——— 1,836—-
Fair value changes on interest rate swaps —— 9,801 (298) (236) (424)
Ineffective portion of cash flow hedge —— (930) (2,032)—-
Income tax expense ————24,714 40,639
Adjusted EBITDA(1) $ 21,634 $ 46,422 $ 65,306 $ 135,968 $ 123,035 $ 301,479
For Operating Segments; calculated using a fully-diluted average share count of 70.0 million shares for FY 2008 – 2011, 74.6 million shares in Q1 ‘12, 89.5 million shares in Q2 ‘12, 89.8 million shares in Q3 ‘12
19
|
|
Endnotes
Adjusted EBITDA (“AEBITDA”) This disclaimer applies to every usage of “Adjusted EBITDA” or “AEBITDA” in this presentation. Adjusted EBITDA is a key performance metric used by management in evaluating the performance of our segments. Adjusted EBITDA represents our Operating Segments’ income (loss), and excludes income and expenses that relate to the financing of our senior notes, depreciable (or amortizable) asset base of the business, income taxes (if any), exit costs from our restructuring and certain non-cash items. Adjusted EBITDA also excludes results from our legacy asset portfolio and certain securitization trusts that were consolidated upon adoption of the accounting guidance eliminating the concept of a qualifying special purpose entity (“QSPE”).
2012 Estimate AEBITDA 2012 Estimate AEBITDA is based on our expectations of continued growth, current market conditions and increased operating efficiencies in our business in addition to our financial targets for 2012. Target for all non-GAAP figures excludes the same items as we excluded in our 2011 non-GAAP reconciliation, as follows: income and expenses that relate to the financing of the senior notes, depreciable (or amortizable) asset base and several other relevant items. Our actual AEBITDA for 2012 on an annualized basis may differ from our 2012(E) AEBITDA.
NOTE: 2012 Estimate AEBITDA is forward-looking and subject to significant business, economic, regulatory and competitive uncertainties, many of which are beyond control of Nationstar and its management, and are based upon assumptions with respect to future decisions, which are subject to change. Actual results will vary and those variations may be material. Nothing in this presentation should be regarded as a representation by any person that this target will be achieved and Nationstar undertakes no duty to update this target.
Expected Annual Aurora AEBITDA Contribution Our expectations regarding the approximate annualized contribution to Adjusted EBITDA and the approximate integration and transition costs are based on a number of assumptions, including, but not limited to, prepayments, delinquencies, ancillary fees, cost to service and recapture rates and margins. The actual annualized contribution to Adjusted EBITDA and the actual integration and transition costs will depend on many factors, some of which are beyond our control, and could differ materially from our estimates. Errors in our financial models or changes in assumptions could result in our estimates and expectations being materially inaccurate which may adversely affect our earnings.
Pro-forma Earnings Per Share (“Pro-forma EPS”) This disclaimer applies to every usage of pro-forma EPS in this presentation. Pro-forma EPS is a metric that is used by management to exclude certain non-recurring items in an attempt to provide a better earnings per share comparison to prior periods. Pro-forma Q3 ‘12 EPS excludes certain expenses related to ResCap and other transactions. These expenses include the advance hiring of servicing staff, recruiting expenses and travel and licensing expenses. Pro-forma Q2 ‘12 EPS excluded certain expenses incurred in advance of the closing of the Aurora transaction.
Pro-forma AEBITDA Per Share This disclaimer applies to every usage of pro-forma AEBITDA per share in this presentation. Pro-forma AEBITDA per share is a metric that is used by management to exclude certain non-recurring items in an attempt to provide a better earnings per share comparison to prior periods. Pro-forma Q3 ‘12 AEBITDA per share excludes certain expenses related to ResCap and other transactions. These expenses include the advance hiring of servicing staff, recruiting expenses and travel and licensing expenses. Pro-forma Q2 ‘12 AEBITDA per share excluded certain expenses incurred in advance of the closing of the Aurora transaction.
20