Attached files
| file | filename |
|---|---|
| 8-K - FORM 8-K - National Bank Holdings Corp | d444786d8k.htm |
Exhibit 99.1
Third Quarter Update November 27, 2012
Forward-Looking Statements 2 This presentation contains forward-looking statements. Any statements about our expectations, beliefs, plans, predictions, forecasts, objectives, assumptions or future events or performance are not historical facts and may be forward-looking. These statements are often, but not always, made through the use of words or phrases such as “anticipate,” “believes,” “can,” “would,” “should,” “could,” “may,” “predicts,” “potential,” “should,” “will,” “estimate,” “plans,” “projects,” “continuing,” “ongoing,” “expects,” “intends” and similar words or phrases. These statements are only predictions and involve estimates, known and unknown risks, assumptions and uncertainties. Our actual results could differ materially from those expressed in or contemplated by such forward-looking statements as a result of a variety of factors, some of which are more fully described under the caption “Risk Factors” in the registration statements and quarterly report we have filed with the Securities and Exchange Commission. Any or all of our forward-looking statements in this presentation may turn out to be inaccurate. The inclusion of such forward-looking statements should not be regarded as a representation by us, or any other person that the results expressed in or contemplated by such forward-looking statements will be achieved. We have based these forward-looking statements largely on our current expectations and projections about future events and financial trends that we believe may affect our financial condition, liquidity, results of operations, business strategy and growth prospects. There are important factors that could cause our actual results, level of activity, performance or achievements to differ materially from the results, level of activity, performance or achievements expressed in or contemplated by the forward looking statements, including, but not limited to: (1) ability to execute our business strategy; (2) changes in the regulatory environment, including changes in regulation that affect the fees that we charge; (3) economic, market, operational, liquidity, credit and interest rate risks associated with our business; (4) our ability to identify potential candidates for, obtain regulatory approval of and consummate, acquisitions of banking franchises on attractive terms, or at all; (5) our ability to integrate acquisitions and to achieve synergies, operating efficiencies and/or other expected benefits within expected time-frames, or at all, or within expected cost projections, and to preserve the goodwill of acquired banking franchises; (6) our ability to achieve organic loan and deposit growth and the composition of such growth; (7) business and economic conditions generally and in the financial services industry; (8) increased competition in the financial services industry, nationally, regionally or locally, resulting in, among other things, lower risk-adjusted returns; (9) changes in the economy or supply-demand imbalances affecting local real estate values; (10) volatility and direction of market interest rates; (11) effects of any changes in trade and monetary and fiscal policies and laws, including the interest rate policies of the Federal Reserve; (12) the ability in certain states to amend the state constitution to impose restrictions on financial services by a simple majority of the people who actually vote; (13) governmental legislation and regulation, including changes in accounting regulation or standards; (14) failure of politicians to reach consensus on a bipartisan basis; (15) acts of war or terrorism, natural disasters such as tornadoes, flooding, hail storms and damaging winds, earthquakes, hurricanes or fires, or the effects of pandemic flu; (16) the timely development and acceptance of new products and services and perceived overall value of these products and services by users; (17) changes in the Company’s management personnel; (18) continued consolidation in the financial services industry; (19) ability to maintain or increase market share; (20) ability to implement and/or improve operational management and other internal risk controls and processes and our reporting system and procedures; (21) a weakening of the economy which could materially impact credit quality trends and the ability to generate quality loans; (22) the impact of current economic conditions and the Company’s performance, liquidity, financial condition and prospects and on its ability to obtain attractive third-party funding to meet its liquidity needs; (23) fluctuations in face value of investment securities due to market conditions; (24) changes in fiscal, monetary and related policies of the U.S. federal government, its agencies and government sponsored entities; (25) inability to receive dividends from our subsidiary bank, pay dividends to our common stockholders and to service debt and satisfy obligations as they become due; (26) costs and effects of legal and regulatory developments, including the resolution of legal proceedings or regulatory or other governmental inquiries, and the results of regulatory examinations or reviews; (27) changes in estimates of future loan reserve requirements based upon the periodic review thereof under relevant regulatory and accounting requirements; (28) changes in capital classification; (29) impact of reputational risk on such matters as business generation and retention; and (30) the Company’s success at managing the risks involved in the foregoing items. All forward-looking statements are necessarily only estimates of future results. Accordingly, actual results may differ materially from those expressed in or contemplated by the particular forward-looking statement, and, therefore, you are cautioned not to place undue reliance on such statements. Any forward-looking statement is qualified in its entirety by reference to the matters discussed in this presentation. Further, any forward-looking statement speaks only as of the date on which it is made, and we undertake no obligation to update any forward-looking statement to reflect events or circumstances after the date on which the statement is made or to reflect the occurrence of unanticipated events or circumstances, except as required by applicable law. No Offer or Solicitation; Further Information We have filed registration statements and other documents with the SEC. Before you invest, you should read the documents we have filed with the SEC for more complete information about us. You may get these documents for free by visiting EDGAR on the SEC website at www.sec.gov. This presentation should be read together with “Management’s Discussion and Analysis of Financial Condition and Results of Operations” and the consolidated financial statements and the related notes thereto included in our registration statements and quarterly report filed with the SEC. Non-GAAP Measures We consider the use of select non-GAAP financial measures and ratios to be useful for financial and operational decision making and useful in evaluating period-to-period comparisons. Please see the Appendix to this presentation and our registration statements and quarterly report for a further description of our use of non-GAAP financial measures and a reconciliation of the differences from the most directly comparable GAAP financial measures.

Company Overview
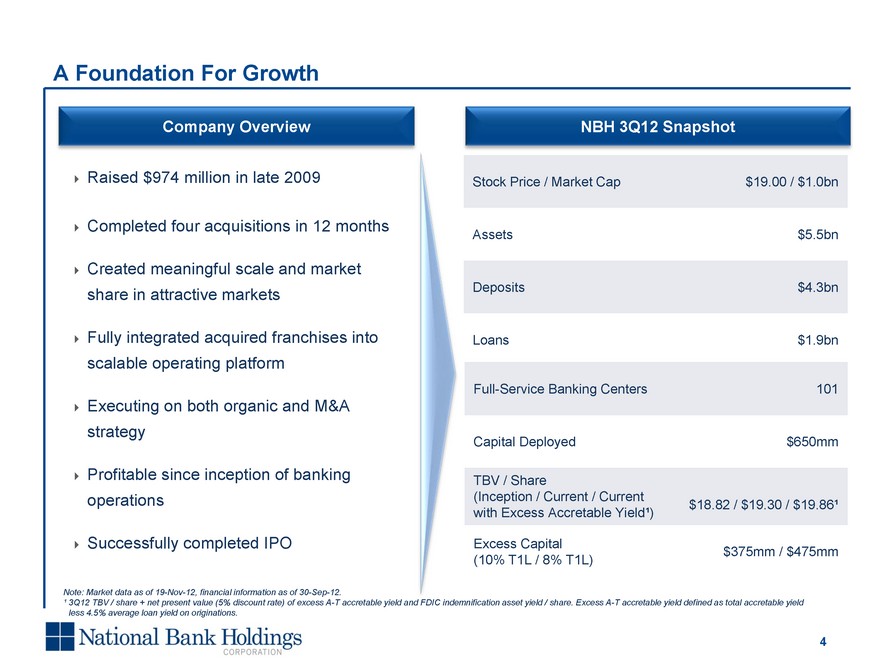
A Foundation For Growth 4 Stock Price / Market Cap $19.00 / $1.0bn Assets $5.5bn Deposits $4.3bn Loans $1.9bn Tier 1 Leverage Ratio 17.0% NBH 3Q12 Snapshot Full-Service Banking Centers 101 Capital Deployed $650mm TBV / Share (Inception / Current / Current with Excess Accretable Yield¹) $18.82 / $19.30 / $19.86¹ Excess Capital (10% T1L / 8% T1L) $375mm / $475mm Raised $974 million in late 2009 Completed four acquisitions in 12 months Created meaningful scale and market share in attractive markets Fully integrated acquired franchises into scalable operating platform Executing on both organic and M&A strategy Profitable since inception of banking operations Successfully completed IPO Note: Market data as of 19-Nov-12, financial information as of 30-Sep-12. ¹ 3Q12 TBV / share + net present value (5% discount rate) of excess A-T accretable yield and FDIC indemnification asset yield / share. Excess A-T accretable yield defined as total accretable yield less 4.5% average loan yield on originations. MAPINFO SOURCE: \IBNJS002VF\BOULEVARD11\GR APHICS\MapInfo\Colorado—Kansas City Maps\MAP.wor Company Overview
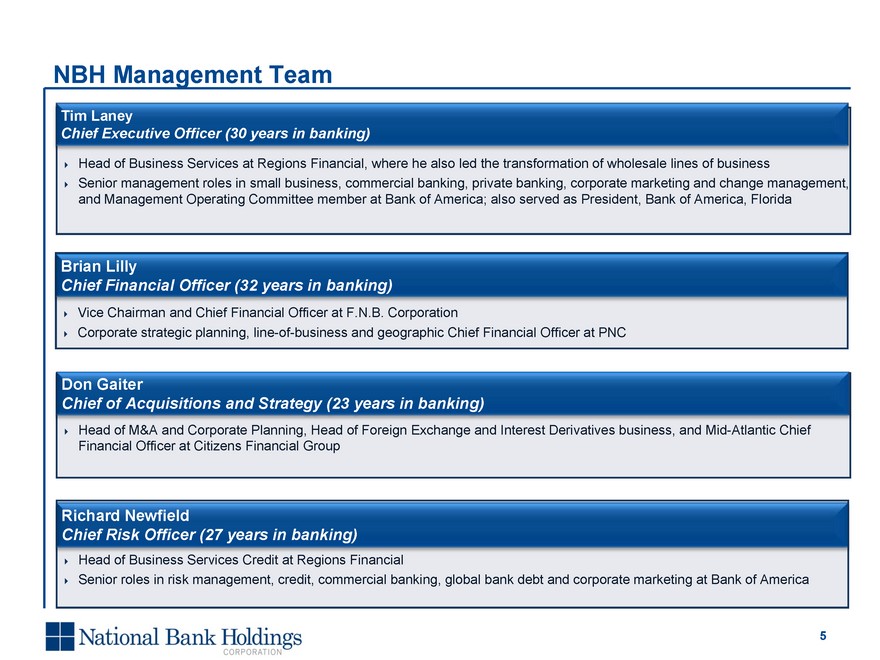
NBH Management Team 5 Head of M&A and Corporate Planning, Head of Foreign Exchange and Interest Derivatives business, and Mid-Atlantic Chief Financial Officer at Citizens Financial Group Don Gaiter Chief of Acquisitions and Strategy (23 years in banking) Head of Business Services at Regions Financial, where he also led the transformation of wholesale lines of business Senior management roles in small business, commercial banking, private banking, corporate marketing and change management, and Management Operating Committee member at Bank of America; also served as President, Bank of America, Florida Tim Laney Chief Executive Officer (30 years in banking) Head of Business Services Credit at Regions Financial Senior roles in risk management, credit, commercial banking, global bank debt and corporate marketing at Bank of America Richard Newfield Chief Risk Officer (27 years in banking) Vice Chairman and Chief Financial Officer at F.N.B. Corporation Corporate strategic planning, line-of-business and geographic Chief Financial Officer at PNC Brian Lilly Chief Financial Officer (32 years in banking)
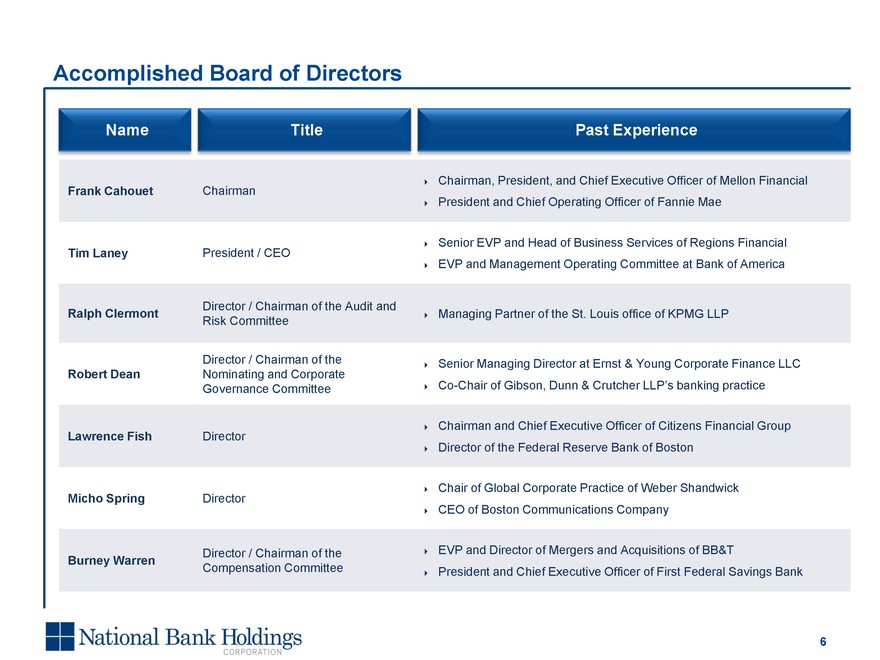
Accomplished Board of Directors Title Past Experience Name Frank Cahouet Chairman Chairman, President, and Chief Executive Officer of Mellon FinancialPresident and Chief Operating Officer of Fannie Mae Tim Laney President / CEO Senior EVP and Head of Business Services of Regions FinancialEVP and Management Operating Committee at Bank of America Ralph Clermont Director / Chairman of the Audit and Risk Committee Managing Partner of the St. Louis office of KPMG LLP Robert Dean Director / Chairman of the Nominating and Corporate Governance Committee Senior Managing Director at Ernst & Young Corporate Finance LLCCo-Chair of Gibson, Dunn & Crutcher LLP’s banking practice Lawrence Fish Director Chairman and Chief Executive Officer of Citizens Financial GroupDirector of the Federal Reserve Bank of Boston Micho Spring Director Chair of Global Corporate Practice of Weber ShandwickCEO of Boston Communications Company Burney Warren Director / Chairman of the Compensation Committee EVP and Director of Mergers and Acquisitions of BB&TPresident and Chief Executive Officer of First Federal Savings Bank 6
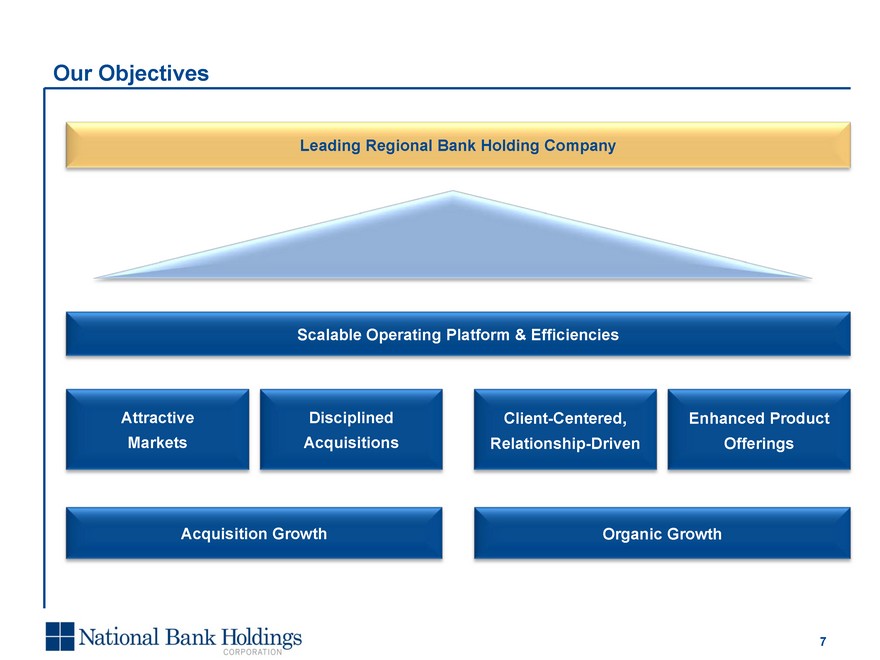
7 Acquisition Growth Organic Growth Attractive Markets Disciplined Acquisitions Client-Centered, Relationship-Driven Enhanced Product Offerings Scalable Operating Platform & Efficiencies Leading Regional Bank Holding Company Our Objectives

Investment Highlights 8 Disciplined Focus on Building Meaningful Scale and Market Share in Attractive Markets Expertise in FDIC-assisted and Unassisted Bank Transactions with Substantial Future Opportunities Operating Platform Implemented with Full Conversion of All Acquisitions Organic Growth Accelerating Attractive Low-Risk Profile Available Capital to Support Growth Experienced and Respected Management Team and Board of Directors
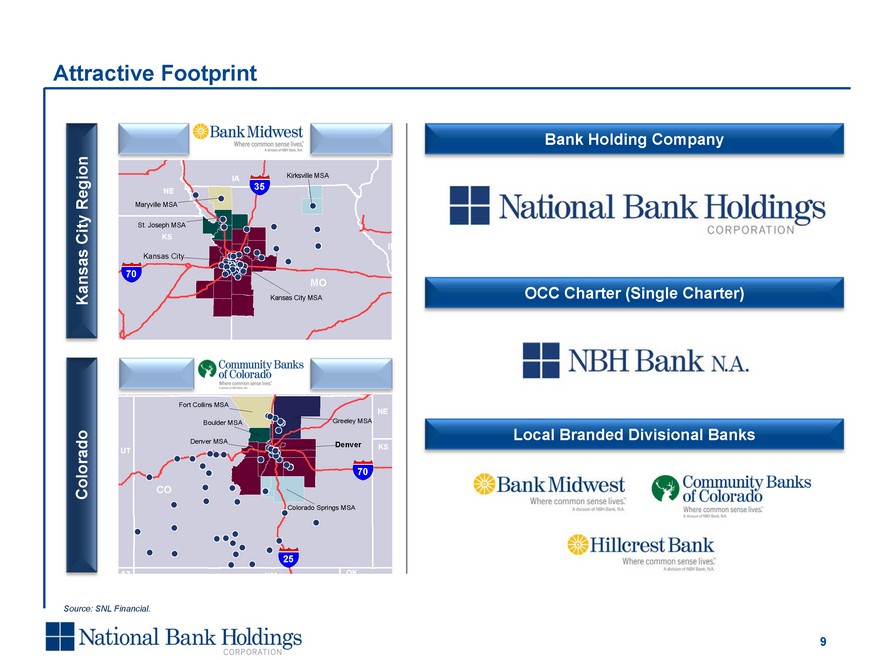
Attractive Footprint 9 Bank Holding Company 2 MAPINFO SOURCE: \IBNJS002VF\BO ULEVARD11\GR APHICS\MapInfo\ Colorado—Kansas City Maps\MAP.wor OCC Charter (Single Charter) Local Branded Divisional Banks Source: SNL Financial. Kansas City Region Colorado 25 70 35 70
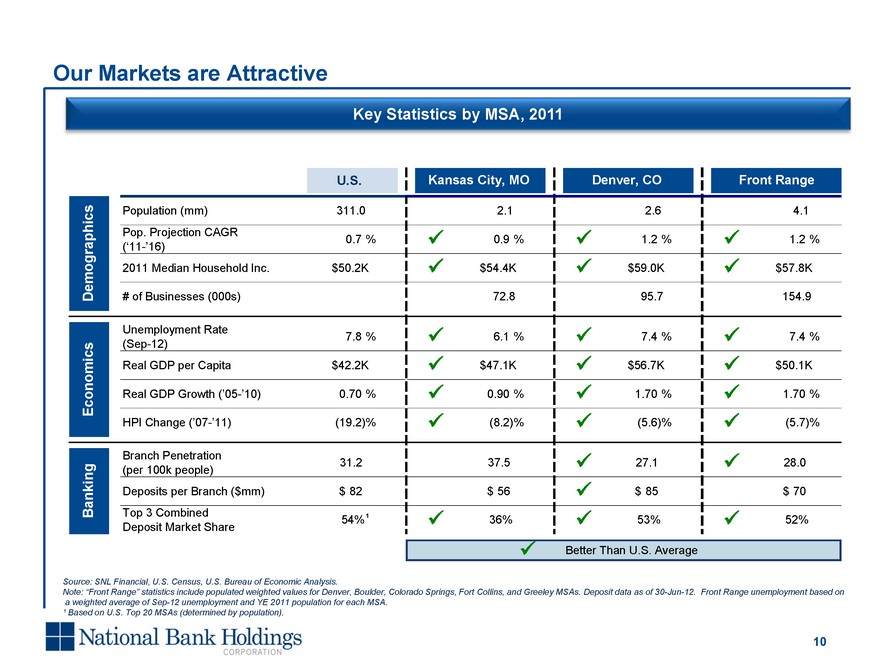
Key Statistics by MSA, 2011 Source: SNL Financial, U.S. Census, U.S. Bureau of Economic Analysis. Note: “Front Range” statistics include populated weighted values for Denver, Boulder, Colorado Springs, Fort Collins, and Greeley MSAs. Deposit data as of 30-Jun-12. Front Range unemployment based on a weighted average of Sep-12 unemployment and YE 2011 population for each MSA. ¹ Based on U.S. Top 20 MSAs (determined by population). 10 Our Markets are Attractive 1
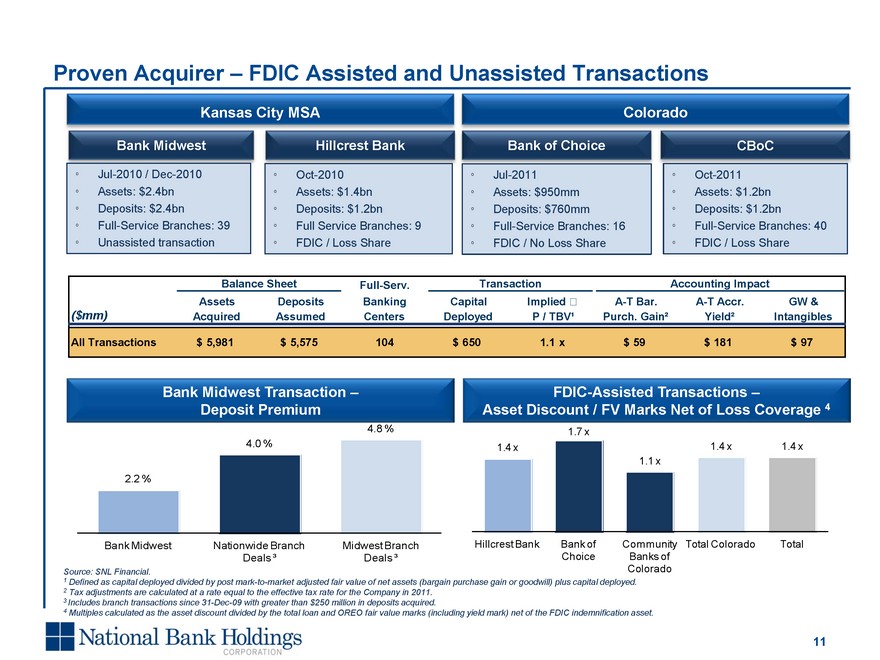
Proven Acquirer – FDIC Assisted and Unassisted Transactions Bank Midwest Hillcrest Bank Bank of Choice CBoC Source: SNL Financial. 1 Defined as capital deployed divided by post mark-to-market adjusted fair value of net assets (bargain purchase gain or goodwill) plus capital deployed. 2 Tax adjustments are calculated at a rate equal to the effective tax rate for the Company in 2011. 3 Includes branch transactions since 31-Dec-09 with greater than $250 million in deposits acquired. 4 Multiples calculated as the asset discount divided by the total loan and OREO fair value marks (including yield mark) net of the FDIC indemnification asset. Kansas City MSA Colorado 11 Jul-2011 Assets: $950mm Deposits: $760mm Full-Service Branches: 16 FDIC / No Loss Share Bank Midwest Transaction – Deposit Premium FDIC-Assisted Transactions – Asset Discount / FV Marks Net of Loss Coverage 4 Asset Discount / FV Marks Net of Loss Coverage 4 Asset Discount / FV Marks Net of Loss Coverage 4 Jul-2010 / Dec-2010 Assets: $2.4bn Deposits: $2.4bn Full-Service Branches: 39 Unassisted transaction Oct-2010 Assets: $1.4bn Deposits: $1.2bn Full Service Branches: 9 FDIC / Loss Share Oct-2011 Assets: $1.2bn Deposits: $1.2bn Full-Service Branches: 40 FDIC / Loss Share
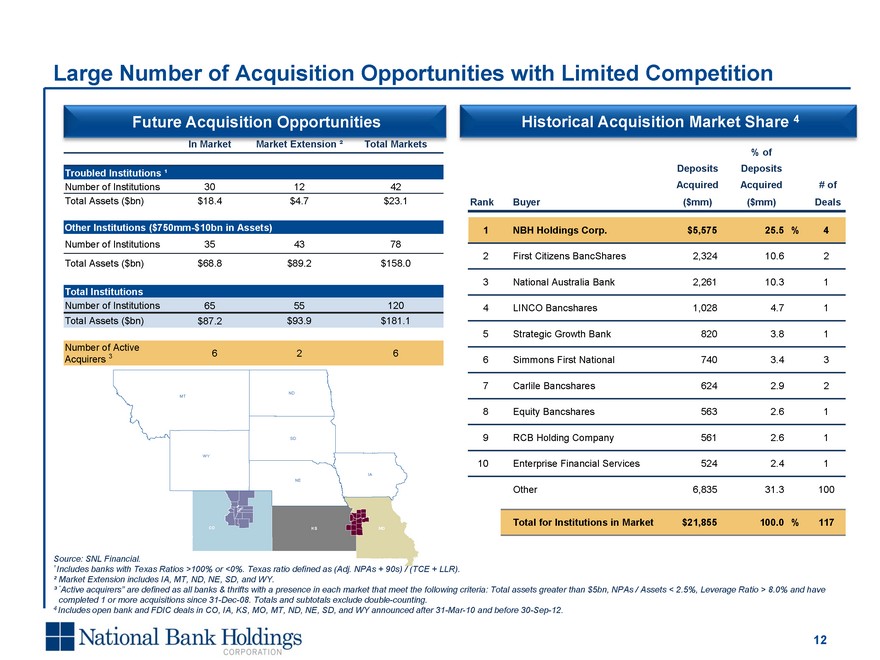
Source: SNL Financial. ¹ Includes banks with Texas Ratios >100% or <0%. Texas ratio defined as (Adj. NPAs + 90s) / (TCE + LLR). ² Market Extension includes IA, MT, ND, NE, SD, and WY. ³ “Active acquirers” are defined as all banks & thrifts with a presence in each market that meet the following criteria: Total assets greater than $5bn, NPAs / Assets < 2.5%, Leverage Ratio > 8.0% and have completed 1 or more acquisitions since 31-Dec-08. Totals and subtotals exclude double-counting. 4 Includes open bank and FDIC deals in CO, IA, KS, MO, MT, ND, NE, SD, and WY announced after 31-Mar-10 and before 30-Sep-12. 12 Large Number of Acquisition Opportunities with Limited Competition
Date: 06-Feb-12 08:50:15
User: krgreen
Source: \\IBNJS002VF\BOULEVARD11\ Roadshow Presentation\xls\Future Opportunities.xlsx (Chart2)
Historical Acquisition Market Share 4 Future Acquisition Opportunities In Market In Market Market Extension ² Total Markets Troubled Institutions ¹ Troubled Institutions ¹ Troubled Institutions ¹ Number of Institutions 30 30 12 42 Total Assets ($bn) $18.4 $18.4 $4.7 $23.1 Other Institutions ($750mm-$10bn in Assets) Other Institutions ($750mm-$10bn in Assets) Other Institutions ($750mm-$10bn in Assets) Other Institutions ($750mm-$10bn in Assets) Number of Institutions 35 35 43 78 Total Assets ($bn) $68.8 $68.8 $89.2 $158.0 Total Institutions Total Institutions Total Institutions Number of Institutions 65 65 55 120 Total Assets ($bn) $87.2 $87.2 $93.9 $181.1 Number of Active Acquirers 3 Number of Active Acquirers 3 6 2 6
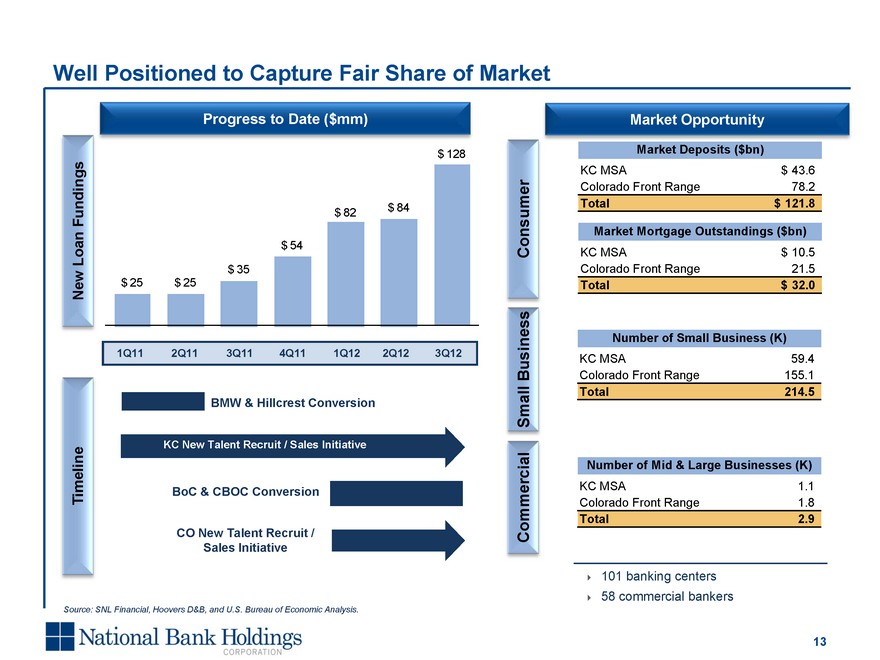
Well Positioned to Capture Fair Share of Market Market Opportunity 13 Source: SNL Financial, Hoovers D&B, and U.S. Bureau of Economic Analysis. Progress to Date ($mm) Timeline New Loan Fundings 101 banking centers 58 commercial bankers BMW & Hillcrest Conversion KC New Talent Recruit / Sales Initiative BoC & CBOC Conversion CO New Talent Recruit / Sales Initiative Consumer Small Business Commercial 1Q11 2Q11 3Q11 4Q11 1Q12 2Q12 3Q12
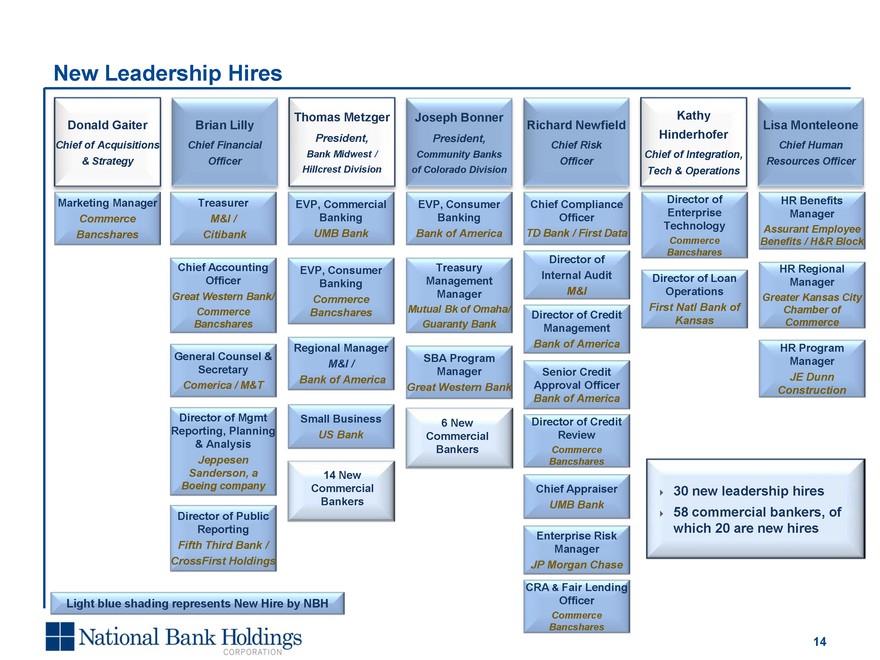
New Leadership Hires Treasurer M&I / Citibank Richard Newfield Chief Risk Officer Kathy Hinderhofer Chief of Integration, Tech & Operations Brian Lilly Chief Financial Officer Lisa Monteleone Chief Human Resources Officer Joseph Bonner President, Community Banks of Colorado Division Chief Accounting Officer Great Western Bank/ Commerce Bancshares Director of Mgmt Reporting, Planning & Analysis Jeppesen Sanderson, a Boeing company Director of Public Reporting Fifth Third Bank / CrossFirst Holdings EVP, Commercial Banking UMB Bank EVP, Consumer Banking Bank of America Chief Compliance Officer TD Bank / First Data Director of Enterprise Technology Commerce Bancshares HR Regional Manager Greater Kansas City Chamber of Commerce EVP, Consumer Banking Commerce Bancshares Regional Manager M&I / Bank of America Small Business US Bank SBA Program Manager Great Western Bank Treasury Management Manager Mutual Bk of Omaha/ Guaranty Bank Director of Internal Audit M&I Director of Credit Management Bank of America Senior Credit Approval Officer Bank of America Director of Credit Review Commerce Bancshares Chief Appraiser UMB Bank Enterprise Risk Manager JP Morgan Chase CRA & Fair Lending Officer Commerce Bancshares Director of Loan Operations First Natl Bank of Kansas HR Benefits Manager Assurant Employee Benefits / H&R Block HR Program Manager JE Dunn Construction Donald Gaiter Chief of Acquisitions & Strategy Thomas Metzger President, Bank Midwest / Hillcrest Division 14 Light blue shading represents New Hire by NBH Marketing Manager Commerce Bancshares 14 New Commercial Bankers 6 New Commercial Bankers 30 new leadership hires 58 commercial bankers, of which 20 are new hires General Counsel & Secretary Comerica / M&T
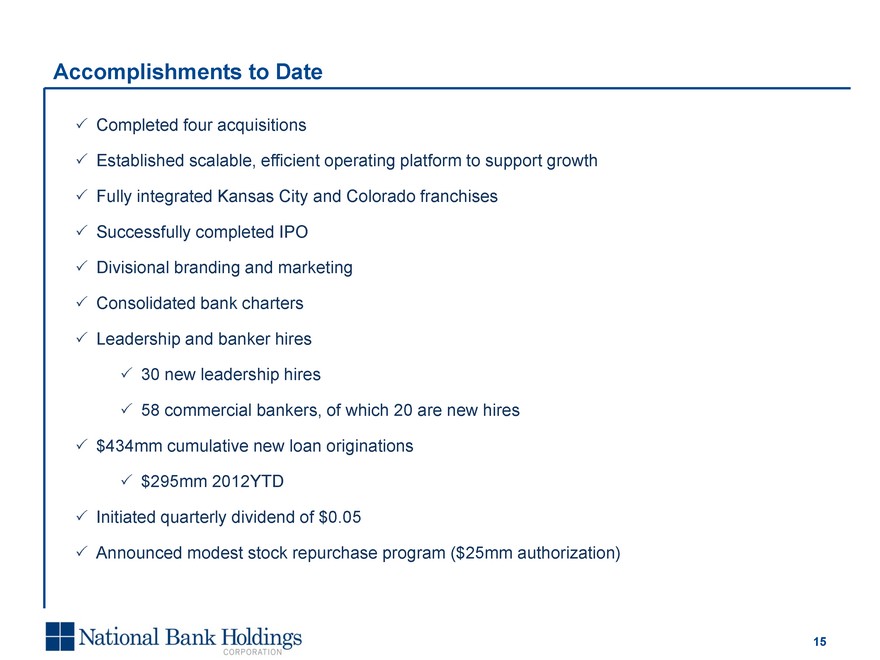
Accomplishments to Date Completed four acquisitions Established scalable, efficient operating platform to support growth Fully integrated Kansas City and Colorado franchises Successfully completed IPO Divisional branding and marketing Consolidated bank charters Leadership and banker hires 30 new leadership hires 58 commercial bankers, of which 20 are new hires $434mm cumulative new loan originations $295mm 2012YTD Initiated quarterly dividend of $0.05 Announced modest stock repurchase program ($25mm authorization) 15

Financial Overview
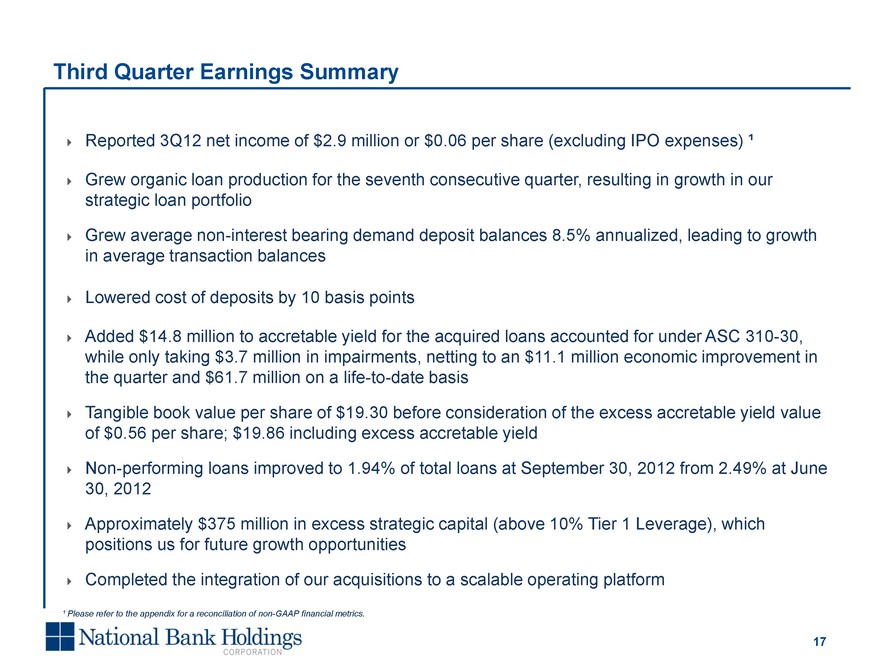
Third Quarter Earnings Summary 17 Reported 3Q12 net income of $2.9 million or $0.06 per share (excluding IPO expenses) ¹ Grew organic loan production for the seventh consecutive quarter, resulting in growth in our strategic loan portfolio Grew average non-interest bearing demand deposit balances 8.5% annualized, leading to growth in average transaction balances Lowered cost of deposits by 10 basis points Added $14.8 million to accretable yield for the acquired loans accounted for under ASC 310-30, while only taking $3.7 million in impairments, netting to an $11.1 million economic improvement in the quarter and $61.7 million on a life-to-date basis Tangible book value per share of $19.30 before consideration of the excess accretable yield value of $0.56 per share; $19.86 including excess accretable yield Non-performing loans improved to 1.94% of total loans at September 30, 2012 from 2.49% at June 30, 2012 Approximately $375 million in excess strategic capital (above 10% Tier 1 Leverage), which positions us for future growth opportunities Completed the integration of our acquisitions to a scalable operating platform ¹ Please refer to the appendix for a reconciliation of non-GAAP financial metrics.
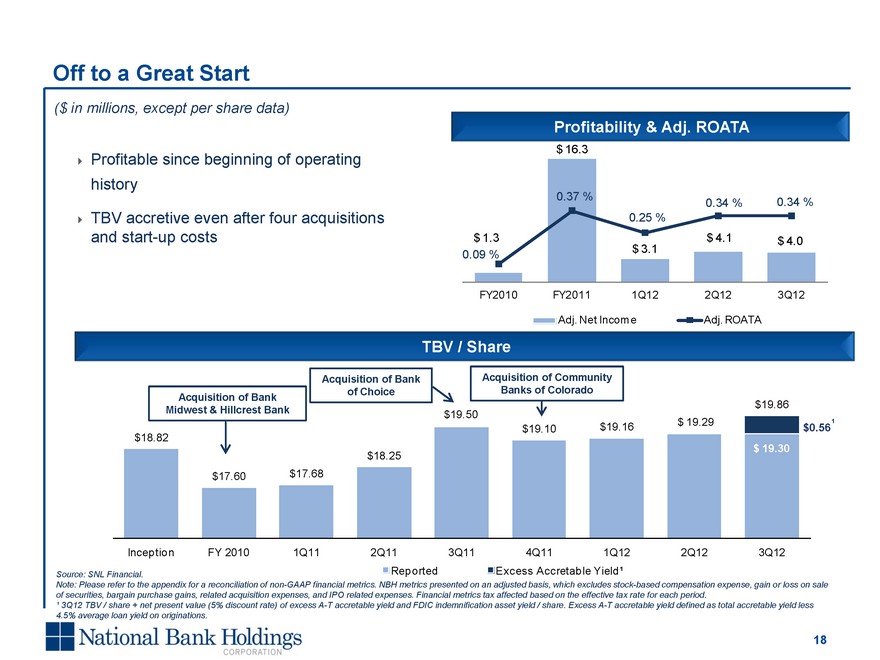
18 Off to a Great Start Profitability & Adj. ROATA TBV / Share ($ in millions, except per share data) Source: SNL Financial. Note: Please refer to the appendix for a reconciliation of non-GAAP financial metrics. NBH metrics presented on an adjusted basis, which excludes stock-based compensation expense, gain or loss on sale of securities, bargain purchase gains, related acquisition expenses, and IPO related expenses. Financial metrics tax affected based on the effective tax rate for each period. ¹ 3Q12 TBV / share + net present value (5% discount rate) of excess A-T accretable yield and FDIC indemnification asset yield / share. Excess A-T accretable yield defined as total accretable yield less 4.5% average loan yield on originations. Acquisition of Bank Midwest & Hillcrest Bank Acquisition of Bank of Choice Acquisition of Community Banks of Colorado 1 Profitable since beginning of operating history TBV accretive even after four acquisitions and start-up costs
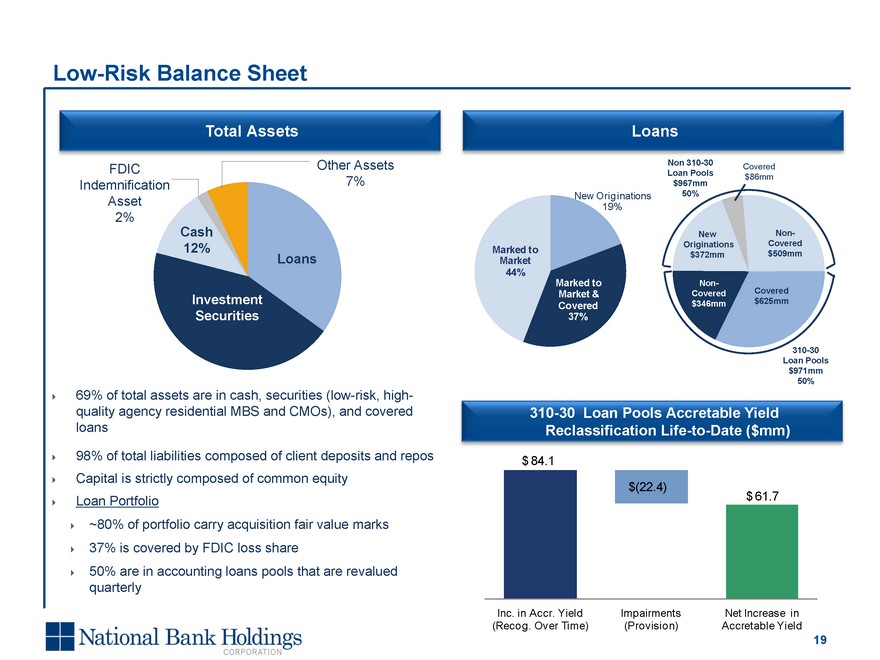
(CHART) 19 69% of total assets are in cash, securities (low-risk, high- quality agency residential MBS and CMOs), and covered loans 98% of total liabilities composed of client deposits and repos Capital is strictly composed of common equity Loan Portfolio ~80% of portfolio carry acquisition fair value marks 37% is covered by FDIC loss share 50% are in accounting loans pools that are revalued quarterly Total Assets Loans Non 310-30 Loan Pools $967mm 50% 310-30 Loan Pools $971mm 50% New Originations $372mm Covered $625mm Covered $86mm Non- Covered $509mm Non- Covered $346mm Low-Risk Balance Sheet 310-30 Loan Pools Accretable Yield Reclassification Life-to-Date ($mm)
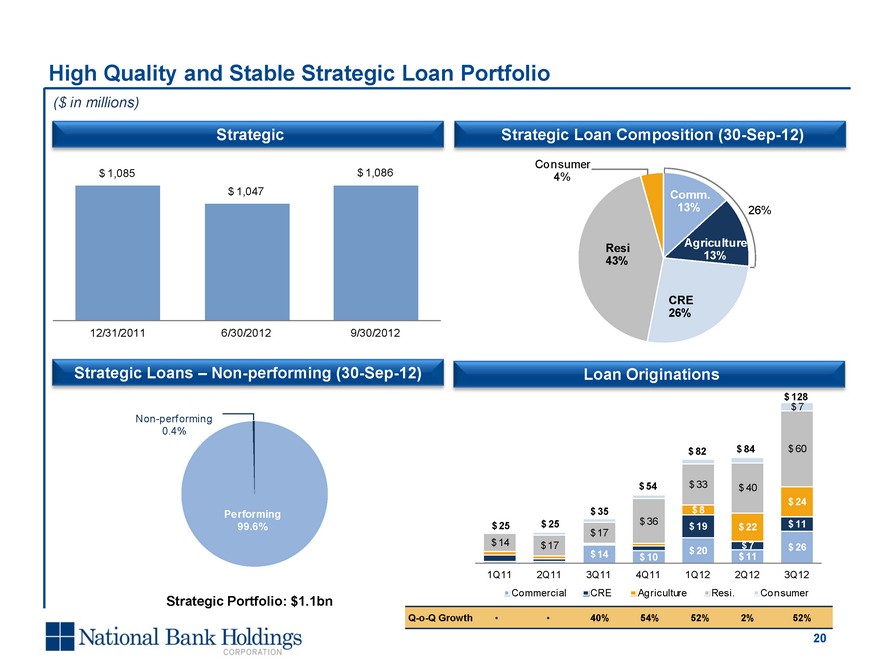
20 Strategic Strategic Loan Composition (30-Sep-12) ($ in millions) High Quality and Stable Strategic Loan Portfolio Strategic Loans – Non-performing (30-Sep-12) Strategic Portfolio: $1.1bn Loan Originations Q-o-Q Growth ? ? 40% 54% 52% 2% 52% Q-o-Q Growth ? ? 40% 54% 52% 2% 52%
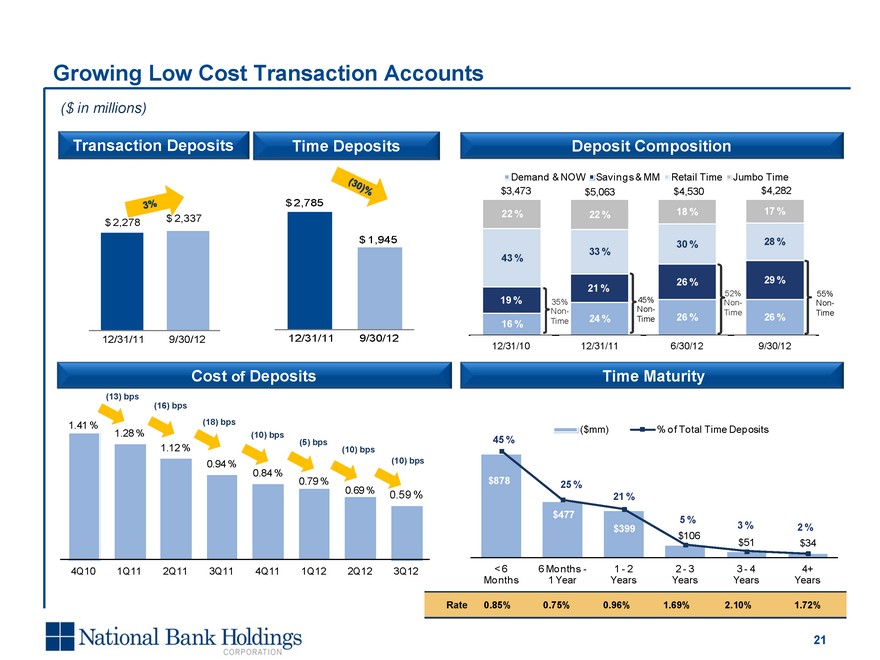
21 Deposit Composition
Date: 06-Feb-12 06:27:30
User: krgreen
Source: \\IBNJS002VF\BOULEVARD11\R oadshow Presentation\xls\Deposit Composition_V3.xlsx (Deposits) Cost of Deposits Time Maturity ($ in millions) Growing Low Cost Transaction Accounts (13) bps (16) bps (18) bps (10) bps (5) bps (10) bps 6/30/12 12/31/11 12/31/10 Rate 0.85% 0.75% 0.96% 1.69% 2.10% 1.72% (10) bps 9/30/12 Transaction Deposits Time Deposits 3% (30)%
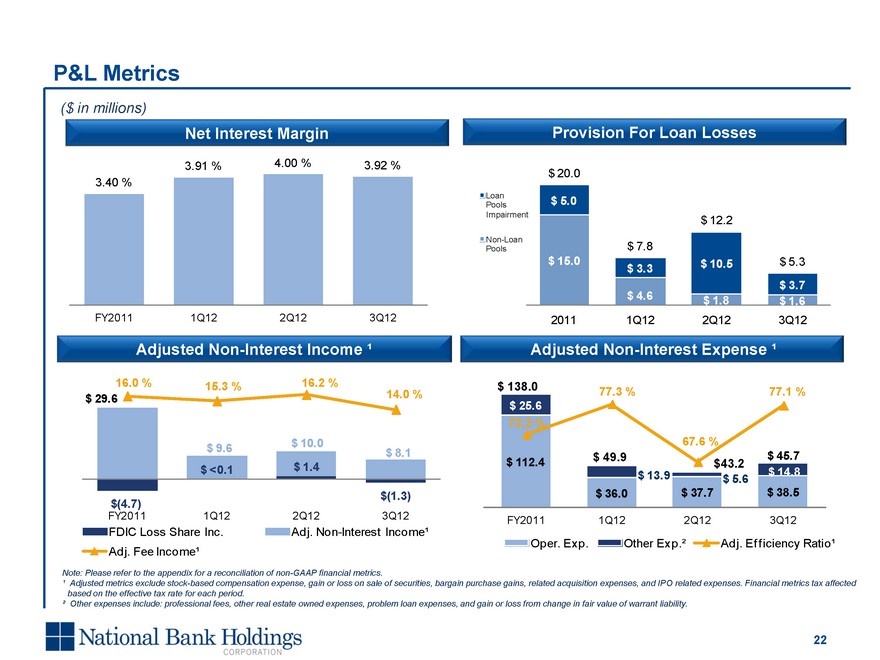
22 Provision For Loan Losses Note: Please refer to the appendix for a reconciliation of non-GAAP financial metrics. ¹ Adjusted metrics exclude stock-based compensation expense, gain or loss on sale of securities, bargain purchase gains, related acquisition expenses, and IPO related expenses. Financial metrics tax affected based on the effective tax rate for each period. ² Other expenses include: professional fees, other real estate owned expenses, problem loan expenses, and gain or loss from change in fair value of warrant liability.
Date: 06-Feb-12 06:27:30
User: krgreen
Source: \\IBNJS002VF\BOULEVARD11\R oadshow Presentation\xls\Deposit Composition_V3.xlsx (Deposits) Adjusted Non-Interest Income ¹ Adjusted Non-Interest Expense ¹ ($ in millions) P&L Metrics $ 138.0 $ 49.9 Net Interest Margin $43.2

Looking Ahead
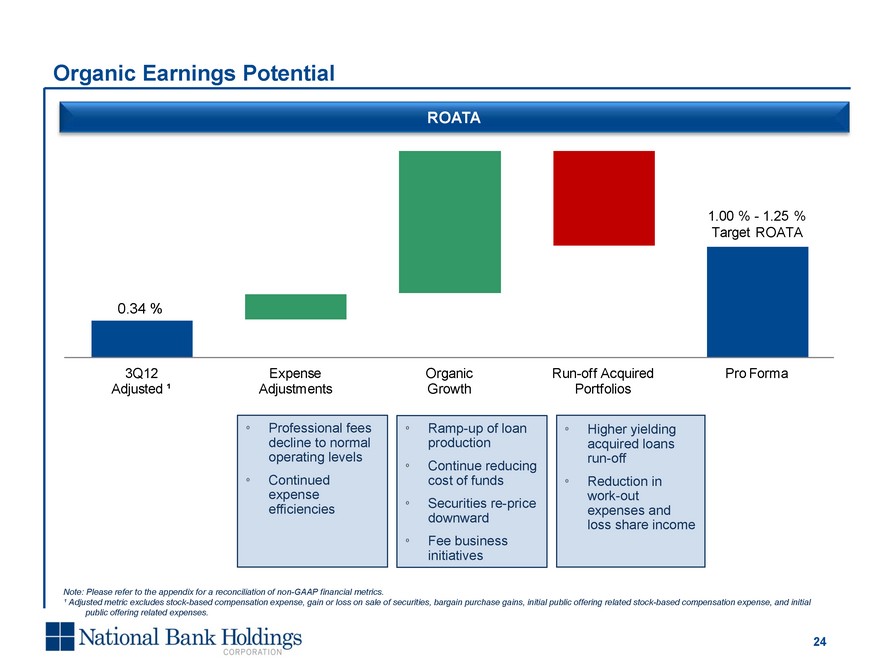
Organic Earnings Potential 24 ROATA Note: Please refer to the appendix for a reconciliation of non-GAAP financial metrics. ¹ Adjusted metric excludes stock-based compensation expense, gain or loss on sale of securities, bargain purchase gains, initial public offering related stock-based compensation expense, and initial public offering related expenses. Ramp-up of loan production Continue reducing cost of funds Securities re-price downward Fee business initiatives Professional fees decline to normal operating levels Continued expense efficiencies Hillcrest Bank Higher yielding acquired loans run-off Reduction in work-out expenses and loss share income
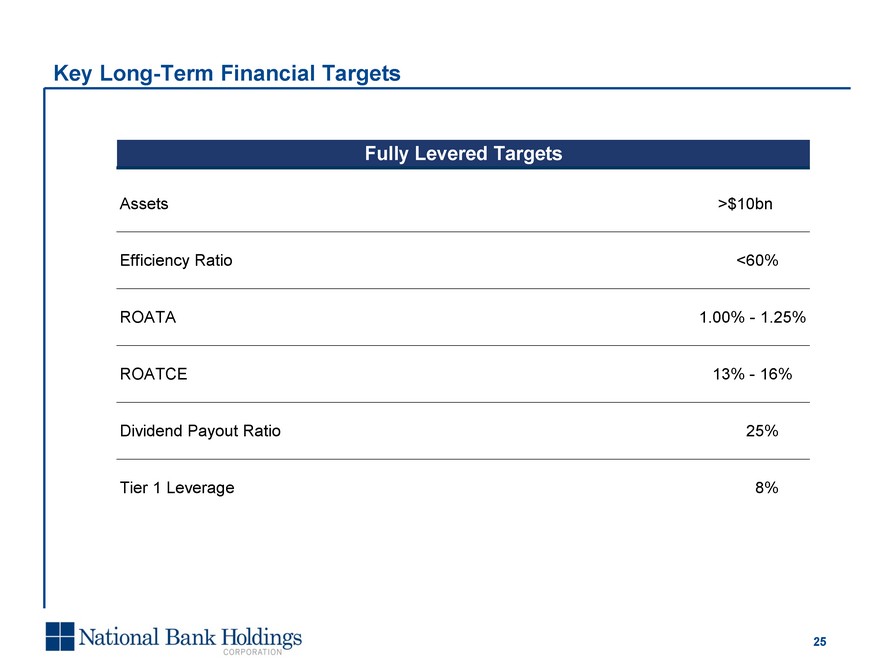
Key Long-Term Financial Targets 25
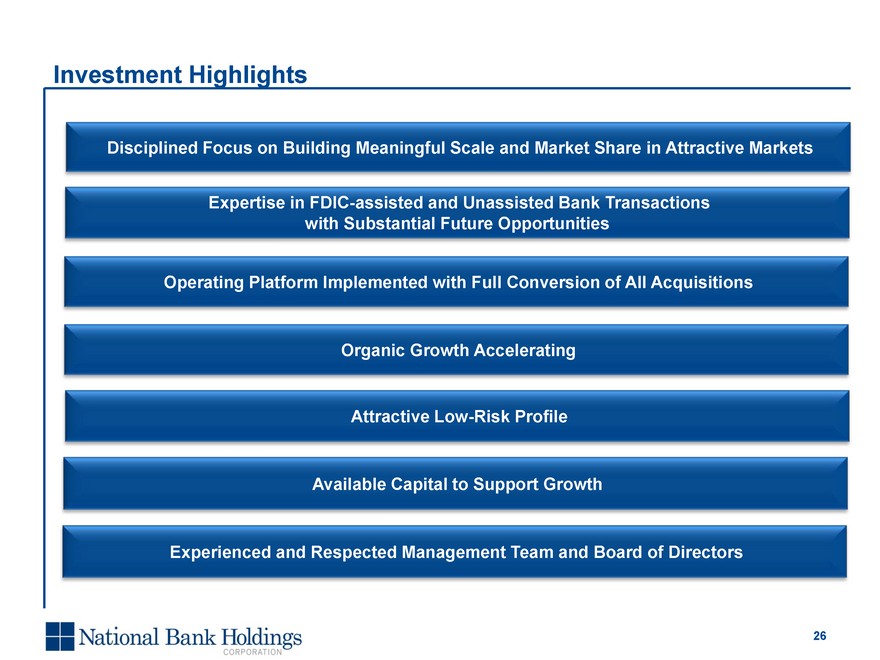
Investment Highlights 26 Disciplined Focus on Building Meaningful Scale and Market Share in Attractive Markets Expertise in FDIC-assisted and Unassisted Bank Transactions with Substantial Future Opportunities Operating Platform Implemented with Full Conversion of All Acquisitions Organic Growth Accelerating Attractive Low-Risk Profile Available Capital to Support Growth Experienced and Respected Management Team and Board of Directors

Appendix
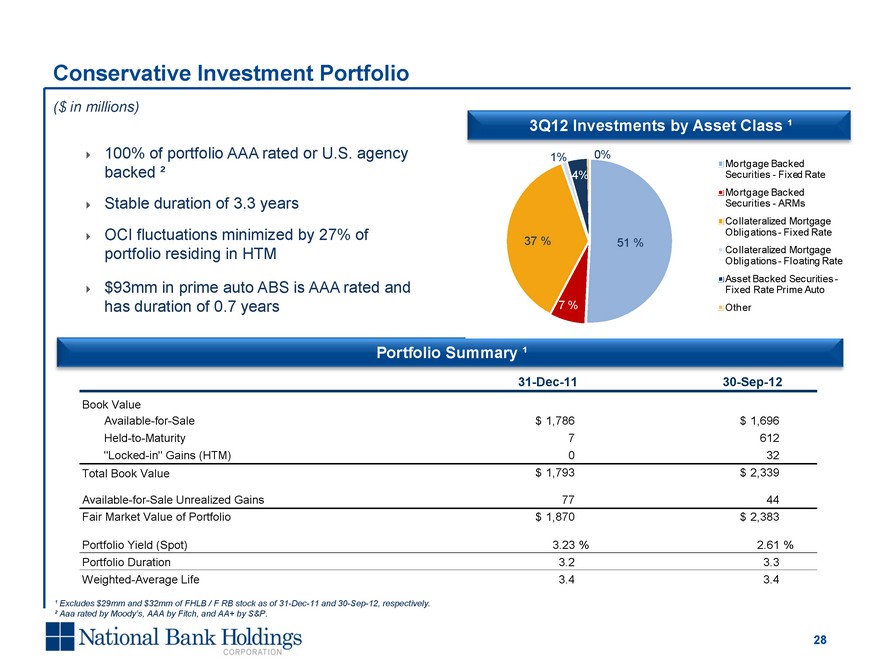
28 Conservative Investment Portfolio 3Q12 Investments by Asset Class ¹ Portfolio Summary ¹ 100% of portfolio AAA rated or U.S. agency backed ² Stable duration of 3.3 years OCI fluctuations minimized by 27% of portfolio residing in HTM $93mm in prime auto ABS is AAA rated and has duration of 0.7 years ($ in millions) ¹ Excludes $29mm and $32mm of FHLB / F RB stock as of 31-Dec-11 and 30-Sep-12, respectively. ² Aaa rated by Moody’s, AAA by Fitch, and AA+ by S&P.
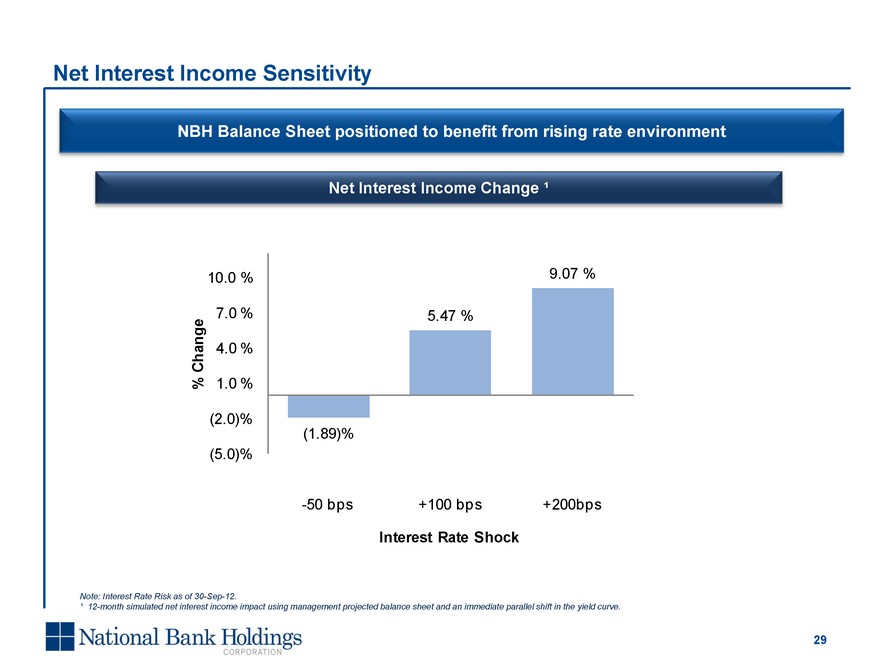
29 Net Interest Income Sensitivity Note: Interest Rate Risk as of 30-Sep-12. ¹ 12-month simulated net interest income impact using management projected balance sheet and an immediate parallel shift in the yield curve. NBH Balance Sheet positioned to benefit from rising rate environment Net Interest Income Change ¹
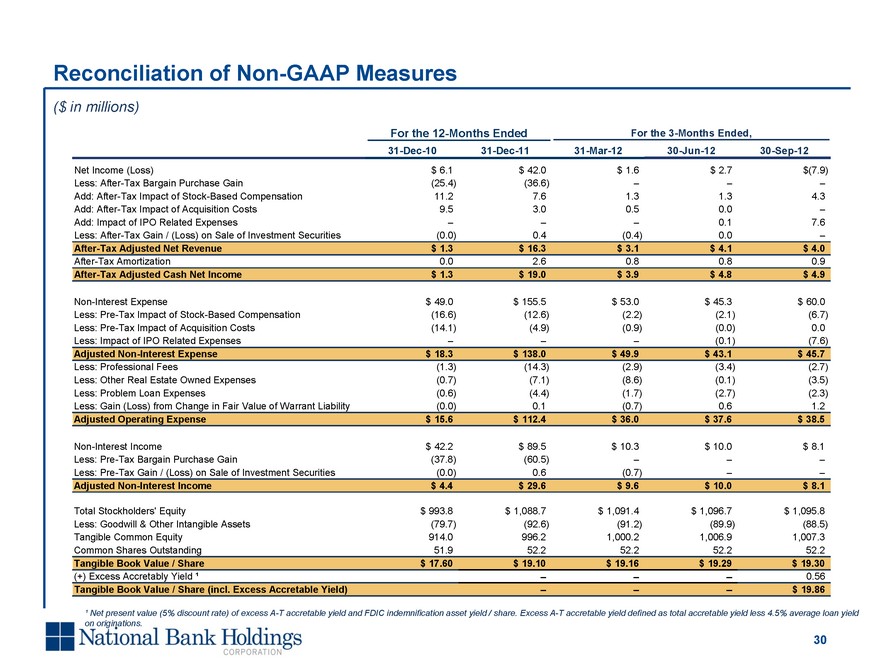
30 Reconciliation of Non-GAAP Measures Date: 07-Feb-12 08:18:08
User: krgreen
Source: \\IBNJS002VF\BOULEVARD11\A nalyst Day Presentation\Presentation\Consol idated Capital Position Graphs.xlsx (TCE-TA) ($ in millions) ¹ Net present value (5% discount rate) of excess A-T accretable yield and FDIC indemnification asset yield / share. Excess A-T accretable yield defined as total accretable yield less 4.5% average loan yield on originations.
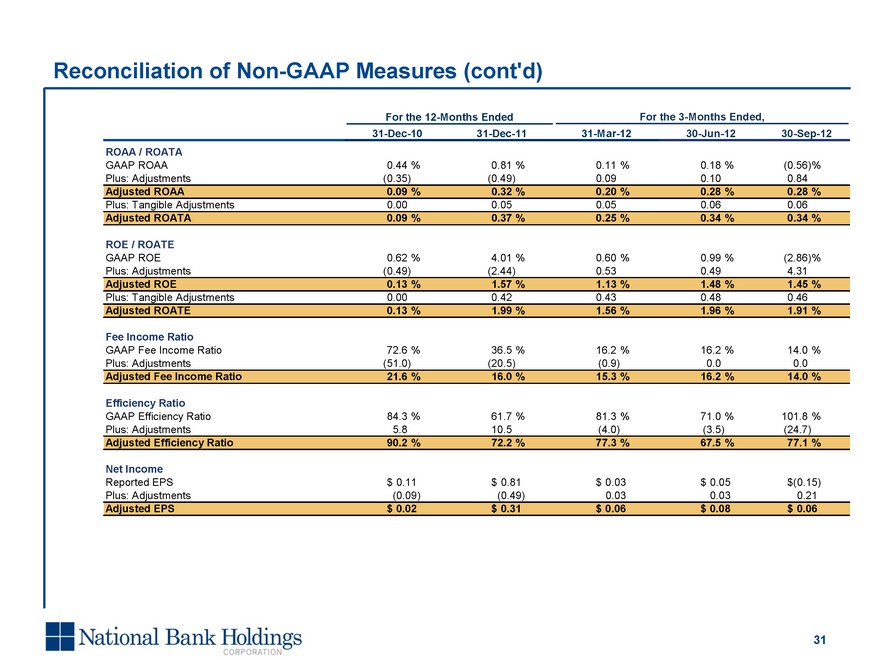
31 Reconciliation of Non-GAAP Measures (cont’d) Date: 07-Feb-12 08:18:08
User: krgreen
Source: \\IBNJS002VF\BOULEVARD11\A nalyst Day Presentation\Presentation\Consol idated Capital Position Graphs.xlsx (TCE-TA)