Attached files
| file | filename |
|---|---|
| 8-K - FORM 8-K - ZIONS BANCORPORATION, NATIONAL ASSOCIATION /UT/ | form8-k.htm |

November 27, 2012
Forward-Looking Statements This presentation contains statements that relate to the projected or modeled performance or condition of Zions Bancorporation and elements of or affecting such performance or condition, including statements with respect to forecasts, opportunities, models, illustrations, scenarios, beliefs, plans, objectives, goals, guidance, expectations, anticipations or estimates, and similar matters. These statements constitute forward-looking information within the meaning of the Private Securities Litigation Reform Act. Actual facts, determinations, results or achievements may differ materially from the statements provided in this presentation since such statements involve significant known and unknown risks and uncertainties. Factors that might cause such differences include, but are not limited to: competitive pressures among financial institutions; economic, market and business conditions, either nationally, internationally, or locally in areas in which Zions Bancorporation conducts its operations, being less favorable than expected; changes in the interest rate environment reducing expected interest margins; changes in debt, equity and securities markets; adverse legislation or regulatory changes; and other factors described in Zions Bancorporation’s most recent annual and quarterly reports. In addition, the statements contained in this presentation are based on facts and circumstances as understood by management of the company on the date of this presentation, which may change in the future. Except as required by law, Zions Bancorporation disclaims any obligation to update any statements or to publicly announce the result of any revisions to any of the forward-looking statements included herein to reflect future events, developments, determinations or understandings. *
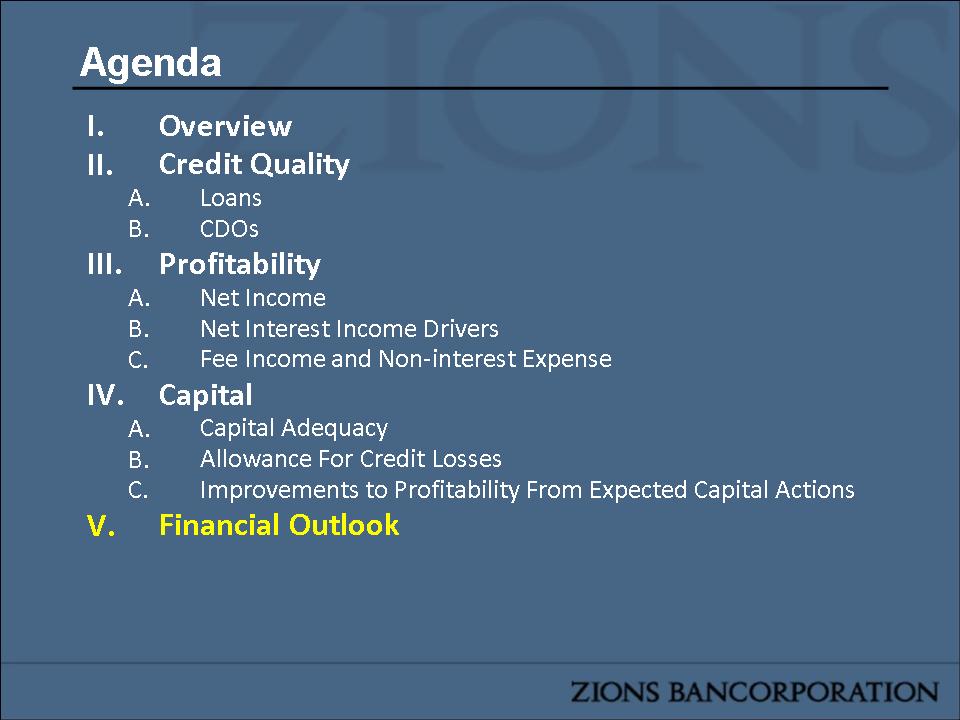
Overview Credit Quality Loans CDOs Profitability Net Income Net Interest Income Drivers Fee Income and Non-interest Expense Capital Capital Adequacy Allowance For Credit Losses Improvements to Profitability From Expected Capital Actions Financial Outlook Agenda
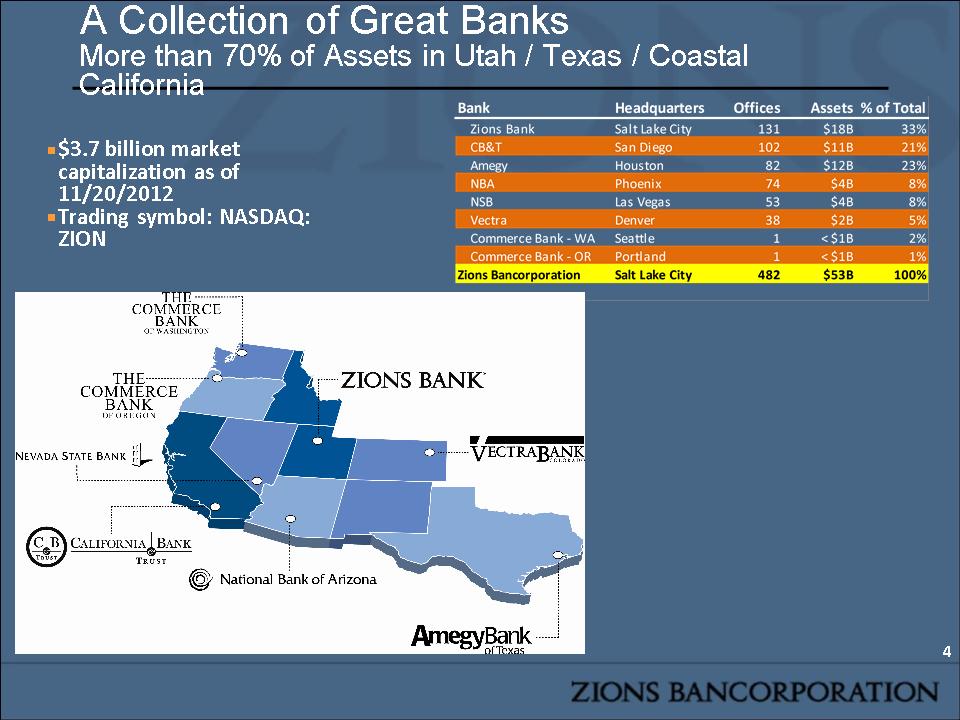
$3.7 billion market capitalization as of 11/20/2012 Trading symbol: NASDAQ: ZION A Collection of Great Banks More than 70% of Assets in Utah / Texas / Coastal California *
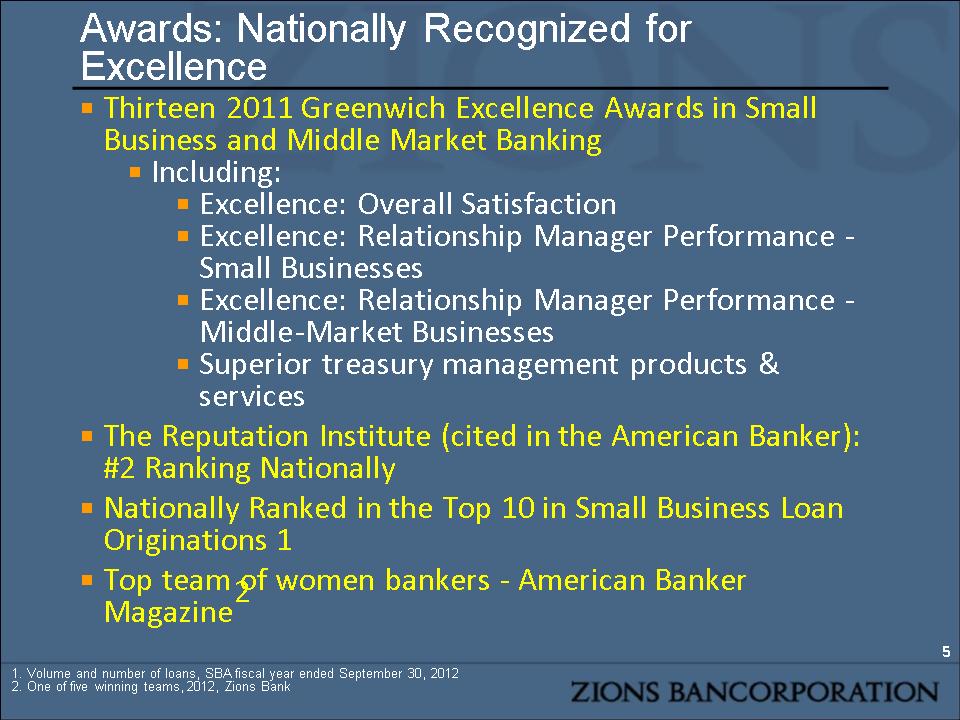
Awards: Nationally Recognized for Excellence Thirteen 2011 Greenwich Excellence Awards in Small Business and Middle Market Banking Including: Excellence: Overall Satisfaction Excellence: Relationship Manager Performance – Small Businesses Excellence: Relationship Manager Performance – Middle-Market Businesses Superior treasury management products & services The Reputation Institute (cited in the American Banker): #2 Ranking Nationally Nationally Ranked in the Top 10 in Small Business Loan Originations 1 Top team of women bankers – American Banker Magazine2 * 1. Volume and number of loans, SBA fiscal year ended September 30, 2012 2. One of five winning teams, 2012, Zions Bank
Overview Credit Quality Loans CDOs Profitability Net Income Net Interest Income Drivers Fee Income and Non-interest Expense Capital Capital Adequacy Allowance For Credit Losses Improvements to Profitability From Expected Capital Actions Financial Outlook Agenda
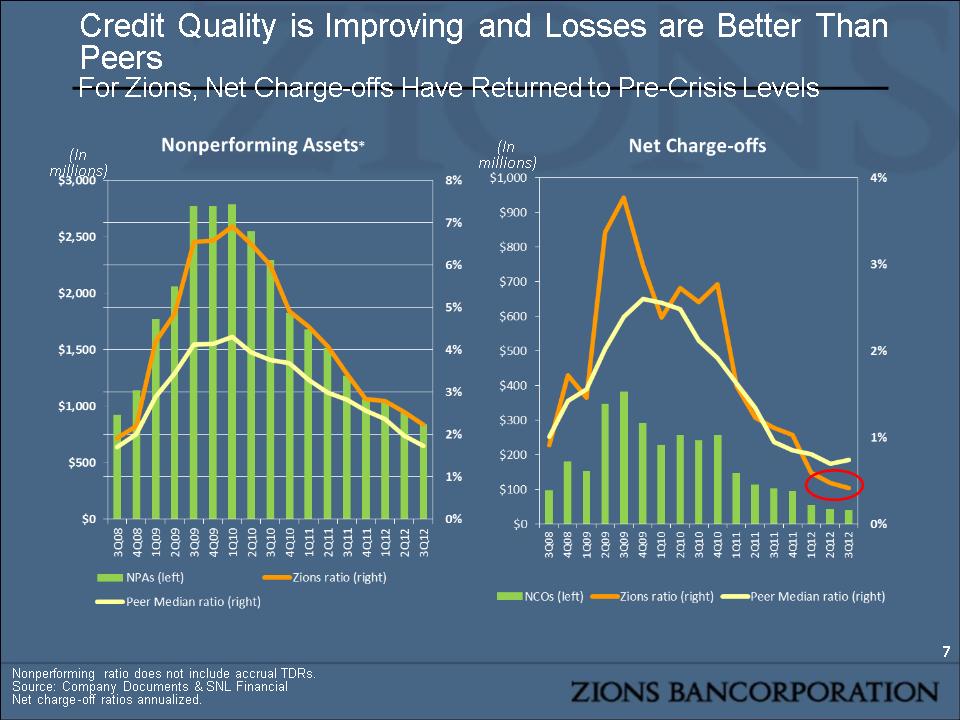
Credit Quality is Improving and Losses are Better Than Peers For Zions, Net Charge-offs Have Returned to Pre-Crisis Levels Nonperforming ratio does not include accrual TDRs. Source: Company Documents & SNL Financial Net charge-off ratios annualized. * (In millions) (In millions)
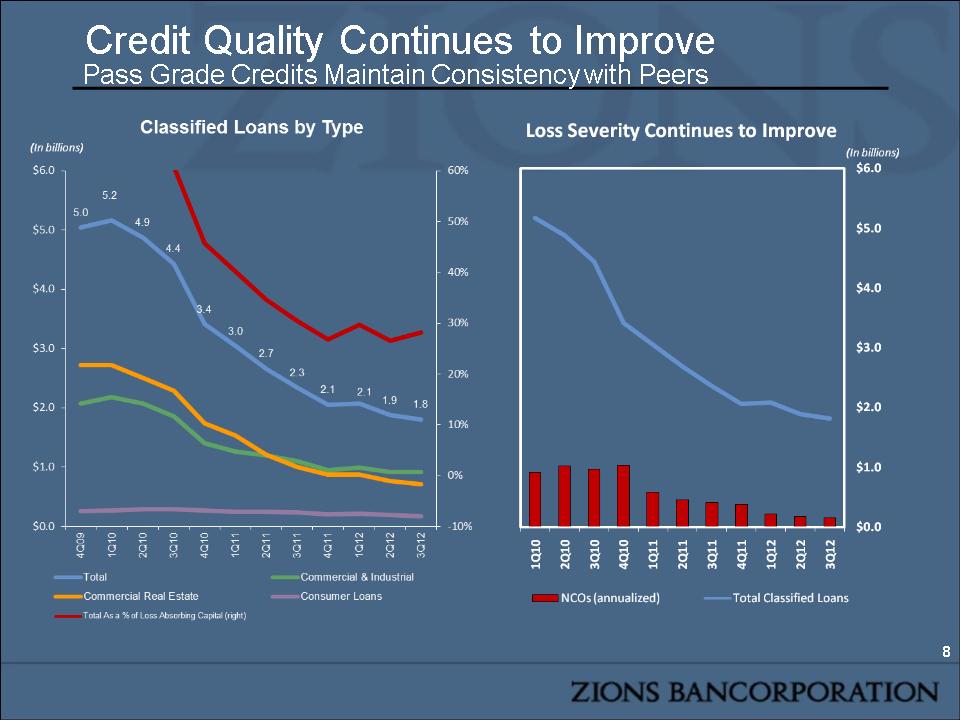
* Credit Quality Continues to Improve Pass Grade Credits Maintain Consistency with Peers
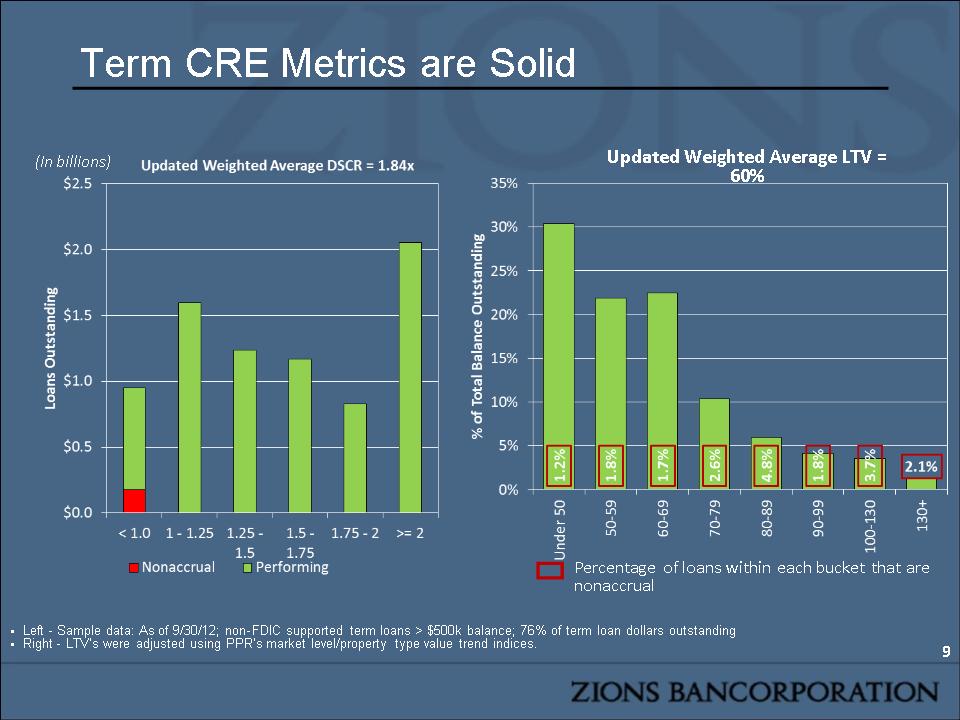
(In billions) Updated Weighted Average LTV = 60% Left - Sample data: As of 9/30/12; non-FDIC supported term loans > $500k balance; 76% of term loan dollars outstanding Right - LTV’s were adjusted using PPR’s market level/property type value trend indices. * Term CRE Metrics are Solid Percentage of loans within each bucket that are nonaccrual
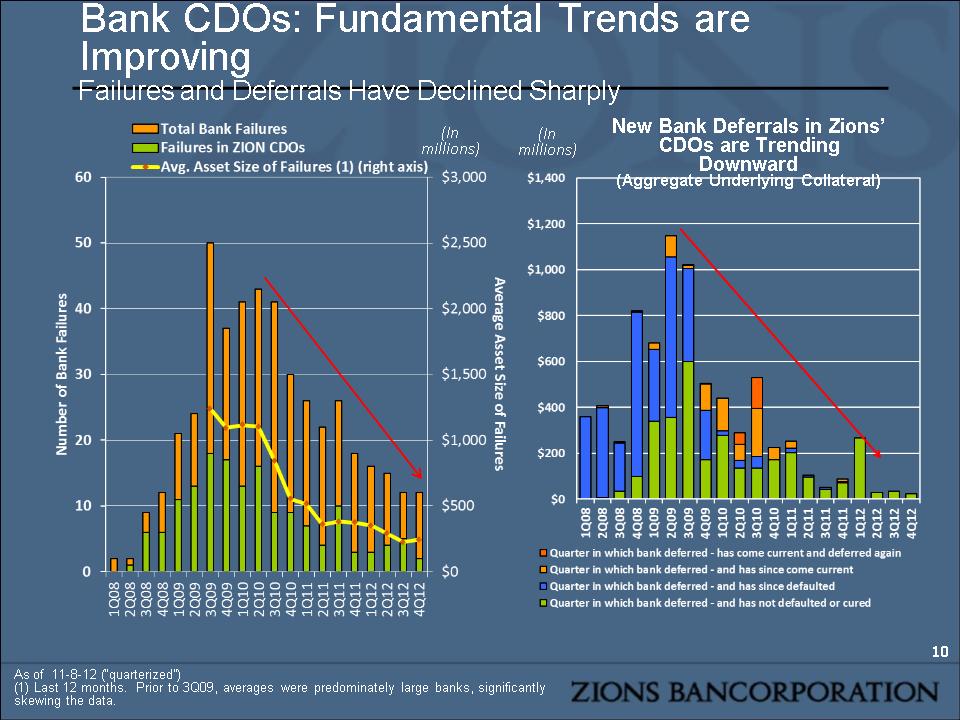
Bank CDOs: Fundamental Trends are Improving Failures and Deferrals Have Declined Sharply * As of 11-8-12 (“quarterized”) (1) Last 12 months. Prior to 3Q09, averages were predominately large banks, significantly skewing the data. New Bank Deferrals in Zions’ CDOs are Trending Downward (Aggregate Underlying Collateral) (In millions) (In millions)
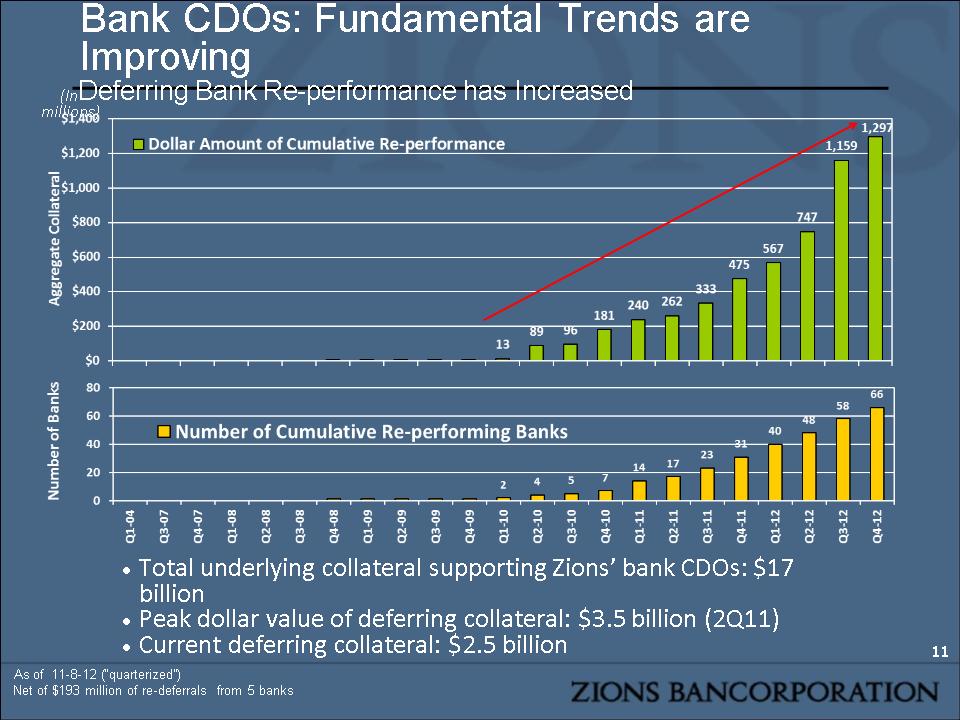
Bank CDOs: Fundamental Trends are Improving Deferring Bank Re-performance has Increased * As of 11-8-12 (“quarterized”) * (In millions) Net of $193 million of re-deferrals from 5 banks Total underlying collateral supporting Zions’ bank CDOs: $17 billion Peak dollar value of deferring collateral: $3.5 billion (2Q11) Current deferring collateral: $2.5 billion
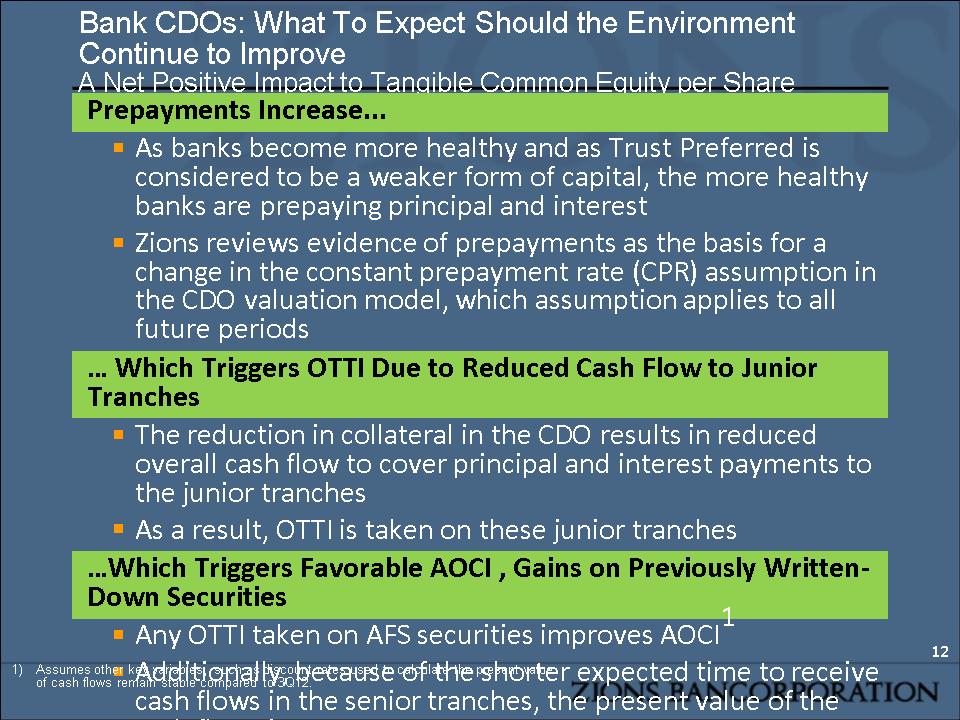
Bank CDOs: What To Expect Should the Environment Continue to Improve A Net Positive Impact to Tangible Common Equity per Share Prepayments Increase... As banks become more healthy and as Trust Preferred is considered to be a weaker form of capital, the more healthy banks are prepaying principal and interest Zions reviews evidence of prepayments as the basis for a change in the constant prepayment rate (CPR) assumption in the CDO valuation model, which assumption applies to all future periods … Which Triggers OTTI Due to Reduced Cash Flow to Junior Tranches The reduction in collateral in the CDO results in reduced overall cash flow to cover principal and interest payments to the junior tranches As a result, OTTI is taken on these junior tranches …Which Triggers Favorable AOCI , Gains on Previously Written-Down Securities Any OTTI taken on AFS securities improves AOCI1 Additionally, because of the shorter expected time to receive cash flows in the senior tranches, the present value of the cash flows improves * Assumes other key variables, such as discount rates used to calculate the present value of cash flows remain stable compared to 3Q12.
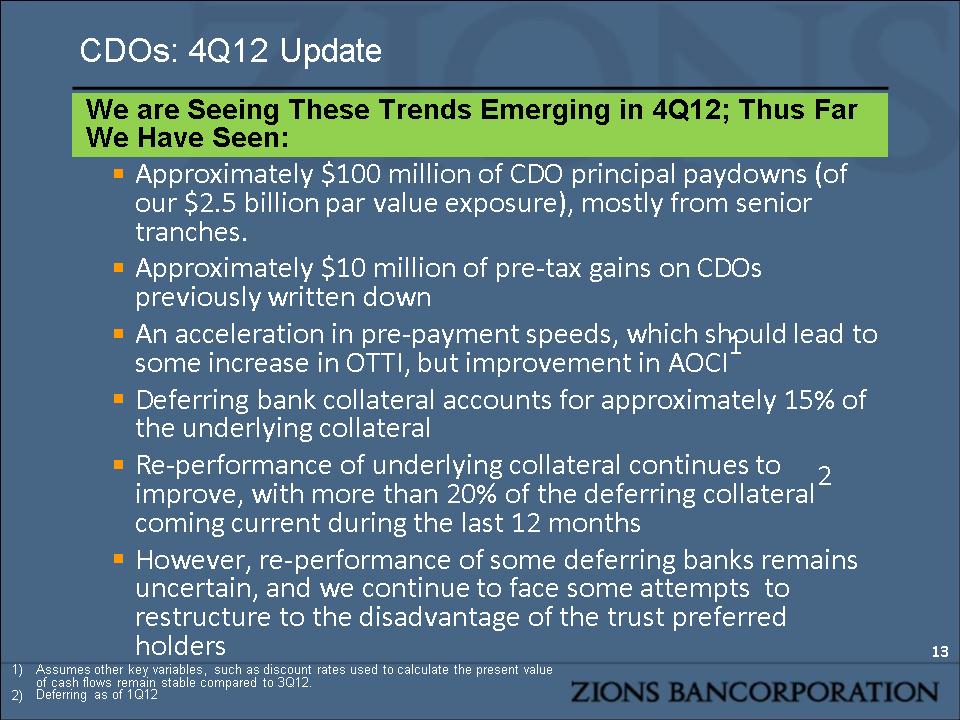
CDOs: 4Q12 Update We are Seeing These Trends Emerging in 4Q12; Thus Far We Have Seen: Approximately $100 million of CDO principal paydowns (of our $2.5 billion par value exposure), mostly from senior tranches. Approximately $10 million of pre-tax gains on CDOs previously written down An acceleration in pre-payment speeds, which should lead to some increase in OTTI, but improvement in AOCI1 Deferring bank collateral accounts for approximately 15% of the underlying collateral Re-performance of underlying collateral continues to improve, with more than 20% of the deferring collateral2 coming current during the last 12 months However, re-performance of some deferring banks remains uncertain, and we continue to face some attempts to restructure to the disadvantage of the trust preferred holders Assumes other key variables, such as discount rates used to calculate the present value of cash flows remain stable compared to 3Q12. Deferring as of 1Q12 *
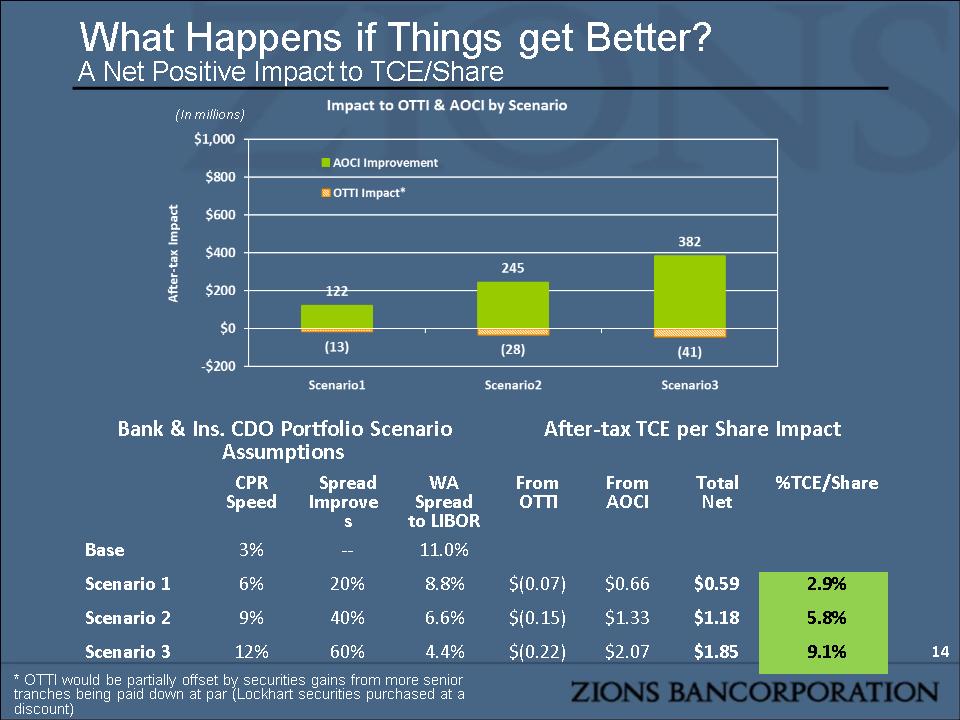
What Happens if Things get Better? A Net Positive Impact to TCE/Share Bank & Ins. CDO Portfolio Scenario Assumptions Bank & Ins. CDO Portfolio Scenario Assumptions Bank & Ins. CDO Portfolio Scenario Assumptions Bank & Ins. CDO Portfolio Scenario Assumptions After-tax TCE per Share Impact After-tax TCE per Share Impact After-tax TCE per Share Impact After-tax TCE per Share Impact CPR Speed Spread Improves WA Spread to LIBOR From OTTI From AOCI Total Net %TCE/Share Base 3% -- 11.0% Scenario 1 6% 20% 8.8% $(0.07) $0.66 $0.59 2.9% Scenario 2 9% 40% 6.6% $(0.15) $1.33 $1.18 5.8% Scenario 3 12% 60% 4.4% $(0.22) $2.07 $1.85 9.1% * * OTTI would be partially offset by securities gains from more senior tranches being paid down at par (Lockhart securities purchased at a discount) (In millions)
Agenda Overview Credit Quality Loans CDOs Profitability Net Income Net Interest Income Drivers Fee Income and Non-interest Expense Capital Capital Adequacy Allowance For Credit Losses Improvements to Profitability From Expected Capital Actions Financial Outlook
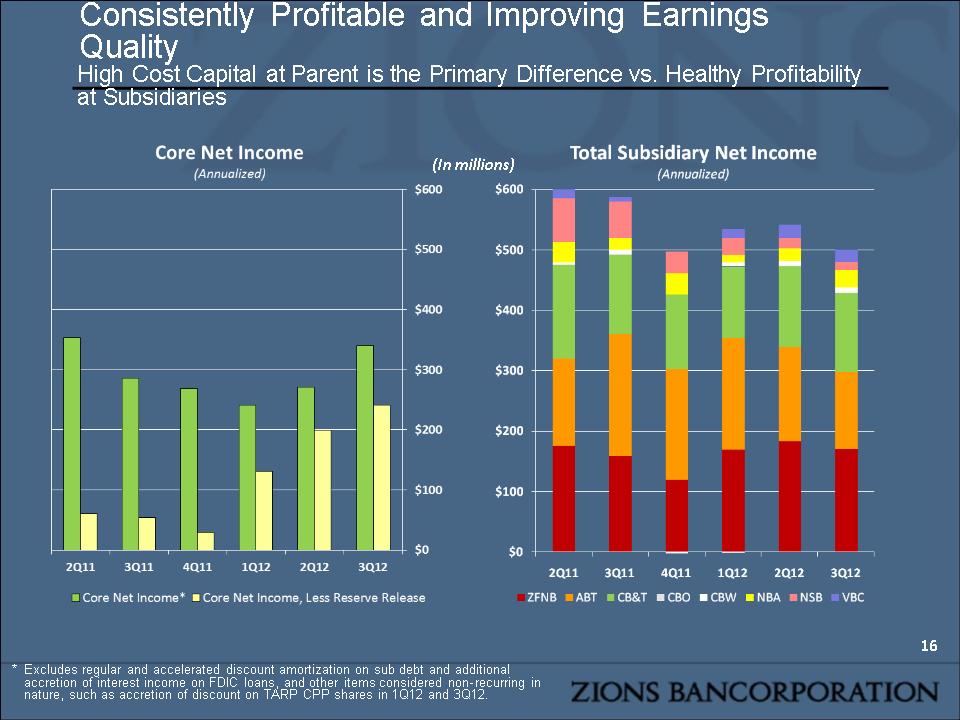
Consistently Profitable and Improving Earnings Quality High Cost Capital at Parent is the Primary Difference vs. Healthy Profitability at Subsidiaries * * Excludes regular and accelerated discount amortization on sub debt and additional accretion of interest income on FDIC loans, and other items considered non-recurring in nature, such as accretion of discount on TARP CPP shares in 1Q12 and 3Q12. (In millions)
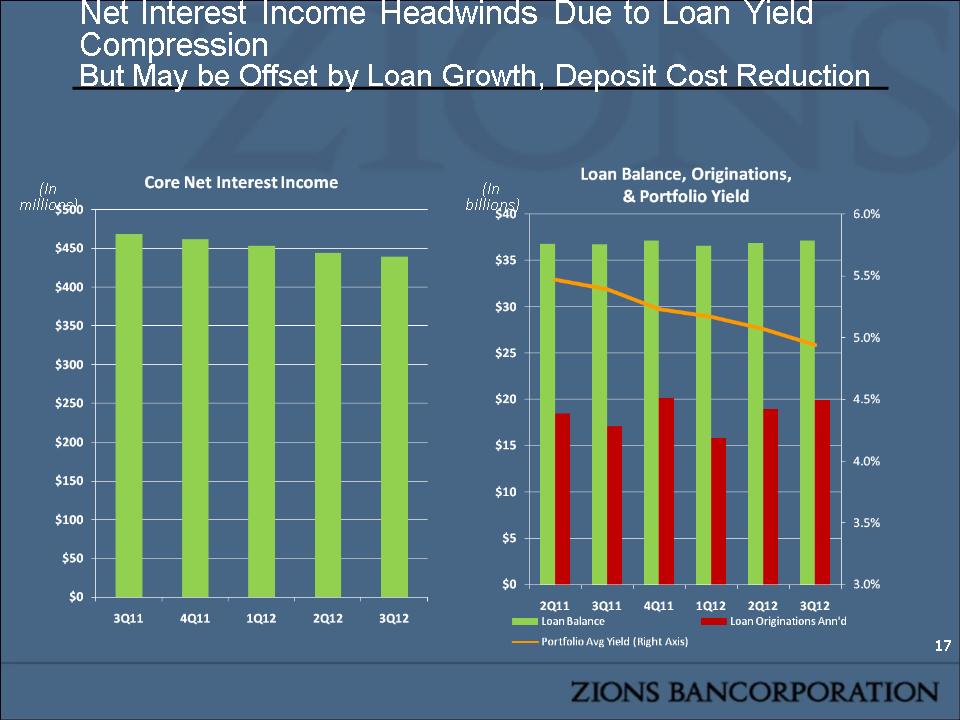
Net Interest Income Headwinds Due to Loan Yield Compression But May be Offset by Loan Growth, Deposit Cost Reduction * (In millions) (In billions)
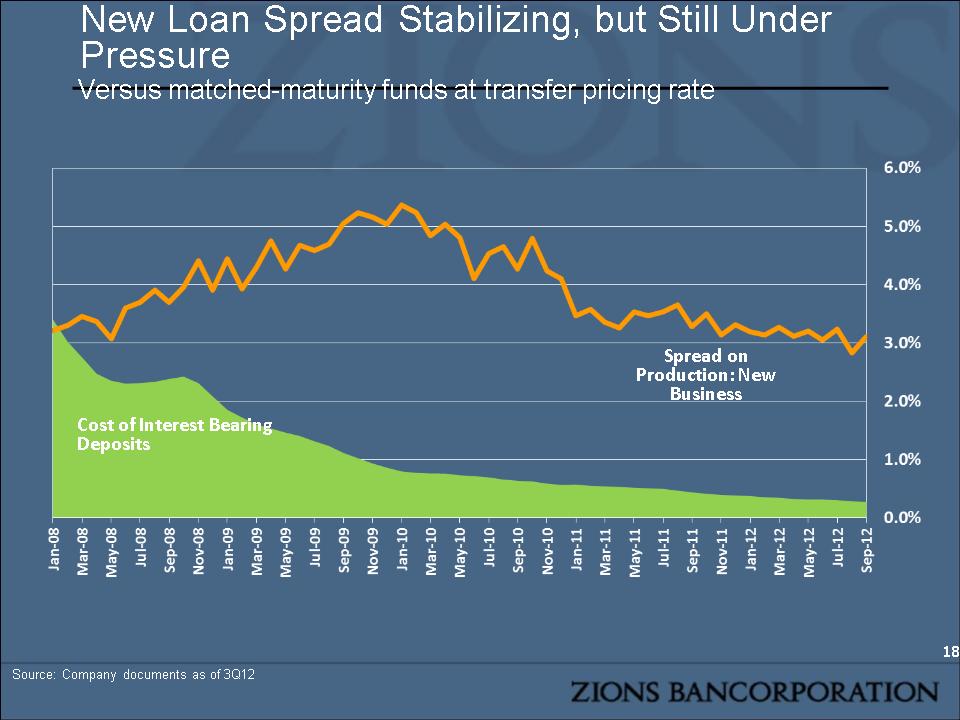
New Loan Spread Stabilizing, but Still Under Pressure Versus matched-maturity funds at transfer pricing rate Cost of Interest Bearing Deposits Spread on Production: New Business * Source: Company documents as of 3Q12
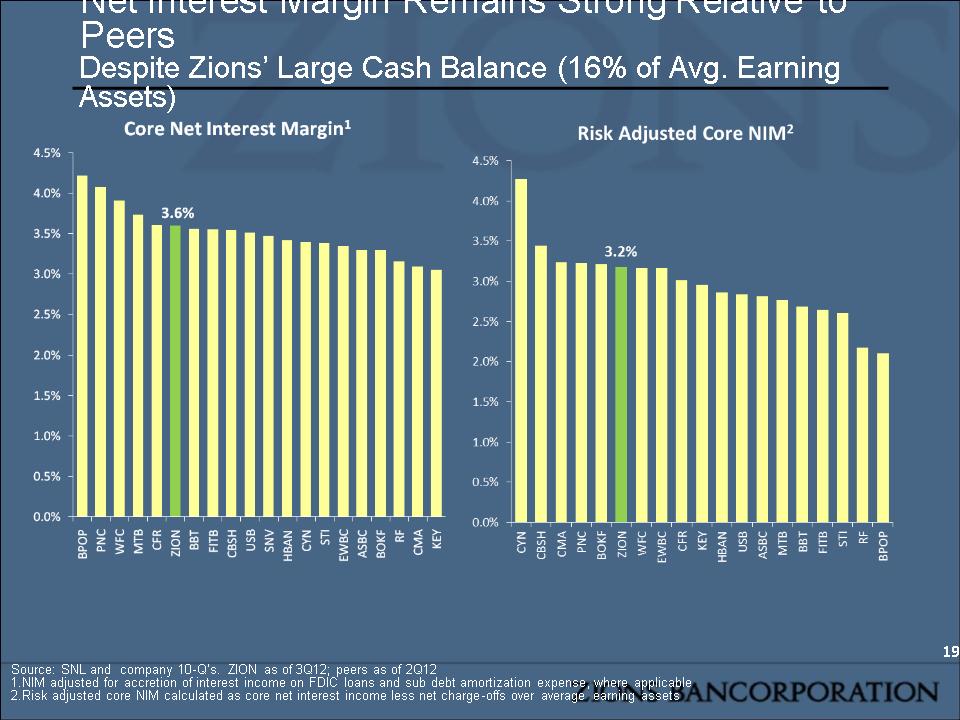
Source: SNL and company 10-Q’s. ZION as of 3Q12; peers as of 2Q12 NIM adjusted for accretion of interest income on FDIC loans and sub debt amortization expense, where applicable Risk adjusted core NIM calculated as core net interest income less net charge-offs over average earning assets * Net Interest Margin Remains Strong Relative to Peers Despite Zions’ Large Cash Balance (16% of Avg. Earning Assets)
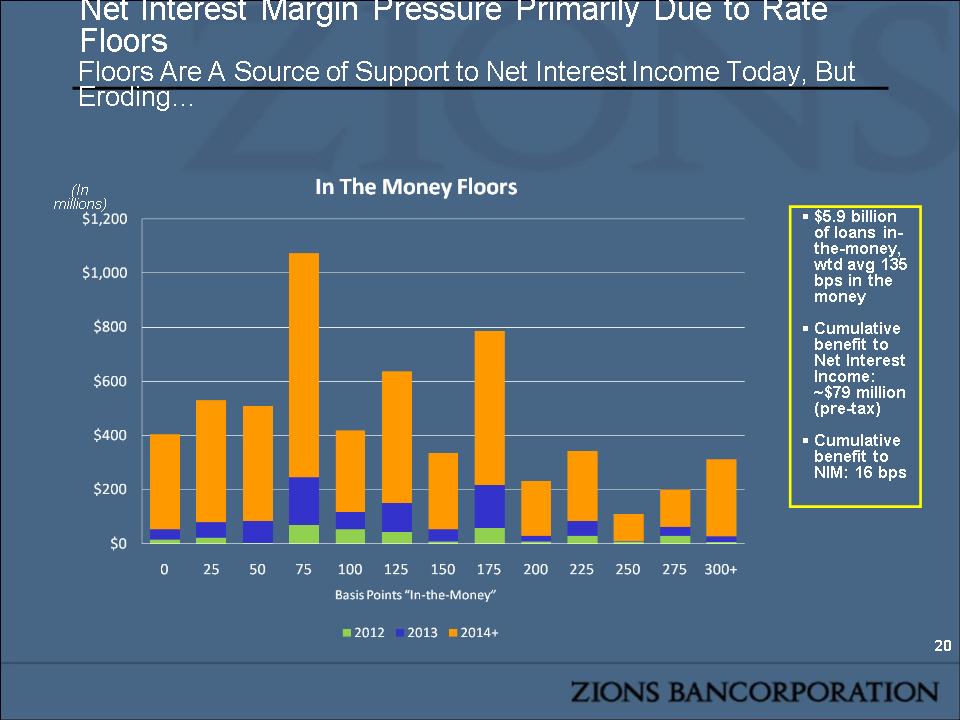
* (In millions) Net Interest Margin Pressure Primarily Due to Rate Floors Floors Are A Source of Support to Net Interest Income Today, But Eroding… $5.9 billion of loans in-the-money, wtd avg 135 bps in the money Cumulative benefit to Net Interest Income: ~$79 million (pre-tax) Cumulative benefit to NIM: 16 bps
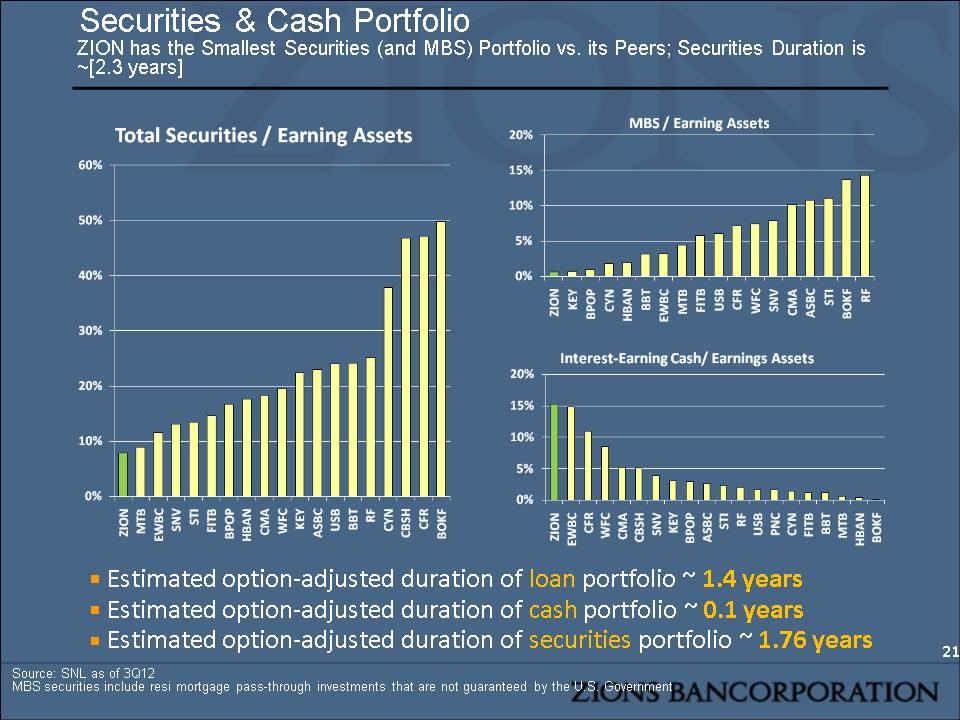
Securities & Cash Portfolio ZION has the Smallest Securities (and MBS) Portfolio vs. its Peers; Securities Duration is ~[2.3 years] Source: SNL as of 3Q12 MBS securities include resi mortgage pass-through investments that are not guaranteed by the U.S. Government Estimated option-adjusted duration of loan portfolio ~ 1.4 years Estimated option-adjusted duration of cash portfolio ~ 0.1 years Estimated option-adjusted duration of securities portfolio ~ 1.76 years *
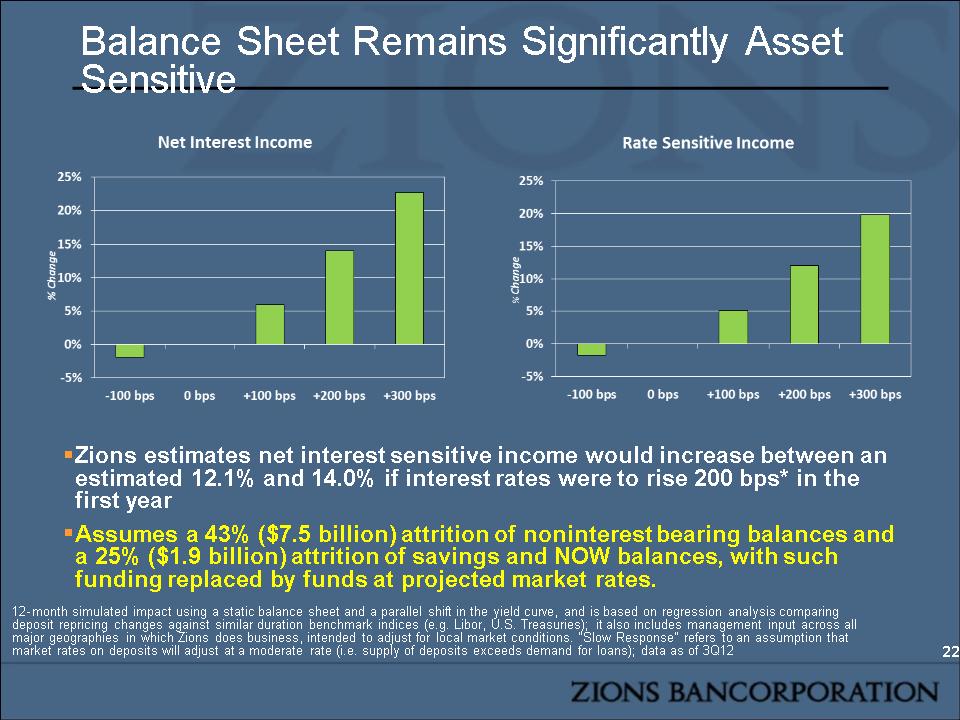
Balance Sheet Remains Significantly Asset Sensitive * Zions estimates net interest sensitive income would increase between an estimated 12.1% and 14.0% if interest rates were to rise 200 bps* in the first year Assumes a 43% ($7.5 billion) attrition of noninterest bearing balances and a 25% ($1.9 billion) attrition of savings and NOW balances, with such funding replaced by funds at projected market rates. 12-month simulated impact using a static balance sheet and a parallel shift in the yield curve, and is based on regression analysis comparing deposit repricing changes against similar duration benchmark indices (e.g. Libor, U.S. Treasuries); it also includes management input across all major geographies in which Zions does business, intended to adjust for local market conditions. “Slow Response” refers to an assumption that market rates on deposits will adjust at a moderate rate (i.e. supply of deposits exceeds demand for loans); data as of 3Q12
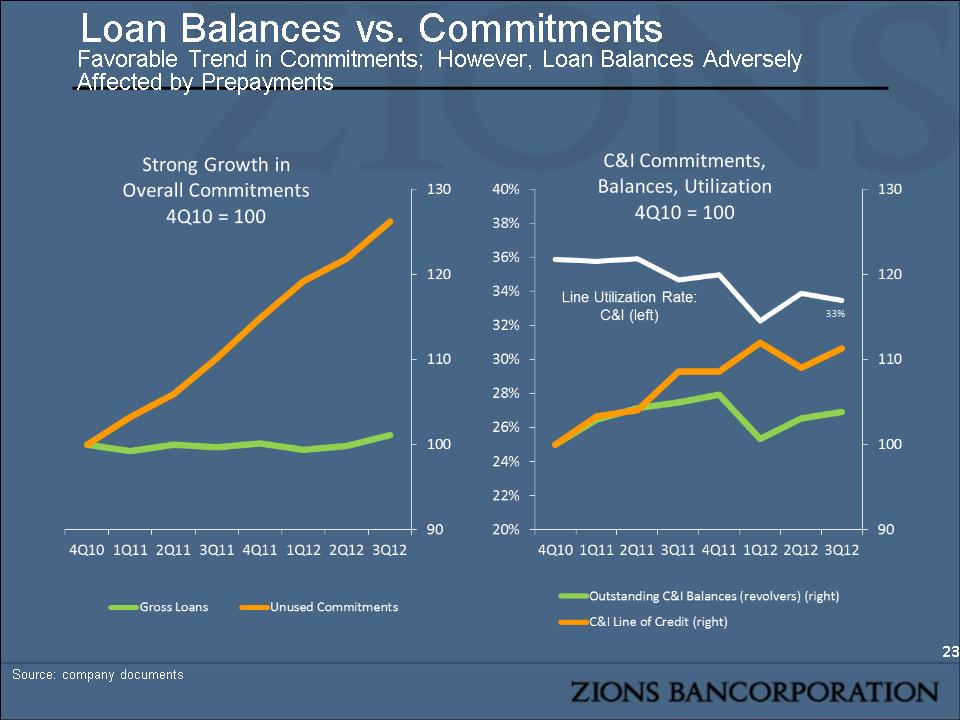
Loan Balances vs. Commitments Favorable Trend in Commitments; However, Loan Balances Adversely Affected by Prepayments Source: company documents *
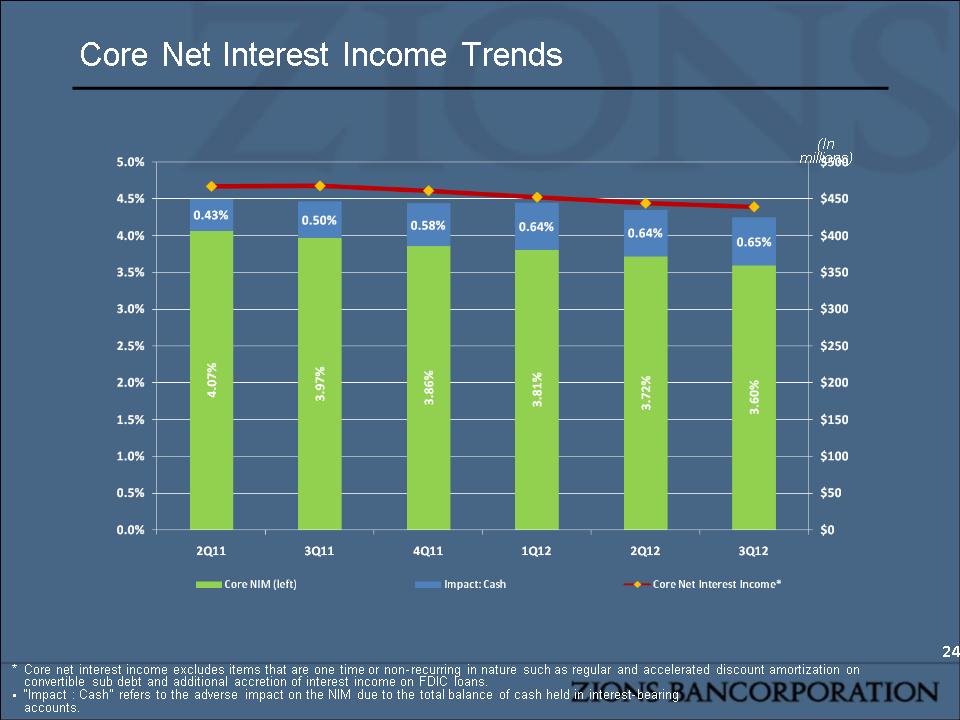
(In millions) Core Net Interest Income Trends * * Core net interest income excludes items that are one time or non-recurring in nature such as regular and accelerated discount amortization on convertible sub debt and additional accretion of interest income on FDIC loans. “Impact : Cash” refers to the adverse impact on the NIM due to the total balance of cash held in interest-bearing accounts.
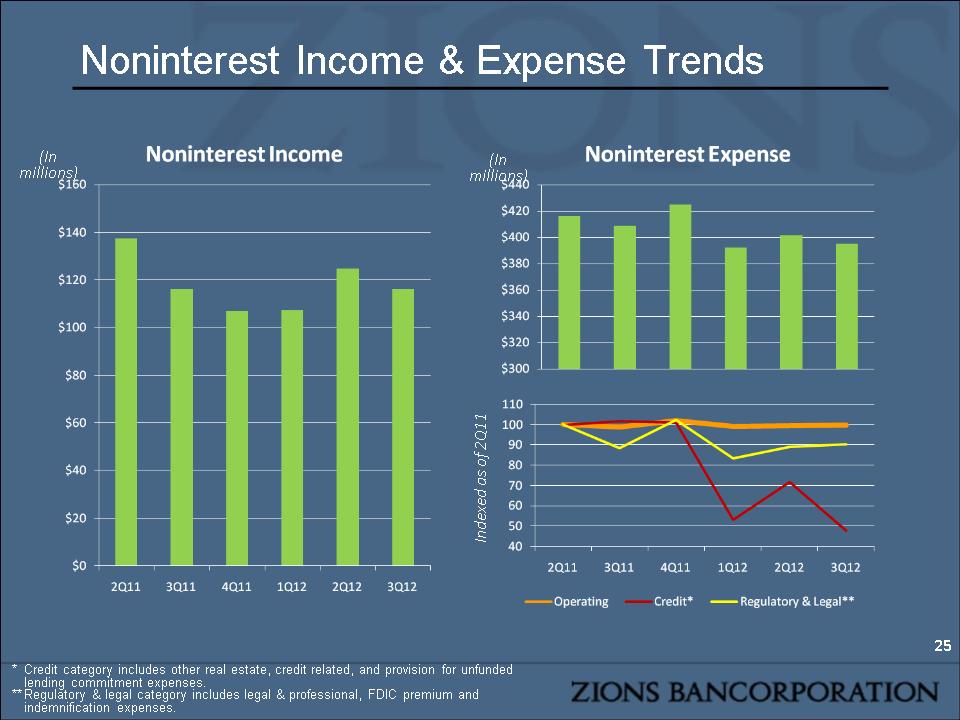
Noninterest Income & Expense Trends * (In millions) Indexed as of 2Q11 * Credit category includes other real estate, credit related, and provision for unfunded lending commitment expenses. ** Regulatory & legal category includes legal & professional, FDIC premium and indemnification expenses. (In millions)
Agenda Overview Credit Quality Loans CDOs Profitability Net Income Net Interest Income Drivers Fee Income and Non-interest Expense Capital Capital Adequacy Allowance For Credit Losses Improvements to Profitability From Expected Capital Actions Financial Outlook
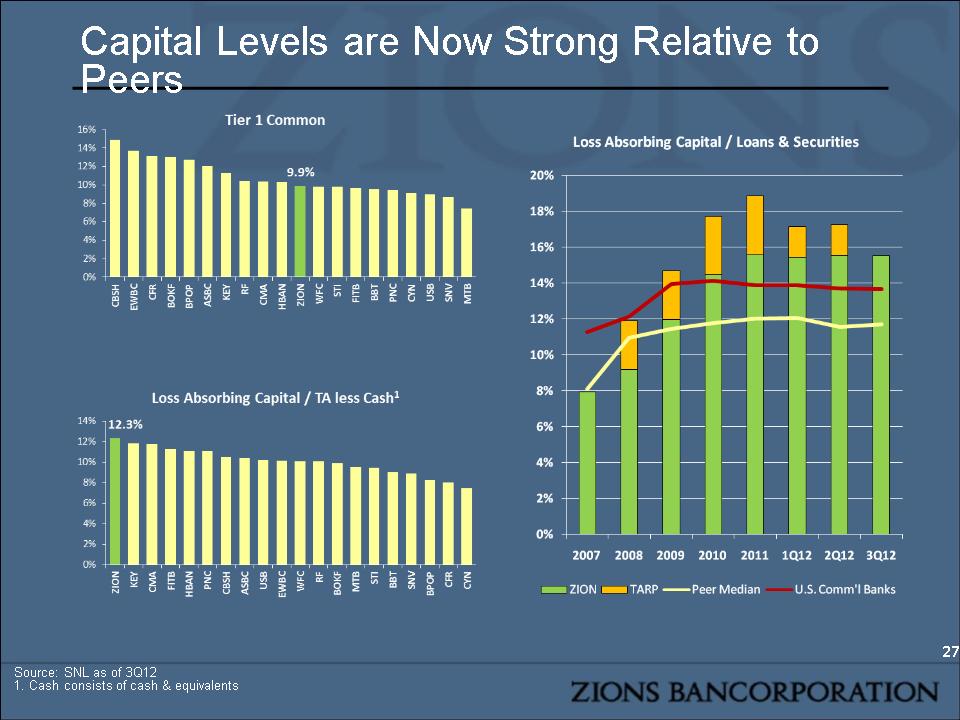
Capital Levels are Now Strong Relative to Peers Source: SNL as of 3Q12 1. Cash consists of cash & equivalents *
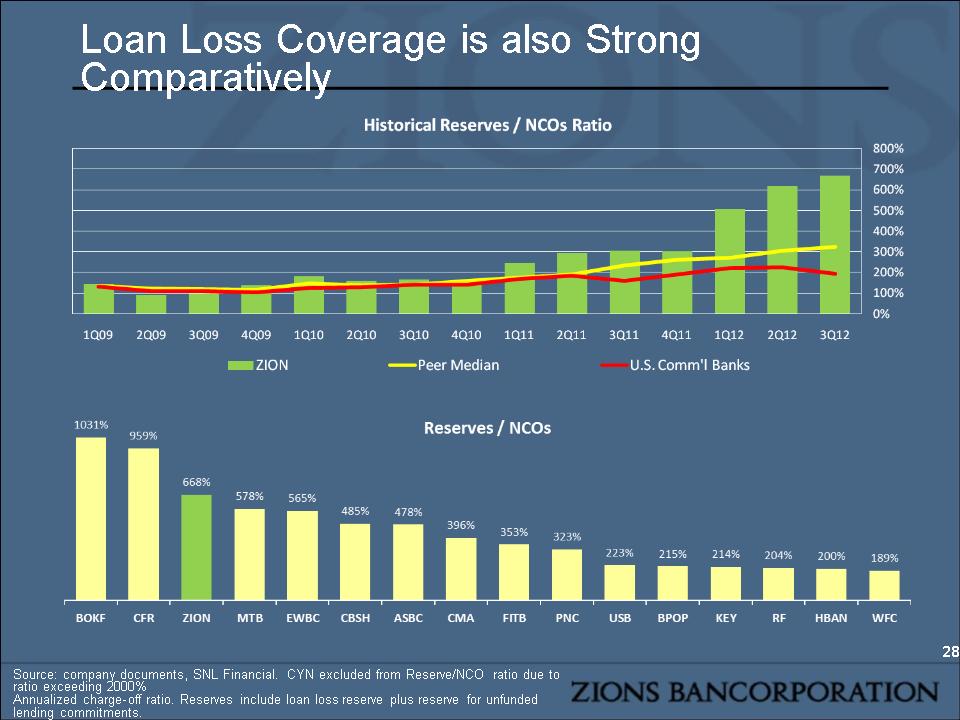
Source: company documents, SNL Financial. CYN excluded from Reserve/NCO ratio due to ratio exceeding 2000% Annualized charge-off ratio. Reserves include loan loss reserve plus reserve for unfunded lending commitments. * Loan Loss Coverage is also Strong Comparatively
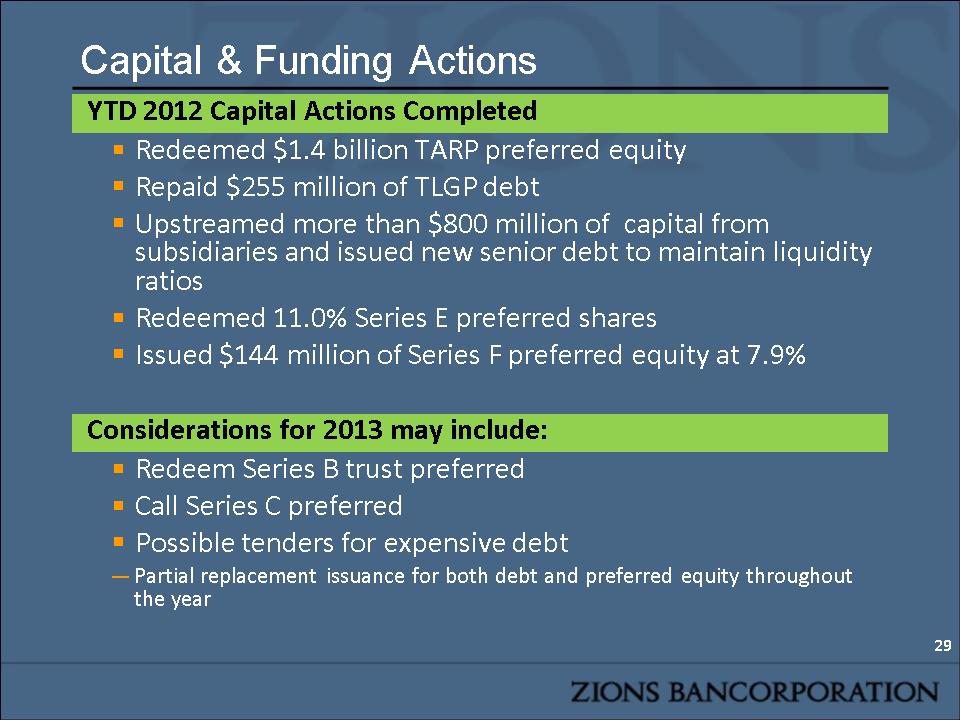
Capital & Funding Actions * YTD 2012 Capital Actions Completed Redeemed $1.4 billion TARP preferred equity Repaid $255 million of TLGP debt Upstreamed more than $800 million of capital from subsidiaries and issued new senior debt to maintain liquidity ratios Redeemed 11.0% Series E preferred shares Issued $144 million of Series F preferred equity at 7.9% Considerations for 2013 may include: Redeem Series B trust preferred Call Series C preferred Possible tenders for expensive debt Partial replacement issuance for both debt and preferred equity throughout the year

Impact of Capitalization Assumes no change to revenue and noninterest expense * Not updated for Basel III Notice of Proposed Rulemaking Key assumptions for medium-term target capital stack: preferred stock dividend: 6.5% (after tax); subordinated debt interest rate: 5.5% (pre-tax); senior debt interest rate: 4.5% (pre-tax). Rates are based upon current market conditions and do not reflect possible changes to ratings or other macro events. $2,500 $0 Adjusted EPS – Annualized
Agenda Overview Credit Quality Loans CDOs Profitability Net Income Net Interest Income Drivers Fee Income and Non-interest Expense Capital Capital Adequacy Allowance For Credit Losses Improvements to Profitability From Expected Capital Actions Financial Outlook
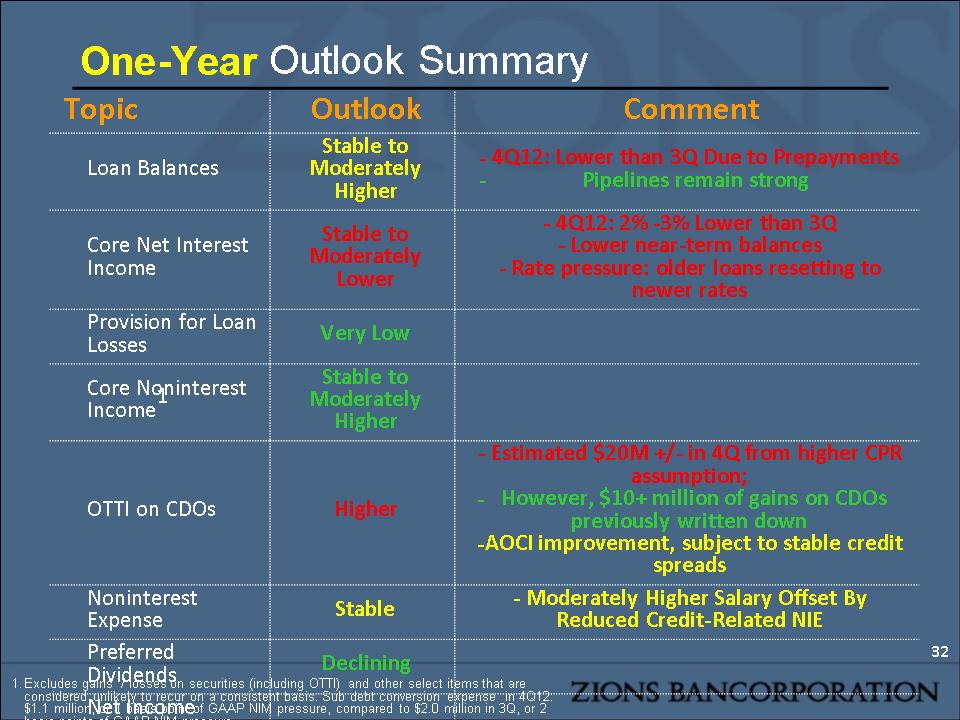
Topic Outlook Comment Loan Balances Stable to Moderately Higher 4Q12: Lower than 3Q Due to Prepayments Pipelines remain strong Core Net Interest Income Stable to Moderately Lower - 4Q12: 2% -3% Lower than 3Q - Lower near-term balances - Rate pressure: older loans resetting to newer rates Provision for Loan Losses Very Low Core Noninterest Income1 Stable to Moderately Higher OTTI on CDOs Higher - Estimated $20M +/- in 4Q from higher CPR assumption; However, $10+ million of gains on CDOs previously written down AOCI improvement, subject to stable credit spreads Noninterest Expense Stable - Moderately Higher Salary Offset By Reduced Credit-Related NIE Preferred Dividends Declining Net Income Available to Common Increasing One-Year Outlook Summary * Excludes gains / losses on securities (including OTTI) and other select items that are considered unlikely to recur on a consistent basis. Sub debt conversion expense in 4Q12: $1.1 million, or 1 basis point of GAAP NIM pressure, compared to $2.0 million in 3Q, or 2 basis points of GAAP NIM pressure