Attached files
| file | filename |
|---|---|
| 8-K - FORM 8-K - FULTON FINANCIAL CORP | d444527d8k.htm |
 Investor Presentation
Data as of September 30, 2012
Ticker Symbol: FULT (NASDAQ)
Exhibit 99.1 |
 Forward-Looking Statements
2
This presentation may contain forward-looking statements with respect to Fulton Financial
Corporation’s financial condition, results of operations and business. Do not
unduly rely on forward-looking statements. Forward-looking statements can be
identified by the use of words such as “may,” “should,” “will,” “could,” “estimates,” “predicts,”
“potential,” “continue,” “anticipates,” “believes,”
“plans,” “expects,” “future,” “intends” and similar expressions which
are intended to identify forward-looking statements.
Forward-looking statements are not guarantees of future performance and are subject to risks and
uncertainties, some of which are beyond the Corporation’s control and ability to predict,
that could cause actual results to differ materially from those expressed in the
forward-looking statements. The Corporation undertakes no obligation, other than as
required by law, to update or revise any forward-looking statements whether as a result of new information,
future events or otherwise. Many
factors could affect future financial results including, without limitation: the impact of adverse changes in the
economy and real estate markets; increases in non-performing assets which may reduce the level of
earning assets and require the Corporation to increase the allowance for credit losses,
charge-off loans and incur elevated collection and carrying costs related to such
non-performing assets; acquisition and growth strategies; market risk; changes or adverse
developments in political or regulatory conditions; a disruption in, or abnormal functioning of, credit and other
markets, including the lack of or reduced access to markets for mortgages and other asset-backed
securities and for commercial paper and other short-term borrowings; changes in the levels
of, or methodology for determining, FDIC deposit insurance premiums and assessments; the
effect of competition and interest rates on net interest margin and net interest income;
investment strategy and other income growth; investment securities gains and losses; declines
in the value of securities which may result in charges to earnings; changes in rates of deposit and
loan growth or a decline in loans originated; relative balances of rate-sensitive assets
to rate-sensitive liabilities; salaries and employee benefits and other expenses;
amortization of intangible assets; goodwill impairment; capital and liquidity strategies; and
other financial and business matters for future periods.
For a more complete discussion of certain risks and uncertainties affecting the Corporation, please
see the sections entitled “Risk Factors” and “Management’s Discussion and
Analysis of Financial Condition and Results of Operations” set forth in the
Corporation’s filings with the Securities and Exchange Commission.
|
 About
Us
Mid-Atlantic financial holding company
6 community banks / 5 states
Fulton Financial Advisors
Fulton Mortgage Company
270 community banking offices
Asset size: $16.3 billion
3,800 team members
Market capitalization: $ 2.0 billion
Book value per common share: $ 10.36
Tangible book value per common share: $ 7.63
Shares outstanding: 199 million
3 |
 1.
EPS Growth 2. ROA Improvement
3. Spread Management /Net Interest Margin
4. Improve Asset Quality
5. Deploy Capital Prudently
6. Leverage Market Opportunities
7. Profitable Organic / Acquisitive Growth
Corporate Goals and Priorities
4 |
 Goals
and Priorities 1. Earnings per Share Growth
Q3/12 Diluted EPS: 21 cents
Up 5.0% linked quarter (20 cents)
Up 5.0% year over year (20 cents)
5 |
 Income
Statement Summary 6
Q3 2012
Q2 2012
$
%
(dollars in thousands, except per-share data)
Net Interest Income
135,881
$
137,530
$
(1,649)
$
-1%
Loan Loss Provision
(23,000)
(25,500)
2,500
-10%
Non-Interest Income
51,962
51,826
136
0%
Securities Gains
42
1,538
(1,496)
-97%
Non-Interest Expenses
(110,043)
(112,143)
2,100
-2%
Income Taxes
(13,260)
(13,360)
100
-1%
Net Income
41,582
$
39,891
$
1,691
$
4%
Per Share (Diluted)
0.21
$
0.20
$
0.01
$
5% |
  Income
Statement Summary (Nine Months Ended September 30
th
)
7
2012
2011
$
%
(dollars in thousands, except per-share data)
Net Interest Income
412,106
$
421,701
$
(9,595)
$
-2%
Loan Loss Provision
(76,500)
(105,000)
28,500
-27%
Non-Interest Income
154,217
137,872
16,345
12%
Securities Gains
2,831
1,507
1,324
88%
Non-Interest Expenses
(332,897)
(307,616)
(25,281)
8%
Income Taxes
(40,152)
(38,970)
(1,182)
3%
Net Income
119,605
$
109,494
$
10,111
$
9%
Per Share (Diluted)
0.60
$
0.55
$
0.05
$
9% |
  Ending
Loans 8
Q3 2012
Q3 2011
$
%
(dollars in millions)
Comm'l Mort
4,633
$
4,491
$
142
$
3%
Commercial
3,508
3,690
(182)
-5%
Home Equity
1,603
1,631
(28)
-2%
Resid Mort
1,214
1,041
173
17%
Construction
597
648
(51)
-8%
Consumer/Other
378
394
(16)
-4%
Total Loans
11,933
$
11,895
$
38
$
0% |
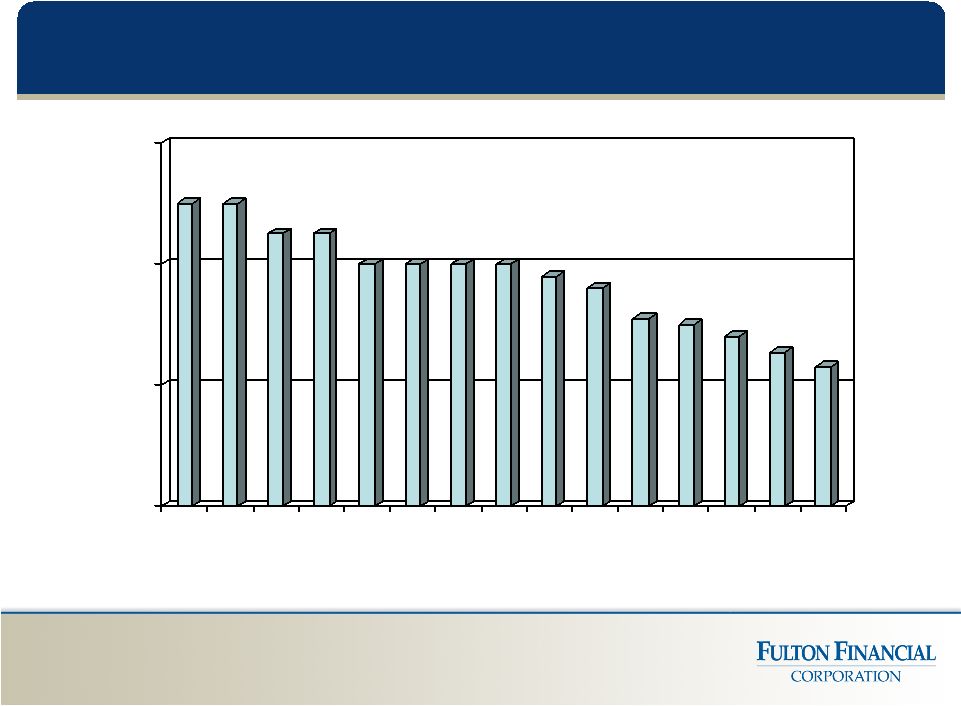
 Diluted
EPS 9
$0.00
$0.05
$0.10
$0.15
$0.20
$0.25
Q1
09
Q2
09
Q3
09
Q4
09
Q1
10
Q2
10
Q3
10
Q4
10
Q1
11
Q2
11
Q3
11
Q4
11
Q1
12
Q2
12
Q3
12 |
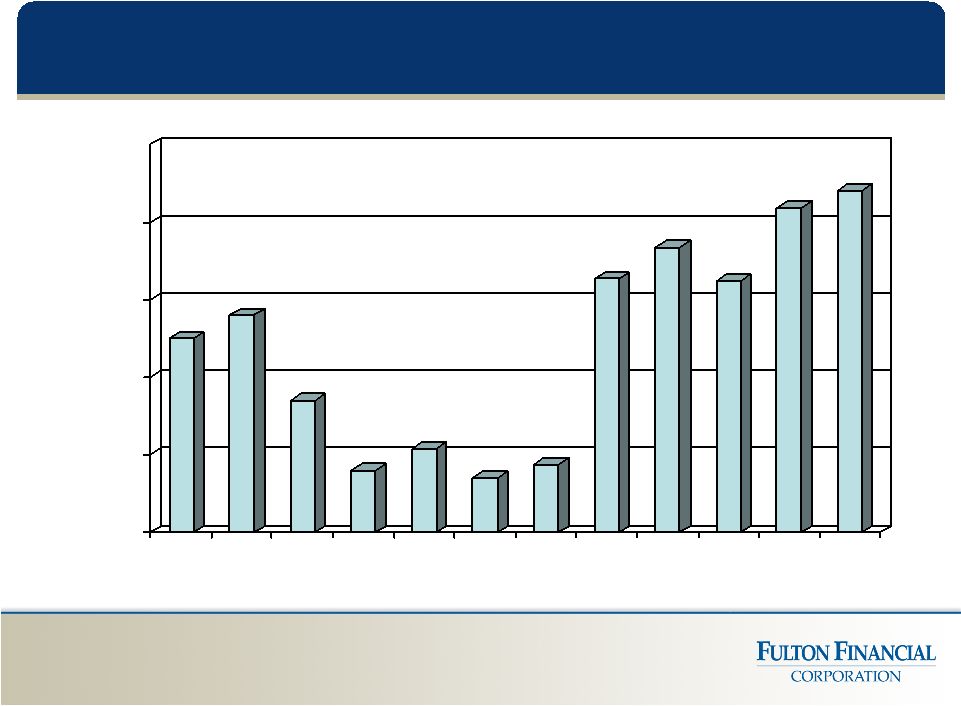
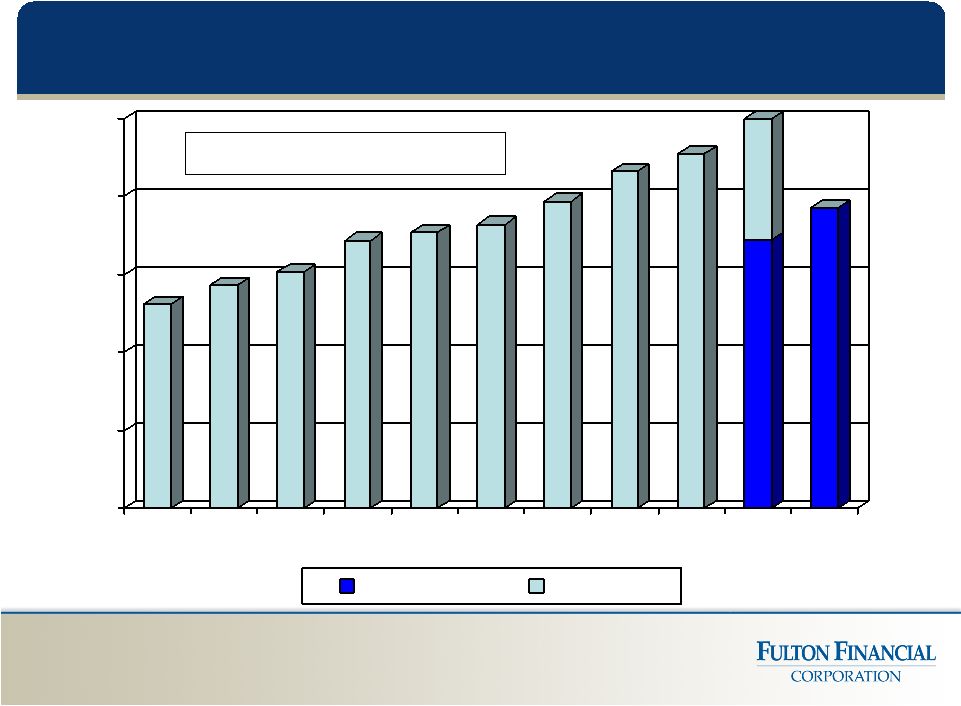 Non-Interest Income (in millions)
$-
$40
$80
$120
$160
$200
2002
2003
2004
2005
2006
2007
2008
2009
2010
2011
2012
YTD Sep
YTD Dec
10
CAGR = 6.4% (2002-2011) |
 Non-Interest Income
Q3 2012
Q2 2012
$
%
(dollars in thousands)
Mort. Banking Income
10,594
$
11,143
$
(549)
$
-5%
Invt Mgt & Trust
9,429
9,822
(393)
-4%
Overdraft & NSF Fees
8,552
8,095
457
6%
Service Charges
4,340
4,456
(116)
-3%
Merchant Fees
3,128
3,376
(248)
-7%
Cash Mgt Fees
2,759
2,816
(57)
-2%
Debit Card Fees
2,145
2,209
(64)
-3%
Other
11,015
9,909
1,106
11%
51,962
$
51,826
$
136
$
0%
11 |
 2012
2011
$
%
(dollars in thousands)
Mort. Banking Income
31,787
$
19,454
$
12,333
$
63%
Invt Mgt & Trust
28,628
27,756
872
3%
Overdraft & NSF Fees
24,612
23,988
624
3%
Service Charges
13,060
10,880
2,180
20%
Merchant Fees
9,363
7,124
2,239
31%
Cash Mgt Fees
8,188
7,933
255
3%
Debit Card Fees
6,455
13,352
(6,897)
-52%
Other
32,124
27,385
4,739
17%
154,217
$
137,872
$
16,345
$
12%
12
Non-Interest Income
(Nine Months Ended September 30
th
) |
 Non-Interest Income Growth
Fulton Mortgage Company
Significant Contributor to Non-interest Income
Steady Pipeline with Low Rate Environment
Leverage our Market Reputation and Brand
Expanded Origination Staff
Fulton Financial Advisors
($4.0 billion A.U.M.)
Brokerage Production Mix (non-recurring / recurring)
Referrals from Commercial Bank
Team Market Development
13 |
 Fulton
Mortgage Company Applications up linked quarter: $850
million from $824 million
Pipeline $535 million vs. $520 million
(End Q3/12 vs. end Q2/12)
40% purchase / 60% refinancing
(Q3/12)
Sales gains up linked quarter offset by
decreased MSR income
14 |
 Non-Interest Expenses
Q3 2012
Q2 2012
$
%
(dollars in thousands)
Salaries & Benefits
62,162
$
60,091
$
2,071
$
3%
Occupancy & Equip.
14,977
14,390
587
4%
Data Proc. & Software
6,287
6,031
256
4%
Outside Services
4,996
4,476
520
12%
FDIC Insurance
3,029
3,002
27
1%
Professional Fees
2,729
2,984
(255)
-9%
Supplies & Postage
2,232
2,399
(167)
-7%
OREO & Repo Expense
2,096
2,823
(727)
-26%
Telecommunications
1,764
1,478
286
19%
Operating Risk Loss
1,404
2,055
(651)
-32%
Marketing
648
2,583
(1,935)
-75%
Other Expenses
7,719
9,831
(2,112)
-21%
110,043
$
112,143
$
(2,100)
$
-2%
15 |
 Asset Quality Improvement
Core Platform Conversion
Enterprise-wide Risk Management
and Compliance
Priority Resource Commitments
16 |
 International Bancshares Corp.
People’s United Financial, Inc.
Susquehanna Bancshares, Inc.
Synovus Financial Corporation
TCF Financial Corporation
UMB Financial Corporation
Valley National Bancorp
Webster Financial Corporation
*Fulton’s peer group as of September 30, 2012
Associated Banc-Corp
BancorpSouth, Inc.
BOK Financial Corporation
City National Corporation
Commerce Bancshares, Inc.
Cullen / Frost Bankers, Inc.
First Horizon National
Corporation
FirstMerit Corporation
First Niagara Financial Group, Inc.
Peer Group*
17 |
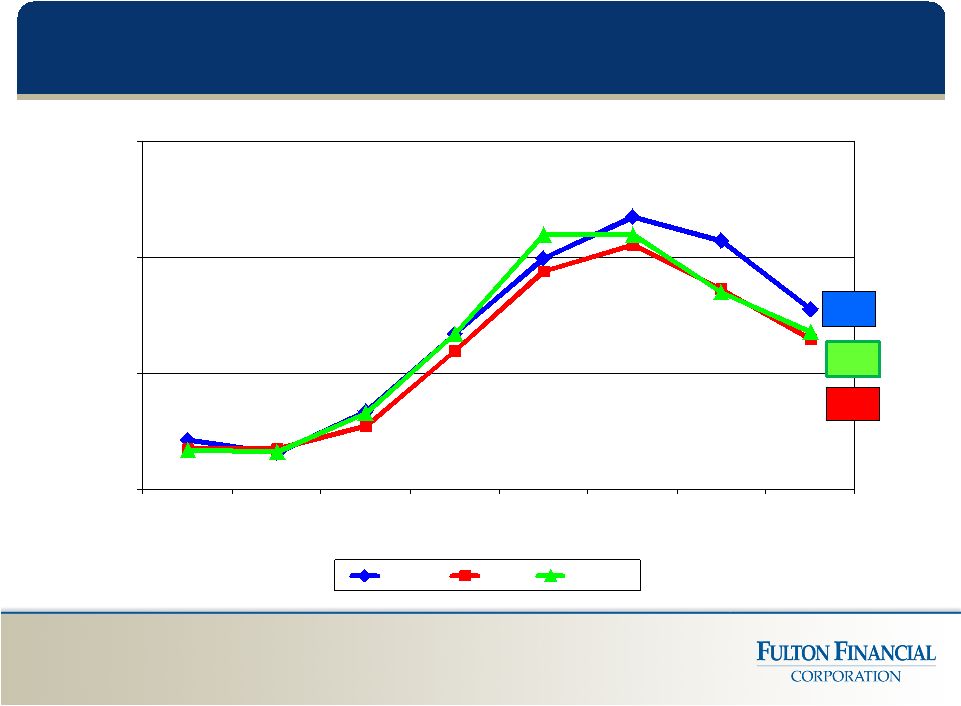
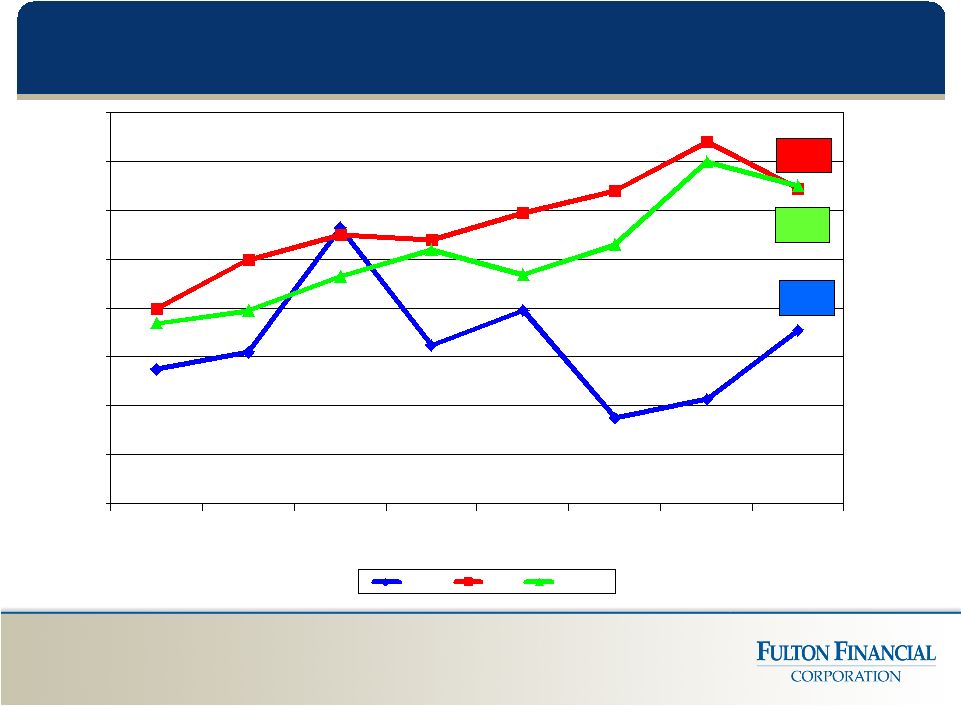 More
Efficient Than Peers 57.1
62.9
63.0
50.0
52.0
54.0
56.0
58.0
60.0
62.0
64.0
66.0
2005
2006
2007
2008
2009
2010
2011
YTD
09/12
FULT
Peer
Top 50*
18
* Comprised of the 50 largest publicly traded domestic banks/thrifts in asset size as
of December 31, 2011. Excludes credit card companies. Source :
SNL.com |
 2.
Improve Our Return on Assets Q3/12: 1.02%
YTD 9/30/12: 0.98%
Goals and Priorities
19 |
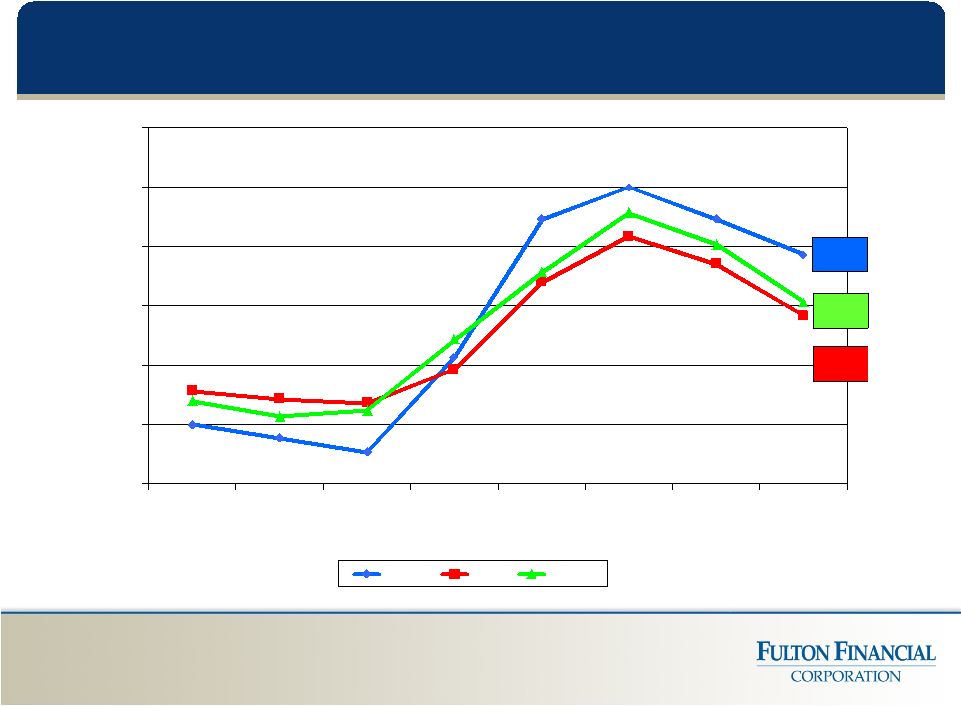
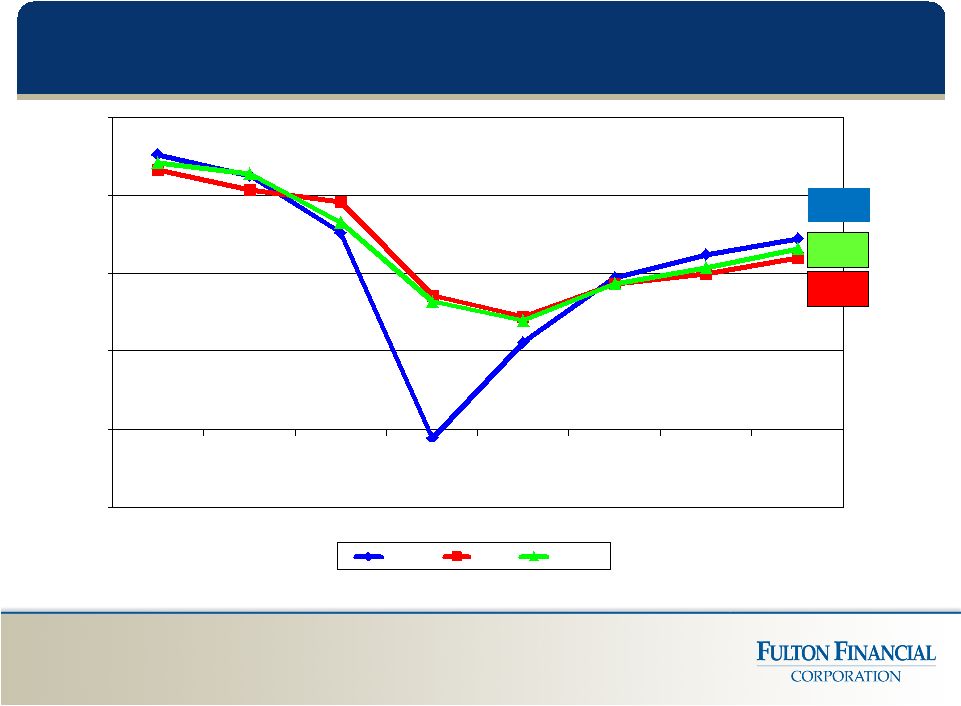 ROA
Growth 0.98
0.88
0.93
-0.40
0.00
0.40
0.80
1.20
1.60
2005
2006
2007
2008
2009
2010
2011
YTD
09/12
FULT
Peer
Top 50
20 |
 ROA and
Assets, by Bank 21
Return on Average Assets
Assets
9Months
Year
($ Millions)
09/30/12
2011
Lafayette Ambassador Bank
1,406
$
1.56%
1.48%
FNB Bank, NA
371
1.24%
1.46%
Fulton Bank, NA
9,041
1.29%
1.40%
Swineford National Bank
287
1.25%
1.60%
The Columbia Bank
2,025
0.92%
0.75%
Fulton Bank of New Jersey
3,334
0.44%
-0.10%
Fulton Financial Corporation
16,273
$
0.98%
0.90% |
 3.
Spread Management / Net Interest Margin
Q3/12: 3.74%
Cost of interest bearing liabilities: 0.90%
Yield on earning assets: 4.42%
Goals and Priorities
22 |
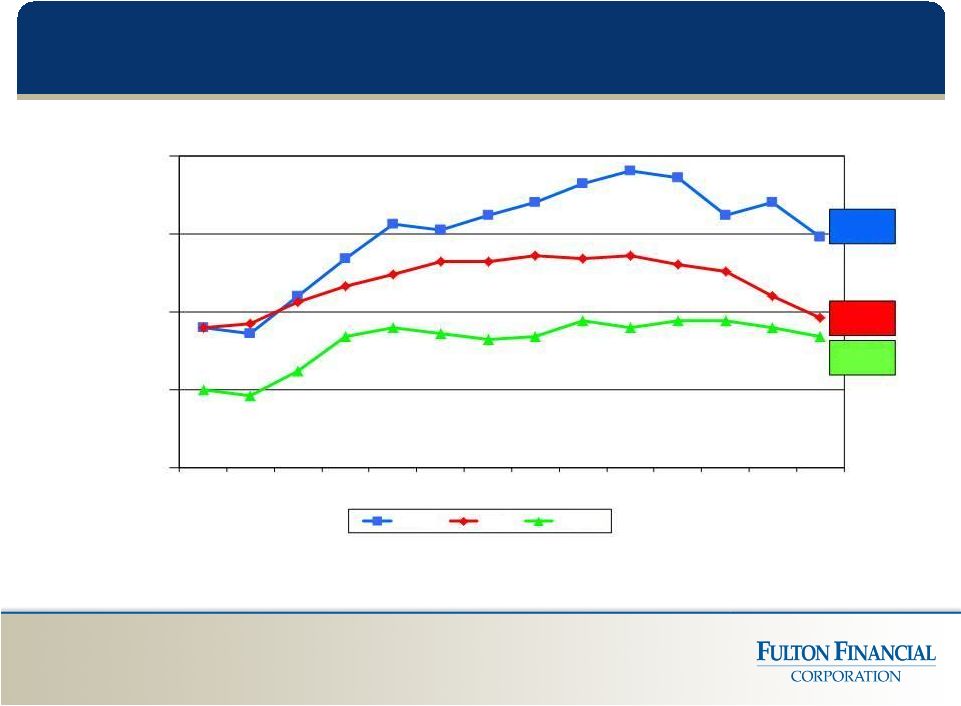 Net
Interest Margin 23
3.74
3.48
3.42
3.00
3.25
3.50
3.75
4.00
Q1 09
Q2 09
Q3 09
Q4 09
Q1 10
Q2 10
Q3 10
Q4 10
Q1 11
Q2 11
Q3 11
Q4 11
Q1 12
Q3 12
FULT
Peer
Top 50 |
 6 month
cumulative gap: 1.15 Interest Rate
Shocks (9/30/12)
Rate Change
NII Change (Annual)
% Change
+400 bp
+ $ 80.4 million
+ 15.3%
+300 bp
+ $ 57.4 million
+ 11.0 %
+200 bp
+ $ 34.5 million
+ 6.6%
+100 bp
+ $ 11.9 million
+ 2.3%
-
100 bp
-
$ 20.5 million
-
3.9%
24 |
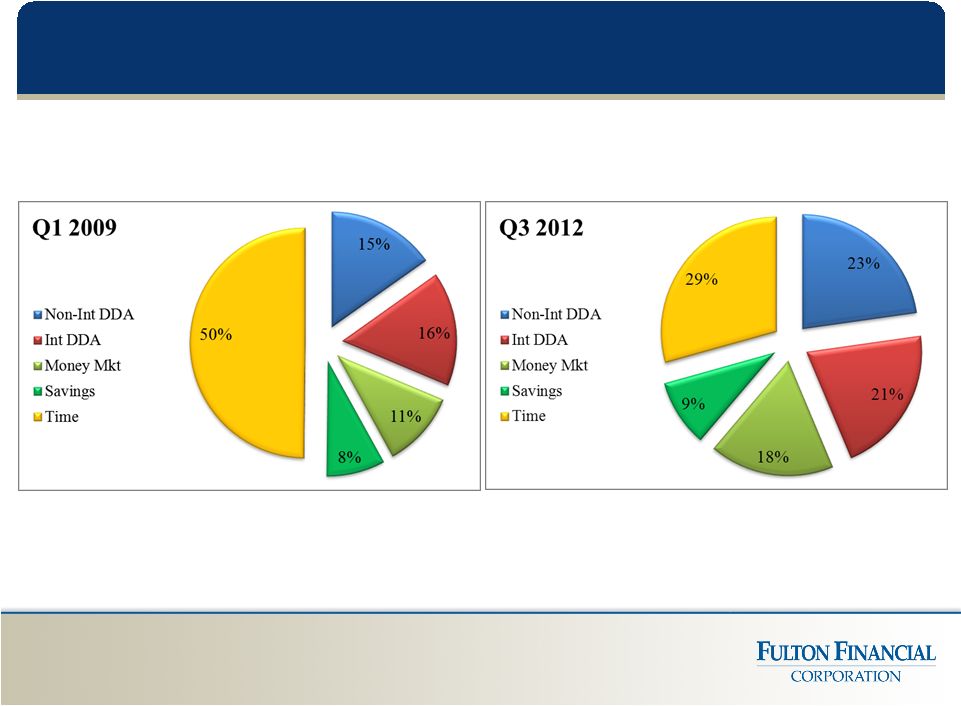 Deposit
Composition 25 |
 4.
Improve Asset Quality Goals and Priorities
26 |
 Non-accrual Loans to Loans
1.56
1.30
1.36
0.00
1.00
2.00
3.00
2005
2006
2007
2008
2009
2010
2011
Q3 12
FULT
Peer
Top 50
27 |
 Allowance for Loan Losses to Loans
1.96
1.65
1.72
0.80
1.10
1.40
1.70
2.00
2.30
2.60
2005
2006
2007
2008
2009
2010
2011
Q3 12
FULT
Peer
Top 50
28 |
 Non-performing Loans* (9/30/12) Comm'l
Comm'l
Mortgage
Constr.
Res. Mtg.
Other
Total
(in thousands)
Pennsylvania
50,294
$
18,451
$
9,706
$
8,078
$
6,237
$
92,766
$
Maryland
4,845
12,198
9,510
1,687
1,718
29,958
New Jersey
14,147
26,013
10,172
6,633
7,233
64,198
Virginia
4,553
6,762
3,354
6,908
711
22,288
Delaware
40
1,185
-
1,604
787
3,616
73,879
$
64,609
$
32,742
$
24,910
$
16,686
$
212,826
$
Ending Loans
3,507,846
4,632,509
597,358
1,213,831
1,981,457
11,933,001
NPL% (Sep-12)
2.11%
1.39%
5.48%
2.05%
0.84%
1.78%
NPL% (Jun-12)
1.92%
1.77%
6.96%
2.14%
0.77%
1.95%
* Includes loans > 90 days past due and accruing.
29 |
 Loan
Delinquency 30
90 Days
Total
90 Days
Total
Commercial Mortgage
1.39%
1.85%
1.78%
2.19%
Commercial Loans
2.11%
2.56%
1.91%
2.57%
Construction Loans
5.48%
6.43%
6.96%
7.91%
Residential Mortgage
2.05%
4.71%
2.15%
5.09%
Home Equity
0.78%
1.63%
0.71%
1.54%
Consumer, leasing and other
1.07%
2.92%
0.99%
2.60%
Total
1.78%
2.58%
1.95%
2.81%
June 30, 2012
September 30, 2012 |
 Construction Exposure
Construction Loans /
Total Loans
10.5%
8.2%
6.7%
5.1%
5.0%
31 |
 32
50
50
45
45
40
40
40
40
38
36
31
30
28
25.5
23
$0
$20
$40
$60
Q1
09
Q2
09
Q3
09
Q4
09
Q1
10
Q2
10
Q3
10
Q4
10
Q1
11
Q2
11
Q3
11
Q4
11
Q1
12
Q2
12
Q3
12
Provision for Credit Losses |
 5.
Deploy Capital Prudently Goals and Priorities
33 |
 Total
Risk-Based Capital Ratio 34
11.0%
12.0%
13.0%
14.0%
15.0%
16.0%
2001
2002
2003
2004
2005
2006
2007
2008
2009
2010
2011
Q3 12 |
 Capital
Adequacy (9/30/12
-
estimate)
Well-
FULT
Capitalized
Total Risk-Based Capital Ratio
15.40%
10.00%
Tier 1 Risk-Based Capital Ratio
13.20%
6.00%
Leverage Capital Ratio
10.70%
5.00%
35 |
 Capital
Adequacy vs. Basel III
36
FULT (1)
Basel III (2)
Total Risk-Based Capital Ratio
14.60%
10.50%
Tier 1 Risk-Based Capital Ratio
11.30%
8.50%
Leverage Capital Ratio
9.50%
6.50%
Common Equity Tier 1 Ratio
11.30%
7.00%
(1) Estimates
-
based
on
proposed
rules.
Final
rules,
when
issued,
may
differ
from proposed. Application of the Basel III rules are also subject
to further interpretation and clarification, which could result in
changes to the estimates shown above.
(2) Fully-phased in requirements, with 2.50% conservation
buffer. |
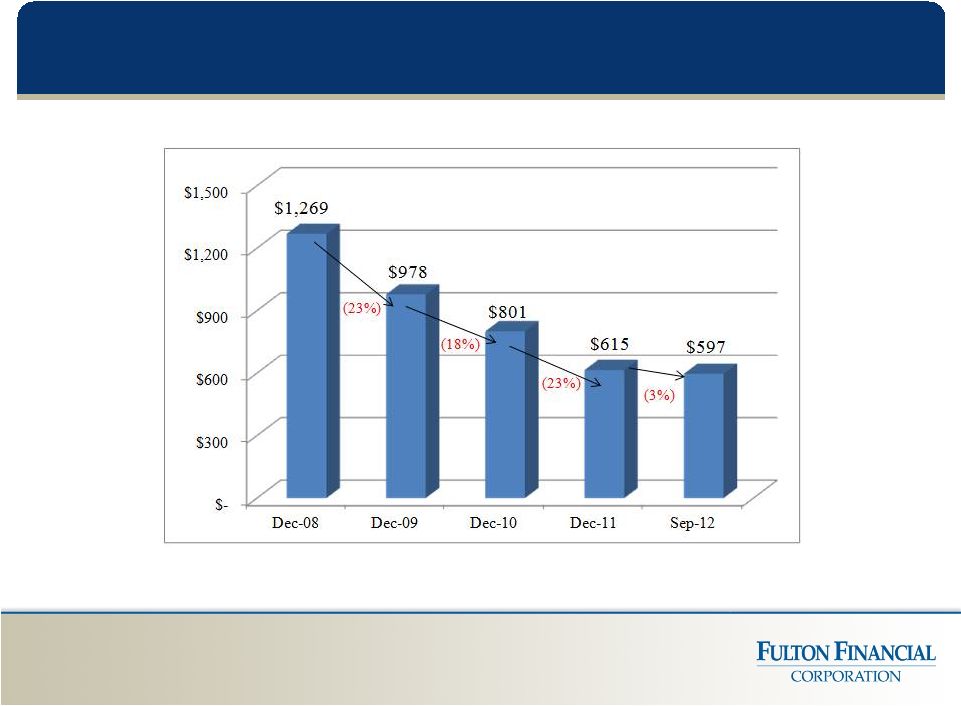
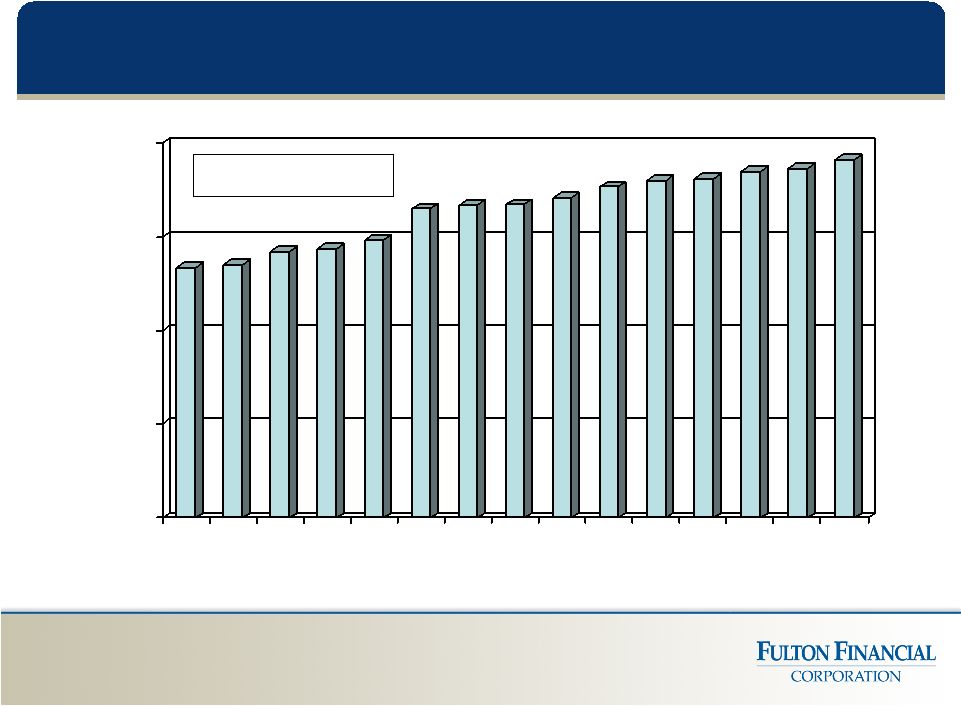 Tangible Book Value Per Share
37
$0.00
$2.00
$4.00
$6.00
$8.00
Q1
09
Q2
09
Q3
09
Q4
09
Q1
10
Q2
10
Q3
10
Q4
10
Q1
11
Q2
11
Q3
11
Q4
11
Q1
12
Q2
12
Q3
12
CAGR = 10.8% |
 Price
Multiple vs. Peer Group 38
Note:
Peer Tangible Book Value and LTM EPS data as of 6/30/2012 .
FULT Tangible Book Value and LTM EPS data as of 9/30/2012 .
|
 Deploying Capital
Current Uses
Support organic growth
Increase our cash dividend
Stock repurchase
Potential Uses
Acquisitions with right opportunities
39 |
 FULT
– Cash Dividend and Yield
40
0.00%
0.50%
1.00%
1.50%
2.00%
2.50%
3.00%
3.50%
$-
$0.01
$0.02
$0.03
$0.04
$0.05
$0.06
$0.07
$0.08
$0.09
Q1 09
Q2 09
Q3 09
Q4 09
Q1 10
Q2 10
Q3 10
Q4 10
Q1 11
Q2 11
Q3 11
Q4 11
Q1 12
Q2 12
Q3 12
Cash Dividend per Share
Yield
CAGR (cash dividend) = 32.3% |
 Program authorized: June 2012
Purchase of up to 5 million shares
through 12/31/12
About 2.5% of outstanding shares
Shares repurchased as of September
30, 2012: 2,115,000
Average purchase price: $ 9.63
Stock Repurchase Program
41 |
 6.
Leverage Market Opportunities Goals and Priorities
42 |
 Superior
Customer Experience CARE,
LISTEN,
UNDERSTAND
and
DELIVER
43 |
 Top
3 Box Satisfaction: 84%
Delivery
on our Promise:
Top 3 Box
85%
*Survey Sample Size: 4,897 customers
Retail Customer Satisfaction*
44 |
 Commercial Households:
Up 1.9% YTD (2.5% annualized)
Retail Households
Up 1.7% YTD (2.3% annualized)
Net Household Lift:
Up 1.7% YTD (2.3% annualized)
New Household Growth YTD
45 |
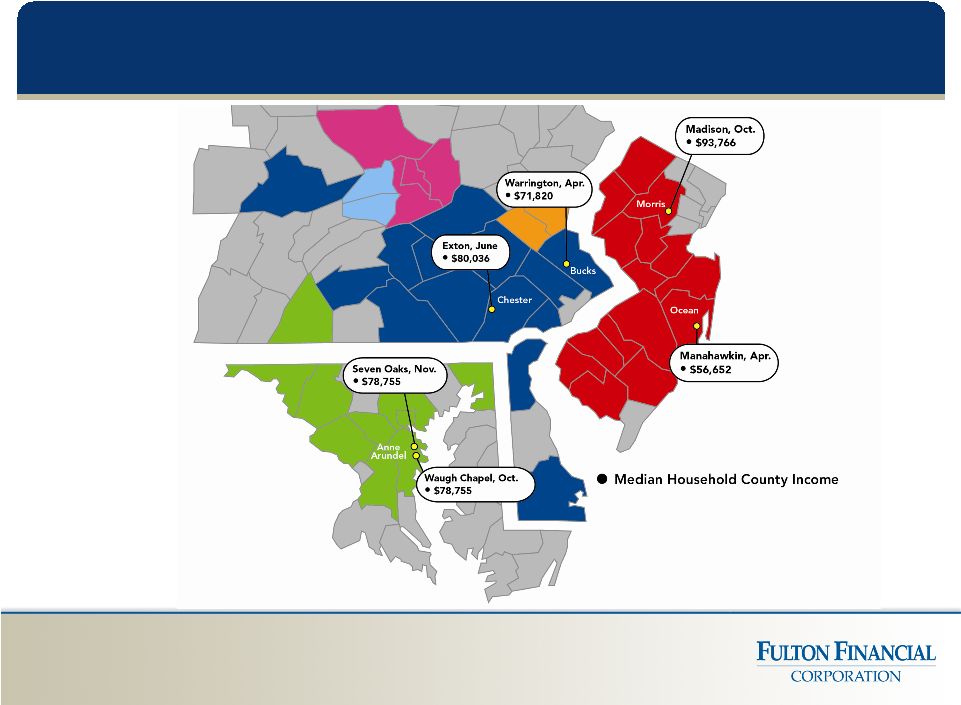
 Counties ranked #1 in deposit market share
Lebanon, PA (Fulton Bank 30.2%)
Salem, NJ (Fulton Bank of New Jersey 26.0%)
Counties ranked #2 in deposit market share
Lancaster, PA (Fulton Bank 24.3%)
Montour, PA (FNB Bank 27.7%)
Gloucester, NJ (Fulton Bank of New Jersey 13.4%)
Snyder, PA (Swineford National Bank 28.0%)
Washington, MD (The Columbia Bank 19.2%)
Counties ranked #3 in deposit market share
Northampton, PA (Lafayette Ambassador Bank 14.0%)
Top
County
Market
Share
(6/30/12)
46 |
 7.
Profitable Organic / Acquisitive Growth
Goals and Priorities
47 |
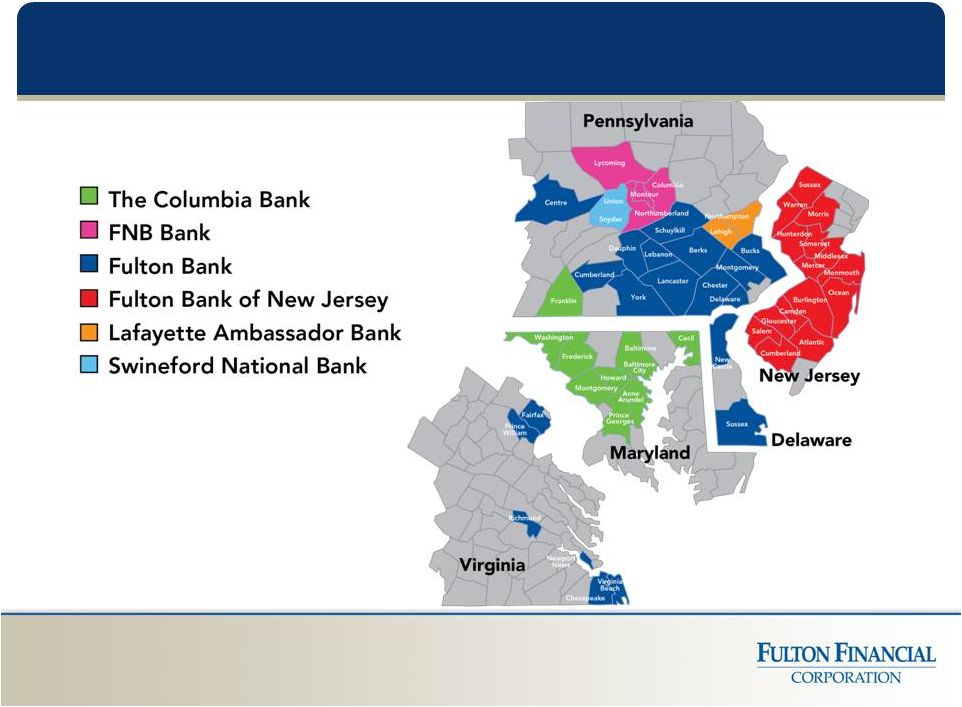 A
Valuable Franchise 48 |
 2012
Branch Expansion 49 |
 Optimal asset size: $ 300 million to
$2.5 billion (102 banks in footprint)
Good fit geographically
Earnings accretive /reasonable
tangible book dilution
Culturally compatible
Acceptable risk profile
Meaningful existing market share
Acquisitive Growth
50 |
 Fulton
Financial Corporation One Penn Square
Lancaster, PA 17602
www.fult.com
Version 2012-11-26 |
 Supplemental Information |
 Average
Deposits Q3 2012
Q2 2012
$
%
(dollars in millions)
Nonint DDA
2,836
$
2,669
$
167
$
6%
Int DDA
2,608
2,485
123
5%
Savings/MMDA
3,364
3,293
71
2%
Total Core Deposits
8,808
8,447
361
4%
CD's
3,658
3,791
(133)
-4%
Cash Management
338
372
(34)
-9%
Total Deposits
12,804
$
12,610
$
194
$
2%
53 |
 Interest
Rates 54
Q3 2012
Q2 2012
Change
%
Net Interest Margin
3.74%
3.78%
-0.04%
-1%
Yield on Earning Assets
4.42%
4.48%
-0.06%
-1%
Cost of Funds
0.72%
0.75%
-0.03%
-4%
Fed Funds
0.25%
0.25%
-
- |
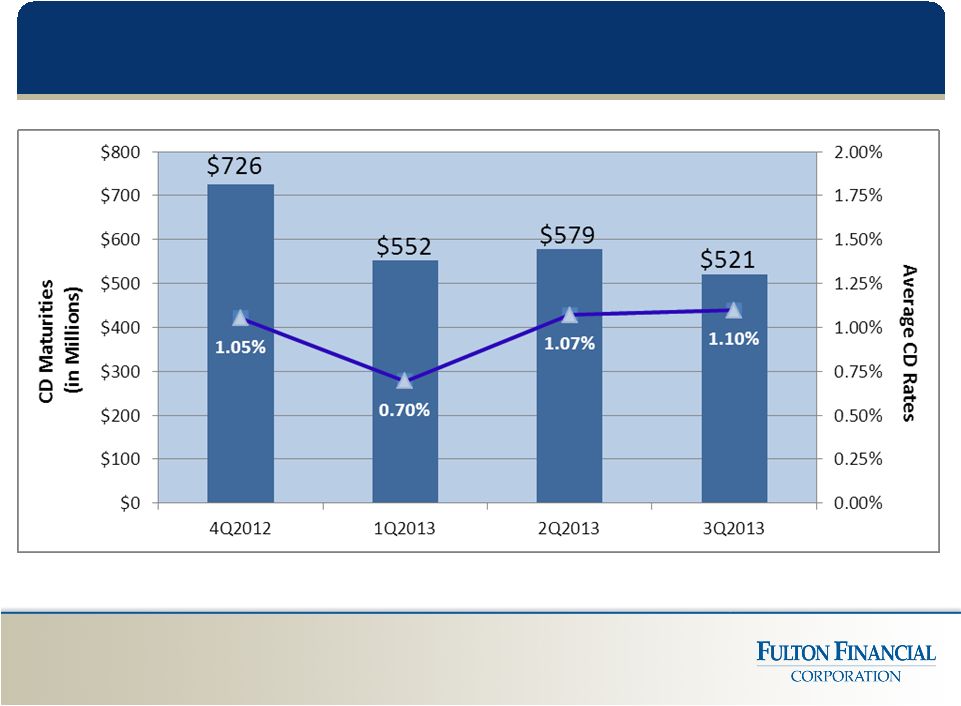 Projected CD Maturities
55 |
  Average
Loans 56
Q3 2012
Q2 2012
$
%
(dollars in millions)
Comm'l Mort
4,603
$
4,634
$
(31)
$
-1%
Commercial
3,530
3,530
-
0%
Home Equity
1,597
1,600
(3)
0%
Resid Mort
1,201
1,180
21
2%
Construction
606
640
(34)
-5%
Consumer/Other
383
382
1
0%
Total Loans
11,920
$
11,966
$
(46)
$
0% |
 56
relationships with commitments to lend $20 million or more
Maximum individual commitment: $39 million
Maximum commitment to any builder/developer:
$28 million
Maximum commitment to any one development project:
$15 million
Average commercial lending relationship size is
$469,332
Loans and corresponding relationships are within
Fulton’s geographic market area
Summary of Larger Loans (9/30/12)
57 |
 Average
Loan Growth (vs. prior year period)
58
0.5
3.4
5.3
-3.0
0.0
3.0
6.0
9.0
12.0
2005
2006
2007
2008
2009
2010
2011
YTD 09/12
FULT
Peer
Top 50 |
 Net
Charge-offs (YTD September 2012)
Comm'l
Comm'l
Mortgage
Constr.
Res. Mtg.
Other
Total
(in thousands)
Pennsylvania
13,480
$
14,808
$
4,979
$
282
$
2,976
$
36,525
$
Maryland
2,333
3,333
2,451
648
1,772
10,537
New Jersey
9,192
17,059
7,353
684
2,043
36,331
Virginia
978
3,698
7,925
1,015
709
14,325
Delaware
128
869
26
211
457
1,691
26,111
$
39,767
$
22,734
$
2,840
$
7,957
$
99,409
$
Avg Loans
3,548,332
4,618,389
629,170
1,172,732
1,986,207
11,954,830
NCO %
0.98%
1.15%
4.82%
0.32%
0.53%
1.11%
59 |
 Net
Charge-Offs To Average Loans 60
1.11
0.57
0.57
0.00
0.50
1.00
1.50
2005
2006
2007
2008
2009
2010
2011
YTD 09/12
FULT
Peer
Top 50 |
 Allowance for Loan Losses to Non-accrual Loans
61
125.9
109.9
118.0
50.0
100.0
150.0
200.0
250.0
300.0
350.0
2005
2006
2007
2008
2009
2010
2011
Q3 12
FULT
Peer
Top 50 |
 Commercial Loans by Industry
62
Industry
%
Services
17.7
Manufacturing
15.8
Construction
11.9
Wholesale
9.9
Retail
8.5
Other
8.0
Health Care
7.5
Real Estate
7.4
Agriculture
5.5
Transportation
3.0
Arts & Entertainment
2.5
Financial Services
2.3
Total
100.0 |
 Loan
Distribution by State (9/30/12)
Ending
% of
Variance to 9/30/11
Balance
Total
$
%
(dollars in thousands)
Pennsylvania
7,124,012
$
59.6%
211,197
$
3%
New Jersey
2,297,259
19.3%
(100,791)
-4%
Maryland
1,201,613
10.1%
(51,509)
-4%
Virginia
931,105
7.8%
(36,117)
-4%
Delaware
379,012
3.2%
14,565
4%
11,933,001
$
63 |
 Residential Mortgages (9/30/12) Ending
% of
NPL
Allowance
Balance
Total
Balance
Allocations
(dollars in thousands)
Pennsylvania
605,947
$
50.0%
8,078
$
6,819
$
Virginia
225,863
18.6%
6,908
12,695
New Jersey
166,398
13.7%
6,633
4,889
Maryland
137,730
11.3%
1,687
2,500
Delaware
77,893
6.4%
1,604
1,953
1,213,831
$
24,910
$
28,856
$
64 |
 Fulton
Mortgage Company ($ in thousands)
65
$-
$1,000
$2,000
$3,000
$4,000
$5,000
$6,000
$7,000
$8,000
$9,000
$10,000
$11,000
$12,000
$13,000
$-
$100,000
$200,000
$300,000
$400,000
$500,000
$600,000
$700,000
Q2 2011
Q3 2011
Q4 2011
Q1 2012
Q2 2012
Q3 2012
Originations
Rate Locks
Gain On Sale
1.42%
GOS
Spread
1.30%
GOS
Spread
1.55%
GOS
Spread
1.58%
GOS
Spread
1.87%
76%
Available
for Sale
69%
Available
for Sale
88%
Available
for Sale
GOS
Spread
1.66%
86%
Available
for Sale
70%
Available
for Sale
73%
Available
for Sale
GOS
Spread |
 Residential Mortgage Repurchase Activity
Year to date through Q3 2012:
2012 –
Servicing Retained
Repurchased
$ 3,550,000.
2012 –
Servicing Released
Repurchased
$ 610,000.
66 |
 C&I
Loans (9/30/12)
Ending
% of
NPL
Allowance
Balance
Total
Balance
Allocations
(dollars in thousands)
Pennsylvania
2,497,526
$
71.2%
50,294
$
34,332
$
New Jersey
508,297
14.5%
14,147
24,361
Maryland
296,225
8.4%
4,845
5,066
Virginia
165,220
4.7%
4,553
3,221
Delaware
40,578
1.2%
40
894
3,507,846
$
73,879
$
67,874
$
67 |
 Commercial Real Estate Loans
(9/30/12) Ending
% of
NPL
Allowance
Balance
Total
Balance
Allocations
(dollars in thousands)
Pennsylvania
2,517,564
$
54.3%
18,451
$
24,759
$
New Jersey
1,202,520
26.0%
26,013
33,932
Maryland
409,443
8.8%
12,198
6,438
Virginia
345,895
7.5%
6,762
4,253
Delaware
157,087
3.4%
1,185
2,787
4,632,509
$
64,609
$
72,169
$
68 |
 Construction
Loans (9/30/12)
Ending
% of
NPL
Allowance
Balance
Total
Balance
Allocations
(dollars in thousands)
Pennsylvania
310,893
$
52.1%
9,706
$
5,398
$
Virginia
122,441
20.5%
3,354
3,692
New Jersey
77,523
13.0%
10,172
5,892
Maryland
72,573
12.1%
9,510
6,174
Delaware
13,928
2.3%
-
972
597,358
$
32,742
$
22,128
$
69 |
 Construction Loans by Type (9/30/12)
Ending
% of
Balance
Total
(dollars in thousands)
Commercial Residential
312,658
$
52.4%
Commercial
218,828
36.6%
Other
65,872
11.0%
597,358
$
70 |
 Shared
National Credits (9/30/12)
Ending
Balance
(dollars in thousands)
Commercial
83,565
$
Commercial Real Estate
63,386
Total Outstanding
146,951
$
Delinquency: 2.6%
71 |
 Troubled
Debt Restructurings 09/30/12
12/31/11
(in thousands)
Residential Mtg
36,946
$
32,330
$
C&I/Comm'l Mtg
36,993
26,010
Construction
10,525
7,650
Consumer/other
755
190
85,219
$
66,180
$
72
Note: Excludes non-accrual TDRs |
 Investment Portfolio
(09-30-12)
73
Book Yield (monthly) 3.49%
ENDING
WEIGHTED
BALANCE
AVG. LIFE
(in millions)
Agency mortgage-backed securities
1,022.2
$
2.93
Agency collateralized mortgage obligations
1,014.8
1.95
Municipal bonds
293.2
6.25
Auction rate securities
188.4
4.92
Corporate & trust preferred securities
106.0
13.56
U.S. Treasuries and agencies
2.3
0.44
FHLB & FRB stock
73.2
NA
Bank stocks
34.3
NA
Other investments
10.9
NA
Net unrealized gain / (loss)
44.9
NA
Total Investments
2,790.1
$
3.50 |
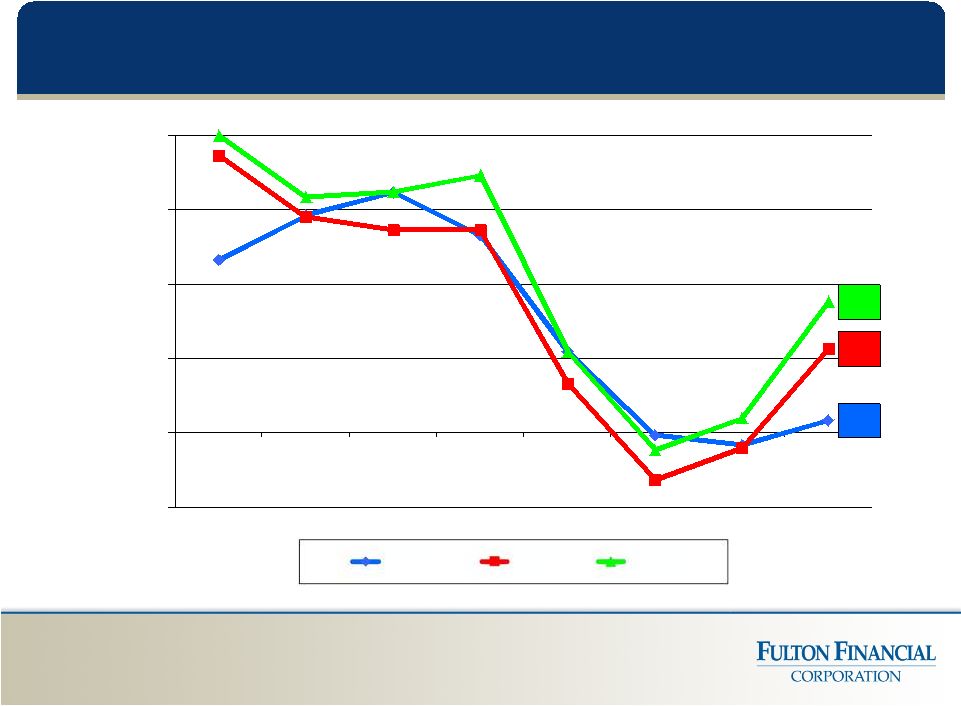
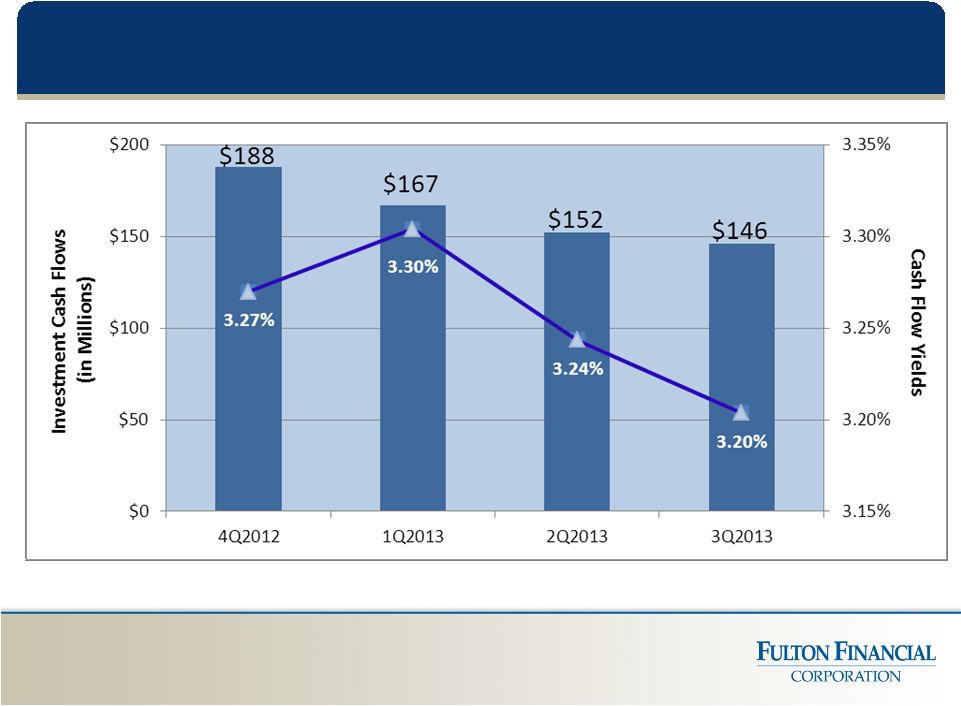 Projected Investment Security Cash Flows
74 |
 Investment MBS & CMO Cash Flows
(2011-2012)
75
Book Price
$101.51
Book Price
$101.87
Book Price
$102.12
$112,300,966
$181,596,288
$157,060,613
$163,241,031
$179,433,591
$1,927,653
$4,883,560
$4,074,329
$3,998,272
$4,591,601
$0
$1,000,000
$2,000,000
$3,000,000
$4,000,000
$5,000,000
$6,000,000
$7,000,000
$8,000,000
$0
$20,000,000
$40,000,000
$60,000,000
$80,000,000
$100,000,000
$120,000,000
$140,000,000
$160,000,000
$180,000,000
$200,000,000
3Q 2011
4Q 2011
1Q 2012
2Q 2012
3Q 2012
E
x
p
e
n
s
e
C
a
s
h
F
l
o
w
MBS & CMO Cash Flow
Net Amortization Expense
Book Price
$102.14
Book Price
$102.00 |
 Investment
Portfolio
–
Transactions
(3
Quarter
2012)
($ in Thousands)
76
Purchases
Amount
Yield
Weighted
Avg. Life
US Treasury
326
$
0.17%
0.66
MBS
10,678
1.56%
3.75
CMO -
Agency
135,465
1.44%
3.41
Municipal Bans
6,453
1.45%
0.51
Municipal Bonds
14,942
3.57%
4.90
Corporate / Trust Preferred
1,000
5.38%
9.96
Other
-
-
168,865
$
1.66%
3.49
Sales
Amount
Book
Yield
Gain /
(Loss)
US Treasury
Corporate / Trust Preferred
1,965
$
8.31%
66
$
Other
1,965
$
8.31%
66
$
Total
Total
RD |
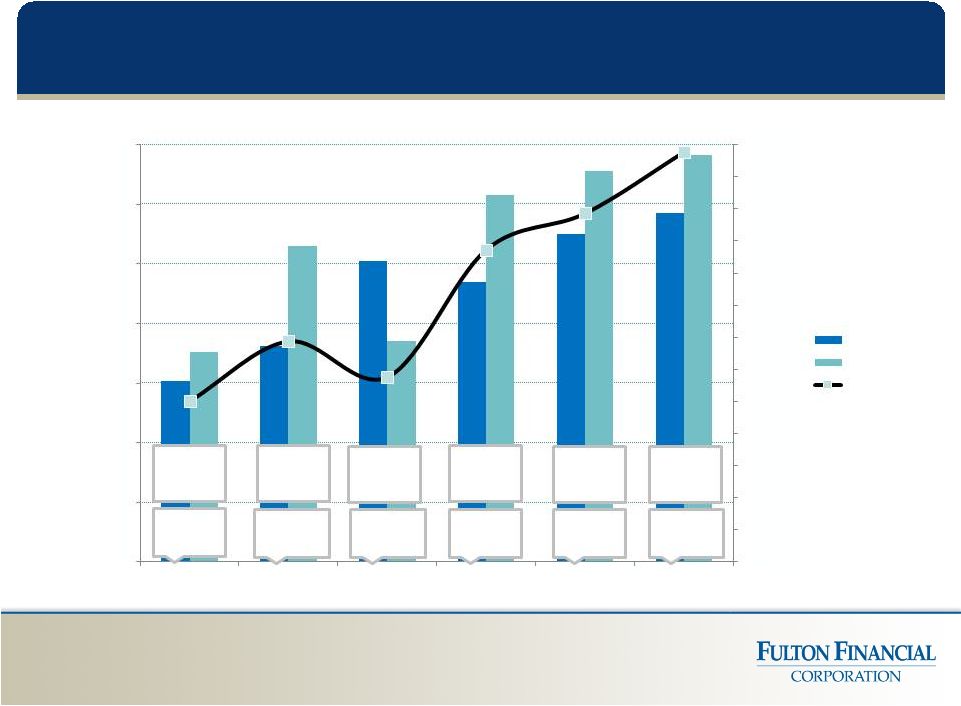
 Projected FHLB Advance Maturities
77 |
 Fulton
Financial Corporation One Penn Square
Lancaster, PA 17602
www.fult.com
Version 2012-11-26 |