Attached files
| file | filename |
|---|---|
| EXCEL - IDEA: XBRL DOCUMENT - China Green Agriculture, Inc. | Financial_Report.xls |
| EX-31.1 - EXHIBIT 31.1 - China Green Agriculture, Inc. | v326001_ex31-1.htm |
| EX-31.2 - EXHIBIT 31.2 - China Green Agriculture, Inc. | v326001_ex31-2.htm |
| EX-32.1 - EXHIBIT 32.1 - China Green Agriculture, Inc. | v326001_ex32-1.htm |
| EX-10.1 - EXHIBIT 10.1 - China Green Agriculture, Inc. | v326001_ex10-1.htm |
| EX-32.2 - EXHIBIT 32.2 - China Green Agriculture, Inc. | v326001_ex32-2.htm |
UNITED STATES
SECURITIES AND EXCHANGE COMMISSION
WASHINGTON, D.C. 20549
FORM 10-Q
(Mark One)
| x | QUARTERLY REPORT PURSUANT TO SECTION 13 or 15(d) OF THE SECURITIES EXCHANGE ACT OF 1934. |
For the quarterly period ended September 30, 2012
| ¨ | TRANSITION REPORT PURSUANT TO SECTION 13 OR 15(d) OF THE SECURITIES EXCHANGE ACT OF 1934. |
For the transition period from ____________ to ____________
Commission File Number 001-34260
CHINA GREEN AGRICULTURE, INC.
(Exact name of registrant as specified in its charter)
| Nevada | 36-3526027 |
| (State or other jurisdiction of | (IRS Employer |
| incorporation or organization) | Identification No.) |
| 3 rd Floor, Borough A, Block A, No. 181, | ||
| South Taibai Road, Xi’an, Shaanxi Province, | ||
| People’s Republic of China 710065 | ||
| (Address of principal executive offices) (Zip Code) |
| +86-29-88266368 | ||
| (Issuer's telephone number, including area code) |
Indicate by check mark whether the issuer (1) filed all reports required to be filed by Section 13 or 15(d) of the Securities Exchange Act of 1934 during the preceding 12 months (or for such shorter period that the registrant was required to file such reports), and (2) has been subject to such filing requirements for the past 90 days. Yes x No o
Indicate by check mark whether the registrant has submitted electronically and posted on its corporate Web site, if any, every Interactive Data File required to be submitted and posted pursuant to Rule 405 of Regulation S-T (§232.405 of this chapter) during the preceding 12 months (or for such shorter period that the registrant was required to submit and post such files). Yes x No o
Indicate by check mark whether the registrant is a large accelerated filer, an accelerated filer, a non-accelerated filer, or a smaller reporting company. See the definitions of “large accelerated filer,” “accelerated filer” and “smaller reporting company” in Rule 12b-2 of the Exchange Act.
| Large accelerated filer o | Accelerated filer x |
|
Non-accelerated filer o ( Do not check if a smaller reporting company ) |
Smaller reporting company o |
Indicate by check mark whether the registrant is a shell company (as defined in Rule 12b-2 of the Exchange Act). Yes o No x
APPLICABLE ONLY TO CORPORATE ISSUERS:
Indicate the number of shares outstanding of each of the issuer's classes of common stock, as of the latest practicable date: 27,938,839 shares of common stock, $.001 par value, as of November 5, 2012.
Explanatory Note
China Green Agriculture, Inc. (the “Company”) is filing this quarterly report on Form 10-Q for its fiscal quarter ended September 30, 2012 on an extended time line pursuant to the Hurricane Sandy Exemptive Orders (the “Relief Orders”) issued by the Securities and Exchange Commission (the “Commission”) on November 14, 2012 (Release No. 68224) and the prior verbal communications with the Commission on the same subject. The Relief Orders stated that registrants who were directly or indirectly affected by Hurricane Sandy who were required to make certain filings with the Commission between October 29, 2012 and November 20, 2012, would be allowed to make such filings on or before November 21, 2012, and still remain in compliance with federal securities regulations. The storm and subsequent flooding commenced on October 29, 2012 was unprecedented in the affected area which have displaced the Company’s service providers including its legal counsel and Edgar filing agent located in New York City, severely disrupted their communications, transportations, power supply which resulted in delay in the completion of the review of the report and delay in the completion of the Edgar proof and XBRL tagging required for this filing. As a result, the Company, (i) was unable, in good faith, to file the report on a timely basis; (ii) availed itself of the filing extension granted under the Relief Orders; and (iii) files this report on November 19, 2012.
TABLE OF CONTENTS
| PART I | FINANCIAL INFORMATION | Page | ||||
| Item 1. | Financial Statements. | |||||
| F-1 | ||||||
| Consolidated Condensed Balance Sheets | F-1 | |||||
| As of September 30, 2012 and June 30, 2012 (Unaudited) | ||||||
| Consolidated Condensed Statements of Income and Comprehensive Income | F-2 | |||||
| For the Three Months Ended September 30, 2012 and 2011 (Unaudited) | ||||||
| Consolidated Condensed Statements of Cash Flows | F-3 | |||||
| For the Three Months Ended September 30, 2012 and 2011 (Unaudited) | ||||||
| Notes to Consolidated Condensed Financial Statements | F-4 | |||||
| As of September 30, 2012 (Unaudited) | ||||||
| Item 2. | Management’s Discussion and Analysis of Financial Condition and Results of Operations | 3 | ||||
| Item 3. | Quantitative and Qualitative Disclosures About Market Risk | 12 | ||||
| Item 4. | Controls and Procedures | 13 | ||||
| PART II | OTHER INFORMATION | |||||
| Item 1. | Legal Proceedings | 14 | ||||
| Item 2. | Unregistered Sales of Equity Securities and Use of Proceeds | 14 | ||||
| Item 5. | Other Information | 14 | ||||
| Item 6. | Exhibits | 14 | ||||
| Signatures | 15 | |||||
| Exhibits/Certifications | 16 | |||||
| 2 |
PART I - FINANCIAL INFORMATION
Item 1. Financial Statements
CHINA GREEN AGRICULTURE INC. AND SUBSIDIARIES
CONSOLIDATED CONDENSED BALANCE SHEETS
(UNAUDITED)
| September 30, 2012 | June 30, 2012 | |||||||
| ASSETS | ||||||||
| Current Assets | ||||||||
| Cash and cash equivalents | $ | 74,197,824 | $ | 71,978,630 | ||||
| Accounts receivable, net | 67,699,174 | 62,001,158 | ||||||
| Inventories | 28,659,714 | 28,602,684 | ||||||
| Other current assets | 756,788 | 299,526 | ||||||
| Advances to suppliers | 14,985,197 | 12,207,325 | ||||||
| Total Current Assets | 186,298,697 | 175,089,323 | ||||||
| Plant, Property and Equipment, Net | 81,532,337 | 80,065,161 | ||||||
| Construction In Progress | 171,704 | - | ||||||
| Other Assets - Non Current | 158,912 | 182,119 | ||||||
| Intangible Assets, Net | 27,173,943 | 27,618,641 | ||||||
| Goodwill | 5,066,195 | 5,075,809 | ||||||
| Total Assets | $ | 300,401,788 | $ | 288,031,053 | ||||
| LIABILITIES AND STOCKHOLDERS' EQUITY | ||||||||
| Current Liabilities | ||||||||
| Accounts payable | $ | 5,594,344 | $ | 6,881,748 | ||||
| Unearned revenue | 2,452,464 | 2,625,014 | ||||||
| Accrued expenses and other payables | 5,349,989 | 4,290,249 | ||||||
| Amount due to related parties | 1,477,357 | 370,719 | ||||||
| Taxes payable | 19,540,884 | 17,675,389 | ||||||
| Short term loans | 14,466,150 | 13,931,280 | ||||||
| Total Current Liabilities | 48,881,188 | 45,774,399 | ||||||
| Commitment and Contingencies | ||||||||
| Stockholders' Equity | ||||||||
| Preferred Stock, $.001 par value, 20,000,000 shares authorized, zero shares issued and outstanding | - | - | ||||||
| Common stock, $.001 par value, 115,197,165 shares authorized, 27,490,762 and 27,455,722 shares issued and outstanding as of September 30, 2012 and June 30, 2012, respectively | 27,491 | 27,456 | ||||||
| Additional paid-in capital | 103,042,573 | 102,175,709 | ||||||
| Statutory reserve | 16,183,362 | 15,130,158 | ||||||
| Retained earnings | 116,951,020 | 109,142,824 | ||||||
| Accumulated other comprehensive income | 15,316,154 | 15,780,507 | ||||||
| Total Stockholders' Equity | 251,520,600 | 242,256,654 | ||||||
| Total Liabilities and Stockholders' Equity | $ | 300,401,788 | $ | 288,031,053 | ||||
The accompanying notes are an integral part of these unaudited consolidated condensed financial statements.
| F-1 |
CHINA GREEN AGRICULTURE INC. AND SUBSIDIARIES
CONSOLIDATED CONDENSED STATEMENTS OF INCOME AND COMPREHENSIVE INCOME
(UNAUDITED)
| Three Months Ended September 30, | ||||||||
| 2012 | 2011 | |||||||
| Sales | ||||||||
| Jinong | $ | 27,850,976 | $ | 22,242,251 | ||||
| Gufeng | 10,936,971 | 29,613,091 | ||||||
| Jintai | - | 1,198,887 | ||||||
| Yuxing | 724,793 | 48,365 | ||||||
| Net sales | 39,512,740 | 53,102,594 | ||||||
| Cost of goods sold | ||||||||
| Jinong | 12,839,498 | 8,110,130 | ||||||
| Gufeng | 9,189,762 | 25,269,670 | ||||||
| Jintai | - | 748,830 | ||||||
| Yuxing | 550,107 | 65,232 | ||||||
| Cost of goods sold | 22,579,367 | 34,193,862 | ||||||
| Gross profit | 16,933,373 | 18,908,732 | ||||||
| Operating expenses | ||||||||
| Selling expenses | 3,034,087 | 2,490,474 | ||||||
| General and administrative expenses | 2,875,942 | 3,138,695 | ||||||
| Total operating expenses | 5,910,029 | 5,629,169 | ||||||
| Income from operations | 11,023,344 | 13,279,563 | ||||||
| Other income (expense) | ||||||||
| Other income (expense) | (600 | ) | (25,424 | ) | ||||
| Interest income | 74,432 | 97,487 | ||||||
| Interest expense, net | (385,792 | ) | (156,479 | ) | ||||
| Total other income (expense) | (311,960 | ) | (84,416 | ) | ||||
| Income before income taxes | 10,711,384 | 13,195,147 | ||||||
| Provision for income taxes | 1,849,984 | 2,463,511 | ||||||
| Net income | 8,861,400 | 10,731,636 | ||||||
| Other comprehensive income | ||||||||
| Foreign currency translation gain (loss) | (464,353 | ) | 1,904,146 | |||||
| Comprehensive income | $ | 8,397,047 | $ | 12,635,782 | ||||
| Basic weighted average shares outstanding | 27,462,578 | 26,857,338 | ||||||
| Basic net earnings per share | $ | 0.32 | $ | 0.40 | ||||
| Diluted weighted average shares outstanding | 27,462,578 | 26,857,338 | ||||||
| Diluted net earnings per share | 0.32 | 0.40 | ||||||
The accompanying notes are an integral part of these unaudited consolidated condensed financial statements.
| F-2 |
CHINA GREEN AGRICULTURE INC. AND SUBSIDIARIES
CONSOLIDATED CONDENSED STATEMENTS OF CASH FLOWS
(UNAUDITED)
| Three Months Ended September 30, | ||||||||
| 2012 | 2011 | |||||||
| Cash flows from operating activities | ||||||||
| Net income | $ | 8,861,400 | $ | 10,731,636 | ||||
| Adjustments to reconcile net income to net cash provided by (used in) operating activities | ||||||||
| Issuance of common stock and stock options for compensation | 866,899 | 557,192 | ||||||
| Depreciation | 2,802,291 | 1,132,399 | ||||||
| Amortization | 392,390 | 331,502 | ||||||
| Changes in operating assets, net of effects from acquisitions | ||||||||
| Accounts receivable | (5,815,442 | ) | (6,387,104 | ) | ||||
| Other current assets | (457,831 | ) | (235,450 | ) | ||||
| Inventories | (111,202 | ) | (12,195,943 | ) | ||||
| Advances to suppliers | (2,800,991 | ) | (1,213,600 | ) | ||||
| Other assets | 22,862 | (98,716 | ) | |||||
| Change in operating liabilities, net of effects from acquisitions | ||||||||
| Accounts payable | (1,275,065 | ) | 1,316,676 | |||||
| Unearned revenue | (167,578 | ) | 97,505 | |||||
| Tax payables | 1,898,972 | 2,461,823 | ||||||
| Accrued expenses and other payables | 1,063,143 | 1,493,111 | ||||||
| Amount due to related parties | 1,106,700 | - | ||||||
| Net cash provided by (used in) operating activities | 6,386,548 | (2,008,969 | ) | |||||
| Cash flows from investing activities | ||||||||
| Purchase of plant, property, and equipment | (4,421,106 | ) | (828,035 | ) | ||||
| Increase in construction in progress | (171,704 | ) | (91,631 | ) | ||||
| Net cash used in investing activities | (4,592,810 | ) | (919,666 | ) | ||||
| Cash flows from financing activities | ||||||||
| Repayment of loan | - | - | ||||||
| Proceeds from loans | 561,255 | 8,010,765 | ||||||
| Net cash provided by financing activities | 561,255 | 8,010,765 | ||||||
| Effect of exchange rate change on cash and cash equivalents | (135,799 | ) | 645,368 | |||||
| Net increase in cash and cash equivalents | 2,219,194 | 5,727,498 | ||||||
| Cash and cash equivalents, beginning balance | 71,978,630 | 65,606,413 | ||||||
| Cash and cash equivalents, ending balance | $ | 74,197,824 | $ | 71,333,911 | ||||
| Supplement disclosure of cash flow information | ||||||||
| Interest expense paid | $ | 385,792 | $ | 148,101 | ||||
| Income taxes paid | $ | - | $ | 7,664 | ||||
The accompanying notes are an integral part of these unaudited consolidated condensed financial statements.
| F-3 |
|
|
CHINA GREEN AGRICULTURE, INC. AND SUBSIDIARIES
NOTES TO CONSOLIDATED FINANCIAL STATEMENTS
NOTE 1 - ORGANIZATION AND DESCRIPTION OF BUSINESS
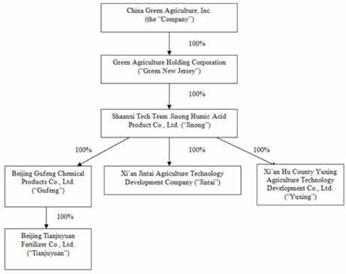
China Green Agriculture, Inc. (the “Company”), through its subsidiaries, is engaged in the research, development, production, distribution and sale of humic acid-based compound fertilizer, compound fertilizer, blended fertilizer, organic compound fertilizer, slow-release fertilizers, highly-concentrated water-soluble fertilizers and mixed organic-inorganic compound fertilizer and the development, production and distribution of agricultural products.
The Company’s corporate structure as of September 30, 2012 is set forth in the diagram below:
NOTE 2 - BASIS OF PRESENTATION AND SUMMARY OF SIGNIFICANT ACCOUNTING POLICIES
Principle of consolidation
The accompanying consolidated financial statements include the accounts of the Company and its wholly-owned subsidiaries, Green New Jersey, Jinong, Jintai, Yuxing, Gufeng and Tianjuyuan. All significant inter-company accounts and transactions have been eliminated in consolidation.
Use of estimates
The preparation of consolidated financial statements in conformity with accounting principles generally accepted in the United States of America requires management to make estimates and assumptions that affect the reported amounts of assets and liabilities and disclosure of contingent assets and liabilities at the date of the consolidated financial statements and the amount of revenues and expenses during the reporting periods. Management makes these estimates using the best information available at the time the estimates are made. However, actual results could differ materially from those results.
Recent accounting pronouncements
In May 2011, the Financial Accounting Standards Board (“FASB”) issued Accounting Standards Update (ASU”) 2011-04, Amendments to Achieve Common Fair Value Measurement and Disclosure Requirements in U.S. GAAP and IFRS, which was issued to provide a consistent definition of fair value and ensure that the fair value measurement and disclosure requirements are similar between U.S. GAAP and IFRS. ASU 2011-04 changes certain fair value measurement principles and enhances the disclosure requirements particularly for Level 3 fair value measurements. This guidance is effective for the Company beginning on January 1, 2012. The adoption of ASU 2011-04 did not significantly impact the Company’s consolidated financial statements.
| F-4 |
In June 2011, the FASB issued ASU 2011-05, Presentation of Comprehensive Income. ASU 2011-05 revises the manner in which entities present comprehensive income in their financial statements. The new guidance removes the presentation options in Accounting Standards Codification (ASC) 220, Comprehensive Income, and requires entities to report components of comprehensive income in either (1) a continuous statement of comprehensive income or (2) two separate but consecutive statements. The ASU does not change the items that must be reported in other comprehensive income. In December 2011, the FASB issued ASU 2011-12 which defers the requirement in ASU 2011-05 that companies present reclassification adjustments for each component of accumulated other comprehensive income in both net income and other comprehensive income on the face of the financial statements. ASU 2011-05 is effective for fiscal years and interim reporting periods within those years beginning after December 15, 2011, with early adoption permitted. The adoption of ASU 2011-05, as amended by ASU 2011-12, did not significantly impact the Company’s consolidated financial statements.
In September 2011, the FASB issued ASU 2011-08, Testing Goodwill for Impairment, which provides an entity the option to first assess qualitative factors to determine whether it is necessary to perform the current two-step test for goodwill impairment. If an entity believes, as a result of its qualitative assessment, that it is more-likely-than-not that the fair value of a reporting unit is less than its carrying amount, the quantitative impairment test is required. Otherwise, no further testing is required. The revised standard is effective for the Company for its annual and interim goodwill impairment tests performed for fiscal years beginning after December 15, 2011. The adoption of ASU 2011-08 is not expected to significantly impact the Company’s consolidated financial statements. In November 2011, the FASB issued ASU 2011-11, Balance Sheet (Topic 210): Disclosures about Offsetting Assets and Liabilities, which requires an entity to disclose information about offsetting and related arrangements to enable users of its financial statements to understand the effect of those arrangements on its financial position. An entity is required to adopt ASU 2011-11 for reporting periods beginning on or after January 1, 2013. The adoption of ASU 2011-11 is not expected to significantly impact the Company’s consolidated financial statements.
On July 27, 2012, the FASB issued ASU 2012-02, Intangibles-Goodwill and Other (Topic 350) - Testing Indefinite-Lived Intangible Assets for Impairment. The ASU provides entities with an option to first assess qualitative factors to determine whether events or circumstances indicate that it is more likely than not that the indefinite-lived intangible asset is impaired. If an entity concludes that it is more than 50% likely that an indefinite-lived intangible asset is not impaired, no further analysis is required. However, if an entity concludes otherwise, it would be required to determine the fair value of the indefinite-lived intangible asset to measure the amount of actual impairment, if any, as currently required under US GAAP. The ASU is effective for annual and interim impairment tests performed for fiscal years beginning after September 15, 2012. Early adoption is permitted. The adoption of this pronouncement is not expected to have a material impact on the Company’s financial statements.
NOTE 3 - EARNINGS PER SHARE
Basic earnings per share is computed based on the weighted average number of shares of common stock outstanding during the period. Diluted earnings per share is computed based on the weighted average number of shares of common stock plus the effect of dilutive potential common shares outstanding during the period using the treasury stock method. Dilutive potential common shares include outstanding stock options and stock awards.
The components of basic and diluted earnings per share consist of the following:
| For the Three Months Ended September 30, | ||||||||
| 2012 | 2011 | |||||||
| Net Income for Basic Earnings Per Share | $ | 8,861,400 | $ | 10,731,636 | ||||
| Basic Weighted Average Number of Shares | 27,462,578 | 26,857,338 | ||||||
| Net Income per Share – Basic | $ | 0.32 | $ | 0.40 | ||||
| Net Income for Diluted Earnings Per Share | 8,861,400 | 10,731,636 | ||||||
| Diluted Weighted Average Number of Shares | 27,462,578 | 26,857,338 | ||||||
| Net Income per Share – Diluted | $ | 0.32 | $ | 0.40 | ||||
NOTE 4 - INVENTORIES
Inventories consist of the following:
| September 30, | June 30, | |||||||
| 2012 | 2012 | |||||||
| Raw materials | $ | 7,221,229 | $ | 6,009,686 | ||||
| Supplies and packing materials | 610,839 | 565,559 | ||||||
| Work in progress | 304,235 | 127,140 | ||||||
| Finished goods | 20,523,411 | 21,900,299 | ||||||
| Total | $ | 28,659,714 | $ | 28,602,684 | ||||
| F-5 |
NOTE 5 - OTHER CURRENT ASSETS
Other current assets consisted of the following:
| September 30, | June 30, | |||||||
| 2012 | 2012 | |||||||
| Advancement | $ | 756,788 | $ | 299,526 | ||||
| Prepaid insurance | - | - | ||||||
| Total | $ | 756,788 | $ | 299,526 | ||||
Advancement represents advances made to non-related parties and employees. The amounts were unsecured, interest free, and due on demand. Prepaid insurance is related to the underwriting of the Company’s directors and officers insurance policy.
NOTE 6 - PROPERTY, PLANT AND EQUIPMENT
Property, plant and equipment consist of the following:
| September 30, | June 30, | |||||||
| 2012 | 2012 | |||||||
| Building and improvements | $ | 41,804,139 | $ | 36,174,009 | ||||
| Auto | 852,333 | 835,412 | ||||||
| Machinery and equipment | 61,865,034 | 63,280,923 | ||||||
| Agriculture assets | 3,157,294 | 3,163,286 | ||||||
| Total property, plant and equipment | 107,678,800 | 103,453,630 | ||||||
| Less: accumulated depreciation | (26,146,463 | ) | (23,388,469 | ) | ||||
| Total | $ | 81,532,337 | $ | 80,065,161 | ||||
Depreciation expenses for the three months ended September 30, 2012 and 2011 were $2,802,291 and $1,132,399, respectively.
Agriculture assets consist of reproductive trees that are expected to be commercially productive for a period of eight years.
NOTE 7 - CONSTRUCTION IN PROGRESS
As of September 30, 2012 and June 30, 2012, construction in progress representing construction for Yuxing’s supporting facilities amounted to $171,704 and $0, respectively.
NOTE 8 - INTANGIBLE ASSETS
Intangible assets consist of the following:
| September 30, | June 30, | |||||||
| 2012 | 2012 | |||||||
| Land use rights, net | $ | 11,858,140 | $ | 11,014,591 | ||||
| Technology patent, net | 909,075 | 1,902,131 | ||||||
| Customer relationships, net | 7,980,824 | 8,253,368 | ||||||
| Non-compete agreement, net | 114,781 | 125,453 | ||||||
| Trademarks | 6,311,123 | 6,323,098 | ||||||
| Total | $ | 27,173,943 | $ | 27,618,641 | ||||
LAND USE RIGHT
On September 25, 2009, Yuxing was granted a land use right for approximately 88 acres (353,000 square meters or 3.8 million square feet) by the People’s Government and Land & Resources Bureau of Hu County, Xi’an, Shaanxi Province. The fair value of the related intangible asset was determined to be the respective cost of RMB 73,184,895 (or $11,570,532). The intangible asset is being amortized over the grant period of 50 years using the straight line method.
| F-6 |
On August 13, 2003, Tianjuyuan was granted a certificate of Land Use Right for a parcel of land of approximately 11 acres (42,726 square meters or 459,898 square feet) at Ping Gu District, Beijing. The purchase cost was recorded at RMB1,045,950 (or $165,365). The intangible asset is being amortized over the grant period of 50 years.
On August 16, 2001, Jinong received a land use right as a contribution from a shareholder, which was granted by the People’s Government and Land & Resources Bureau of Yanling District, Shaanxi Province. The fair value of the related intangible asset at the time of the contribution was determined to be RMB 7,285,099 (or $1,151,774). The intangible asset is being amortized over the grant period of 50 years.
The Land Use Rights consist of the following:
| September 30, | June 30, | |||||||
| 2012 | 2012 | |||||||
| Land use rights | $ | 12,887,671 | $ | 12,912,125 | ||||
| Less: accumulated amortization | (1,029,531 | ) | (1,897,534 | ) | ||||
| Total land use rights, net | $ | 11,858,140 | $ | 11,014,591 | ||||
TECHNOLOGY PATENT
On August 16, 2001, Jinong was issued a technology patent related to a proprietary formula used in the production of humid acid. The fair value of the related intangible asset was determined to be the respective cost of RMB 5,875,068 (or $928,848) and is being amortized over the patent period of 10 years using the straight line method.
On July 2, 2010, the Company acquired Gufeng and its wholly-owned subsidiary Tianjuyuan. The preliminary fair value on the acquired technology patent was estimated to be RMB 9,200,000 (or $1,454,520) and is amortized over the remaining useful life of six years using the straight line method.
The technology know-how consisted of the following:
| September 30, | June 30, | |||||||
| 2012 | 2012 | |||||||
| Technology know-how | $ | 2,383,368 | $ | 2,387,891 | ||||
| Less: accumulated amortization | (1,474,293 | ) | (485,760 | ) | ||||
| Total technology know-how, net | $ | 909,075 | $ | 1,902,131 | ||||
CUSTOMER RELATIONSHIP
On July 2, 2010, the Company acquired Gufeng and its wholly-owned subsidiary Tianjuyuan. The preliminary fair value on the acquired customer relationships was estimated to be RMB 65,000,000 (or $10,276,500) and is amortized over the remaining useful life of ten years.
| September 30, | June 30, | |||||||
| 2012 | 2012 | |||||||
| Customer relationships | $ | 10,276,500 | $ | 10,296,000 | ||||
| Less: accumulated amortization | (2,295,676 | ) | (2,042,632 | ) | ||||
| Total customer relationships, net | $ | 7,980,824 | $ | 8,253,368 | ||||
NON-COMPETE AGREEMENT
On July 2, 2010, the Company acquired Gufeng and its wholly-owned subsidiary Tianjuyuan. The preliminary fair value on the acquired non-compete agreement was estimated to be RMB 1,320,000 (or $208,692) and is amortized over the remaining useful life of five years using the straight line method.
| September 30, | June 30, | |||||||
| 2012 | 2012 | |||||||
| Non-compete agreement | $ | 208,692 | $ | 209,088 | ||||
| Less: accumulated amortization | (93,911 | ) | (83,635 | ) | ||||
| Total non-compete agreement, net | $ | 114,781 | $ | 125,453 | ||||
| F-7 |
TRADEMARKS
On July 2, 2010, the Company acquired Gufeng and its wholly-owned subsidiary Tianjuyuan. The preliminary fair value on the acquired trademarks was estimated to be $6,311,123, an equivalent amount in U.S. dollars to an amount of RMB 40,700,000, and is subject to an annual impairment test.
Total amortization expenses of intangible assets for the three months ended September 30, 2012 and 2011 amounted to $392,390 and $331,502, respectively.
AMORTIZATION EXPENSE
Estimated amortization expenses of intangible assets for the next five (5) years after September 30, 2012, are as follows:
| Year Ends | Expense ($) | |||
| September 30, 2013 | 1,662,447 | |||
| September 30, 2014 | 1,662,447 | |||
| September 30, 2015 | 1,662,447 | |||
| September 30, 2016 | 1,620,708 | |||
| September 30, 2017 | 1,378,288 | |||
NOTE 9 - ACCRUED EXPENSES AND OTHER PAYABLES
Accrued expenses and other payables consist of the following:
| September 30, | June 30, | |||||||
| 2012 | 2012 | |||||||
| Payroll payable | $ | 125,558 | $ | 127,149 | ||||
| Welfare payable | 167,832 | 168,150 | ||||||
| Accrued expenses | 3,213,543 | 2,827,028 | ||||||
| Other payables | 1,720,377 | 1,045,010 | ||||||
| Other levy payable | 122,679 | 122,912 | ||||||
| Total | $ | 5,349,989 | $ | 4,290,249 | ||||
NOTE 10 - AMOUNT DUE TO RELATED PARTIES
As of September 30, 2012 and June 30, 2012, the amount due to related parties was $1,477,357 and $370,719, respectively. These amounts represent unsecured, non-interest bearing loans that are due on demand. These loans are not subject to written agreements.
On August 10, 2010, Xi’an Hu County Yuxing Agriculture Technology Development Co., Ltd (“Yuxing”) which is a subsidiary of the Company, entered into an agreement with Kingtone Wirelessinfo Solution Holding Ltd (“Kingtone”) which was responsible for developing certain electronic control systems for Yuxing. The total contracted value of this agreement, including value-added taxes and other taxes, is RMB3,030,000, or approximately $479,043.
In July 2007, Jinong signed an office lease with Xi’an Techteam Science and Technology Industry (Group) Co., Ltd. (the “Group Company”), which is controlled by Mr. Tao Li, Green Nevada’s Chairman, President and CEO at a monthly rent of $954 (RMB 6,460) per month. On September 30, 2010, Jinong cancelled this lease agreement with the Group Company without penalty and signed a two year lease effective as of July 1, 2010 directly with Xi’an Kingtone Information Technology Co., Ltd. (“Kingtone Information”), who owns the property. Kingtone Information is a Variable Interest Entity (“VIE”) controlled by Kingtone Wirelessinfo Solution Holding Ltd. (“Kingtone Wirelessinfo”), whose Chairman and majority shareholder is Mr. Tao Li. According to the new lease agreement, the monthly rent is $1,596 (RMB10,800).
On June 29, 2012, Jinong signed an office lease with Xi’an Kingtone Information Technology Co., Ltd. (“Kingtone Information”). Pursuant to the lease, Jinong rented 612 square meters (approximately 6,588 square feet) of office space from Kingtone Information. The lease provided for a two-year term effective as of July 1, 2012 with monthly rent of RMB 24,480 (approximately $3,870).
| F-8 |
During the quarter ended September 30, 2012, the Company entered into a related party transaction to borrow $1,106,700 (RMB 7,000,000) from Xi’an Techteam Science & Technology Industry (Group) Co. Ltd. (“Xi’an”). The Company’s Chairman Tao Li, also serves as Chairman of Xi’an, and is a controlling shareholder. The amount borrowed is non interest bearing and does not contain a specific maturity date.
NOTE 11 - LOAN PAYABLES
The short-term loans payable consist of eight loans which mature on dates ranging from October 17, 2011 through September 24, 2013 with interest rates ranging from 6.30% to 8.87%. The loans No.1, 2 and 3 are collateralized by Tianjyan’s land use rights and building ownership right. The loans No. 4, 5, and 6 are collateralized by the inventory of Gufeng. In addition, the loans No. 7, 8 and 9 are guaranteed by Jinong’s credit.
| No. | Payee | Loan period per agreement | Interest Rate | September 30,2012 | ||||||||
| 1 | Agriculture Bank of China-Beijing Branch | January 11, 2012 - January 10, 2013 | 6.89 | % | $ | 1,328,040 | ||||||
| 2 | Agriculture Bank of China-Beijing Branch | March 23, 2012 - March 22, 2013 | 8.20 | % | 1,264,800 | |||||||
| 3 | Agriculture Bank of China-Beijing Branch | April 23, 2012 - April 22, 2013 | 8.20 | % | 1,596,810 | |||||||
| 4 | Bank of Tianjin | August 7,2012-May 15, 2013 | 7.20 | % | 1,106,700 | |||||||
| 5 | Bank of Tianjin | August 7,2012-June 19, 2013 | 7.20 | % | 1,106,700 | |||||||
| 6 | Bank of Tianjin | August 7, 2012-June 3, 2013 | 7.20 | % | 948,600 | |||||||
| 7 | China Merchant Bank | August 30, 2012-August 29, 2013 | 6.30 | % | 3,952,500 | |||||||
| 8 | Industrial and Commercial Bank of China | October 17, 2011 - October 17,2012 | 8.87 | % | 1,581,000 | |||||||
| 9 | Industrial and Commercial Bank of China | September 25, 2012-September 24, 2013 | 8.00 | % | 1,581,000 | |||||||
| Total | $ | 14,466,150 | ||||||||||
The bank loan from Industrial and Commercial Bank of China had been renewed after expiration with the same loan amount and 8.0% interest rate. The renewed loan period is from September 25, 2012 to September 24, 2013.
| F-9 |
As of June 30, 2012, the short-term loans payable consist of eight loans which mature on dates ranging from July 23, 2012 through April 22, 2013 interest rates ranging from 6.89% to 8.87%. The loans No.1, 2 and 3 are collateralized by Tianjyan’s land use rights and building ownership right. The loan No. 4 is collateralized by the inventory of Gufeng. In addition, the loans No.5, 6, 7 and 8 are guaranteed by Jinong’s credit.
| Interest | June 30, | |||||||||||
| No. | Payee | Loan period per agreement | Rate | 2012 | ||||||||
| 1 | Agriculture Bank of China-Beijing Branch | JaJanuary 11, 2012 - January 10, 2013 | 6.89 | % | $ | 1,330,560 | ||||||
| 2 | Agriculture Bank of China-Beijing Branch | March 23, 2012 - March 22, 2013 | 8.2 | % | 1,267,200 | |||||||
| 3 | Agriculture Bank of China-Beijing Branch | April 23, 2012 - April 22, 2013 | 8.2 | % | 1,599,840 | |||||||
| 4 | Bank of Tianjin | September 9, 2011 - July 23, 2012 | 7.54 | % | 1,813,680 | |||||||
| 5 | Minsheng Bank | September 8, 2011 - September 8, 2012 | 8.2 | % | 1,814,372 | |||||||
| 6 | Minsheng Bank | September 19, 2011 - September 19, 2012 | 8.2 | % | 561,628 | |||||||
| 7 | China Merchant Bank | July 25, 2011 - July 26, 2012 | 8.53 | % | 3,960,000 | |||||||
| 8 | Industrial and Commercial Bank of China | October 17, 2011 - October 17,2012 | 8.87 | % | 1,584,000 | |||||||
| Total | $ | 13,931,280 | ||||||||||
The interest expenses from short-term loans were $385,792 and $156,479 for the three months ended September 30, 2012 and 2011, respectively.
| F-10 |
NOTE 12 - TAXES PAYABLE
Enterprise Income Tax
Effective January 1, 2008, the new Enterprise Income Tax (“EIT”) law of the PRC replaced the existing tax laws for Domestic Enterprises (“DES”) and Foreign Invested Enterprises (“FIEs”). The new EIT rate of 25% replaced the 33% rate that was applicable to both DES and FIEs. The two year tax exemption and three year 50% tax reduction tax holiday for production-oriented FIEs was eliminated. Since January 1, 2008, Jinong became subject to income tax in China at a rate of 15% as a high-tech company, as a result of the expiration of its tax exemption on December 31, 2007. Jinong’s provision for income taxes for the three months ended September 30, 2012 and 2011 was $1,754,200 and $2,463,511, respectively. Gufeng is subject to 25% EIT rate and thus it made provision for income taxes of $95,784 and $622,653 for the three months ended September 30, 2012 and 2011, respectively. Jintai and Yuxing have been exempt from paying income tax since its formation as it produces products which fall into the tax exemption list set out in the EIT. This exemption is expected to last as long as the applicable provisions of the EIT do not change.
Value-Added Tax
All of the Company’s fertilizer products that are produced and sold in the PRC were subject to a Chinese Value-Added Tax (VAT) of 13% of the gross sales price. On April 29, 2008, the PRC State of Administration of Taxation (SAT) released Notice #56, “ Exemption of VAT for Organic Fertilizer Products ”, which allows certain fertilizer products to be exempt from VAT beginning June 1, 2008. The Company submitted the application for exemption in May 2009, which was granted effective September 1, 2009, continuing through December 31, 2015. The VAT exemption applies to all agricultural products sold by Jintai and Yuxing, and all but a nominal amount of agricultural products sold by Jinong.
Income Taxes and Related Payables
Taxes payable consist of the following:
| September 30, | June 30, | |||||||
| 2012 | 2012 | |||||||
| VAT provision (credit) | $ | 102,633 | $ | 68,180 | ||||
| Income tax payable | 19,092,083 | 17,274,817 | ||||||
| Other levies | 346,168 | 332,392 | ||||||
| Total | $ | 19,540,884 | $ | 17,675,389 | ||||
Income Taxes in the Consolidated Statements of Income and Comprehensive Income
The provision for income taxes consists of the following:
| September 30, | June 30, | |||||||
| 2012 | 2012 | |||||||
| Current tax - foreign | $ | 1,849,984 | $ | 10,801,313 | ||||
| Deferred tax | - | - | ||||||
| Total | $ | 1,849,984 | $ | 10,801,313 | ||||
Tax Rate Reconciliation
Our effective tax rates were approximately 17.3%and 18.7% for the three months ended September 30, 2012 and 2011, respectively. Substantially all of the Company’s income before income taxes and related tax expense are from PRC sources. Actual income tax benefit reported in the consolidated statements of income and comprehensive income differ from the amounts computed by applying the US statutory income tax rate of 34% to income before income taxes for the three months ended September 30, 2012, 2011 for the following reasons:
| F-11 |
| China | United States | |||||||||||||||||||||||
| September 30, 2012 | 15% - 25% | 0.34 | Total | |||||||||||||||||||||
| Pretax income (loss) | $ | 12,050,347 | $ | (1,338,963 | ) | $ | 10,711,384 | |||||||||||||||||
| Expected income tax expense (benefit) | 3,012,587 | 25.0 | % | (455,247 | ) | 34.0 | % | 2,557,340 | ||||||||||||||||
| High-tech income benefits on Jinong | (1,168,747 | ) | (9.7 | )% | - | - | (1,168,747 | ) | ||||||||||||||||
| Losses from subsidiaries in which no benefit is recognized | 6,144 | 0.1 | % | - | - | 6,144 | ||||||||||||||||||
| Change in valuation allowance on deferred tax asset from US tax benefit | - | 455,247 | (34.0 | )% | 455,247 | |||||||||||||||||||
| Actual tax expense | $ | 1,849,984 | 15.4 | % | $ | - | - | % | $ | 1,849,984 | 17.3 | % | ||||||||||||
| September 30, 2011 | China | United States | ||||||||||||||||||||||
| 15% - 25% | 0.34 | Total | ||||||||||||||||||||||
| Pretax income (loss) | $ | 14,681,072 | $ | (1,485,925 | ) | $ | 13,195,147 | |||||||||||||||||
| Expected income tax expense (benefit) | 3,670,268 | 25 | % | (505,215 | ) | 34.0 | % | 3,165,053 | ||||||||||||||||
| High-tech income benefits on Jinong | (766,515 | ) | (5.2 | )% | - | - | (766,515 | ) | ||||||||||||||||
| Losses from subsidiaries in which no benefit is recognized | (440,242 | ) | (3.0 | )% | - | - | (440,242 | ) | ||||||||||||||||
| Change in valuation allowance on deferred tax asset from US tax benefit | - | 505,215 | (34.0 | )% | 505,215 | |||||||||||||||||||
| Actual tax expense | $ | 2,463,511 | 16.8 | % | $ | - | - % | $ | 2,463,511 | 18.7 | % | |||||||||||||
NOTE 13 - STOCKHOLDERS’ EQUITY
Common Stock
On July 2, 1010, the Company issued a total of 2,275,931 shares of common stock to Gufeng’s previous shareholders or their designees. Of the shares being issued in the acquisition, 40% have been held in escrow pending satisfaction of certain conditions such as make good targets set for Gufeng for the fiscal year ended June 30, 2011.
On March 31, 2011, the Company granted a total of 96,000 shares of restricted common stock of the Company to certain directors and executive officers under its 2009 Equity Incentive Plan. Pursuant to the terms of the grant, 8,000 shares of restricted common stock were vested on April 30, 2011, 44,000 shares vested on June 2, 2011, and 44,000 shares vested on December 31,2011. These shares were issued in September 2011.
On March 8, 2012, the Company issued 63,158 shares of common stock in a private placement to Mr. Tao Li, the Company’s Chairman and Chief Executive Officer, at a purchase price of $4.75 per share, for an aggregate purchase price of $300,001 pursuant to and in accordance with the terms and provisions of a Securities Purchase Agreement in a form previously presented to the Board of Directors of the Company.
On March 31, 2012, the Company issued 5,704 shares of Common Stock valued at $24,000 of consulting services.
On June 14, 2012, the Company granted a total of 1,000,000 shares of restricted common stock of the Company to certain directors, executive officers and key employees under its 2009 Equity Incentive Plan. Pursuant to the terms of the grant, the stock grants vest in three installments on June 30, 2012, September 30, 2012 and December 31, 2012. The Company has issued 445,000 shares of common stock related to these grants with 555,000 yet to be issued.
On September 12, 2012, the Company issued 35,041 shares of Common Stock valued at $130,000 of consulting services.
Preferred Stock
Under the Company’s articles of incorporation, the board of directors has the authority, without further action by stockholders, to designate up to 20,000,000 shares of preferred stock in one or more series and to fix the rights, preferences, privileges, qualifications and restrictions granted to or imposed upon the preferred stock, including dividend rights, conversion rights, voting rights, rights and terms of redemption, liquidation preference and sinking fund terms, any or all of which may be greater than the rights of the common stock. If the Company sells preferred stock under its registration statement on Form S-3, it will fix the rights, preferences, privileges, qualifications and restrictions of the preferred stock of each series in the certificate of designation relating to that series and will file the certificate of designation that describes the terms of the series of preferred stock the Company offers before the issuance of the related series of preferred stock.
As of September 30, 2012, the Company has 20,000,000 shares of preferred stock authorized, with a par value of $.001 per share, of which no shares are issued or outstanding.
| F-12 |
NOTE 14 - STOCK OPTIONS
On March 31, 2011, the Company’s Compensation Committee approved the cancellation of all those outstanding unvested options granted to officers and directors and former officers on March 1, 2010 and February 7, 2010 under the 2009 Equity Incentive Plan.
There were no issuances of stock options during the three months ended September 30, 2012 and 2011.
Options outstanding as of September 30, 2012 and related weighted average price and intrinsic value are as follows:
| Weighted | ||||||||||||
| Average | ||||||||||||
| Number | Exercise | Aggregate | ||||||||||
| of Shares | Price | Intrinsic Value | ||||||||||
| Outstanding, June 30, 2012 | 115,099 | $ | 14.66 | $ | - | |||||||
| Granted | - | |||||||||||
| Forfeited/Cancelled | - | |||||||||||
| Exercised | - | |||||||||||
| Outstanding, September 30, 2012 | 115,099 | $ | 14.66 | $ | - | |||||||
NOTE 15 -CONCENTRATIONS AND LITIGIATION
Market Concentration
All of the Company's revenue-generating operations are conducted in the PRC. Accordingly, the Company's business, financial condition and results of operations may be influenced by the political, economic and legal environments in the PRC, and by the general state of the PRC's economy.
The Company's operations in the PRC are subject to specific considerations and significant risks not typically associated with companies in North America and Western Europe. These include risks associated with, among other things, the political, economic and legal environments and foreign currency exchange. The Company's results may be adversely affected by, among other things, changes in governmental policies with respect to laws and regulations, anti-inflationary measures, currency conversion and remittance abroad, and rates and methods of taxation.
Vendor and Customer Concentration
There were two vendors from which the Company purchased more than 10% of its raw materials for the fertilizer products for the three months ended September 30, 2012.
There was no vendor from which the Company purchased more than 10% of its raw materials for the fertilizer products for the three months ended September 30, 2011.
There was no customer that accounted over 10% of the total sales of fertilizer products as of three months ended September 30, 2012 and 2011.
Litigation
On October 15, 2010, a class action lawsuit was filed against the Company and certain of its current and former officers in the United States District Court for the District of Nevada (the "Nevada Federal Court") on behalf of purchasers of the Company’s common stock between November 12, 2009 and September 1, 2010. On April 27, 2011, the court appointed the lead plaintiff and lead plaintiff’s counsel. On June 13, 2011, lead plaintiff filed an amended complaint, which adds several additional defendants and expands the class period to include purchasers who purchased our common stock between May 12, 2009 and January 4, 2011. The amended complaint alleges that the Company and certain of its current and former officers and directors violated Sections 10(b) and 20(a) of the Securities Exchange Act of 1934 and Sections 11, 12(a)(2), and 15 of the Securities Act of 1933, as amended, by making material misstatements and omissions in the Company’s financial statements, securities offering documents, and related disclosures during the class period.. The plaintiffs claim that such allegedly misleading financial statements inflated the price of the Company’s common stock and seek monetary damages in an amount to be determined at trial. Defendants moved to dismiss the amended complaint on October 7, 2011. Defendant’s motions were argued on October 2, 2012. On November 2, 2012, the Nevada Federal Court issued a decision dismissing the claims for violation of sections 11, 12(a)(2) and 15 of the Securities Act of 1933 as to all defendants and dismissing certain individual defendants from the complaint and allowing the claims for violations of section 10(b) and 20(a) of the Securities Exchange Act of 1934 to continue with respect to the Company and certain of the individual defendants.
| F-13 |
NOTE 16 - SEGMENT REPORTING
The Company was organized into four main business segments based on location and product: Jinong (fertilizer production), Gufeng (fertilizer production), Jintai (agricultural products production) and Yuxing (agricultural products production). Each of the four operating segments referenced above has separate and distinct general ledgers. The chief operating decision maker (“CODM”) receives financial information, including revenue, gross margin, operating income and net income produced from the various general ledger systems to make decisions about allocating resources and assessing performance; however, the principal measure of segment profitability or loss used by the CODM is net income by segment. Jintai is in process of combining with Yuxing.
The following tables present a summary of our businesses and operating segments results.
| F-14 |
| Three months ended September 30, | ||||||||
| 2012 | 2011 | |||||||
| Revenues from unaffiliated customers: | ||||||||
| Jinong | $ | 27,850,976 | $ | 22,242,251 | ||||
| Gufeng | 10,936,971 | 29,613,091 | ||||||
| Jintai | - | 1,198,887 | ||||||
| Yuxing | 724,793 | 48,365 | ||||||
| Consolidated | $ | 39,512,740 | $ | 53,102,594 | ||||
| Operating income : | ||||||||
| Jinong | $ | 11,611,611 | $ | 12,187,448 | ||||
| Gufeng | 688,639 | 2,608,589 | ||||||
| Jintai | - | 10,459 | ||||||
| Yuxing | 62,129 | (40,730 | ) | |||||
| Reconciling item (1) | - | (705,036 | ) | |||||
| Reconciling item (2) | (602,138 | ) | (781,167 | ) | ||||
| Reconciling item (2)—stock compensation | (736,897 | ) | - | |||||
| Consolidated | $ | 11,023,344 | $ | 13,279,563 | ||||
| Net income: | ||||||||
| Jinong | $ | 9,937,587 | $ | 10,429,494 | ||||
| Gufeng | 207,670 | 1,817,896 | ||||||
| Jintai | 10 | 10,501 | ||||||
| Yuxing | 55,092 | (40,331 | ) | |||||
| Reconciling item (1) | 75 | 278 | ||||||
| Reconciling item (2) | (1,339,034 | ) | (1,486,202 | ) | ||||
| Consolidated | $ | 8,861,400 | $ | 10,731,636 | ||||
| Depreciation and Amortization: | ||||||||
| Jinong | $ | 2,035,853 | $ | 575,478 | ||||
| Gufeng | 845,363 | 789,592 | ||||||
| Jintai | - | 283 | ||||||
| Yuxing | 313,465 | 98,548 | ||||||
| Consolidated | $ | 3,194,681 | $ | 1,463,901 | ||||
| Interest expense: | ||||||||
| Jinong | $ | - | $ | - | ||||
| Gufeng | 385,792 | 156,479 | ||||||
| Consolidated | $ | 385,792 | $ | 156,479 | ||||
| Capital Expenditure: | ||||||||
| Jinong | $ | 4,343,939 | $ | 765,309 | ||||
| Gufeng | 46,153 | 24,341 | ||||||
| Jintai | - | - | ||||||
| Yuxing | 202,718 | 130,016 | ||||||
| Consolidated | $ | 4,592,810 | $ | 919,666 | ||||
| As of | As of | |||||||
| September 30, 2012 | June 30, 2012 | |||||||
| Identifiable assets: | ||||||||
| Jinong | $ | 164,958,221 | $ | 221,575,406 | ||||
| Gufeng | 93,171,801 | 57,657,305 | ||||||
| Jintai | 4,599,779 | 6,670,058 | ||||||
| Yuxing | 37,448,008 | 1,851,745 | ||||||
| Reconciling item (1) | 227,885 | 280,445 | ||||||
| Reconciling item (2) | (3,906 | ) | (3,906 | ) | ||||
| Consolidated | $ | 300,401,788 | $ | 288,031,053 | ||||
(1) Reconciling amounts refer to the unallocated assets or expenses of Green New Jersey.
(2) Reconciling amounts refer to the unallocated assets or expenses of the Parent Company.
| F-15 |
NOTE 17 - COMMITMENTS AND CONTINGENCIES
On June 29, 2012, Jinong signed an office lease with Kingtone Information upon the expiration of its existing lease with Kingtone Information. Pursuant to the new lease, Jinong rented 612 square meters (approximately 6,588 square feet) of office space from Kingtone Information. The lease provided for a two-year term effective as of July 1, 2012 with monthly rent of $3,870 (RMB 24,480).
In January 2008, Jintai signed a ten year land lease with Xi’an Jinong Hi-tech Agriculture Demonstration Zone for a monthly rent of $822 (RMB 5,200).
In February 2004, Tianjuyuan signed a fifty year lease with the village committee of Dong Gao Village and Zhen Nan Zhang Dai Village in the Beijing Ping Gu District, at a monthly rent of $468 (RMB 2,958) for approximately 47,333 square meters (509,488 square feet) of land in the Ping Gu District of Beijing.
Accordingly, the Company recorded an aggregate of $15,480 and $63,724 as rent expenses for the three months ended September 30, 2012 and 2011, respectively. Rent expenses for the next five years ended September 30, are as follows:
| Years ending: | ||||
| September 30, 2013 | 61,921 | |||
| September 30, 2014 | 61,921 | |||
| September 30, 2015 | 15,447 | |||
| September 30, 2016 | 15,447 | |||
| September 30, 2017 | 15,447 | |||
NOTE 18 – SUBSEQUENT EVENTS
On September 26, the Company agreed to issue 151,515 shares of Common Stock at the market price of $3.30 per share to Mr. Tao Li, the Company’s Chairman and Chief Executive Officer in the first offering of the Company’s Employee Stock Purchase Plan (“ESPP”) adopted by the Company’s Board of Directors (the “Board”) on August 9, 2012. Mr. Li had previously advanced the Company $300,000 and has unpaid compensation accrued in the accompanying balance sheet. The 151,515 shares were not issued until after September 30, 2012 and accordingly the due to officer of $300,000 and accrued compensation of $200,000 will be deducted during the quarter ended December 31, 2012.
On September 28, 2012, the Company approved the granting of (i) 200,000 shares of restricted stock to Mr. Ken Ren, the Company’s Chief Financial Officer (the “CFO”), and (ii) 40,000 shares of restricted stock to Mr. Yizhao Zhang, 30,000 shares of restricted stock to Ms. Yiru Shi, and 20,000 shares of restricted stock to Mr. Lianfu Liu, each is an independent director of the Company (the “Stock Grants”). The Stock Grants all vest in three installments on December 31, 2012, March 31, 2013, and June 30, 2013, with 100,000 shares vesting first and 50,000 shares vesting on each of the other two vesting dates to the CFO; and 10,000 shares vesting first and half of the their respective remaining shares vesting on each of the other two vesting dates to the three independent directors. The vest of the restricted shares is conditioned on the individuals being employed by the Company at the time of the vest. These shares will be issued during the quarter ended December 31, 2012 and the expenses associated with the issuance of these shares will be recorded over the vesting period of the shares.
| F-16 |
Item 2. Management’s Discussion and Analysis of Financial Condition and Results of Operations
The following discussion and analysis of our financial condition and results of operations should be read in conjunction with our consolidated financial statements and the notes to those financial statements appearing elsewhere in this report. This discussion and analysis contains forward-looking statements that involve significant risks and uncertainties. As a result of many factors, such as the slow-down of the global financial markets and its impact on economic growth in general, the competition in the fertilizer industry and the impact of such competition on pricing, revenues and margins, the weather conditions in the areas where our customers are based, the cost of attracting and retaining highly skilled personnel, the prospects for future acquisitions, and the factors set forth elsewhere in this report, our actual results may differ materially from those anticipated in these forward-looking statements. In light of these risks and uncertainties, there can be no assurance that the forward-looking statements contained in this report will in fact occur. You should not place undue reliance on the forward-looking statements contained in this report.
The forward-looking statements speak only as of the date on which they are made, and, except to the extent required by U.S. federal securities laws, we undertake no obligation to update any forward-looking statement to reflect events or circumstances after the date on which the statement is made or to reflect the occurrence of unanticipated events. Further, the information about our intentions contained in this report is a statement of our intention as of the date of this report and is based upon, among other things, the existing regulatory environment, industry conditions, market conditions and prices and our assumptions as of such date. We may change our intentions, at any time and without notice, based upon any changes in such factors, in our assumptions or otherwise.
Unless the context indicates otherwise, as used in the following discussion, “Company”, “we,” “us,” and “our,” refer to (i) China Green Agriculture, Inc. (“Green Nevada”), a corporation incorporated in the State of Nevada; (ii) Green Agriculture Holding Corporation (“Green New Jersey”), a wholly-owned subsidiary of Green Nevada incorporated in the State of New Jersey; (iii) Shaanxi TechTeam Jinong Humic Acid Product Co., Ltd. (“Jinong”), a wholly-owned subsidiary of Green New Jersey organized under the laws of the PRC; (iv) Xi’an Jintai Agriculture Technology Development Company (“Jintai”), wholly-owned subsidiary of Jinong in the PRC, (v) Xi’an Hu County Yuxing Agriculture Technology Development Co., Ltd. (“Yuxing”), a wholly-owned subsidiary of Jinong in the PRC; (vi) Beijing Gufeng Chemical Products Co., Ltd., a wholly-owned subsidiary of Jinong in the PRC (“Gufeng”), and (vii) Beijing Tianjuyuan Fertilizer Co., Ltd., Gufeng’s wholly-owned subsidiary in the PRC (“Tianjuyuan”).
Unless the context otherwise requires, all references to (i) “PRC” and “China” are to the People’s Republic of China; (ii) “U.S. dollar,” “$” and “US$” are to United States dollars; and (iii) “RMB”, “Yuan” and Renminbi are to the currency of the PRC or China.
Overview
We are engaged in the research, development, production and sale of various types of fertilizers and agricultural products in the PRC through our wholly-owned Chinese subsidiaries, Jinong, Yuxing, Gufeng (including Gufeng’s subsidiary Tianjuyuan). Our primary business is fertilizer products, specifically humic-acid based compound fertilizer produced by Jinong and compound fertilizer, blended fertilizer, organic compound fertilizer, slow-release fertilizers, highly-concentrated water-soluble fertilizers and mixed organic-inorganic compound fertilizer produced by Gufeng. In addition, through Yuxing, we develop and produce agricultural products, such as top-grade fruits, vegetables, flowers and colored seedlings. For financial reporting purposes, our operations are organized into four business segments: fertilizer products (Jinong), fertilizer products (Gufeng), agricultural products production (Yuxing) and agricultural products production (Jintai).
Yuxing serves as a research and development base for our fertilizer products. The fertilizer business conducted by Jinong and Gufeng generated approximately 98.2%, and 97.7% of our total revenues for the three months ended September 30, 2012 and 2011, respectively. Jintai had served as a research and development base for our fertilizer products. However, as reported in our previous annual and quarterly reports, we started to relocate Jintai to the facilities of Yuxin due to the deteriorated surrounding environment that caused the death and obsolescence of large amount of Jintai’s flowers and seedlings. As a result, Jintai has not been in operation since March 1, 2012, when the relocation commenced.
Fertilizer Products
As of September 30, 2012, we had developed and produced a total of 446 different fertilizer products in use, of which 129 were developed and produced by Jinong and 317 by Gufeng.
Below is a table that shows the metric tons of fertilizer sold by Jinong and Gufeng and the revenue per ton for the periods indicated:
| 3 |
| For the Three Months Ended September 30, | ||||||||
| 2012 | 2011 | |||||||
| (Metric Tons) | (Metric Tons) | |||||||
| JN | 17,449 | 16,846 | ||||||
| GF | 22,150 | 64,874 | ||||||
| Total | 39,599 | 81,720 | ||||||
| For the Three Months Ended September 30, | ||||||||
| 2012 | 2011 | |||||||
| (Revenue per ton $) | (Revenue per ton $) | |||||||
| JN | $ | 1,596 | $ | 1,320 | ||||
| GF | $ | 494 | $ | 456 | ||||
For the three months ended September 30, 2012, we sold approximately 39,599 metric tons of fertilizer products, as compared to 81,720 metric tons for the three months ended September 30, 2011. For the three months ended September 30, 2012, Jinong sold approximately 17,449 metric tons of fertilizer products, as compared to 16,846 metric tons for the three months ended September 30, 2011. For the three months ended September 30, 2012, Gufeng sold approximately 22,150 metric tons of fertilizer products, as compared to 64,874 metric tons for the three months ended September 30, 2011. Our sales of fertilizer products to the top five provinces accounted for approximately 46.9% of our fertilizer revenue for the three months ended September 30, 2012; Specifically, the provinces and their respective percentage contributed to our fertilizer revenues were, Hebei (16.2 %), Shaanxi (9.0%), Heilongjiang(8.0%), Shandong (7.5%) and Beijing(6.1%).
As of September 30, 2012, we had a total of 966 distributors covering 22 provinces, four autonomous regions and three central government-controlled municipalities in China. Jinong had 779 distributors in China. Jinong’s sales are not dependent on any single distributor or any group of distributors. Its top five distributors accounted for 2.1% of Jinong’s fertilizer revenues for the three months ended September 30, 2012. Gufeng had 187 distributors, including some large state-owned enterprises. Gufeng’s top five distributors accounted for 64.5% of its revenues with no single distributor accounting for more than 10% of our total revenues for the three months ended September 30, 2012.
Agricultural Products
Through Yuxing, we develop, produce and sell high-quality flowers, green vegetables and fruits to local marketplaces and various horticulture and planting companies. We also use certain of Yuxing’s greenhouse facilities to conduct research and development activities for our fertilizer products. The three PRC provinces that accounted for 100% of our agricultural products revenue for the three months ended September 30, 2012 were Shaanxi (97.2%), Ningxia (2.0%) and Gansu (0.8%).
Recent Developments
New Products
During the three months ended September 30, 2012, Jinong launched three new fertilizer products, which are broad-spectrum fertilizer products. Jinong’s new products generated approximately $171,934, or 0.6% of Jinong’s fertilizer revenues for the three months ended September 30, 2012. Jinong also added 21 new distributors for the three months ended September 30, 2012. Jinong’s new distributors accounted for approximately $1,303,863, or 4.7% of Jinong’s fertilizer revenues for the three months ended September 30, 2012. During the quarter ended September 30, 2012, no revenue of Jinong was attributable to the new products distributed by its new distributors. During the three months ended September 30, 2012, Gufeng launched no new fertilizer product. Gufeng added two new distributors during the three months ended September 30, 2012, which accounted for approximately $96,332, or 0.9%, of Gufeng’s fertilizer revenues. During the quarter ended September 30, 2012, no revenue of Gufeng was attributable to the new products distributed by its new distributors.
| 4 |
Jintai Relocation
As previously disclosed in our quarterly and annual reports, Jintai is located at the Economic and Technical Development Zone (the "Zone") in the metro area of the city of Xi'an. The Zone has been inhabited by a large and dense population and the periphery of Jintai has bristled with various industrial factories and utility plants in the latest years. The Zone’s concentrated industrial activities and dense population changed the micro bio environment for the growth of Jintai's agricultural products and disturbed Jintai’s normal fertilizer research and development. From June 2011 to March 2012, such changes caused the death and obsolescence of large amount of Jintai's flowers and seedlings.
As of June 2011, 4,852,236 number of Photinia fraseri were obsolete due to the air and water pollution in the surrounding area of Jintai. The total loss for this obsolescence incurred a write-off of $2,813,993, which equaled to the maintenance cost of Photinia fraseri, and was classified as general and administration expense in Jintai for the fiscal year June 30, 2011.
In addition, 2,028,508 and 1,532,876 number of Photinia fraseri became obsolete as of September 30 and December 31, 2011 respectively due to the exacerbating air and water pollution in the surrounding area of Jintai. The total loss for the obsolescence incurred write-offs of $288,307 and $957,407 respectively. The losses equaled to the maintenance cost of Photinia fraseri, and were classified as general and administration expense in Jintai for the quarter ended September 30 and December 31, 2011.
As of March 31, 2012, 54,682 number of butterfly orchids became obsolete due to disease. The total loss for the obsolescence incurred a write-off of $223,907, which equaled to the maintenance cost of butterfly orchids, and was classified as general and administration expense in Jintai as of March 31, 2012.
From March 2012, the Company commenced to relocate Jintai in the facilities of one of the Company’s other subsidiaries, Yuxin, located in Hu County, 18 kilometers southeast of Xi’an city. During the three months ended September 30, 2012, Jintai had no sales revenue due to relocation. The entire relocation process is expected to complete by the end of fiscal year 2013. We expect Jintai will likely remain unprofitable until the relocation gets completed. Further, the Company may consider merging the subsidiaries of Yuxing and Jintai together to reduce operating cost and streamline management at appropriate time in the future.
Results of Operations
Three months ended September 30, 2012 compared to three months ended September 30, 2011.
The following table shows the operating results of the Company on a consolidated basis for the three months ended September 30, 2012 and 2011.
| 5 |
CHINA GREEN AGRICULTURE INC. AND SUBSIDIARIES
CONSOLIDATED CONDENSED STATEMENTS OF INCOME AND COMPREHENSIVE INCOME
(UNAUDITED)
| Three months ended September 30, 2012 | ||||||||||||||||
| 2012 | 2011 | Change | Change% | |||||||||||||
| Sales | ||||||||||||||||
| Jinong | $ | 27,850,976 | $ | 22,242,251 | 5,608,725 | 25 | % | |||||||||
| Gufeng | 10,936,971 | 29,613,091 | (18,676,120 | ) | (63 | )% | ||||||||||
| Jintai | - | 1,198,887 | (1,198,887 | ) | (100 | )% | ||||||||||
| Yuxing | 724,793 | 48,365 | 676,428 | 1399 | % | |||||||||||
| Net sales | 39,512,740 | 53,102,594 | (13,589,854 | ) | (26 | )% | ||||||||||
| Cost of goods sold | - | |||||||||||||||
| Jinong | 12,839,498 | 8,110,130 | 4,729,368 | 58 | % | |||||||||||
| Gufeng | 9,189,762 | 25,269,670 | (16,079,908 | ) | (64 | )% | ||||||||||
| Jintai | - | 748,830 | (748,830 | ) | (100 | )% | ||||||||||
| Yuxing | 550,107 | 65,232 | 484,875 | 743 | % | |||||||||||
| Cost of goods sold | 22,579,367 | 34,193,862 | (11,614,495 | ) | (34 | )% | ||||||||||
| Gross profit | 16,933,373 | 18,908,732 | (1,975,359 | ) | (10 | )% | ||||||||||
| Operating expenses | - | |||||||||||||||
| Selling expenses | 3,034,087 | 2,490,474 | 543,613 | 22 | % | |||||||||||
| General and administrative expenses | 2,875,942 | 3,138,695 | (262,753 | ) | (8 | )% | ||||||||||
| Total operating expenses | 5,910,029 | 5,629,169 | 280,860 | 5 | % | |||||||||||
| Income from operations | 11,023,344 | 13,279,563 | (2,256,219 | ) | (17 | )% | ||||||||||
| Other income (expense) | - | |||||||||||||||
| Other income (expense) | (600 | ) | (25,424 | ) | 24,824 | (98 | )% | |||||||||
| Interest income | 74,432 | 97,487 | (23,055 | ) | (24 | )% | ||||||||||
| Interest expense, net | (385,792 | ) | (156,479 | ) | (229,313 | ) | 147 | % | ||||||||
| Total other income (expense) | (311,960 | ) | (84,416 | ) | (227,544 | ) | 270 | % | ||||||||
| Income before income taxes | 10,711,384 | 13,195,147 | (2,483,763 | ) | (19 | )% | ||||||||||
| Provision for income taxes | 1,849,984 | 2,463,511 | (613,527 | ) | (25 | )% | ||||||||||
| Net income | 8,861,400 | 10,731,636 | (1,870,236 | ) | (17 | )% | ||||||||||
| Other comprehensive income | - | |||||||||||||||
| Foreign currency translation gain (loss) | (464,353 | ) | 1,904,146 | (2,368,499 | ) | (124 | )% | |||||||||
| Comprehensive income | $ | 8,397,047 | $ | 12,635,782 | (4,238,735 | ) | (34 | )% | ||||||||
| Basic weighted average shares outstanding | 27,462,578 | 26,857,338 | 605,240 | 2 | % | |||||||||||
| Basic net earnings per share | $ | 0.32 | $ | 0.40 | (0.08 | ) | (19 | )% | ||||||||
| Diluted weighted average shares outstanding | 27,462,578 | 26,857,338 | 605,240 | 2 | % | |||||||||||
| Diluted net earnings per share | 0.32 | 0.40 | (0.08 | ) | (19 | )% | ||||||||||
| 6 |
Net Sales
Total net sales for the three months ended September 30, 2012 were $ 39,512,740, a decrease of $13,589,854, or 25.6%, from $53,102,594 for the three months ended September 30, 2011. This decrease was largely due to the decrease in Gufeng’s net sales.
For the three months ended September 30, 2012, Jinong’s net sales increased $5,608,725, or 25.2%, to $27,850,976 from $22,242,251 for the three months ended September 30, 2011. This increase was mainly attributable to the greater sales of humic acid fertilizer products including our liquid and powder fertilizers during this period as a result of our increased distributors and the aggressive marketing strategy.
For the three months ended September 30, 2012, net sales at Gufeng were $10,936,971, a decrease of $18,676,120, or 63.1%, from $29,613,091 for the three months ended September 30, 2011. The fiscal quarter ended September 30, 2012 fell in the “export window” in which no special tariff tax applied, however, due to the lower demand on Nitrogen-Phosphorous elemented compound fertilizer by importing countries which is arising from the backlog of their imported compound fertilizers in previous quarters, which also led to lower-than-before profit margin over the export contracts, Gufeng had no export contract in the quarter ended September 30, 2012. Despite of that, Gufeng has been expanding and penetrating the domestic market particularly since the fiscal quarter ended March 31, 2012, during which period no revenue was generated from fertilizer exportation either due to special tariff tax levied by China authority or due to weak demand by importing countries. Net domestic sales at Gufeng for the three months ended September 30, 2012 was $10,936,971, an increase of $1,759,028, or 19.2%, from $9,177,943 for the same period in 2011.
Jintai’s net sales decreased by $1,198,887, or 100.0%, to zero for the three months ended September 30, 2012 from $1,198,887 for the same period in 2011. The decrease was attributable to Jintai’s relocation, which commenced on March 1, 2012 and is still on going. Therefore, Jintai did not generate any sales revenue since March 1, 2012.
For the three months ended September 30, 2012, Yuxing’s net sales were $724,793, an increase of $676,428, from $48, 365 during the three months ended September 30, 2011. The increase was mainly attributable both to the strong sales of Yuxing’s top-grade flowers and the proxy sales of certain inventory from Jintai.
Cost of Goods Sold
Total cost of goods sold for the three months ended September 30, 2012 was $22,579,367, a decrease of $11,614,495, or 34.0%, from $34,193,862 for the three months ended September 30, 2011. This decrease was proportional to the decrease in sales, which was mainly due to Gufeng’s decreased exported sales for the three months ended September 30, 2012.
Cost of goods sold by Jinong for the three months ended September 30, 2012 was $12,839,498, an increase of $4,729,368, or 58.3%, from $8,110,130 for the same period in 2011. The increase was primarily attributable to (i) the 110% increase in the cost of raw materials and (ii) 25.2% increases in sales of fertilizer products.
Cost of goods sold by Gufeng for the three months ended September 30, 2012 was $9,189,762, a decrease of $16,079,908, or 63.6%, from $25,269,670 for the same period in 2011. The decrease was proportional to Gufeng’s sales for the three months ended September 30, 2012.
Cost of goods sold by Jintai for the three months ended September 30, 2012 was zero, comparing to $748,830 for fiscal year 2011, because Jintai’s had no operation during the past quarter as a result of ongoing relocation.
For three months ended September 30, 2012, cost of goods sold by Yuxing was $550,107, an increase of $484,875, or 743.3%, from $65,232 for the three months ended September 30, 2011. The increase was proportional to Yuxing’s sales for the three months ended September 30, 2012.
Gross Profit
Total gross profit for the three months ended September 30, 2012 decreased by $1,975,359, or 10.4%, to $16,933,373, as compared to $18,908,732 for the three months ended September 30, 2011. Gross profit margin was approximately 42.9% and 35.6% for the three months ended September 30, 2012 and 2011, respectively.
Gross profit generated by Jinong increased by $879,357, or 6.2%, to $15,011,478 for the three months ended September 30, 2012 from $14,132,121 for the three months ended September 30, 2011. Gross profit margin from Jinong’s sales was approximately 53.9% and 63.5% for the three months ended September 30, 2012 and 2011, respectively.
For the three months ended September 30, 2012, gross profit generated by Gufeng was $1,747,209, a decrease of $2,596,212, or 59.8%, from $4,343,421 for the three months ended September 30, 2011. Gross profit margin from Gufeng’s sales was approximately 16.0% and 14.7% for the three months ended September 30, 2012 and 2011, respectively.
| 7 |
Gross profit from Jintai was zero for the three months ended September 30, 2012 due to its relocation since March 1, 2012, as compared to $450,057 for the three months ended September 30, 2011. Gross profit margin from Jintai’s sales was approximately 37.5% for the three months ended September 30, 2011.
For the three months ended September 30, 2012, gross profit generated by Yuxing was $174,686, an increase of $191,553, from negative $16,867 with a gross profit margin of approximately 24.1% for the three months ended September 30, 2012.
Selling Expenses
Our selling expenses consisted primarily of salaries of sales personnel, advertising and promotion expenses, freight-out costs and related compensation. Selling expenses were $3,034,087, or 7.7%, of net sales for the three months ended September 30, 2012, as compared to $2,490,474, or 4.7% of net sales for the three months ended September 30, 2011, an increase of $543,613, or 21.8%. The selling expenses of Gufeng were $224,509, or 2.1% of Gufeng’s net sales for the three months ended September 30, 2012, as compared to $843,339, or 2.8% of Gufeng’s net sales for the three months ended September 30, 2011. The selling expenses of Jinong for the three months ended September 30, 2012 were $2,792,434, or 10.0% of Jinong’s net sales, as compared to selling expenses of $1,634,926, or 7.4% of Jinong’s net sales in fiscal year 2011. Most of this increase was due to Jinong’s expanded marketing efforts and the increase in shipping costs.
General and Administrative Expenses
General and administrative expenses consisted primarily of related salaries, rental expenses, business development, depreciation and travel expenses incurred by our general and administrative departments and legal and professional expenses including expenses incurred and accrued for certain litigations. General and administrative expenses were $2,875,942, or 7.3% of net sales, for the three months ended September 30, 2012, as compared to $3,138,695, or 5.9%, of net sales for the three months ended September 30 2011, a decrease of $263,678, or 8.4%. This decrease was primarily a result of the decrease of legal fees incurred in connection with certain litigations.
Total Other Income (Expenses)
Total other income (expense) consisted of income from subsidies received from the PRC government, interest income, interest expenses and bank charges. Total other expense for the three months ended September 30, 2012 was $311,960, as compared to total other income of $84,416 for the three months ended September 30, 2011, an increase in expense of $396,376. The increase was mainly attributable to the $385,792 interest expense from Gufeng’s outstanding short-term loans.
Income Taxes
Jinong is subject to a preferred tax rate of 15% as a result of its business being classified as a High-Tech project under the PRC Enterprise Income Tax Law (“EIT”) that became effective on January 1, 2008. Jinong incurred income tax expenses of $1,754,200 for the three months ended September 30, 2012, as compared to $2,463,511 for the three months ended September 30, 2011, a decrease of $709,311, or 28.8%, which was primarily due to Jinong’s decreased operating income.
Gufeng, subject to a tax rate of 25%, incurred income tax expenses of $95,784 for the three months ended September 30, 2012, as compared to $622,653 for the three months ended September 30, 2011, a decrease of $526,869, or 84.6%, which was primarily due to Gufeng’s decreased net sales.
Jintai has been exempt from paying income tax as its products fall into the tax exemption list set out in the EIT.
Yuxing has no income tax for the three months ended September 30, 2012 as a result of being exempted from paying income tax due to its products fall into the tax exemption list set out in the EIT, the same treatment as Jintai receives.
Net Income
Net income for the three months ended September 30, 2012 was $8,861,400, a decrease of $1,870,236, or 17.4%, compared to $10,731,636 for the three months ended September 30, 2011. The decrease was attributable to the decrease in gross profit, primarily Gufeng’s gross profit. Net income as a percentage of total net sales was approximately 22.4% and 20.2 % for the three months ended September 30, 2012 and 2011, respectively.
Discussion of Segment Profitability Measures
As of September 30, 2012, we were engaged in the following businesses: the production and sale of fertilizers through Jinong and Gufeng and the production and sale of high-quality agricultural products by Yuxing. For financial reporting purpose, our operations were organized into four main business segments based on locations and products: Jinong (fertilizer production), Gufeng (fertilizer production), Jintai (agricultural products production) and Yuxing (agricultural products production). Each of the segments has its own annual budget with regard to development, production and sales. Jintai is in process of combining with Yuxing.
| 8 |
Each of the four operating segments referenced above has separate and distinct general ledgers. The chief operating decision maker (“CODM”) makes decisions with respect to resources allocation and performance assessment upon receiving financial information, including revenue, gross margin, operating income and net income produced from the various general ledger systems; however, net income by segment is the principal benchmark to measure profit or loss adopted by the CODM.
For Jinong, the net income decreased 4.7% by $491,807 to $9,937,687 for the three month ended September 30, 2012 from $10,429,494 for the same period in 2011.
For Gufeng, the net income decreased 88.5% by $1,609,399 to $ 208,497 for the three months ended September 30, 2012 from $1,817,896 for the same period in 2011.
Jintai is located at the Economic and Technical Development Zone (the "Zone") in the metro area of the city of Xi'an. The Zone has been inhabited by a large and dense population and the periphery of Jintai has bristled with various industrial factories and utility plants in the latest years. The Zone’s concentrated industrial activities and dense population changed the micro bio environment for the growth of Jintai's agricultural products and disturbed Jintai’s normal fertilizer research and development. As of September 30, 2012, Jintai was still under the relocation process and there was no revenue from Jintai.
For Yuxing, the net income increased 36.6% by $14,762 to $55,093 for the three months ended September 30, 2012 from $40,331 for the same period in 2011.
Liquidity and Capital Resources
Our principal sources of liquidity include cash from operations, borrowings from local commercial banks and net proceeds of offerings of our securities consummated in July 2009 and November/December 2009 (collectively the “Public Offerings”).
As of September 30, 2012, cash and cash equivalents were $74,197,824, an increase of $2,219,194, or 3.1%, from $71,978,630 as of June 30, 2012.
We intend to use some of the remaining net proceeds from the Public Offerings, as well as other working capital if required, to acquire new businesses, upgrade production lines and complete Yuxing’s new greenhouse facilities for agriculture products located on 88 acres of land in Hu County, 18 kilometers southeast of Xi’an city. We believe that we have sufficient cash on hand and positive projected cash flow from operations to support our business growth for the next twelve months to the extent we do not have further significant acquisitions or expansions. However, if events or circumstances occur and we do not meet our operating plan as expected, we may be required to seek additional capital and/or to reduce certain discretionary spending, which could have a material adverse effect on our ability to achieve our business objectives. Notwithstanding the foregoing, we may seek additional financing as necessary for expansion purposes and when we believe market conditions are most advantageous, which may include additional debt and/or equity financings. There can be no assurance that any additional financing will be available on acceptable terms, if at all. Any equity financing may result in dilution to existing stockholders and any debt financing may include restrictive covenants.
The following table sets forth a summary of our cash flows for the periods indicated:
| Three months ended September 30, | ||||||||
| 2012 | 2011 | |||||||
| Net cash provided by (used in) operating activities | $ | 6,386,548 | $ | (2,008,969 | ) | |||
| Net cash used in investing activities | (4,592,810 | ) | (919,666 | ) | ||||
| Net cash provided by financing activities | 561,255 | 8,010,765 | ||||||
| Effect of exchange rate change on cash and cash equivalents | (135,799 | ) | 645,368 | |||||
| Net increase in cash and cash equivalents | 2,219,194 | 5,727,498 | ||||||
| Cash and cash equivalents, beginning balance | 71,978,630 | 65,606,413 | ||||||
| Cash and cash equivalents, ending balance | $ | 74,197,824 | $ | 71,333,911 | ||||
Operating Activities
Net cash provided by operating activities was $6,386,548 for the three months ended September 30, 2012, an increase of $8,395,517, or 418.0% from $2,008,969 which was used in operating activities for the same period in 2011. The increase was mainly attributable to the significantly decreased inventories by 99.0%, which contributed to the 143.9% cash flow increase comparing to the same period in 2011.
| 9 |
Investing Activities
Net cash used in investing activities for the three months ended September 30, 2012 was $4,592,810, an increase of $3,673,144, or 399.4% from $919,666 for the three months ended September 30, 2011. The increase was attributable to the purchases of plant, property and equipment, and increase in construction in progress.
Financing Activities
Net cash provided by financing activities in the three months ended September 30, 2012 and 2011 totaled $561,225 and $8,010,765, respectively, which was attributable to the loan proceeds.
As of September 30, 2012 and June 30, 2012, our loans payable were as follows:
| September 30, 2012 | June 30, 2012 | |||||||
| Short term loans payable: | $ | 14,466,150 | $ | 13,931,280 | ||||
| Total | $ | 14,466,150 | $ | 13,931,280 | ||||
Accounts Receivable
We had accounts receivable of $67,699,174 as of September 30, 2012, as compared to $62,001,158 as of June 30, 2012, an increase of $5,698,016 or 9.2%, which is mainly attributable to the implementation of 180 days credit policy. In order to respond to the cash flow shortage caused by the tightening financing encountered by some of our distributors, the company launched such a policy since the third quarter of fiscal year 2012 enabling such distributors take full advantage of the 180-day credit terms.
Allowance for doubtful accounts in account receivable for the three months ended September 30, 2012 was $977,433, an increase of $298,165, or 44% from $679,268 as of June 30, 2012. And the allowance for doubtful accounts as a percentage of accounts receivable was 1.4% for the three month ended September 30, 2012 and 1.1% as of June 30, 2012 respectively. The increase in the allowance of doubtful accounts were mainly due to the increase in the balance of accounts receivables and gradual aging in the balance of historical outstanding receivables.
Inventories
We had an inventory of $28,659,714 as of September 30, 2012, as compared to $28,602,684 as of June 30, 2012, an increase of $57,030, or 0.2%.
Advances to Suppliers
We had advances to suppliers of $14,985,197 as of September 30, 2012 as compared to $12,207,325 as of June 30, 2012, representing an increase of $2,777,872 or 22.8%. The increase in the amount of advances to suppliers is mainly due to Gufeng’s seasonal compound fertilizer business, which may result in carrying significant amounts of inventory and seasonal variations in working capital. To ensure our ability to deliver compound fertilizer to the distributor timely prior to the planting season, we need to have sufficient raw material in stock to feed the production. To build up the inventory, we typically make advance payment to the supplier to secure the supply of raw material of basic fertilizer. Our inventory level may fluctuate from time to time, depending how fast the raw material gets consumed and replenished during the production process, and how fast the finished goods get sold. The replenishment of raw material relies on the management’s estimate of numerous factors, including but not limited to, the raw material’s future price, and spot price along with their volatility, as well as the seasonal demand and future price of finished fertilizer products. Such estimate may not be accurate, and the purchase decision of raw materials based on the estimate can cause excessive inventories in slow sales and insufficient inventories in peak sales.
Accounts Payable
We had accounts payable of $5,594,344 as of September 30, 2012 as compared to $6,881,748 as of June 30, 2012, representing a decrease of $1,287,404, or 18.7%.
Unearned Revenue
We had unearned revenue of $2,452,464 as of September 30, 2012 as compared to $2,625,014 as of June 30, 2012, representing a decrease of $172,550, or 6.6%. The further decrease in unearned revenue is attributable to (i) the expanded credit sales to selected distributors since Jinong and Gufeng launched warehouse sales program, which is a customized strategy that requires less or few advanced deposit payment from the participating distributors which were selected based upon their overall business strength, credit worthiness and proven ability to develop local markets; (ii) the use of the 180-day credit policy. With offering participating distributors the advantageous sales credit in distributing the fertilizer products, the company concurrently manages more account receivables and less unearned revenue.
| 10 |
Tax Payable
We had taxes payable of $19,540,884 as of September 30, 2012 as compared to $17,675,389 as of June 30, 2012, representing an increase of $1,865,495, or 10.6%. This increase was mainly due to the increase in Jinong’s income tax, which resulted from Jinong’s increased revenue.
Off-Balance Sheet Arrangements
We do not have any off-balance sheet arrangements.
Critical Accounting Policies and Estimates
Management’s discussion and analysis of its financial condition and results of operations are based upon our consolidated financial statements, which have been prepared in accordance with United States generally accepted accounting principles. Our financial statements reflect the selection and application of accounting policies which require management to make significant estimates and judgments. See Note 2 to our consolidated financial statements, “Basis of Presentation and Summary of Significant Accounting Policies.” We believe that the following paragraphs reflect the more critical accounting policies that currently affect our financial condition and results of operations:
Use of estimates
The preparation of consolidated financial statements in conformity with accounting principles generally accepted in the United States of America requires management to make estimates and assumptions that affect the reported amounts of assets and liabilities and disclosure of contingent assets and liabilities at the date of the consolidated financial statements and the amount of revenues and expenses during the reporting periods. Management makes these estimates using the best information available at the time the estimates are made. However, actual results could differ materially from those estimates.
Revenue recognition
Sales revenue is recognized at the date of shipment to customers when a formal arrangement exists, the price is fixed or determinable, the delivery is completed, we have no other significant obligations and collectability is reasonably assured. Payments received before all of the relevant criteria for revenue recognition are satisfied are recorded as unearned revenue.
Our revenue consists of invoiced value of goods, net of a value-added tax (VAT). No product return or sales discount allowance is made as products delivered and accepted by customers are normally not returnable and sales discounts are normally not granted after products are delivered.
Cash and cash equivalents
For statement of cash flows purposes, we consider all cash on hand and in banks, certificates of deposit and other highly-liquid investments with maturities of three months or less, when purchased, to be cash and cash equivalents.
Accounts receivable
Our policy is to maintain reserves for potential credit losses on accounts receivable. Management reviews the composition of accounts receivable and analyzes historical bad debts, customer concentrations, customer credit worthiness, current economic trends and changes in customer payment patterns to evaluate the adequacy of these reserves. Any accounts receivable of Jinong and Gufeng that is outstanding for more than 180 days will be accounted as allowance for bad debts, and any accounts receivable of Yuxing that is outstanding for more than 90 days will be accounted as allowance for bad debts.
Segment reporting
FASB ASC 280, (previously SFAS No. 131, Segment Reporting) requires use of the “management approach” model for segment reporting. The management approach model is based on the way a company’s management organizes segments within the company for making operating decisions and assessing performance. Reportable segments are based on products and services, geography, legal structure, management structure, or any other manner in which management disaggregates a company.
As of September 30, 2012, we were organized into four main business segments: Jinong (fertilizer production), Gufeng (fertilizer production), Jintai (agricultural products production) and Yuxing (agricultural products production). Jintai is in process of combining with Yuxing.
| 11 |
Item 3. Quantitative and Qualitative Disclosures About Market Risk
Disclosures About Market Risk
We may be exposed to changes in financial market conditions in the normal course of business. Market risk generally represents the risk that losses may occur as a result of movements in interest rates and equity prices. We currently do not use financial instruments in the normal course of business that are subject to changes in financial market conditions.
Currency Fluctuations and Foreign Currency Risk
Substantially all of our revenues and expenses are denominated in RMB. However, we use the U.S. dollar for financial reporting purposes. Conversion of RMB into foreign currencies is regulated by the People’s Bank of China through a unified floating exchange rate system. Although the PRC government has stated its intention to support the value of RMB, there can be no assurance that such exchange rate will not again become volatile or that RMB will not devalue significantly against the U.S. dollar. Exchange rate fluctuations may adversely affect the value, in U.S. dollar terms, of our net assets and income derived from our operations in the PRC.
Our reporting currency is the U.S. dollar. Except for the U.S. holding companies, all of our consolidated revenues, consolidated costs and expenses, and our assets are denominated in RMB. As a result, we are exposed to foreign exchange risk as our revenues and results of operations may be affected by fluctuations in the exchange rate between U.S. dollars and RMB. If the RMB depreciates against the U.S. dollar, the value of our RMB revenues, earnings and assets as expressed in our U.S. dollar financial statements will decline. Assets and liabilities are translated at exchange rates at the balance sheet dates and revenue and expenses are translated at the average exchange rates and shareholders’ equity is translated at historical exchange rates. Any resulting translation adjustments are not included in determining net income but are included in determining other comprehensive income, a component of shareholders’ equity. As of September 30, 2012, our accumulated other comprehensive income was $15.3 million. We have not entered into any hedging transactions in an effort to reduce our exposure to foreign exchange risk. The value of the Renminbi against the U.S. dollar and other currencies is affected by, among other things, changes in China’s political and economic conditions. Since July 2005, the Renminbi has not been pegged to the U.S. dollar. Although the People’s Bank of China regularly intervenes in the foreign exchange market to prevent significant short-term fluctuations in the exchange rate, the Renminbi may appreciate or depreciate significantly in value against the U.S. dollar in the medium to long term. Moreover, it is possible that in the future, PRC authorities may lift restrictions on fluctuations in the Renminbi exchange rate and lessen intervention in the foreign exchange market.
Interest Rate Risk
We deposit surplus funds with Chinese banks earning daily interest. We do not invest in any instruments for trading purposes. All of our outstanding debt instruments carry fixed rates of interests. The amount of short-term debt outstanding as of September 30, 2012 and June 30, 2012 was $14.5 million and $13.9 million, respectively. We are exposed to interest rate risk primarily with respect to our short-term bank loans. Although the interest rates, which are based on the banks’ prime rates with respect to our short-term loans are fixed for the terms of the loans, the terms are typically three to twelve months for short-term bank loans and interest rates are subject to change upon renewal. There were no material changes in interest rates for short-term bank loans renewed during the three months ended September 30, 2012. The original loan term on average is one year, and the remaining average life of the short term-loans is approximately eight months.
| 12 |
Management monitors the banks’ prime rates in conjunction with our cash requirements to determine the appropriate level of debt balances relative to other sources of funds. We have not entered into any hedging transactions in an effort to reduce our exposure to interest rate risk.
Credit Risk
We have not experienced significant credit risk, as most of our customers are long-term customers with superior payment records. Our receivables are monitored regularly by our credit managers.
Inflation Risk
Inflationary factors such as increases in the cost of our products and overhead costs may adversely affect our operating results. Although we do not believe that inflation has had a material impact on our financial position or results of operations to date, a high rate of inflation in the future may have an adverse effect on our ability to maintain current levels of gross margin and selling, general and administrative expenses as a percentage of net revenues if the selling prices of our products do not increase with these increased costs.
Item 4. Controls and Procedures
(a) Evaluation of disclosure controls and procedures.
At the conclusion of the period ended September 30, 2012 we carried out an evaluation, under the supervision and with the participation of our management, including our Chief Executive Officer and Chief Financial Officer, of the effectiveness of the design and operation of our disclosure controls and procedures (as such term is defined in Rules 13a-15(e) and 15d-15(e) under the Securities Exchange Act of 1934 (the “Exchange Act”)). Based upon that evaluation, our Chief Executive Officer and Chief Financial Officer concluded that as of the end of the period covered by this report, our disclosure controls and procedures were effective and adequately designed to ensure that the information required to be disclosed by us in the reports we submit under the Exchange Act is recorded, processed, summarized and reported within the time periods specified in the applicable rules and forms and that such information was accumulated and communicated to our Chief Executive Officer and Chief Financial Officer, in a manner that allowed for timely decisions regarding required disclosure.
(b) Changes in internal controls.
There were no changes in our internal control over financial reporting identified in connection with the evaluation required by paragraph (d) of Exchange Act Rules 13a-15 or 15d-15 that occurred during our last fiscal quarter that have materially affected, or are reasonably likely to materially affect, our internal control over financial reporting.
| 13 |
PART II OTHER INFORMATION
Item 1. Legal Proceedings
On October 15, 2010, a class action lawsuit was filed against us and certain of our current and former officers in the United States District Court for the District of Nevada (the "Nevada Federal Court") on behalf of purchasers of our common stock between November 12, 2009 and September 1, 2010. On April 27, 2011, the court appointed the lead plaintiff and lead plaintiff’s counsel. On June 13, 2011, lead plaintiff filed an amended complaint, which adds several additional defendants and expands the class period to include purchasers who purchased our common stock between May 12, 2009 and January 4, 2011. The amended complaint alleges that we and certain of our current and former officers and directors violated Sections 10(b) and 20(a) of the Securities Exchange Act of 1934 and Sections 11, 12(a)(2), and 15 of the Securities Act of 1933, as amended, by making material misstatements and omissions in our financial statements, securities offering documents, and related disclosures during the class period. The plaintiffs claim that such allegedly misleading statements inflated the price of our common stock and seek monetary damages in an amount to be determined at trial. Defendant’s motions were argued on October 2, 2012. On November 2, 2012, the Nevada Federal Court issued a decision dismissing the claims for violation of sections 11, 12(a)(2) and 15 of the Securities Act of 1933 as to all defendants and dismissing certain individual defendants from the complaint and allowing the claims for violations of section 10(b) and 20(a) of the Securities Exchange Act of 1934 to continue with respect to the Company and certain of the individual defendants.
Item 2. Unregistered Sales of Equity Securities and Use of Proceeds
On November 19, 2012, the Company issued 151,515 shares of common stock at the price of $3.30 per share to Mr. Tao Li, the Company’s Chairman and Chief Executive Officer in the first offering of the Company’s Employee Stock Purchase Plan (“ESPP”) adopted by the Company’s Board of Directors (the “Board”) on August 9, 2012 which was later amended and restated by the Board on October 19, 2012 to clarify certain expression under Sections 6 & 7 of the ESPP. A copy of the Company’s 2012 Amended and Restated Employee Stock Purchase Plan is filed hereto as Exhibit 10.1. The issuance was in reliance upon the exemption from registration afforded by Regulation S under the Securities Act of 1933, as amended.
Item 5. Other Information
The description under Item 2 of Part II of this report is incorporated herein by reference.
Item 6. Exhibits
The exhibits required by this item are set forth in the Exhibit Index attached hereto.
| 14 |
SIGNATURES
Pursuant to the requirements of the Securities Act of 1934, the Registrant has duly caused this report to be signed on its behalf by the undersigned thereunto duly authorized.
| CHINA GREEN AGRICULTURE, INC. | ||
| Date: November 19, 2012 | By: | /s/ Tao Li |
| Name: Tao Li Title: President and Chief Executive Officer (principal executive officer) | ||
| Date: November 19, 2012 | By: | /s/ Ken Ren |
| Name: Ken Ren Title: Chief Financial Officer (principal financial officer and principal accounting officer) | ||
| 15 |
EXHIBIT INDEX
| No. | Description |
| 10.1 | 2012 Amended and Restated Employee Stock Purchase Plan. |
| 31.1 | Certification of Chief Executive Officer pursuant to Section 302 of the Sarbanes-Oxley Act of 2002. |
| 31.2 | Certification of Chief Financial Officer pursuant to Section 302 of the Sarbanes-Oxley Act of 2002. |
| 32.1 | Certification of Chief Executive Officer pursuant to Section 906 of the Sarbanes-Oxley Act of 2002. |
| 32.2 | Certification of Chief Financial Officer pursuant to Section 906 of the Sarbanes-Oxley Act of 2002. |
101.INS* – XBRL Instance Document
101.SCH* – XBRL Taxonomy Extension Schema Document
101.CAL* – XBRL Taxonomy Extension Calculation Linkbase Document
101.DEF* – XBRL Taxonomy Extension Definition Linkbase Document
101.LAB* – XBRL Taxonomy Extension Label Linkbase Document
101.PRE* – XBRL Taxonomy Extension Presentation Linkbase Document
___________________________
* Furnished and not filed or a part of a registration statement or prospectus for purposes of Sections 11 or 12 of the Securities Act of 1933, as amended, deemed not filed for purposes of Section 18 of the Securities Exchange Act of 1934, as amended, and otherwise not subject to liability under these sections.
| 16 |