Attached files
| file | filename |
|---|---|
| 8-K - FORM 8-K - CENTERLINE HOLDING CO | v328822_8k.htm |
| EX-99.1 - EXHIBIT 99.1 - CENTERLINE HOLDING CO | v328822_ex99-1.htm |
Centerline Holding Company Financial Overview 3Q12 | September 30, 2012
CENTERLINE CAPITAL GROUP Table of Contents Centerline Corporate Overview pg 3 Equity Ownership Summary pg 6 Supplemental Financial Information pg 8 Glossary pg 21 Corporate Office 100 Church Street, 15 th Floor New York, NY 10007 Phone: 212 - 317 - 5700 Fax: 212 - 588 - 2010 www.centerline.com OTC Symbol: CLNH Investor Contacts Michael Larsen Chief Financial Officer and Treasurer 212 - 317 - 5727 Denise Bernstein Investor Relations 212 - 521 - 6451 This presentation contains forward - looking statements about Centerline Holding Company. Certain statements in this document may constitute forward - looking statements within the meaning of the "safe harbor" provisions of the Private Securities Litigation Reform Act of 1995. Except for historical information, the matters discussed in this presentation are forward - looking statements subject to certain risks and uncertainties. These statements are based on management's current expectations and beliefs and are subject to a number of factors and uncertainties that could cause actual results to differ materially from those described in the forward - looking statements. These risks and uncertainties are detailed in Centerline Holding Company's most recent Annual Report on Form 10 - K filed with the Securities and Exchange Commission, and include, among others, business limitations caused by adverse changes in real estate and credit markets and general economic and business conditions; our ability to generate new income sources, raise capital for investment funds and maintain business relationships with providers and users of capital; changes in applicable laws and regulations; our tax treatment, the tax treatment of our subsidiaries and the tax treatment of our investments; risk of allocations of income to our shareholders without corresponding cash distributions; possible adverse effects of a future issuance of shares or a reverse share split; possible deterioration in cash flows generated by material investments, such as the Freddie Mac B - Certificate; competition with other companies; risk of loss under mortgage banking loss sharing agreements; and risks associated with providing credit intermediation. Words such as "anticipates", "expects", "intends", "plans", "believes", "seeks", "estimates" and similar expressions are intended to identify forward - looking statements. Such forward - looking statements speak only as of the date of this document. Centerline Holding Company expressly disclaims any obligation or undertaking to release publicly any updates or revisions to any forward - looking statements contained herein to reflect any change in Centerline Holding Company's expectations with regard thereto or change in events, conditions, or circumstances on which any such statement is based.
CENTERLINE CAPITAL GROUP Centerline Corporate Overview

4 Corporate Overview Centerline Capital Group (“Centerline”), a subsidiary of Centerline Holding Company (OTC:CLNH), provides real estate financing and asset management services, focused on affordable and conventional multifamily housing. We offer a range of debt financing, equity investment products, and asset management services to developers, owners and investors. Our core businesses include: • Low - Income Housing Tax Credit (“LIHTC”) syndication, fund management, and asset management • Affordable and conventional multifamily lending, primarily as a Fannie Mae DUS lender, Freddie Mac seller - servicer, and FHA - approved mortgage provider, and Ginnie Mae seller services Centerline, or its predecessor companies, has been in continuous operation since 1972. Affordable Housing Equity and Asset Management • Centerline has been a leader in the affordable housing industry since creation of the LIHTC program in 1986. We have raised over $10.0 billion i n equity from institutional and retail investors as a sponsor of 137 public and private real estate investment funds. • Today, we manage $9.2 billion of investor equity within 115 funds. • Centerline is invested in approximately 1,200 affordable multifamily rental assets in 45 U.S. states. Mortgage Banking and Affordable Housing Debt • We started in the agency mortgage loan industry in 1988; our current agency mortgage loan portfolio stands at about $11.5 billion. • Since 1988 we have originated over $8 billion in Fannie Mae loans, and we have originated over $2.7 billion in Freddie Mac loans since 1996.
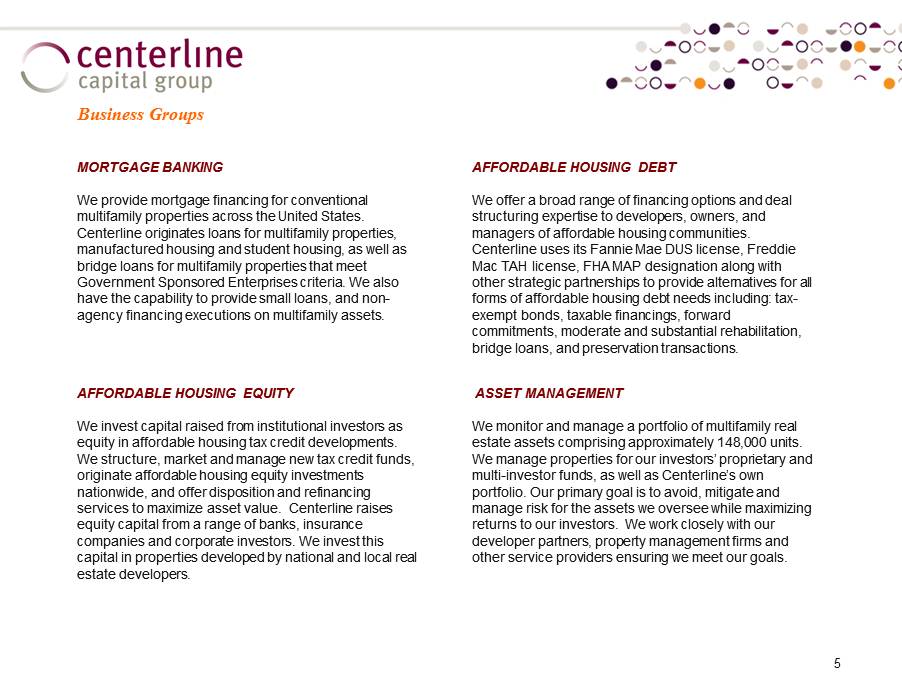
MORTGAGE BANKING We provide mortgage financing for conventional multifamily properties across the United States. Centerline originates loans for multifamily properties, manufactured housing and student housing, as well as bridge loans for multifamily properties that meet Government Sponsored Enterprises criteria . We also have the capability to provide small loans, and non - agency financing executions on multifamily assets. ASSET MANAGEMENT We monitor and manage a portfolio of multifamily real estate assets comprising approximately 148,000 units. We manage properties for our investors’ proprietary and multi - investor funds, as well as Centerline’s own portfolio. Our primary goal is to avoid, mitigate and manage risk for the assets we oversee while maximizing returns to our investors. We work closely with our developer partners, property management firms and other service providers ensuring we meet our goals. 5 Business Groups AFFORDABLE HOUSING DEBT We offer a broad range of financing options and deal structuring expertise to developers, owners, and managers of affordable housing communities. Centerline uses its Fannie Mae DUS license, Freddie Mac TAH license, FHA MAP designation along with other strategic partnerships to provide alternatives for all forms of affordable housing debt needs including: tax - exempt bonds, taxable financings, forward commitments, moderate and substantial rehabilitation, bridge loans, and preservation transactions. AFFORDABLE HOUSING EQUITY We invest capital raised from institutional investors as equity in affordable housing tax credit developments. We structure, market and manage new tax credit funds, originate affordable housing equity investments nationwide, and offer disposition and refinancing services to maximize asset value. Centerline raises equity capital from a range of banks, insurance companies and corporate investors. We invest this capital in properties developed by national and local real estate developers.
CENTERLINE CAPITAL GROUP Equity Ownership Summary
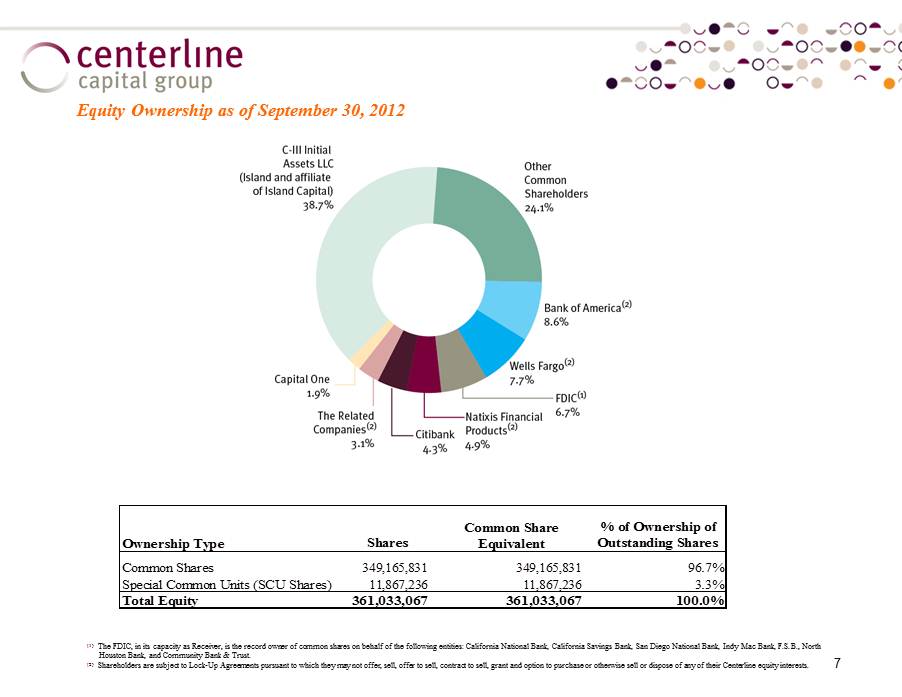
7 Equity Ownership as of September 30, 2012 ( 1 ) The FDIC, in its capacity as Receiver, is the record owner of common shares on behalf of the following entities : California National Bank, California Savings Bank, San Diego National Bank, Indy Mac Bank, F . S . B . , North Houston Bank, and Community Bank & Trust . ( 2 ) Shareholders are subject to Lock - Up Agreements pursuant to which they may not offer, sell, offer to sell, contract to sell, grant and option to purchase or otherwise sell or dispose of any of their Centerline equity interests . Ownership Type Shares % of Ownership of Outstanding Shares Common Shares 349,165,831 349,165,831 96.7% Special Common Units (SCU Shares) 11,867,236 11,867,236 3.3% Total Equity 361,033,067 361,033,067 100.0% Common Share Equivalent

CENTERLINE CAPITAL GROUP Supplemental Financial Statements The accompanying “As Adjusted” balance sheets and statements of operations are not in accordance with GAAP, are presented for the purpose of enhancing the understanding of the economics of our business, and may not be comparable to figures reported by other companies.
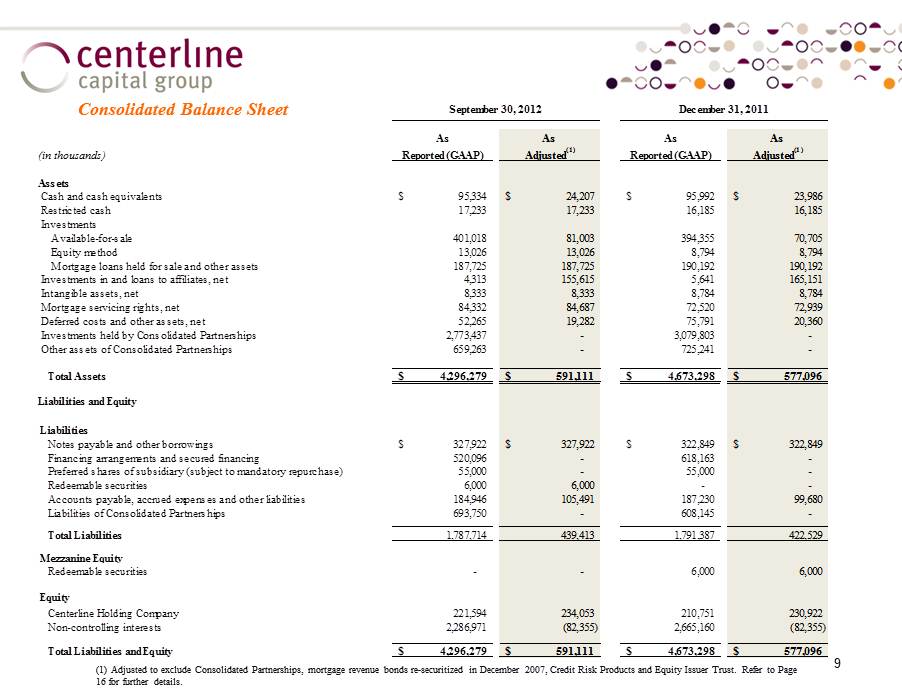
9 Consolidated Balance Sheet (1) Adjusted to exclude Consolidated Partnerships, mortgage revenue bonds re - securitized in December 2007, Credit Risk Products and Equity Issuer Trust. Refer to Page 16 for further details. As As As As (in thousands) Reported (GAAP) Adjusted (1) Reported (GAAP) Adjusted (1) Assets Cash and cash equivalents 95,334$ 24,207$ 95,992$ 23,986$ Restricted cash 17,233 17,233 16,185 16,185 Investments Available-for-sale 401,018 81,003 394,355 70,705 Equity method 13,026 13,026 8,794 8,794 Mortgage loans held for sale and other assets 187,725 187,725 190,192 190,192 Investments in and loans to affiliates, net 4,313 155,615 5,641 165,151 Intangible assets, net 8,333 8,333 8,784 8,784 Mortgage servicing rights, net 84,332 84,687 72,520 72,939 Deferred costs and other assets, net 52,265 19,282 75,791 20,360 Investments held by Consolidated Partnerships 2,773,437 - 3,079,803 - Other assets of Consolidated Partnerships 659,263 - 725,241 - Total Assets 4,296,279$ 591,111$ 4,673,298$ 577,096$ Liabilities and Equity Liabilities Notes payable and other borrowings 327,922$ 327,922$ 322,849$ 322,849$ Financing arrangements and secured financing 520,096 - 618,163 - Preferred shares of subsidiary (subject to mandatory repurchase) 55,000 - 55,000 - Redeemable securities 6,000 6,000 - - Accounts payable, accrued expenses and other liabilities 184,946 105,491 187,230 99,680 Liabilities of Consolidated Partnerships 693,750 - 608,145 - Total Liabilities 1,787,714 439,413 1,791,387 422,529 Mezzanine Equity Redeemable securities - - 6,000 6,000 Equity Centerline Holding Company 221,594 234,053 210,751 230,922 Non-controlling interests 2,286,971 (82,355) 2,665,160 (82,355) Total Liabilities and Equity 4,296,279$ 591,111$ 4,673,298$ 577,096$ September 30, 2012 December 31, 2011
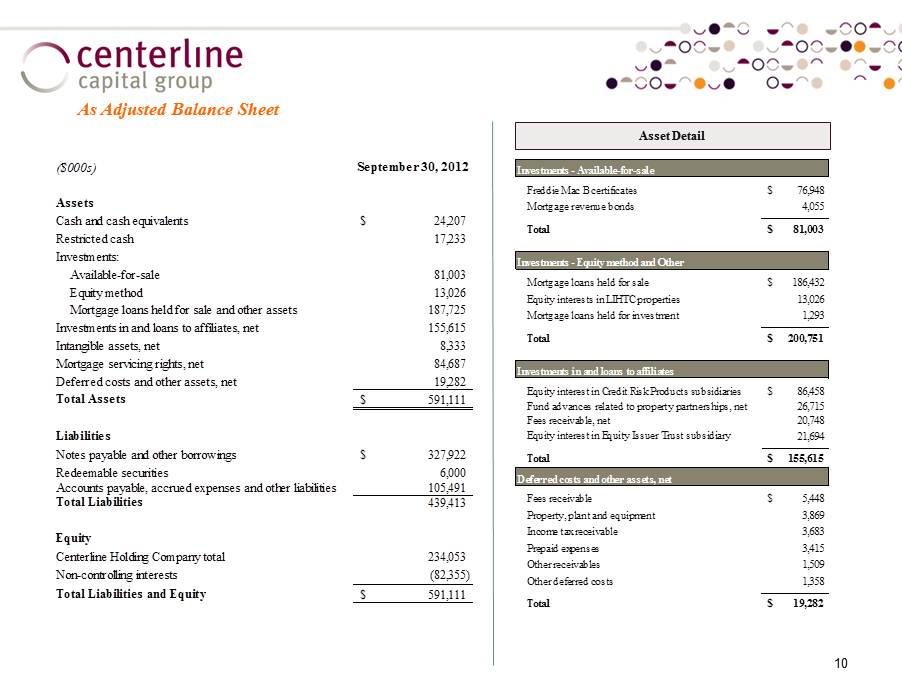
10 As Adjusted Balance Sheet Asset Detail ($000s) September 30, 2012 Assets Cash and cash equivalents 24,207$ Restricted cash 17,233 Investments: Available-for-sale 81,003 Equity method 13,026 Mortgage loans held for sale and other assets 187,725 Investments in and loans to affiliates, net 155,615 Intangible assets, net 8,333 Mortgage servicing rights, net 84,687 Deferred costs and other assets, net 19,282 Total Assets 591,111$ Liabilities Notes payable and other borrowings 327,922$ Redeemable securities 6,000 Accounts payable, accrued expenses and other liabilities 105,491 Total Liabilities 439,413 Equity Centerline Holding Company total 234,053 Non-controlling interests (82,355) Total Liabilities and Equity 591,111$ Investments - Available-for-sale Freddie Mac B certificates 76,948$ Mortgage revenue bonds 4,055 Total 81,003$ Investments - Equity method and Other Mortgage loans held for sale 186,432$ Equity interests in LIHTC properties 13,026 Mortgage loans held for investment 1,293 Total 200,751$ Investments in and loans to affiliates Equity interest in Credit Risk Products subsidiaries 86,458$ Fund advances related to property partnerships, net 26,715 Fees receivable, net 20,748 Equity interest in Equity Issuer Trust subsidiary 21,694 Total 155,615$ Deferred costs and other assets, net Fees receivable 5,448$ Property, plant and equipment 3,869 Income tax receivable 3,683 Prepaid expenses 3,415 Other receivables 1,509 Other deferred costs 1,358 Total 19,282$
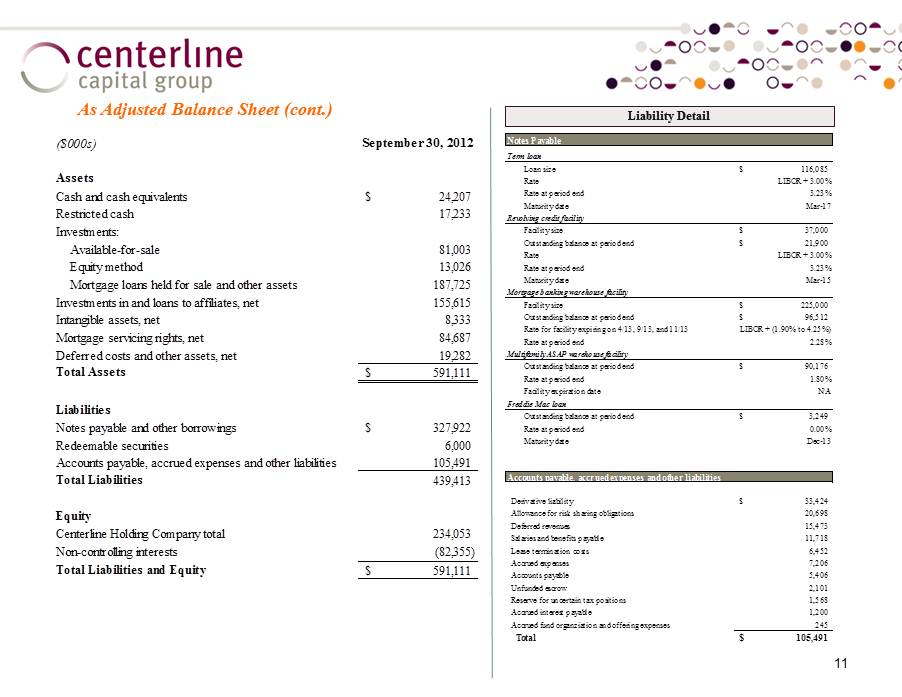
11 As Adjusted Balance Sheet (cont.) Liability Detail Notes Payable Term loan Loan size 116,085$ Rate LIBOR + 3.00% Rate at period end 3.23% Maturity date Mar-17 Revolving credit facility Facility size 37,000$ Outstanding balance at period end 21,900$ Rate LIBOR + 3.00% Rate at period end 3.23% Maturity date Mar-15 Mortgage banking warehouse facility Facility size 225,000$ Outstanding balance at period end 96,512$ Rate for facility expiring on 4/13, 9/13, and 11/13 LIBOR + (1.90% to 4.25%) Rate at period end 2.28% Multifamily ASAP warehouse facility Outstanding balance at period end 90,176$ Rate at period end 1.80% Facility expiration date N/A Freddie Mac loan Outstanding balance at period end 3,249$ Rate at period end 0.00% Maturity date Dec-13 Accounts payable, accrued expenses and other liabilities Derivative liability 33,424$ Allowance for risk sharing obligations 20,698 Deferred revenues 15,473 Salaries and benefits payable 11,718 Lease termination costs 6,452 Accrued expenses 7,206 Accounts payable 5,406 Unfunded escrow 2,101 Reserve for uncertain tax positions 1,568 Accrued interest payable 1,200 Accrued fund organziation and offering expenses 245 Total 105,491$ ($000s) September 30, 2012 Assets Cash and cash equivalents 24,207$ Restricted cash 17,233 Investments: Available-for-sale 81,003 Equity method 13,026 Mortgage loans held for sale and other assets 187,725 Investments in and loans to affiliates, net 155,615 Intangible assets, net 8,333 Mortgage servicing rights, net 84,687 Deferred costs and other assets, net 19,282 Total Assets 591,111$ Liabilities Notes payable and other borrowings 327,922$ Redeemable securities 6,000 Accounts payable, accrued expenses and other liabilities 105,491 Total Liabilities 439,413 Equity Centerline Holding Company total 234,053 Non-controlling interests (82,355) Total Liabilities and Equity 591,111$

12 Consolidated Statement of Operations (3Q12) (1) Adjusted to exclude Consolidated Partnerships, mortgage revenue bonds re - securitized in December 2007, Credit Risk Products and Equity Issuer Trust. (2) Includes prepayment penalties, expense reimbursements, gains on sales of mortgage loans and other revenues. (in thousands, except per share data) As As As As Reported (GAAP) Adjusted (1) Reported (GAAP) Adjusted (1) Revenues: Interest income 11,072$ 7,669$ 9,955$ 6,174$ Fee Income 9,757 13,990 8,379 13,697 Other revenues (2) 16,034 17,914 7,791 9,791 Revenues of Consolidated Partnerships 26,809 - 26,539 - Total revenues 63,672 39,573 52,664 29,662 Expenses: General and administrative: Salaries and benefits 12,614 12,614 12,987 12,997 Other 10,853 12,134 12,994 11,240 Total general and administrative expenses 23,467 24,748 25,981 24,237 Provision (recovery) for losses, net 14,738 2,041 (39,644) 961 Total Interest Expenses 14,967 5,258 22,559 12,275 Depreciation and amortization 3,696 3,548 3,712 3,557 Interest and other expenses of Consolidated Partnerships 101,921 - 50,522 - Total expenses 158,789 35,595 63,130 41,030 (Loss) income before other income (95,117) 3,978 (10,466) (11,368) Equity and other income (loss) 55 (9,652) - 36,600 Gain on settlement of liability 493 493 - - Gain from repayment or sale of investments 598 598 132 (19) Other loss from Consolidated Partnerships (56,684) - (53,798) - (Loss) income from continuing operations before income taxes (150,655) (4,583) (64,132) 25,213 Income tax provision - continuing operations 652 652 87 86 Net (loss) from continuing operations (150,003) (3,931) (64,045) 25,299 Net loss attributable to non-controlling interests 144,240 - 87,860 - Net (loss) income attributable to Centerline Holding Company shareholders (5,763) (3,931) 23,815 25,299 Net loss per share: Basic and Diluted (Loss) income from continuing operations (0.02)$ (0.01)$ 0.07$ 0.07$ Weighted average shares outstanding: Basic and Diluted 349,166 349,166 349,166 349,166 Three Months Ended September 30, 2012 2011
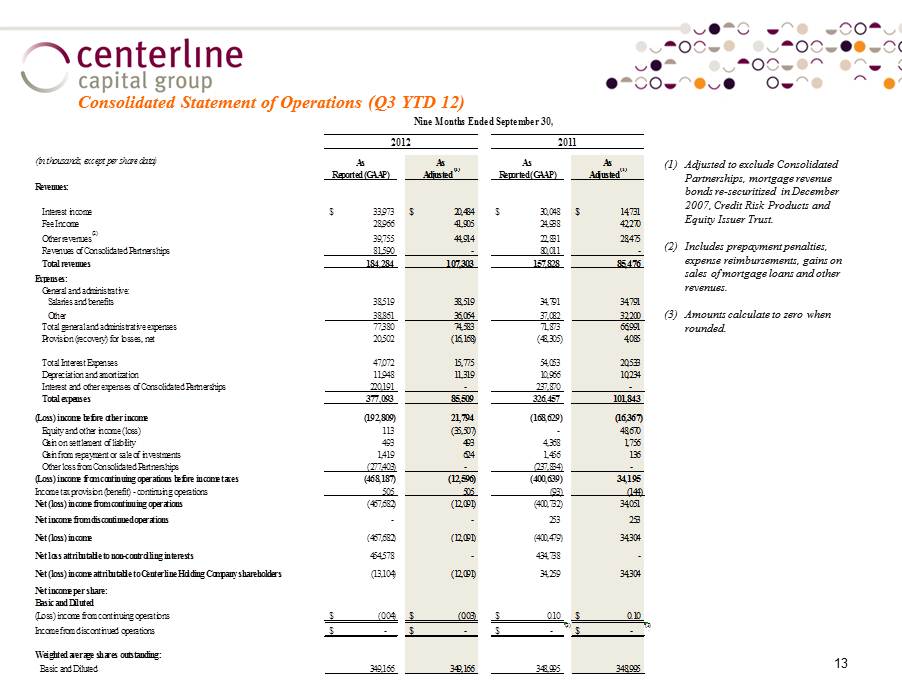
13 Consolidated Statement of Operations (Q3 YTD 12) (1) Adjusted to exclude Consolidated Partnerships, mortgage revenue bonds re - securitized in December 2007, Credit Risk Products and Equity Issuer Trust. (2) Includes prepayment penalties, expense reimbursements, gains on sales of mortgage loans and other revenues. (3) Amounts calculate to zero when rounded. (in thousands, except per share data) As As As As Reported (GAAP) Adjusted (1) Reported (GAAP) Adjusted (1) Revenues: Interest income 33,973$ 20,484$ 30,048$ 14,731$ Fee Income 28,966 41,905 24,938 42,270 Other revenues (2) 39,755 44,914 22,831 28,475 Revenues of Consolidated Partnerships 81,590 - 80,011 - Total revenues 184,284 107,303 157,828 85,476 Expenses: General and administrative: Salaries and benefits 38,519 38,519 34,791 34,791 Other 38,861 36,064 37,082 32,200 Total general and administrative expenses 77,380 74,583 71,873 66,991 Provision (recovery) for losses, net 20,502 (16,168) (48,305) 4,085 Total Interest Expenses 47,072 15,775 54,053 20,533 Depreciation and amortization 11,948 11,319 10,966 10,234 Interest and other expenses of Consolidated Partnerships 220,191 - 237,870 - Total expenses 377,093 85,509 326,457 101,843 (Loss) income before other income (192,809) 21,794 (168,629) (16,367) Equity and other income (loss) 113 (35,507) - 48,670 Gain on settlement of liability 493 493 4,368 1,756 Gain from repayment or sale of investments 1,419 624 1,456 136 Other loss from Consolidated Partnerships (277,403) - (237,834) - (Loss) income from continuing operations before income taxes (468,187) (12,596) (400,639) 34,195 Income tax provision (benefit) - continuing operations 505 505 (93) (144) Net (loss) income from continuing operations (467,682) (12,091) (400,732) 34,051 Net income from discontinued operations - - 253 253 Net (loss) income (467,682) (12,091) (400,479) 34,304 Net loss attributable to non-controlling interests 454,578 - 434,738 - Net (loss) income attributable to Centerline Holding Company shareholders (13,104) (12,091) 34,259 34,304 Net income per share: Basic and Diluted (Loss) income from continuing operations (0.04)$ (0.03)$ 0.10$ 0.10$ Income from discontinued operations -$ -$ -$ (3) -$ (3) (4) (4) Weighted average shares outstanding: Basic and Diluted 349,166 349,166 348,995 348,995 Nine Months Ended September 30, 2012 2011
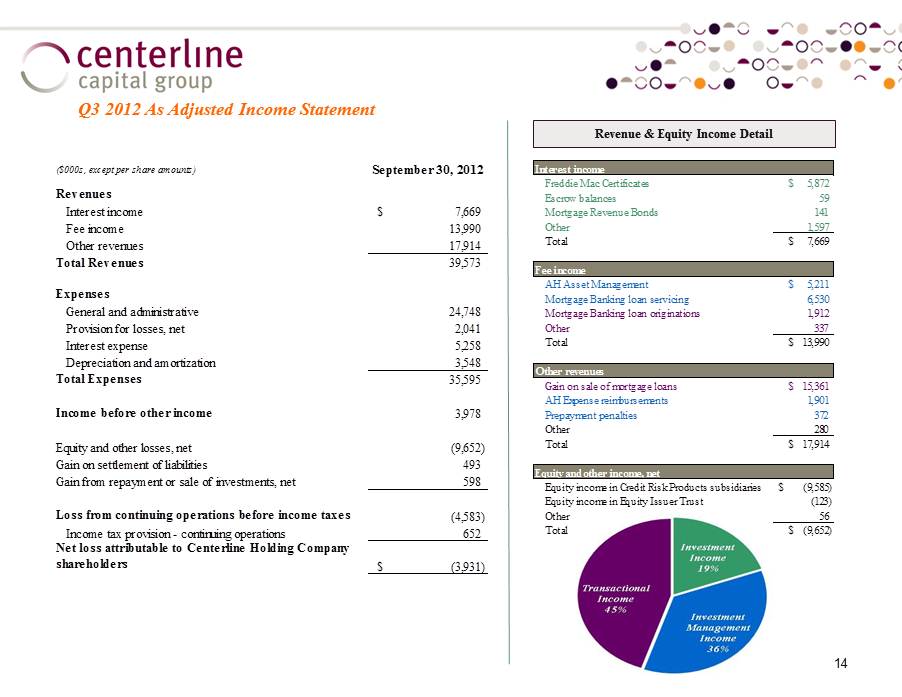
14 Q3 2012 As Adjusted Income Statement Revenue & Equity Income Detail Interest income Freddie Mac Certificates 5,872$ Escrow balances 59 Mortgage Revenue Bonds 141 Other 1,597 Total 7,669$ Fee income AH Asset Management 5,211$ Mortgage Banking loan servicing 6,530 Mortgage Banking loan originations 1,912 Other 337 Total 13,990$ Other revenues Gain on sale of mortgage loans 15,361$ AH Expense reimbursements 1,901 Prepayment penalties 372 Other 280 Total 17,914$ Equity and other income, net Equity income in Credit Risk Products subsidiaries (9,585)$ Equity income in Equity Issuer Trust (123) Other 56 Total (9,652)$ ($000s, except per share amounts) September 30, 2012 Revenues Interest income 7,669$ Fee income 13,990 Other revenues 17,914 Total Revenues 39,573 Expenses General and administrative 24,748 Provision for losses, net 2,041 Interest expense 5,258 Depreciation and amortization 3,548 Total Expenses 35,595 Income before other income 3,978 Equity and other losses, net (9,652) Gain on settlement of liabilities 493 Gain from repayment or sale of investments, net 598 Loss from continuing operations before income taxes (4,583) Income tax provision - continuing operations 652 Net loss attributable to Centerline Holding Company shareholders (3,931)$
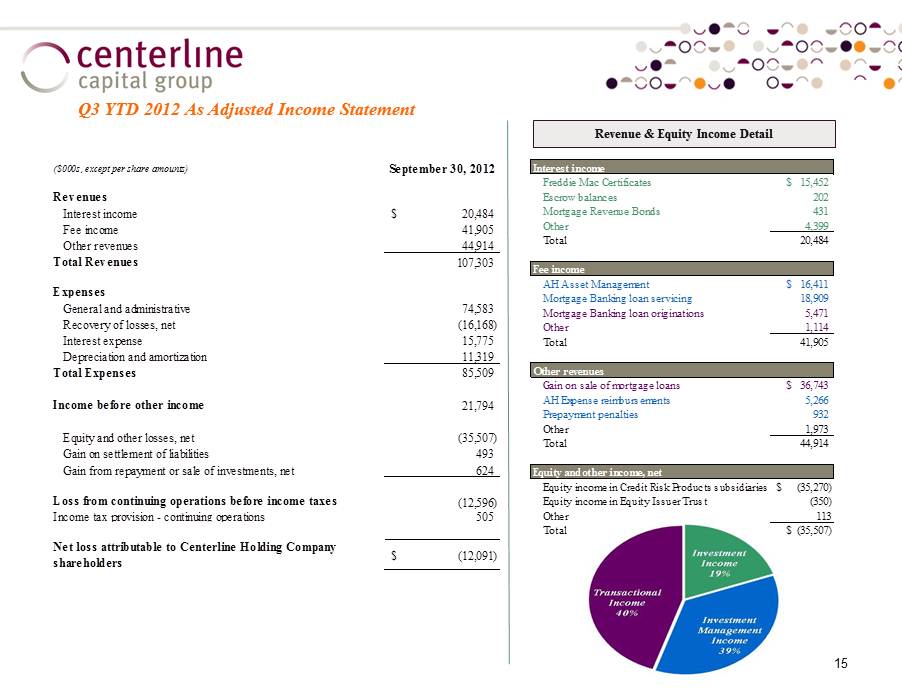
15 Q3 YTD 2012 As Adjusted Income Statement Revenue & Equity Income Detail Interest income Freddie Mac Certificates 15,452$ Escrow balances 202 Mortgage Revenue Bonds 431 Other 4,399 Total 20,484 Fee income AH Asset Management 16,411$ Mortgage Banking loan servicing 18,909 Mortgage Banking loan originations 5,471 Other 1,114 Total 41,905 Other revenues Gain on sale of mortgage loans 36,743$ AH Expense reimbursements 5,266 Prepayment penalties 932 Other 1,973 Total 44,914 Equity and other income, net Equity income in Credit Risk Products subsidiaries (35,270)$ Equity income in Equity Issuer Trust (350) Other 113 Total (35,507)$ ($000s, except per share amounts) September 30, 2012 Revenues Interest income 20,484$ Fee income 41,905 Other revenues 44,914 Total Revenues 107,303 Expenses General and administrative 74,583 Recovery of losses, net (16,168) Interest expense 15,775 Depreciation and amortization 11,319 Total Expenses 85,509 Income before other income 21,794 Equity and other losses, net (35,507) Gain on settlement of liabilities 493 Gain from repayment or sale of investments, net 624 Loss from continuing operations before income taxes (12,596) Income tax provision - continuing operations 505 Net loss attributable to Centerline Holding Company shareholders (12,091)$
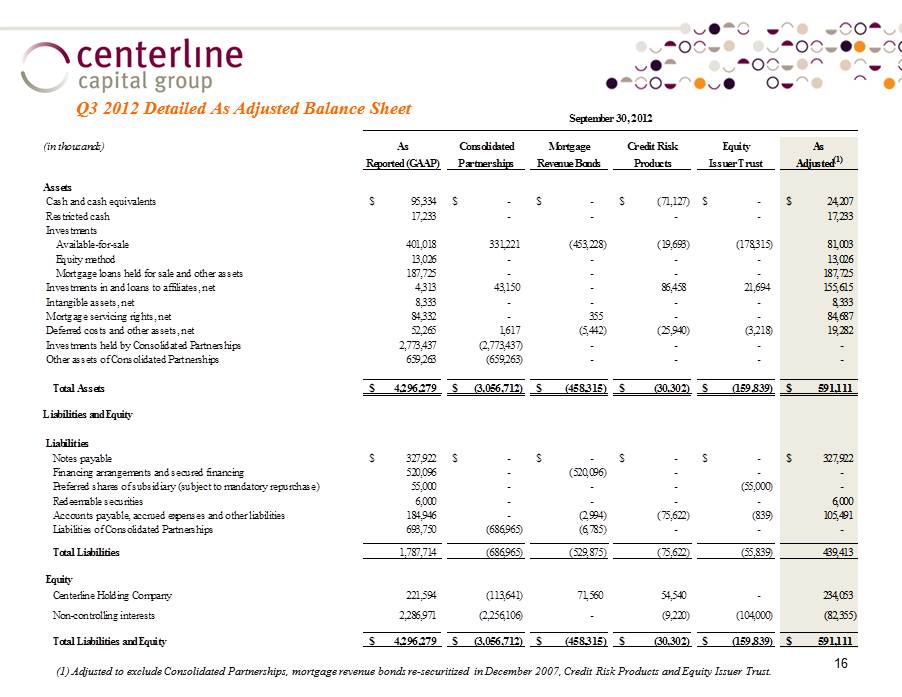
16 Q3 2012 Detailed As Adjusted Balance Sheet (1) Adjusted to exclude Consolidated Partnerships, mortgage revenue bonds re - securitized in December 2007, Credit Risk Products and Equity Issuer Trust. (in thousands) As Consolidated Mortgage Credit Risk Equity As Reported (GAAP) Partnerships Revenue Bonds Products Issuer Trust Adjusted (1) Assets Cash and cash equivalents 95,334$ -$ -$ (71,127)$ -$ 24,207$ Restricted cash 17,233 - - - - 17,233 Investments Available-for-sale 401,018 331,221 (453,228) (19,693) (178,315) 81,003 Equity method 13,026 - - - - 13,026 Mortgage loans held for sale and other assets 187,725 - - - - 187,725 Investments in and loans to affiliates, net 4,313 43,150 - 86,458 21,694 155,615 Intangible assets, net 8,333 - - - - 8,333 Mortgage servicing rights, net 84,332 - 355 - - 84,687 Deferred costs and other assets, net 52,265 1,617 (5,442) (25,940) (3,218) 19,282 Investments held by Consolidated Partnerships 2,773,437 (2,773,437) - - - - Other assets of Consolidated Partnerships 659,263 (659,263) - - - - Total Assets 4,296,279$ (3,056,712)$ (458,315)$ (30,302)$ (159,839)$ 591,111$ Liabilities and Equity Liabilities Notes payable 327,922$ -$ -$ -$ -$ 327,922$ Financing arrangements and secured financing 520,096 - (520,096) - - - Preferred shares of subsidiary (subject to mandatory repurchase) 55,000 - - - (55,000) - Redeemable securities 6,000 - - - - 6,000 Accounts payable, accrued expenses and other liabilities 184,946 - (2,994) (75,622) (839) 105,491 Liabilities of Consolidated Partnerships 693,750 (686,965) (6,785) - - - Total Liabilities 1,787,714 (686,965) (529,875) (75,622) (55,839) 439,413 Equity Centerline Holding Company 221,594 (113,641) 71,560 54,540 - 234,053 Non-controlling interests 2,286,971 (2,256,106) - (9,220) (104,000) (82,355) Total Liabilities and Equity 4,296,279$ (3,056,712)$ (458,315)$ (30,302)$ (159,839)$ 591,111$ September 30, 2012
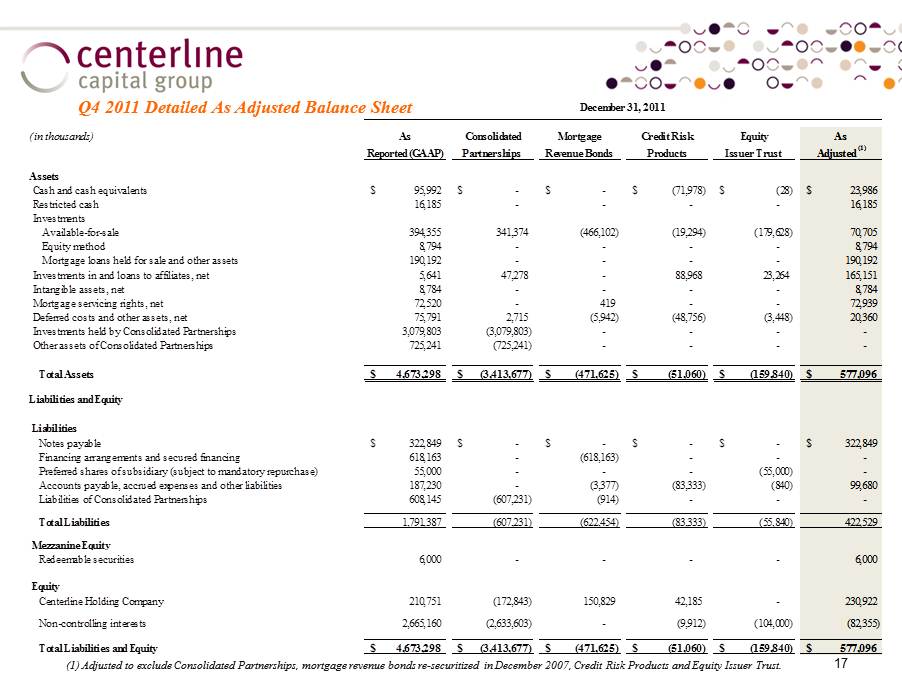
17 Q4 2011 Detailed As Adjusted Balance Sheet (1) Adjusted to exclude Consolidated Partnerships, mortgage revenue bonds re - securitized in December 2007, Credit Risk Products and Equity Issuer Trust. (in thousands) As Consolidated Mortgage Credit Risk Equity As Reported (GAAP) Partnerships Revenue Bonds Products Issuer Trust Adjusted (1) Assets Cash and cash equivalents 95,992$ -$ -$ (71,978)$ (28)$ 23,986$ Restricted cash 16,185 - - - - 16,185 Investments Available-for-sale 394,355 341,374 (466,102) (19,294) (179,628) 70,705 Equity method 8,794 - - - - 8,794 Mortgage loans held for sale and other assets 190,192 - - - - 190,192 Investments in and loans to affiliates, net 5,641 47,278 - 88,968 23,264 165,151 Intangible assets, net 8,784 - - - - 8,784 Mortgage servicing rights, net 72,520 - 419 - - 72,939 Deferred costs and other assets, net 75,791 2,715 (5,942) (48,756) (3,448) 20,360 Investments held by Consolidated Partnerships 3,079,803 (3,079,803) - - - - Other assets of Consolidated Partnerships 725,241 (725,241) - - - - Total Assets 4,673,298$ (3,413,677)$ (471,625)$ (51,060)$ (159,840)$ 577,096$ Liabilities and Equity Liabilities Notes payable 322,849$ -$ -$ -$ -$ 322,849$ Financing arrangements and secured financing 618,163 - (618,163) - - - Preferred shares of subsidiary (subject to mandatory repurchase) 55,000 - - - (55,000) - Accounts payable, accrued expenses and other liabilities 187,230 - (3,377) (83,333) (840) 99,680 Liabilities of Consolidated Partnerships 608,145 (607,231) (914) - - - Total Liabilities 1,791,387 (607,231) (622,454) (83,333) (55,840) 422,529 Mezzanine Equity Redeemable securities 6,000 - - - - 6,000 Equity Centerline Holding Company 210,751 (172,843) 150,829 42,185 - 230,922 Non-controlling interests 2,665,160 (2,633,603) - (9,912) (104,000) (82,355) Total Liabilities and Equity 4,673,298$ (3,413,677)$ (471,625)$ (51,060)$ (159,840)$ 577,096$ December 31, 2011

18 Q3 2012 Detailed As Adjusted Income Statement (1) Adjusted to exclude Consolidated Partnerships, mortgage revenue bonds re - securitized in December 2007, Credit Risk Products and Equity Is suer Trust . Refer to pages 21 and page for further details . (2) Includes prepayment penalties, expense reimbursements, gains on sales of mortgage loans and other revenues. (in thousands, except per share data) As Consolidated Mortgage Credit Risk Equity As Reported (GAAP) Partnerships Revenue Bonds Products Issuer Trust Adjusted (1) Revenues: Interest income 11,072$ 6,922$ (7,273)$ (536)$ (2,516)$ 7,669$ Fee Income 9,757 4,403 260 (430) - 13,990 Other revenues (2) 16,034 1,800 (17) 97 - 17,914 Revenues of Consolidated Partnerships 26,809 (26,809) - - - - Total revenues 63,672 (13,684) (7,030) (869) (2,516) 39,573 Expenses: General and administrative: Salaries and benefits 12,614 - - - - 12,614 Other 10,853 - - 1,326 (45) 12,134 Total general and administrative expenses 23,467 - - 1,326 (45) 24,748 Provision (recovery) for losses, net 14,738 - - (12,697) - 2,041 Total Interest Expense 14,967 - (8,814) 65 (960) 5,258 Depreciation and amortization 3,696 - (47) (24) (77) 3,548 Interest and other expenses of Consolidated Partnerships 101,921 (101,921) - - - - Total expenses 158,789 (101,921) (8,861) (11,330) (1,082) 35,595 (Loss) income before other income (95,117) 88,237 1,831 10,461 (1,434) 3,978 Equity and other income (loss), net 55 - - (9,585) (122) (9,652) Gain on settlement of liabilities 493 - - - - 493 Gain from repayment or sale of investments 598 - - - - 598 Other loss from Consolidated Partnerships (56,684) 56,684 - - - - (Loss) income from continuing operations before income taxes (150,655) 144,921 1,831 876 (1,556) (4,583) Income tax provision - continuing operations 652 - - - - 652 Net (loss) income from continuing operations (150,003) 144,921 1,831 876 (1,556) (3,931) Net loss (income) attributable to non-controlling interests 144,240 (144,920) - (876) 1,556 - Net (loss) income attributable to Centerline Holding Company shareholders (5,763) 1 1,831 - - (3,931) Net income per share: Basic and Diluted Loss from continuing operations (0.02)$ (0.01)$ Weighted average shares outstanding: Basic and Diluted 349,166 349,166 Three Months Ended September 30, 2012

19 Q3 YTD 2012 Detailed As Adjusted Income Statement (1) Refer to page 20 and the "Glossary" on page 21 for further details . (2) Includes prepayment penalties, expense reimbursements, gains on sales of mortgage loans and other revenues. (in thousands, except per share data) As Consolidated Mortgage Credit Risk Equity As Reported (GAAP) Partnerships Revenue Bonds Products Issuer Trust Adjusted (1) Revenues: Interest income 33,973$ 23,988$ (27,993)$ (1,935)$ (7,549)$ 20,484$ Fee Income 28,966 13,606 847 (1,514) - 41,905 Other revenues (2) 39,755 4,966 (98) 291 - 44,914 Revenues of Consolidated Partnerships 81,590 (81,590) - - - - Total revenues 184,284 (39,030) (27,244) (3,158) (7,549) 107,303 Expenses: General and administrative: Salaries and benefits 38,519 - - - - 38,519 Other 38,861 - - (2,676) (121) 36,064 Total general and administrative expenses 77,380 - - (2,676) (121) 74,583 Provision (recovery) for losses, net 20,502 - - (36,670) - (16,168) Total Interest Expense 47,072 - (28,716) 299 (2,880) 15,775 Depreciation and amortization 11,948 - (327) (72) (230) 11,319 Interest and other expenses of Consolidated Partnerships 220,191 (220,191) - - - - Total expenses 377,093 (220,191) (29,043) (39,119) (3,231) 85,509 (Loss) income before other income (192,809) 181,161 1,799 35,961 (4,318) 21,794 Equity and other income (loss) 113 - - (35,270) (350) (35,507) Gain on settlement of liabilities 493 - - - - 493 Gain from repayment or sale of investments 1,419 - (795) - - 624 Other loss from Consolidated Partnerships (277,403) 277,403 - - - - (Loss) income from continuing operations before income taxes (468,187) 458,564 1,004 691 (4,668) (12,596) Income tax provision - continuing operations 505 - - - - 505 Net (loss) income from continuing operations (467,682) 458,564 1,004 691 (4,668) (12,091) Net loss (income) attributable to non-controlling interests 454,578 (458,555) - (691) 4,668 - Net (loss) income attributable to Centerline Holding Company shareholders (13,104) 9 1,004 - - (12,091) Net income per share: Basic and Diluted Loss from continuing operations (0.04)$ (0.03)$ Weighted average shares outstanding: Basic and Diluted 349,166 349,166 Nine Months Ended September 30, 2012
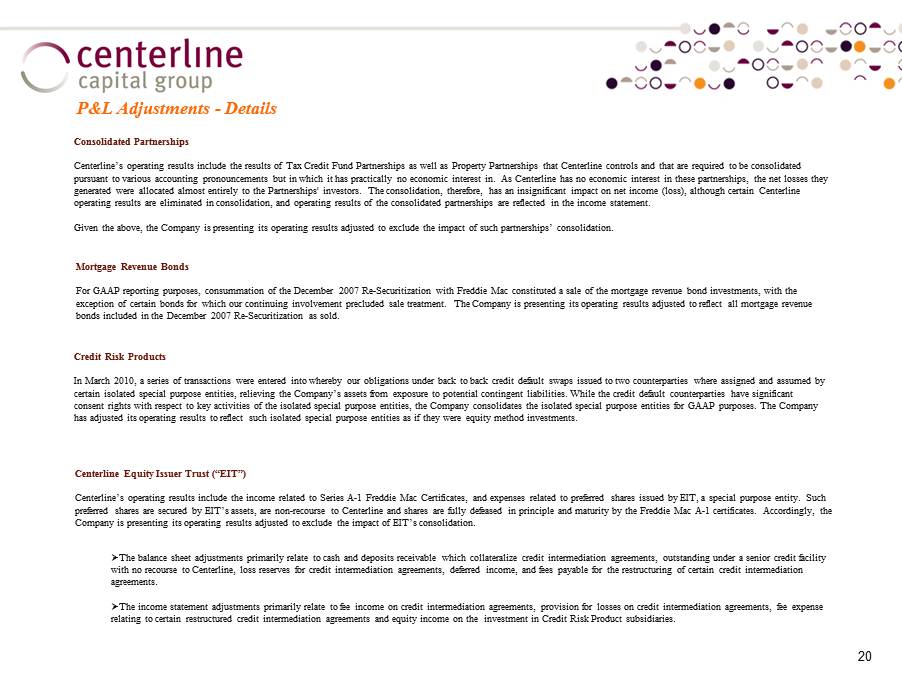
20 P&L Adjustments - Details Consolidated Partnerships Centerline’s operating results include the results of Tax Credit Fund Partnerships as well as Property Partnerships that Centerline controls and that are required to be consolidated pursuant to various accounting pronouncements but in which it has practically no economic interest in. As Centerline has no economic interest in these partnerships, the net losses they generated were allocated almost entirely to the Partnerships' investors. The consolidation, therefore, has an insignificant imp act on net income (loss), although certain Centerline operating results are eliminated in consolidation, and operating results of the consolidated partnerships are reflected in th e i ncome statement. Given the above, the Company is presenting its operating results adjusted to exclude the impact of such partnerships’ consoli dat ion. Mortgage Revenue Bonds For GAAP reporting purposes, consummation of the December 2007 Re - Securitization with Freddie Mac constituted a sale of the mort gage revenue bond investments, with the exception of certain bonds for which our continuing involvement precluded sale treatment. The Company is presenting its oper ati ng results adjusted to reflect all mortgage revenue bonds included in the December 2007 Re - Securitization as sold. » The balance sheet adjustments primarily relate to cash and deposits receivable which collateralize credit intermediation agreements, outstanding under a senior credit facility with no recourse to Centerline, loss reserves for credit intermediation agreements, deferred income, and fees payable for the restructuring of certain credit intermediation agreements. » The income statement adjustments primarily relate to fee income on credit intermediation agreements, provision for losses on cre dit intermediation agreements, fee expense relating to certain restructured credit intermediation agreements and equity income on the investment in Credit Risk Product su bsidiaries. Centerline Equity Issuer Trust (“EIT”) Centerline’s operating results include the income related to Series A - 1 Freddie Mac Certificates, and expenses related to prefer red shares issued by EIT, a special purpose entity. Such preferred shares are secured by EIT’s assets, are non - recourse to Centerline and shares are fully defeased in principle and matu rity by the Freddie Mac A - 1 certificates. Accordingly, the Company is presenting its operating results adjusted to exclude the impact of EIT’s consolidation. Credit Risk Products In March 2010, a series of transactions were entered into whereby our obligations under back to back credit default swaps issued to two counterparties where assigned and assumed by certain isolated special purpose entities, relieving the Company’s assets from exposure to potential contingent liabilities. Whi le the credit default counterparties have significant consent rights with respect to key activities of the isolated special purpose entities, the Company consolidates the isolated sp ecial purpose entities for GAAP purposes. The Company has adjusted its operating results to reflect such isolated special purpose entities as if they were equity method investment s.

21 Glossary As Reported - The reported figures that are in accordance with GAAP. Non-controlling interests - In connection with acquisitions, the Company issued non-controlling interests that are convertible into common shares of Centerline Holding Company: Redeemable securities - CRA Shares issued by Centerline Holding Company. Other than the preferred allocation of regulatory benefits, the holders of the CRA Shares receive the same economic benefits as our Common Shareholders, and dividends for both are the same with no preference in liquidation. CRA Shares have no voting rights, except on matters relating to the terms of the CRA Shares or to amendments to our Trust Agreement that would adversely affect the CRA Shares. The shareholders of the CRA shares have the option to convert their shares into Common Shares on a one-for-one basis. Upon conversion, the shareholders would no longer be entitled to a special allocation of the regulatory benefit. For presentation purposes, basic and diluted per share data include both common and CRA Shares. December 2007 Re-securitization - In December 2007, we completed the re-securitization of most of our mortgage revenue bond portfolio with Freddie Mac. For accounting purposes, consummation of this transaction constituted a sale of the mortgage revenue bond investments, with the exception of certain bonds for which our continuing involvement precluded sale treatment. Discontinued Operations - As a result of the March 2010 Restructuring, Centerline exited the Commercial Real Estate Fund Management and Portfolio Management operating segments. Non-controlling interests also includes the limited partners interest in the Consolidated Partnerships, third party ownership in Centerline Financial Holdings LLC and preferred shares of our EIT subsidiary. LIBOR - The London InterBank Offered Rate ("LIBOR") is the rate on dollar denominated deposits, also known as Eurodollars, traded between banks in London. The index is quoted for one- month, three-month, six-month and one-year periods. The LIBOR rate is an average of rate quotes from five major banks. Preferred Shares of subsidiary subject to mandatory redemption / not subject to mandatory redemption - Shares issued by EIT secured by EIT's assets and which are non-recourse to Centerline. Such shares are fully defeased in principle and maturity by EIT's assets. LIHTC - Multifamily properties that generate Low-Income Housing Tax Credits. SCUs (Special Common Units) - Issued at the time of the Centerline Affordable Housing Advisors LLC acquisition in the fourth quarter of 2003. In connection with this acquisition, our subsidiary issued membership interests in the form of 16.1 million SCUs, of which 11.9 million remained outstanding as of December 31, 2011. Each holder of SCUs also holds one special preferred voting share (at a par value of $0.01 per share) for each SCU. SCU holders are entitled to distributions at the same time as, and only if, we pay distributions on our Common Shares. Each holder of SCUs has the right to: • exchange all or a portion of their SCUs for cash; and • receive cash for any accrued but unpaid distributions with respect to SCUs exchanged (not including accrued and unpaid distributions for the quarterly period in which the exchange occurs). Subsequent to the March 2010 Restructuring, we no longer deem the SCU holders to possess significant influence, and we no longer allocate income to the SCU holders.