Attached files
| file | filename |
|---|---|
| 8-K - TRUSTCO BANK CORP NY 8-K 11-15-2012 - TRUSTCO BANK CORP N Y | form8k.htm |
Exhibit 99(a)
Robert J. McCormick, President and Chief Executive Officer Robert T. Cushing, Executive Vice President and Chief Financial Officer Scot R. Salvador, Executive Vice President and Chief Banking Officer Sandler O’Neill + Partners East Coast Financial Services Conference November 15, 2012

Forward Looking Statements * Note: Data in this presentation was obtained from SNL Financial and from the Company’s SEC filings. This presentation contains “forward-looking statements” within the meaning of the Private Securities Litigation Reform Act of 1995 (the “Act”). Forward-looking statements can be identified by words such as “believes,” “anticipates,” “expects,” “should,” “may,” “plans,” “estimates,” and similar references; however, such words are not the exclusive means of identifying such statements. Examples of forward-looking statements include, but are not limited to: (i) projections of revenues, expenses, income or loss, earnings or loss per share, and other financial items; (ii) statements of plans, objectives, and expectations of TrustCo or its management or Board of Directors; (iii) statements of future economic performance; and (iv) statements of underlying assumptions. Forward-looking statements are based on TrustCo’s current expectations and assumptions regarding its business, the economy, and other future conditions. Because forward- looking statements relate to the future, they are subject to inherent uncertainties, risks, and changes in circumstances that are difficult to predict. TrustCo’s actual results may differ materially from those contemplated by the forward-looking statements, which are neither statements of historical fact nor guarantees or assurances of future performance. Factors that could cause actual results to differ from those discussed in the forward-looking statements include, but are not limited to: (1) local, regional, national, and international economic conditions and the impact they may have on us and our customers; (2) volatility and disruption in national and international financial markets; (3) government intervention in the U.S. financial system; (4) changes in the level of non-performing assets and charge-offs; (5) changes in estimates of future reserve requirements; (6) adverse conditions in the securities markets that lead to impairment in the value of securities in our investment portfolio; (7) inflation, interest rate, securities market, and monetary fluctuations; (8) the timely development and acceptance of new products and services; (9) changes in consumer spending, borrowings, and savings habits; (10) technological changes; (11) the ability to increase market share and control expenses; (12) changes in the competitive environment among banks and other financial service providers; (13) the effect of changes in laws and regulations with which we and our subsidiaries must comply, including those under the Dodd-Frank Wall Street Reform and Consumer Protection Act and the Basel III update to the Basel Accords that is under development; (14) the effect of changes in accounting policies and practices, as may be adopted by regulatory agencies, as well as the Public Company Accounting Oversight Board, the Financial Accounting Standards Board, and other accounting standard setters; (15) the costs and effects of legal and regulatory developments including the resolution of legal proceedings or regulatory or other governmental inquiries and the results of regulatory examinations or reviews; and (16) our success at managing the risks involved in the foregoing items; and (17) the other factors that are described in the Company’s Annual Report on Form 10-K and Quarterly Reports on Form 10-Q under the heading “Risk Factors.” Any forward-looking statement made by the Company speaks only as of the date on which it is made. Factors or events that could cause the Company’s actual results to differ may emerge from time to time, and it is not possible for the Company to predict all of them. The Company undertakes no obligation to publicly update any forward-looking statement, whether as a result of new information, future developments, or otherwise, except as may be required by law.
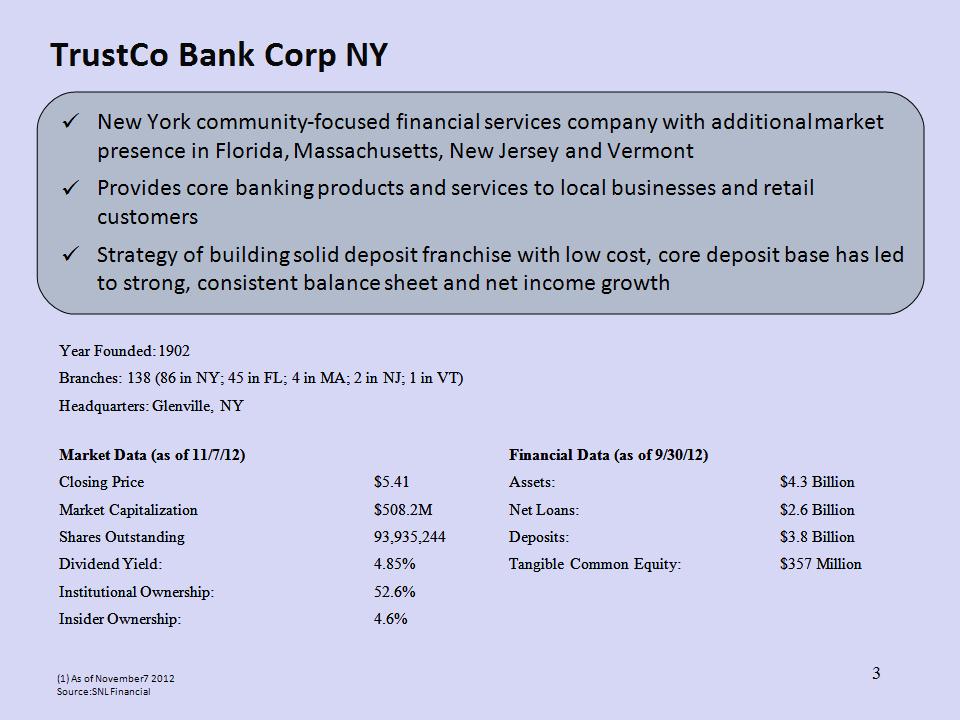
* TrustCo Bank Corp NY New York community-focused financial services company with additional market presence in Florida, Massachusetts, New Jersey and Vermont Provides core banking products and services to local businesses and retail customers Strategy of building solid deposit franchise with low cost, core deposit base has led to strong, consistent balance sheet and net income growth (1) As of November 7 2012 Source: SNL Financial Year Founded: 1902 Branches: 138 (86 in NY; 45 in FL; 4 in MA; 2 in NJ; 1 in VT) Branches: 138 (86 in NY; 45 in FL; 4 in MA; 2 in NJ; 1 in VT) Branches: 138 (86 in NY; 45 in FL; 4 in MA; 2 in NJ; 1 in VT) Branches: 138 (86 in NY; 45 in FL; 4 in MA; 2 in NJ; 1 in VT) Headquarters: Glenville, NY Market Data (as of 11/7/12) Financial Data (as of 9/30/12) Closing Price $5.41 Assets: $4.3 Billion Market Capitalization $508.2M Net Loans: $2.6 Billion Shares Outstanding 93,935,244 Deposits: $3.8 Billion Dividend Yield: 4.85% Tangible Common Equity: $357 Million Institutional Ownership: 52.6% Insider Ownership: 4.6%
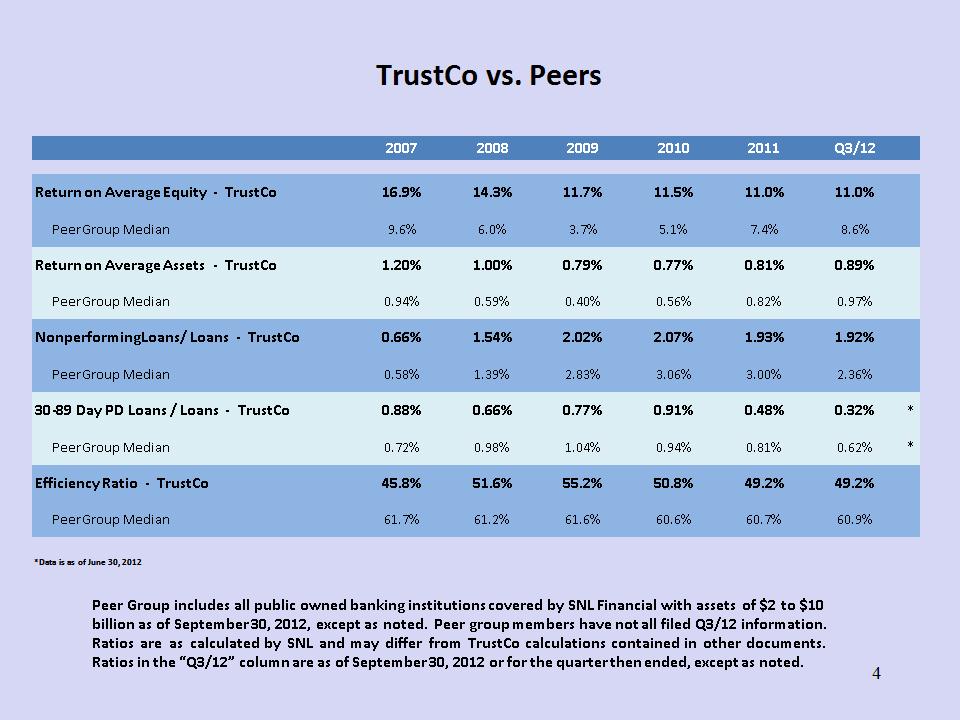
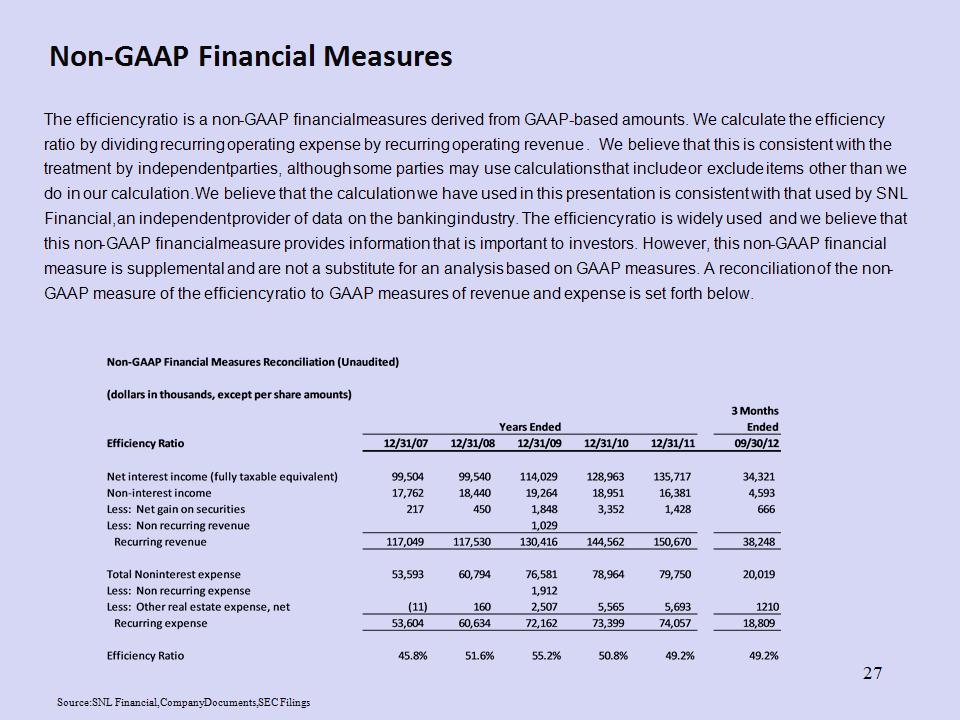
TrustCo vs. Peers Peer Group includes all public owned banking institutions covered by SNL Financial with assets of $2 to $10 billion as of September 30, 2012, except as noted. Peer group members have not all filed Q3/12 information. Ratios are as calculated by SNL and may differ from TrustCo calculations contained in other documents. Ratios in the “Q3/12” column are as of September 30, 2012 or for the quarter then ended, except as noted. * 2007 2008 2009 2010 2011 Q3/12 Return on Average Equity - TrustCo 16.9% 14.3% 11.7% 11.5% 11.0% 11.0% Peer Group Median 9.6% 6.0% 3.7% 5.1% 7.4% 8.6% Return on Average Assets - TrustCo 1.20% 1.00% 0.79% 0.77% 0.81% 0.89% Peer Group Median 0.94% 0.59% 0.40% 0.56% 0.82% 0.97% Nonperforming Loans/ Loans - TrustCo 0.66% 1.54% 2.02% 2.07% 1.93% 1.92% Peer Group Median 0.58% 1.39% 2.83% 3.06% 3.00% 2.36% 30-89 Day PD Loans / Loans - TrustCo 0.88% 0.66% 0.77% 0.91% 0.48% 0.32% * Peer Group Median 0.72% 0.98% 1.04% 0.94% 0.81% 0.62% * Efficiency Ratio - TrustCo 45.8% 51.6% 55.2% 50.8% 49.2% 49.2% Peer Group Median 61.7% 61.2% 61.6% 60.6% 60.7% 60.9% *Data is as of June 30, 2012

* Branch Franchise Overview New York – 14 Counties, 86 Branches Massachusetts – 1 County, 4 Branches New Jersey – 1 County, 2 Branches Vermont – 1 County, 1 Branch Florida – 12 Counties, 45 Branches As of September 30, 2012

New York Region *

Florida Region *

* Deposit Growth and Branch Expansion Source: SEC Filing; Company Documents; SNL Financial
* Branch Growth Strategy Since 2000, the Company has increased its network by 84 branches, bringing the total to 138 All new branches opened on a de novo basis Expansion included growth in five states, with a focus on Florida and Downstate New York We have built a platform for steady and conservative growth Deposits per branch have increased $2.8 million or 11.3%¹ since 2009 TrustCo now has a footprint with economic and geographic diversification (1) Comparison from 3/31/2009 to 9/30/2012 Source: SEC Filings; Company Documents
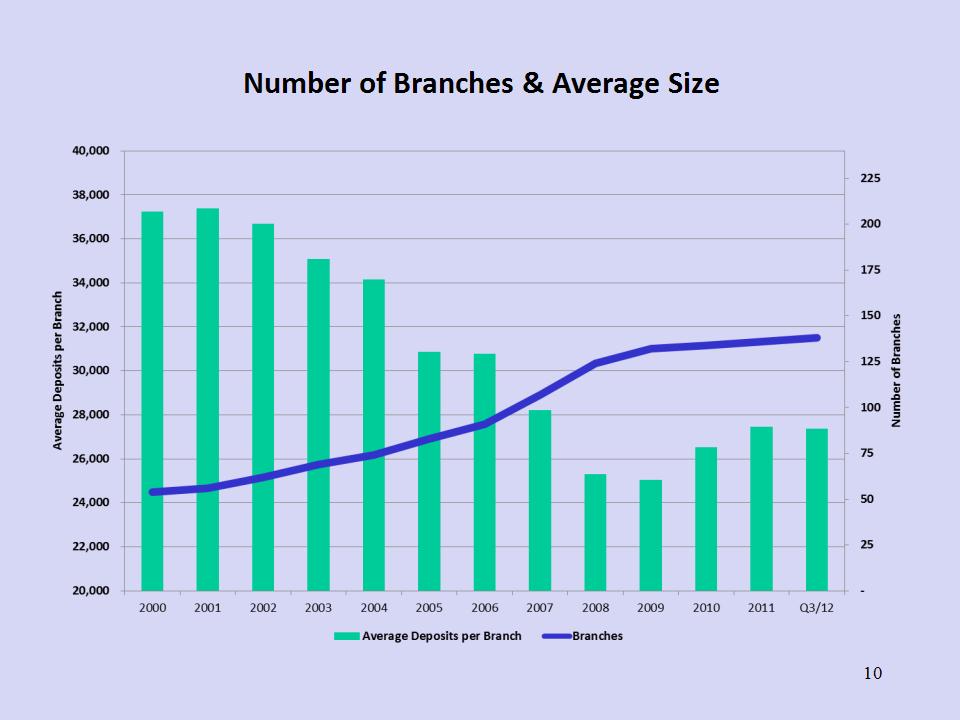
Number of Branches & Average Size *
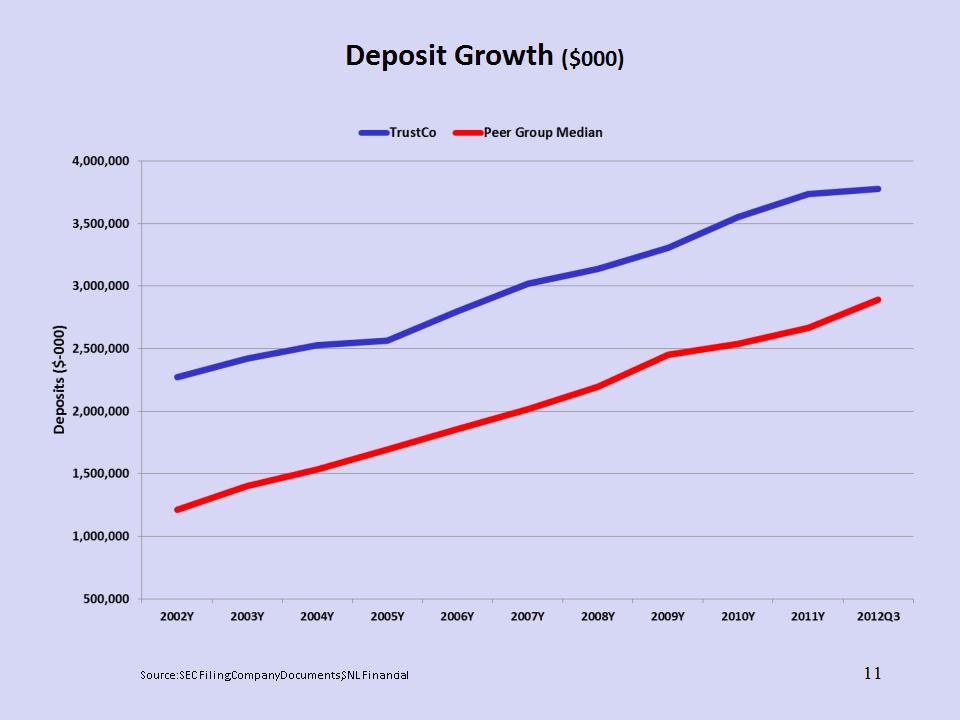
Deposit Growth ($000) * Source: SEC Filing; Company Documents; SNL Financial
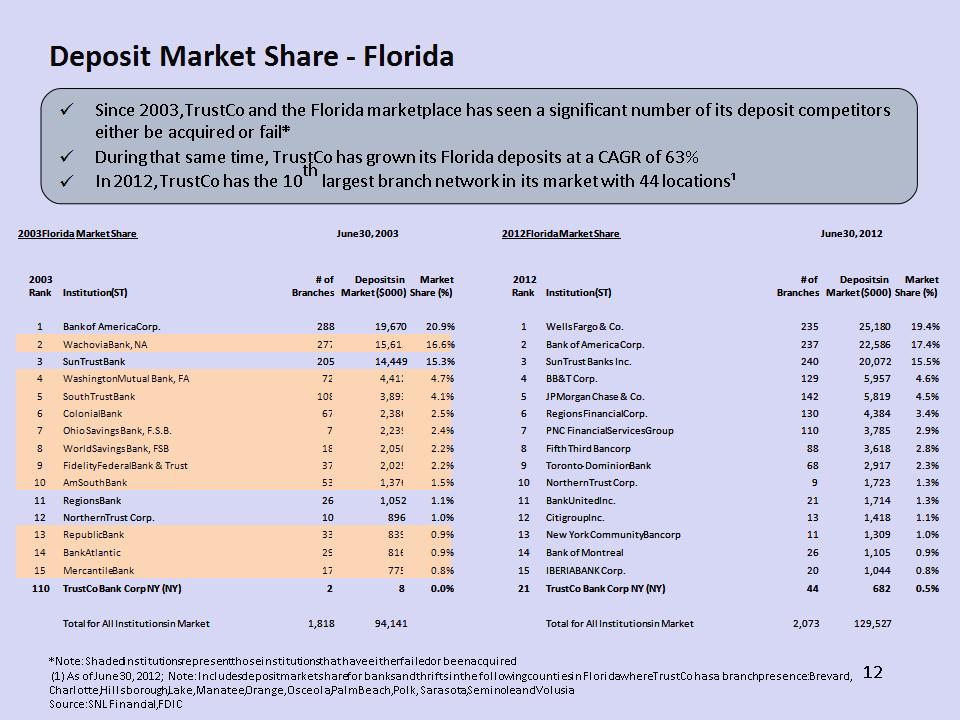
* Deposit Market Share – Florida *Note: Shaded institutions represent those institutions that have either failed or been acquired (1) As of June 30, 2012; Note: Includes deposit market share for banks and thrifts in the following counties in Florida where TrustCo has a branch presence: Brevard, Charlotte, Hillsborough, Lake, Manatee, Orange, Osceola, Palm Beach, Polk, Sarasota, Seminole and Volusia Source: SNL Financial, FDIC Since 2003, TrustCo and the Florida marketplace has seen a significant number of its deposit competitors either be acquired or fail* During that same time, TrustCo has grown its Florida deposits at a CAGR of 63% In 2012, TrustCo has the 10th largest branch network in its market with 44 locations¹ 2003 Florida Market Share 2003 Florida Market Share June 30, 2003 June 30, 2003 June 30, 2003 2012 Florida Market Share 2012 Florida Market Share June 30, 2012 June 30, 2012 June 30, 2012 2003 Rank Institution (ST) # of Branches Deposits in Market ($000) Market Share (%) 2012 Rank Institution (ST) # of Branches Deposits in Market ($000) Market Share (%) 1 Bank of America Corp. 288 19,670 20.9% 1 Wells Fargo & Co. 235 25,180 19.4% 2 Wachovia Bank, NA 277 15,615 16.6% 2 Bank of America Corp. 237 22,586 17.4% 3 SunTrust Bank 205 14,449 15.3% 3 SunTrust Banks Inc. 240 20,072 15.5% 4 Washington Mutual Bank, FA 72 4,412 4.7% 4 BB&T Corp. 129 5,957 4.6% 5 SouthTrust Bank 108 3,893 4.1% 5 JPMorgan Chase & Co. 142 5,819 4.5% 6 Colonial Bank 67 2,386 2.5% 6 Regions Financial Corp. 130 4,384 3.4% 7 Ohio Savings Bank, F.S.B. 7 2,239 2.4% 7 PNC Financial Services Group 110 3,785 2.9% 8 World Savings Bank, FSB 18 2,050 2.2% 8 Fifth Third Bancorp 88 3,618 2.8% 9 Fidelity Federal Bank & Trust 37 2,025 2.2% 9 Toronto-Dominion Bank 68 2,917 2.3% 10 AmSouth Bank 53 1,376 1.5% 10 Northern Trust Corp. 9 1,723 1.3% 11 Regions Bank 26 1,052 1.1% 11 BankUnited Inc. 21 1,714 1.3% 12 Northern Trust Corp. 10 896 1.0% 12 Citigroup Inc. 13 1,418 1.1% 13 Republic Bank 33 839 0.9% 13 New York Community Bancorp 11 1,309 1.0% 14 BankAtlantic 29 816 0.9% 14 Bank of Montreal 26 1,105 0.9% 15 Mercantile Bank 17 775 0.8% 15 IBERIABANK Corp. 20 1,044 0.8% 110 TrustCo Bank Corp NY (NY) 2 8 0.0% 21 TrustCo Bank Corp NY (NY) 44 682 0.5% Total for All Institutions in Market 1,818 94,141 Total for All Institutions in Market 2,073 129,527
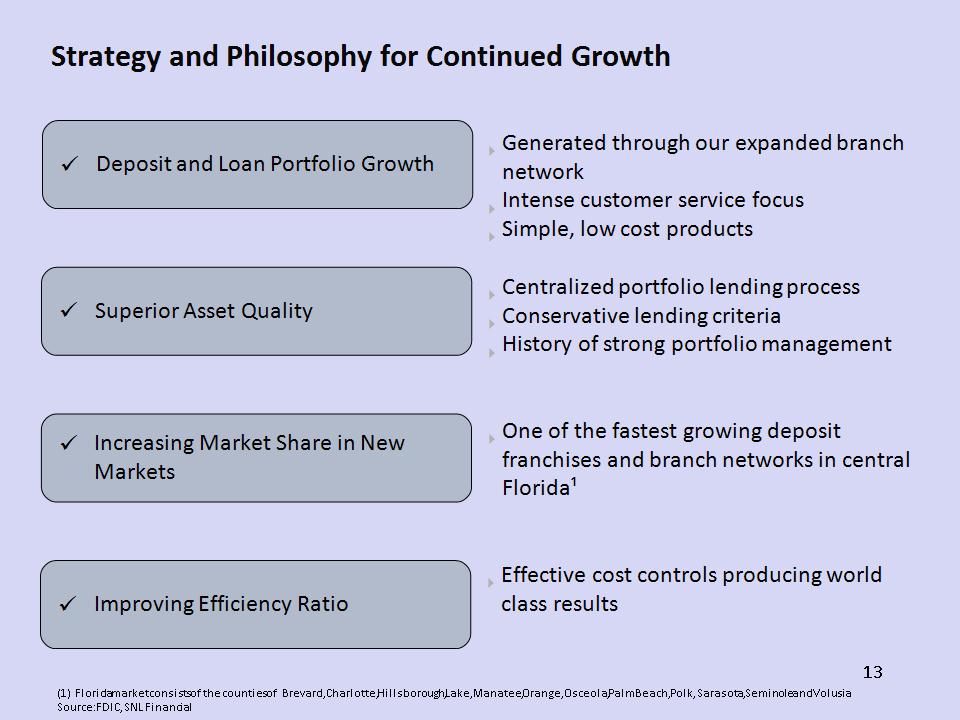
* Strategy and Philosophy for Continued Growth Deposit and Loan Portfolio Growth Superior Asset Quality Increasing Market Share in New Markets Generated through our expanded branch network Intense customer service focus Simple, low cost products Centralized portfolio lending process Conservative lending criteria History of strong portfolio management One of the fastest growing deposit franchises and branch networks in central Florida¹ Improving Efficiency Ratio Effective cost controls producing world class results Florida market consists of the counties of Brevard, Charlotte, Hillsborough, Lake, Manatee, Orange, Osceola, Palm Beach, Polk, Sarasota, Seminole and Volusia Source: FDIC, SNL Financial
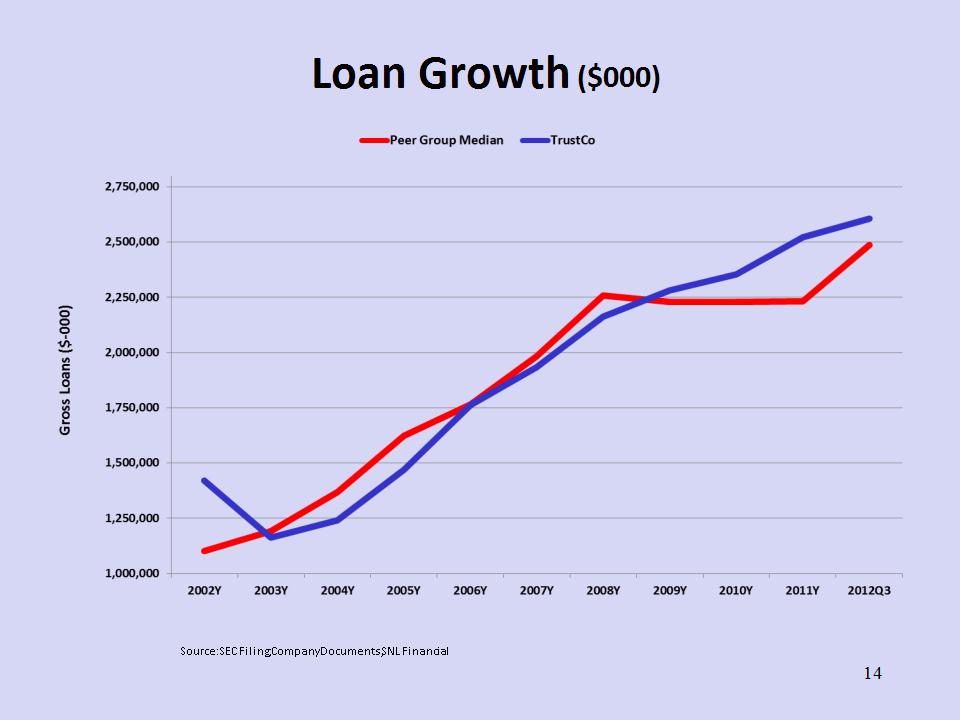
Loan Growth ($000) * Source: SEC Filing; Company Documents; SNL Financial

* Detail of Loan Portfolio 1-4 Family Composition September 30, 2012 The portfolio is comprised of loans that are fully-documented using comprehensive underwriting criteria without sole reliance on credit scores All originations are taken at branch locations by company employees Residential portfolio increased 6.9% year over year Residential delinquency rate superior to peers Average loan size is approximately $87,000 Company chose not to compete against exotic offerings that were commonly offered between 2005 to 2007, e.g. no Alt-A or Subprime products or programs Aggregate: $2.4 Billion Note: Data as of September 30, 2012 Source: Company Documents, SEC Filings
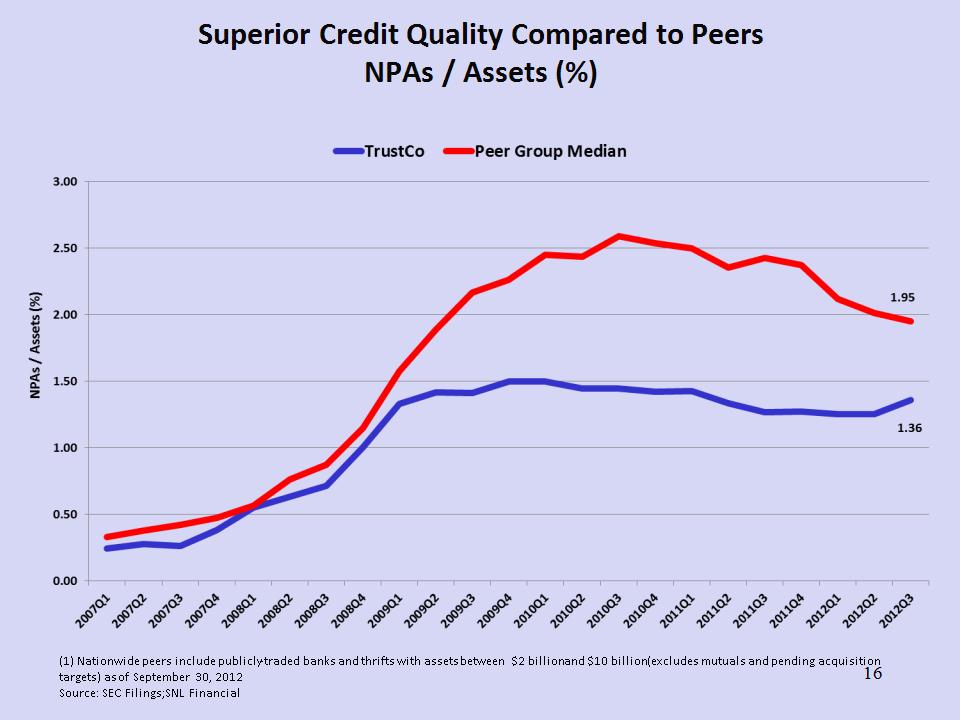
* Superior Credit Quality Compared to Peers NPAs / Assets (%) (1) Nationwide peers include publicly-traded banks and thrifts with assets between $2 billion and $10 billion (excludes mutuals and pending acquisition targets) as of September 30, 2012 Source: SEC Filings; SNL Financial
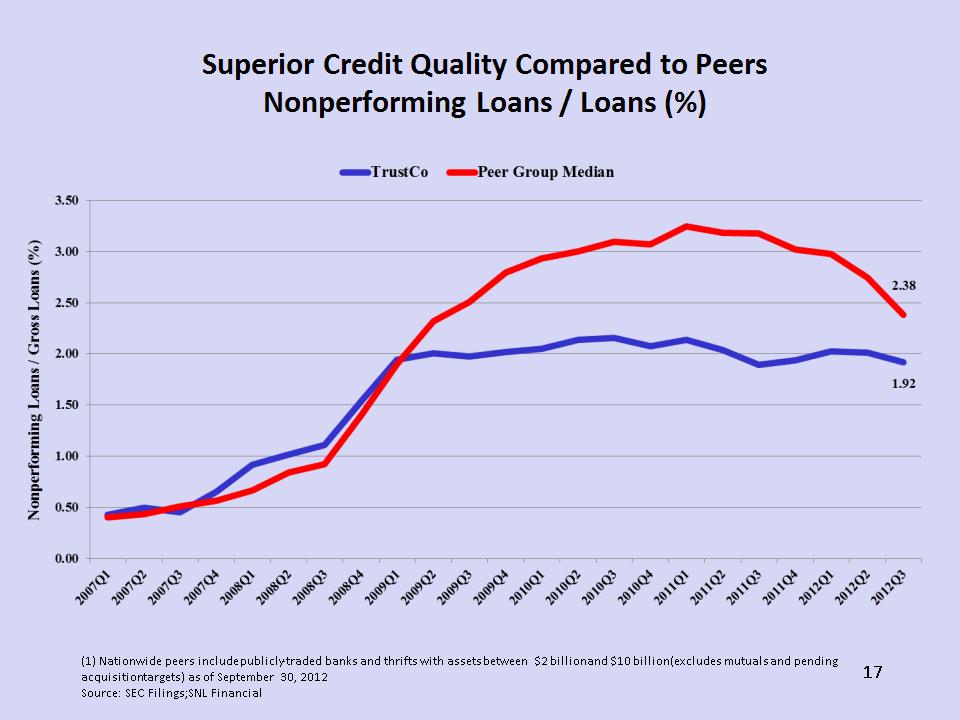
Superior Credit Quality Compared to Peers Nonperforming Loans / Loans (%) * (1) Nationwide peers include publicly-traded banks and thrifts with assets between $2 billion and $10 billion (excludes mutuals and pending acquisition targets) as of September 30, 2012 Source: SEC Filings; SNL Financial
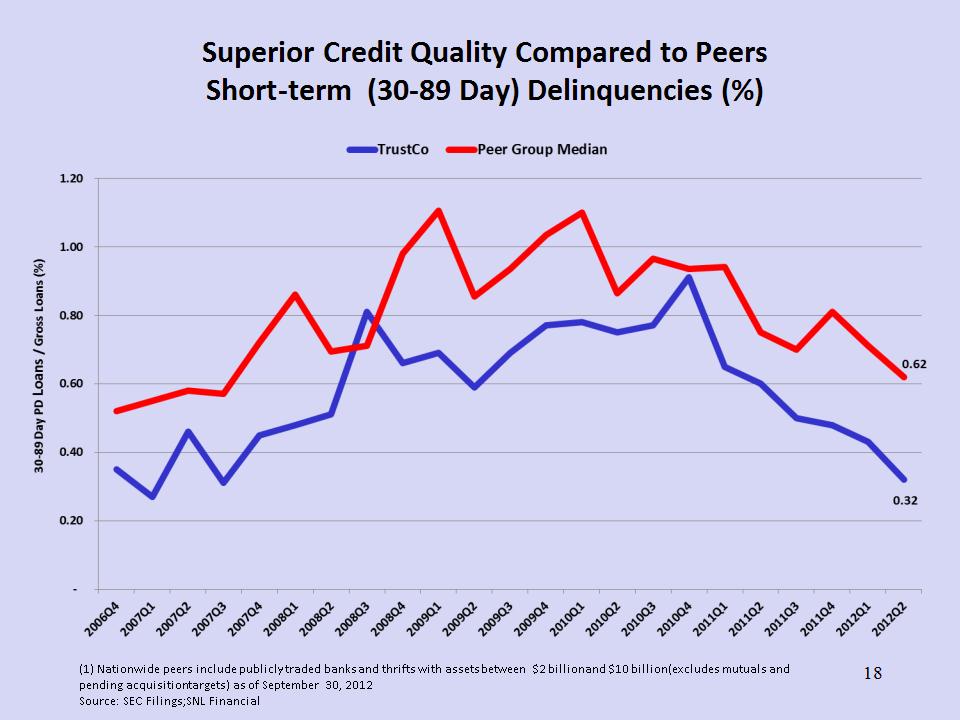
Superior Credit Quality Compared to Peers Short-term (30-89 Day) Delinquencies (%) * (1) Nationwide peers include publicly-traded banks and thrifts with assets between $2 billion and $10 billion (excludes mutuals and pending acquisition targets) as of September 30, 2012 Source: SEC Filings; SNL Financial
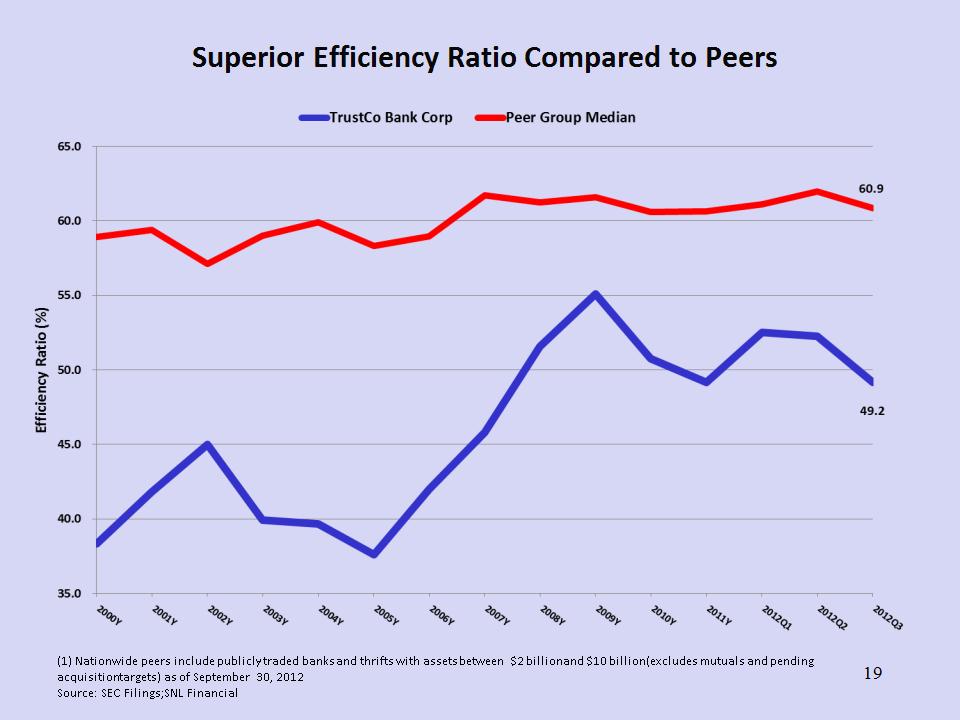
* Superior Efficiency Ratio Compared to Peers (1) Nationwide peers include publicly-traded banks and thrifts with assets between $2 billion and $10 billion (excludes mutuals and pending acquisition targets) as of September 30, 2012 Source: SEC Filings; SNL Financial
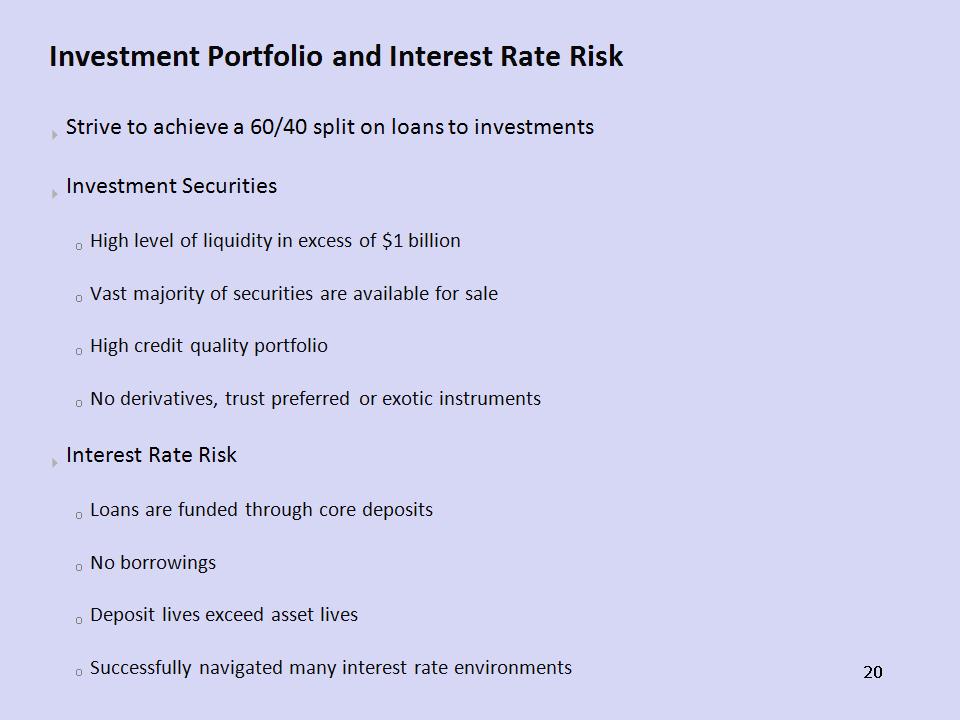
* Investment Portfolio and Interest Rate Risk Strive to achieve a 60/40 split on loans to investments Investment Securities High level of liquidity in excess of $1 billion Vast majority of securities are available for sale High credit quality portfolio No derivatives, trust preferred or exotic instruments Interest Rate Risk Loans are funded through core deposits No borrowings Deposit lives exceed asset lives Successfully navigated many interest rate environments
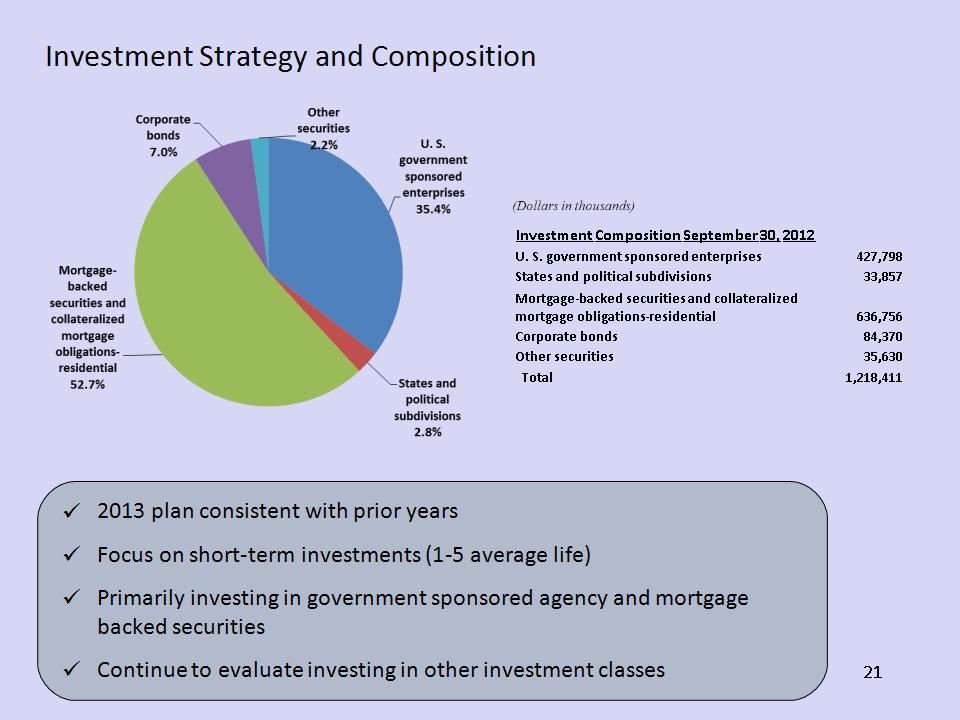
* Investment Strategy and Composition 2013 plan consistent with prior years Focus on short-term investments (1-5 average life) Primarily investing in government sponsored agency and mortgage backed securities Continue to evaluate investing in other investment classes Investment Composition September 30, 2012 U. S. government sponsored enterprises 427,798 States and political subdivisions 33,857 Mortgage-backed securities and collateralized mortgage obligations-residential 636,756 Corporate bonds 84,370 Other securities 35,630 Total 1,218,411
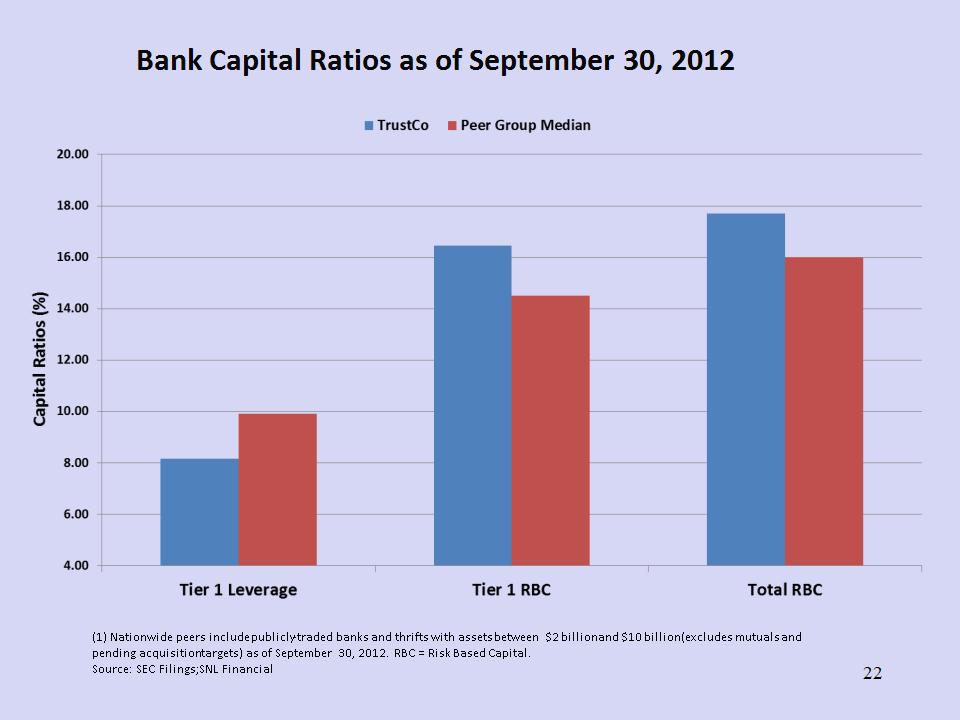
* Bank Capital Ratios as of September 30, 2012 (1) Nationwide peers include publicly-traded banks and thrifts with assets between $2 billion and $10 billion (excludes mutuals and pending acquisition targets) as of September 30, 2012. RBC = Risk Based Capital. Source: SEC Filings; SNL Financial
* Supplemental Financial Information
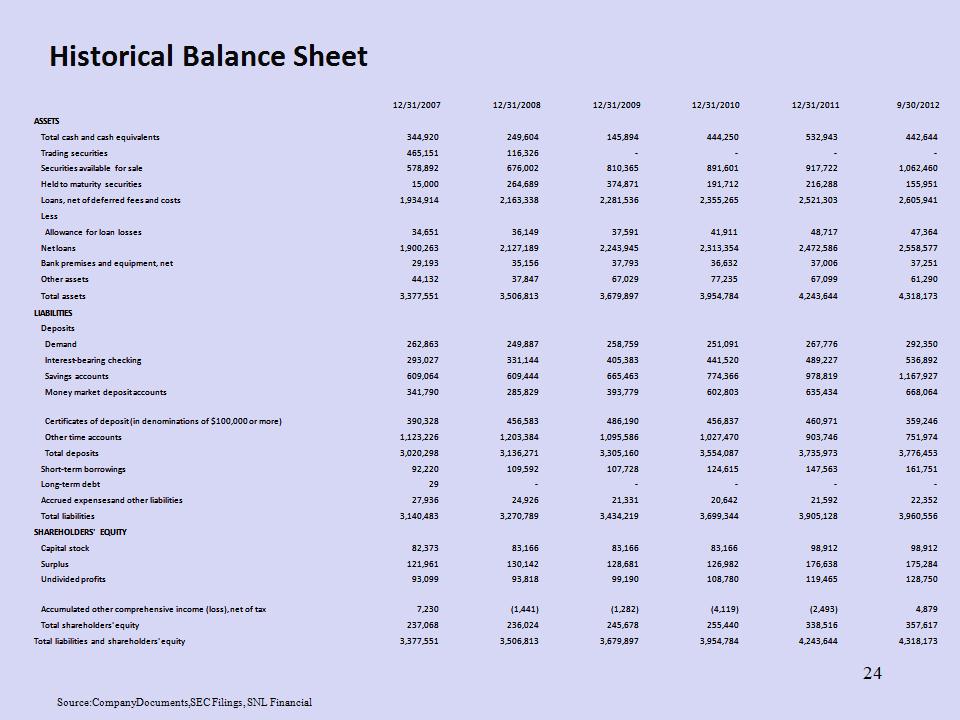
* Historical Balance Sheet Source: Company Documents, SEC Filings, SNL Financial 12/31/2007 12/31/2008 12/31/2009 12/31/2010 12/31/2011 9/30/2012 ASSETS Total cash and cash equivalents 344,920 249,604 145,894 444,250 532,943 442,644 Trading securities 465,151 116,326 - - - - Securities available for sale 578,892 676,002 810,365 891,601 917,722 1,062,460 Held to maturity securities 15,000 264,689 374,871 191,712 216,288 155,951 Loans, net of deferred fees and costs 1,934,914 2,163,338 2,281,536 2,355,265 2,521,303 2,605,941 Less Allowance for loan losses 34,651 36,149 37,591 41,911 48,717 47,364 Net loans 1,900,263 2,127,189 2,243,945 2,313,354 2,472,586 2,558,577 Bank premises and equipment, net 29,193 35,156 37,793 36,632 37,006 37,251 Other assets 44,132 37,847 67,029 77,235 67,099 61,290 Total assets 3,377,551 3,506,813 3,679,897 3,954,784 4,243,644 4,318,173 LIABILITIES Deposits Demand 262,863 249,887 258,759 251,091 267,776 292,350 Interest-bearing checking 293,027 331,144 405,383 441,520 489,227 536,892 Savings accounts 609,064 609,444 665,463 774,366 978,819 1,167,927 Money market deposit accounts 341,790 285,829 393,779 602,803 635,434 668,064 Certificates of deposit (in denominations of $100,000 or more) 390,328 456,583 486,190 456,837 460,971 359,246 Other time accounts 1,123,226 1,203,384 1,095,586 1,027,470 903,746 751,974 Total deposits 3,020,298 3,136,271 3,305,160 3,554,087 3,735,973 3,776,453 Short-term borrowings 92,220 109,592 107,728 124,615 147,563 161,751 Long-term debt 29 - - - - - Accrued expenses and other liabilities 27,936 24,926 21,331 20,642 21,592 22,352 Total liabilities 3,140,483 3,270,789 3,434,219 3,699,344 3,905,128 3,960,556 SHAREHOLDERS' EQUITY Capital stock 82,373 83,166 83,166 83,166 98,912 98,912 Surplus 121,961 130,142 128,681 126,982 176,638 175,284 Undivided profits 93,099 93,818 99,190 108,780 119,465 128,750 Accumulated other comprehensive income (loss), net of tax 7,230 (1,441) (1,282) (4,119) (2,493) 4,879 Total shareholders' equity 237,068 236,024 245,678 255,440 338,516 357,617 Total liabilities and shareholders' equity 3,377,551 3,506,813 3,679,897 3,954,784 4,243,644 4,318,173
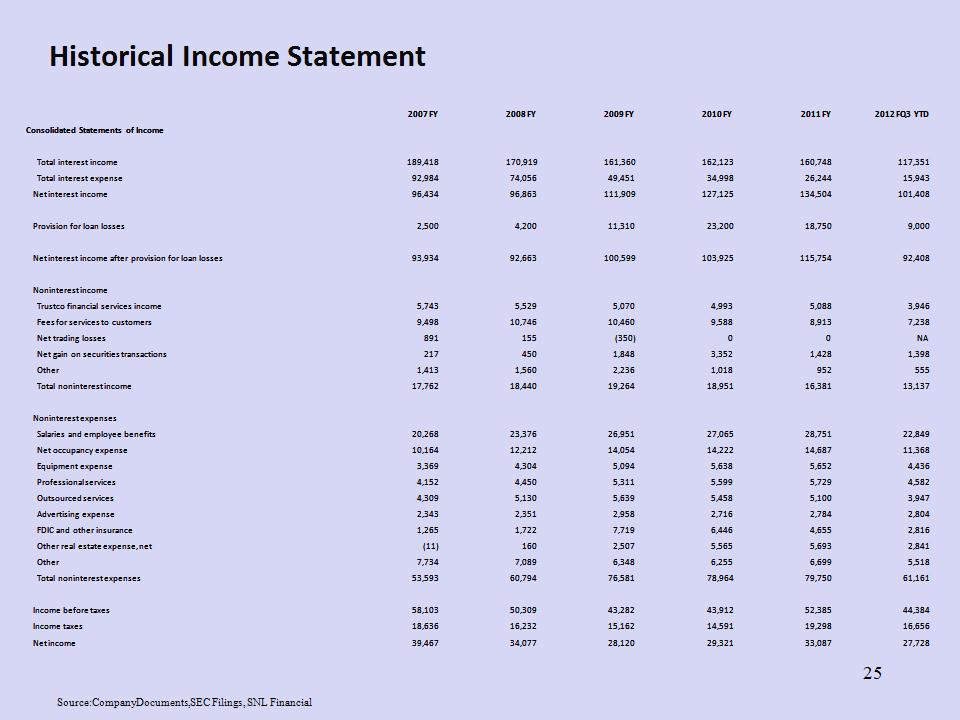
* Historical Income Statement Source: Company Documents, SEC Filings, SNL Financial 2007 FY 2008 FY 2009 FY 2010 FY 2011 FY 2012 FQ3 YTD Consolidated Statements of Income Total interest income 189,418 170,919 161,360 162,123 160,748 117,351 Total interest expense 92,984 74,056 49,451 34,998 26,244 15,943 Net interest income 96,434 96,863 111,909 127,125 134,504 101,408 Provision for loan losses 2,500 4,200 11,310 23,200 18,750 9,000 Net interest income after provision for loan losses 93,934 92,663 100,599 103,925 115,754 92,408 Noninterest income Trustco financial services income 5,743 5,529 5,070 4,993 5,088 3,946 Fees for services to customers 9,498 10,746 10,460 9,588 8,913 7,238 Net trading losses 891 155 (350) 0 0 NA Net gain on securities transactions 217 450 1,848 3,352 1,428 1,398 Other 1,413 1,560 2,236 1,018 952 555 Total noninterest income 17,762 18,440 19,264 18,951 16,381 13,137 Noninterest expenses Salaries and employee benefits 20,268 23,376 26,951 27,065 28,751 22,849 Net occupancy expense 10,164 12,212 14,054 14,222 14,687 11,368 Equipment expense 3,369 4,304 5,094 5,638 5,652 4,436 Professional services 4,152 4,450 5,311 5,599 5,729 4,582 Outsourced services 4,309 5,130 5,639 5,458 5,100 3,947 Advertising expense 2,343 2,351 2,958 2,716 2,784 2,804 FDIC and other insurance 1,265 1,722 7,719 6,446 4,655 2,816 Other real estate expense, net (11) 160 2,507 5,565 5,693 2,841 Other 7,734 7,089 6,348 6,255 6,699 5,518 Total noninterest expenses 53,593 60,794 76,581 78,964 79,750 61,161 Income before taxes 58,103 50,309 43,282 43,912 52,385 44,384 Income taxes 18,636 16,232 15,162 14,591 19,298 16,656 Net income 39,467 34,077 28,120 29,321 33,087 27,728
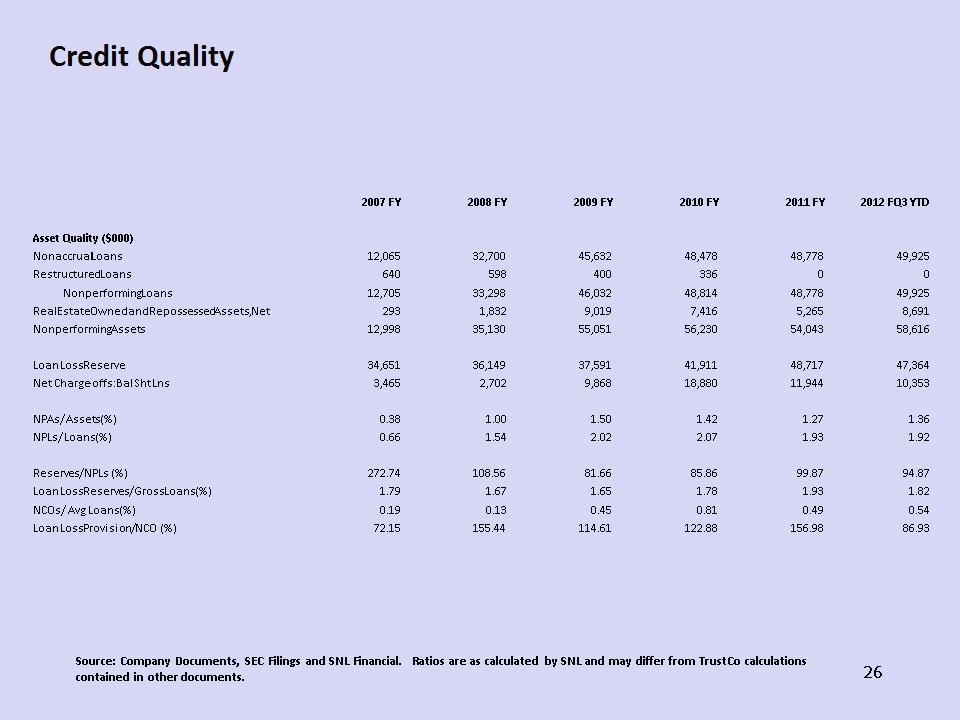
* Credit Quality Source: Company Documents, SEC Filings and SNL Financial. Ratios are as calculated by SNL and may differ from TrustCo calculations contained in other documents. 2007 FY 2008 FY 2009 FY 2010 FY 2011 FY 2012 FQ3 YTD Asset Quality ($000) Asset Quality ($000) Asset Quality ($000) Nonaccrual Loans Nonaccrual Loans Nonaccrual Loans 12,065 32,700 45,632 48,478 48,778 49,925 Restructured Loans Restructured Loans Restructured Loans 640 598 400 336 0 0 Nonperforming Loans Nonperforming Loans 12,705 33,298 46,032 48,814 48,778 49,925 Real Estate Owned and Repossessed Assets, Net Real Estate Owned and Repossessed Assets, Net Real Estate Owned and Repossessed Assets, Net 293 1,832 9,019 7,416 5,265 8,691 Nonperforming Assets Nonperforming Assets Nonperforming Assets 12,998 35,130 55,051 56,230 54,043 58,616 Loan Loss Reserve Loan Loss Reserve Loan Loss Reserve 34,651 36,149 37,591 41,911 48,717 47,364 Net Charge-offs: Bal Sht Lns Net Charge-offs: Bal Sht Lns Net Charge-offs: Bal Sht Lns 3,465 2,702 9,868 18,880 11,944 10,353 NPAs/ Assets (%) NPAs/ Assets (%) NPAs/ Assets (%) 0.38 1.00 1.50 1.42 1.27 1.36 NPLs/ Loans (%) NPLs/ Loans (%) NPLs/ Loans (%) 0.66 1.54 2.02 2.07 1.93 1.92 Reserves/ NPLs (%) Reserves/ NPLs (%) Reserves/ NPLs (%) 272.74 108.56 81.66 85.86 99.87 94.87 Loan Loss Reserves/ Gross Loans (%) Loan Loss Reserves/ Gross Loans (%) Loan Loss Reserves/ Gross Loans (%) 1.79 1.67 1.65 1.78 1.93 1.82 NCOs/ Avg Loans (%) NCOs/ Avg Loans (%) NCOs/ Avg Loans (%) 0.19 0.13 0.45 0.81 0.49 0.54 Loan Loss Provision/ NCO (%) Loan Loss Provision/ NCO (%) Loan Loss Provision/ NCO (%) 72.15 155.44 114.61 122.88 156.98 86.93