Attached files
| file | filename |
|---|---|
| 8-K - 8-K - Fox Chase Bancorp Inc | a12-27139_18k.htm |
Exhibit 99.1
|
|
Investor Presentation November 15, 2012 |
|
|
Forward Looking Statements This presentation and the accompanying commentary may contain “forward-looking statements” that may be identified by use of such words as “believe,” “expect,” “anticipate,” “should,” “planned,” “estimated,” and “potential.” Examples of forward-looking statements include, but are not limited to, estimates with respect to our financial condition and results of operation, strategies and business that are subject to various factors that could cause actual results to differ materially from these estimates. These factors include but are not limited to general and local economic conditions, including the impact of Hurricane Sandy; changes in interest rates, deposit flows, demand for loans, real estate values, and competition; changes in accounting principles, policies, or guidelines; changes in legislation or regulation; and other economic, competitive, governmental, regulatory, and technological factors affecting our operations, pricing, products, and services. For discussion of these and other risks that may cause actual results to differ from expectations, refer to our Annual Report on Form 10-K, dated March 12, 2012 and our Quarterly Report on Form 10-Q, dated November 8, 2012, on file with the Securities and Exchange Commission, including the sections entitled “Risk Factors”. All forward-looking statements and information made herein are based on Management’s current beliefs and assumptions as of November 8, 2012 and speak only as of that date. The Company disclaims any obligation to subsequently revise any forward-looking statements to reflect events or circumstances after the date of such statements or to reflect the occurrence of anticipated or unanticipated events. |
|
|
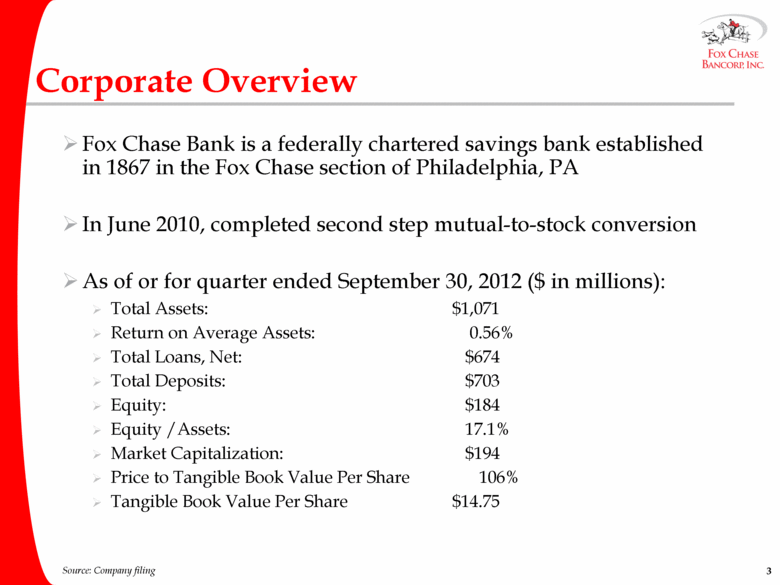
Corporate Overview Fox Chase Bank is a federally chartered savings bank established in 1867 in the Fox Chase section of Philadelphia, PA In June 2010, completed second step mutual-to-stock conversion As of or for quarter ended September 30, 2012 ($ in millions): Total Assets: $1,071 Return on Average Assets: 0.56% Total Loans, Net: $674 Total Deposits: $703 Equity: $184 Equity /Assets: 17.1% Market Capitalization: $194 Price to Tangible Book Value Per Share 106% Tangible Book Value Per Share $14.75 Source: Company filing |
|
|
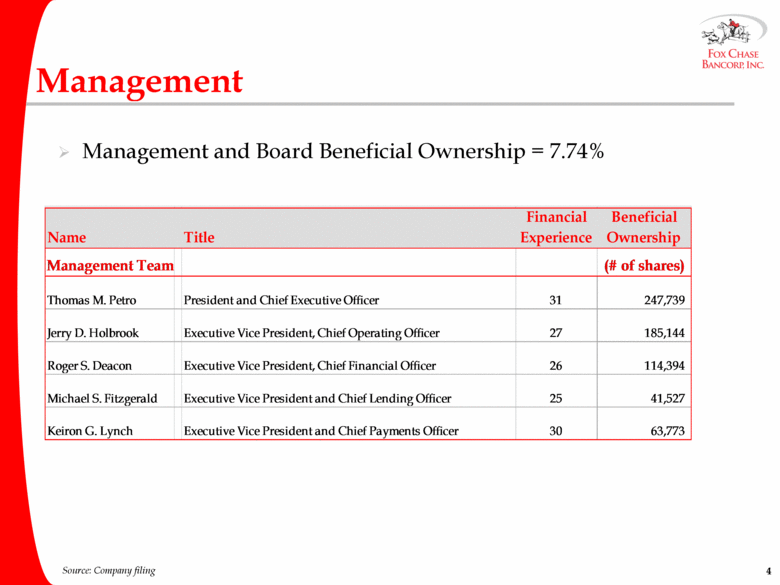
Management Management and Board Beneficial Ownership = 7.74% Name Title Financial Experience Beneficial Ownership Management Team (# of shares) Thomas M. Petro President and Chief Executive Officers 31 247,739 Jerry D. Holbrook Executive Vice President, Chief Operating Officer 27 185,144 Roger S. Deacon Executive Vice President, Chief Financial Officer 26 114,394 Michael S. Fitzgerald Executive Vice President and Chief Lending Officer 25 41,527 Keiron G. Lynch Executive Vice President and Chief Payments Officer 30 63,773 Source: Company filing |
|
|
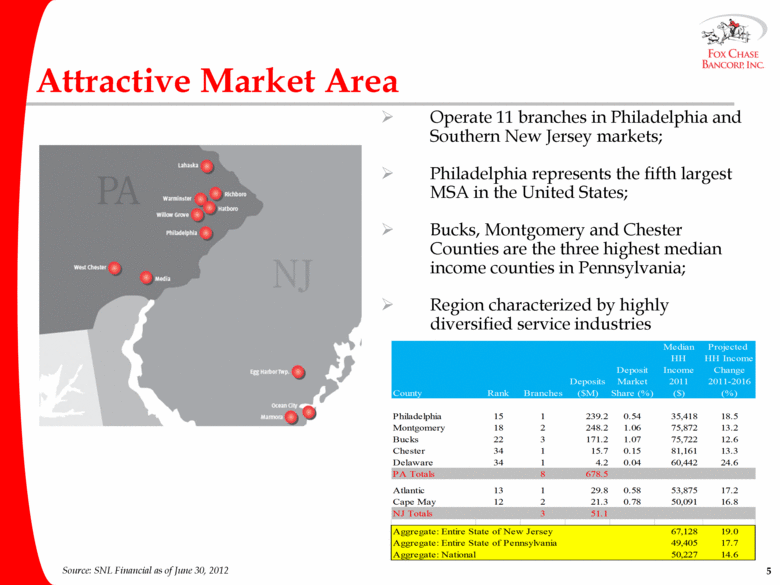
Operate 11 branches in Philadelphia and Southern New Jersey markets; Philadelphia represents the fifth largest MSA in the United States; Bucks, Montgomery and Chester Counties are the three highest median income counties in Pennsylvania; Region characterized by highly diversified service industries Attractive Market Area Source: SNL Financial as of June 30, 2012 Median Projected HH HH Income Deposit Income Change Deposits Market 2011 2011-2016 County Rank Branches ($M) Share (%) ($) (%) Philadelphia 15 1 239.2 0.54 35,418 18.5 Montgomery 18 2 248.2 1.06 75,872 13.2 Bucks 22 3 171.2 1.07 75,722 12.6 Chester 34 1 15.7 0.15 81,161 13.3 Delaware 34 1 4.2 0.04 60,442 24.6 PA Totals 8 678.5 Atlantic 13 1 29.8 0.58 53,875 17.2 Cape May 12 2 21.3 0.78 50,091 16.8 NJ Totals 3 51.1 Aggregate: Entire State of New Jersey 67,128 19.0 Aggregate: Entire State of Pennsylvania 49,405 17.7 Aggregate: National 50,227 14.6 |
|
|
Current Strategy Continue transformation to commercial bank (September 30, 2012) Improved loan mix (71% commercial loans) Increased core deposits (52% core deposits; 15% noninterest bearing) Commercial deposits were $105 million at September 30, 2012; of which $69 million were noninterest bearing Increased noninterest income to $2.5 million in 2011 from $1.5 million in 2007 (increase is commercial customer driven - unused line of credit and cash management fees) Generate greater profitability and higher quality earnings Evidenced by improved ROA, NIM and efficiency ratios Maintain strong balance sheet: Excess level of capital Appropriate reserves and credit marks |
|
|
Deployment of Capital Total Equity to Assets of 17.14% at September 30, 2012 compared to 16.60% at June 30, 2010 Capital Management Strategies Include: Organic balance sheet growth Primary focus has been Commercial Real Estate and C&I Lending CAGR of 35% since December 31, 2007 Repurchase stock Buyback programs totalling 20% of post second step shares 619,000 shares available to be purchased under active buyback programs Repurchase activity, quarter ended: March 2012 = 294k shares at $12.80 June 2012 = 167k shares at $12.98 Sept. 2012 = 172k shares at $14.86 Cash dividends Paid dividend of $0.04 per share per quarter in 2012 |
|
|
Current Market Conditions Net Interest Margin under pressure Sustained period of historically low rates; economic recovery is slow Yields on assets repricing faster than rates on liabilities – primarily due to relatively high cash flows and paydowns on all asset classes Competitive pressures Loan demand Pricing and structure Increased compliance, regulatory and SEC related costs |
|
|
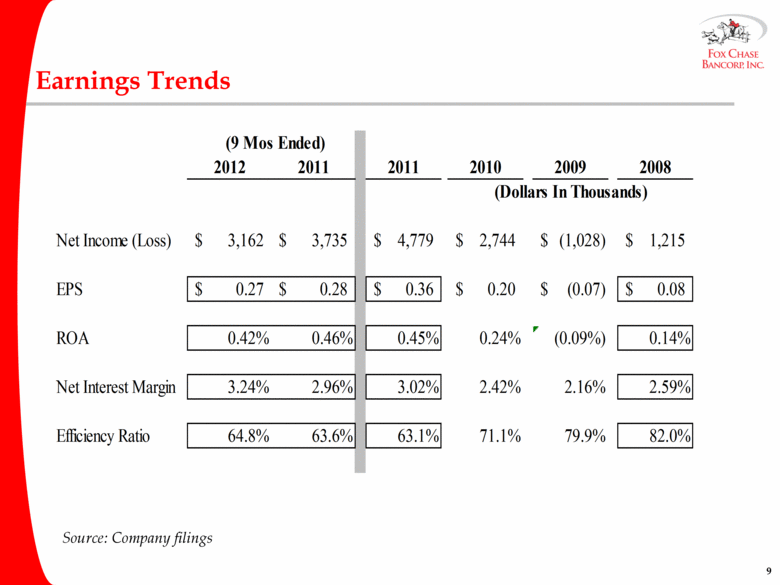
Earnings Trends (9 Mos Ended) 2012 2011 2011 2010 2009 2008 Net Income (Loss) 3,162 $ 3,735 $ 4,779 $ 2,744 $ (1,028) $ 1,215 $ EPS 0.27 $ 0.28 $ 0.36 $ 0.20 $ (0.07) $ 0.08 $ ROA 0.42% 0.46% 0.45% 0.24% 0.14% Net Interest Margin 3.24% 2.96% 3.02% 2.42% 2.16% 2.59% Efficiency Ratio 64.8% 63.6% 63.1% 71.1% 79.9% 82.0% Source: Company filings (0.09%) (Dollars In Thousands) |
|
|
Fox Chase Bancorp, Inc. Quarterly Financial Performance Graphs |
|
|
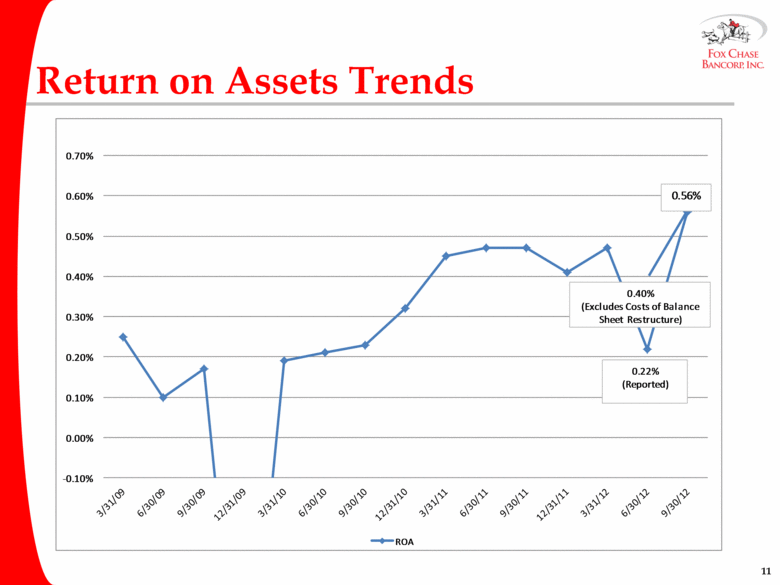
Return on Assets Trends -0.10% 0.00% 0.10% 0.20% 0.30% 0.40% 0.50% 0.60% 0.70% ROA 0.22% (Reported) 0.56% 0.40% (Excludes Costs of Balance Sheet Restructure) |
|
|
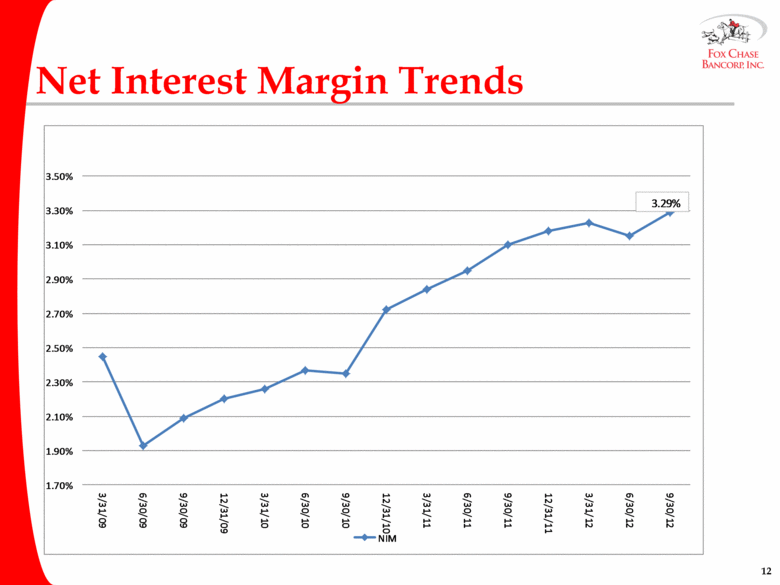
Net Interest Margin Trends 1.70% 1.90% 2.10% 2.30% 2.50% 2.70% 2.90% 3.10% 3.30% 3.50% 3/31/09 6/30/09 9/30/09 12/31/09 3/31/10 6/30/10 9/30/10 12/31/10 3/31/11 6/30/11 9/30/11 12/31/11 3/31/12 6/30/12 9/30/12 NIM 3.29% |
|
|
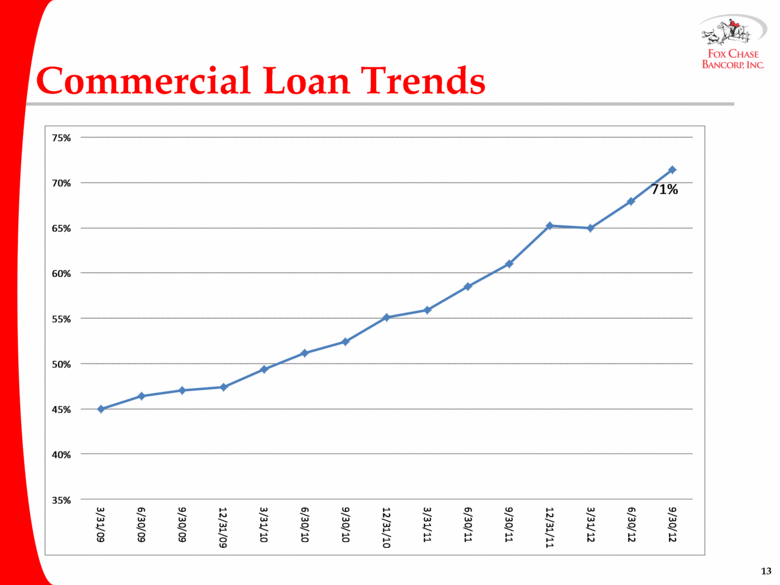
Commercial Loan Trends 35% 40% 45% 50% 55% 60% 65% 70% 75% 3/31/09 6/30/09 9/30/09 12/31/09 3/31/10 6/30/10 9/30/10 12/31/10 3/31/11 6/30/11 9/30/11 12/31/11 3/31/12 6/30/12 9/30/12 71% |
|
|
Why Invest in FXCB? September 30, 2012 stock price of $15.62, price is 106% of tangible book value per share; Successful transformation to commercial bank platform; Long term positive trend in key financial metrics; Return on Assets Net Interest Margin Efficiency Ratio Loan Portfolio – Commercial Loan Mix Increase in Core Deposits Stabilized credit performance |
|
|
Fox Chase Bancorp, Inc. Questions and Answers |

