Attached files
| file | filename |
|---|---|
| 8-K - COPANO ENERGY, L.L.C. FORM 8-K - Copano Energy, L.L.C. | form8-k.htm |
| EX-99.2 - COPANO ENERGY, L.L.C. PRESS RELEASE - Copano Energy, L.L.C. | ex99-2.htm |
Exhibit 99.1
* 2012 RBC Capital Markets MLP Conference November 15-16, 2012 NASDAQ: CPNO
* Disclaimer Forward-Looking Statements This presentation includes “forward-looking statements,” as defined in the federal securities laws. Statements that address activities or events that Copano believes will or may occur in the future are forward-looking statements. These statements include, but are not limited to, statements about future producer activity or management’s expectations regarding Copano’s capital projects, cash flow or contract mix. These statements are based on management’s experience and perception of historical trends, current conditions, expected future developments and other factors management believes are reasonable. Important factors that could cause actual results to differ materially from those in forward-looking statements include the following risks and uncertainties, many of which are beyond Copano’s control: the volatility of prices and market demand for natural gas and natural gas liquids; Copano’s ability to continue to connect new sources of natural gas, crude oil and condensate, and the NGL content of new gas supplies; the impact on volumes and resulting cash flow of technological, economic and other uncertainties inherent in estimating future production; producers’ ability to drill and successfully complete and connect new natural gas supplies; Copano’s ability to attract and retain key customers; performance by producers, customers and service providers under their contracts with Copano; the availability of downstream transportation and other facilities for natural gas and NGLs; operational risks affecting the performance of Copano or third-party processing, fractionation plants and other facilities; Copano’s ability to access or construct new processing, fractionation and transportation capacity; higher construction costs or project delays due to inflation, limited availability of required resources, or the effects of operational, legal or other uncertainties; general economic conditions; the effects of government regulations and policies; and other financial, operational and legal risks and uncertainties detailed from time to time in Copano’s quarterly and annual reports filed with the Securities and Exchange Commission. Copano undertakes no obligation to update any forward-looking statements, whether as a result of new information or future events.
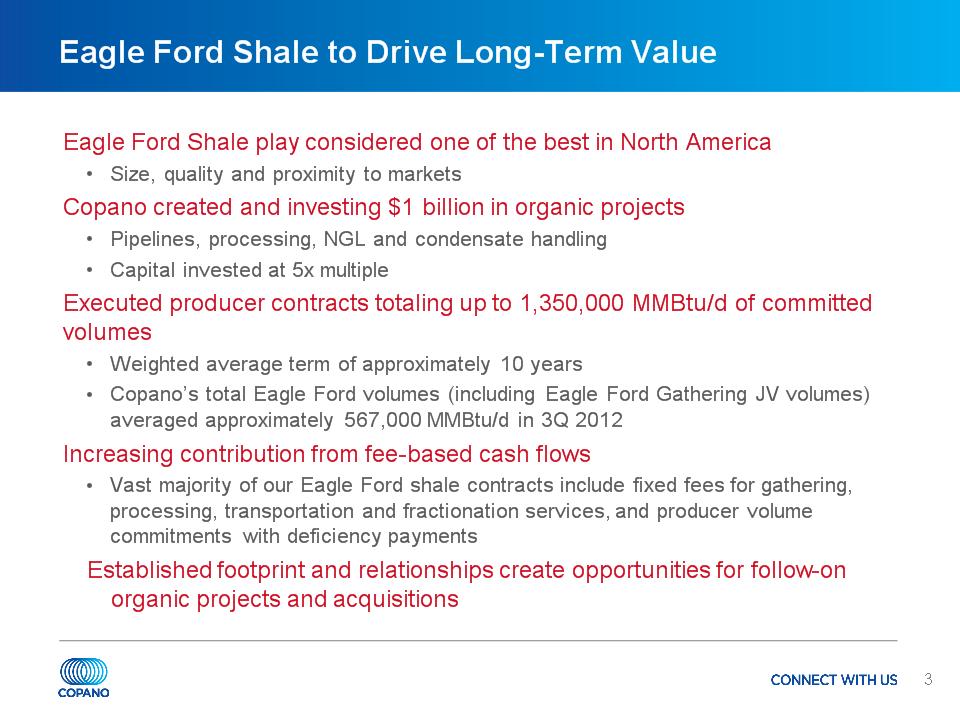
* Eagle Ford Shale to Drive Long-Term Value Eagle Ford Shale play considered one of the best in North America Size, quality and proximity to markets Copano created and investing $1 billion in organic projects Pipelines, processing, NGL and condensate handling Capital invested at 5x multiple Executed producer contracts totaling up to 1,350,000 MMBtu/d of committed volumes Weighted average term of approximately 10 years Copano’s total Eagle Ford volumes (including Eagle Ford Gathering JV volumes) averaged approximately 567,000 MMBtu/d in 3Q 2012 Increasing contribution from fee-based cash flows Vast majority of our Eagle Ford shale contracts include fixed fees for gathering, processing, transportation and fractionation services, and producer volume commitments with deficiency payments Established footprint and relationships create opportunities for follow-on organic projects and acquisitions
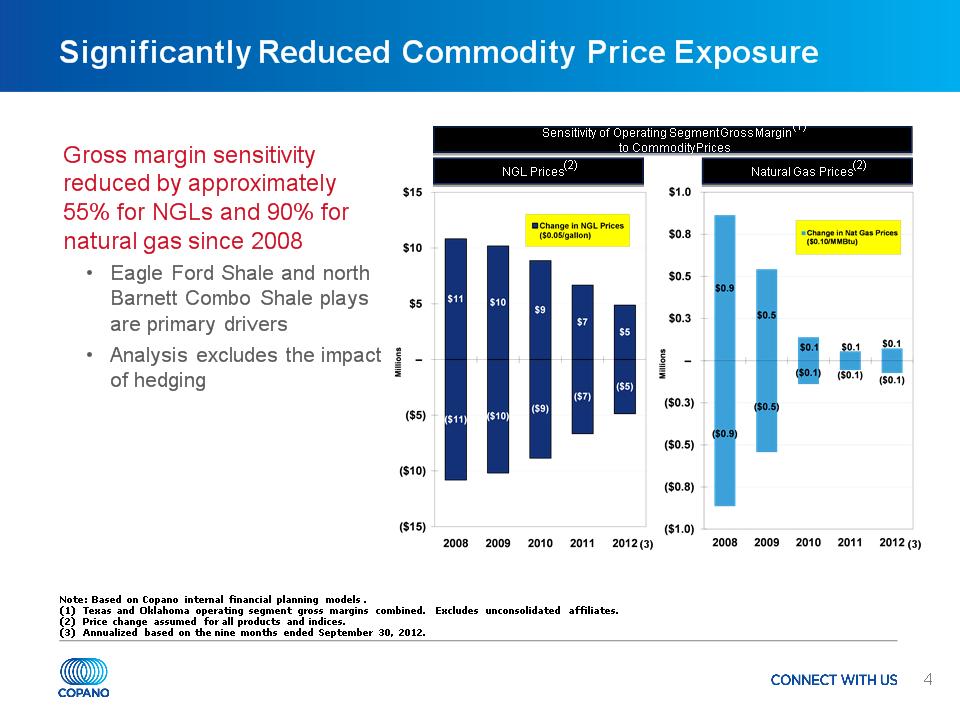
* Significantly Reduced Commodity Price Exposure Note: Based on Copano internal financial planning models. (1) Texas and Oklahoma operating segment gross margins combined. Excludes unconsolidated affiliates. (2) Price change assumed for all products and indices. (3) Annualized based on the nine months ended September 30, 2012. Gross margin sensitivity reduced by approximately 55% for NGLs and 90% for natural gas since 2008 Eagle Ford Shale and north Barnett Combo Shale plays are primary drivers Analysis excludes the impact of hedging NGL Prices(2) Natural Gas Prices(2) (3) (3) Sensitivity of Operating Segment Gross Margin(1) to Commodity Prices
* Organic Projects – Texas & Oklahoma Business Segment Updates Finance & Commodity Risk Management Agenda Organic Projects Texas & Oklahoma Business Segment Updates Finance & Commodity Risk Management
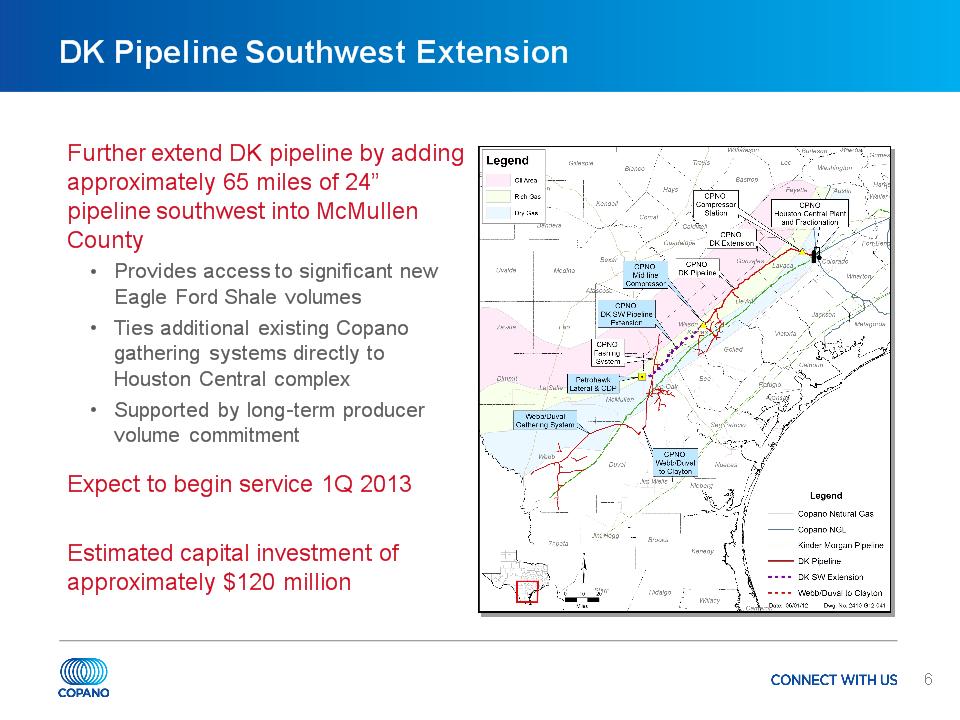
* DK Pipeline Southwest Extension Further extend DK pipeline by adding approximately 65 miles of 24” pipeline southwest into McMullen County Provides access to significant new Eagle Ford Shale volumes Ties additional existing Copano gathering systems directly to Houston Central complex Supported by long-term producer volume commitment Expect to begin service 1Q 2013 Estimated capital investment of approximately $120 million
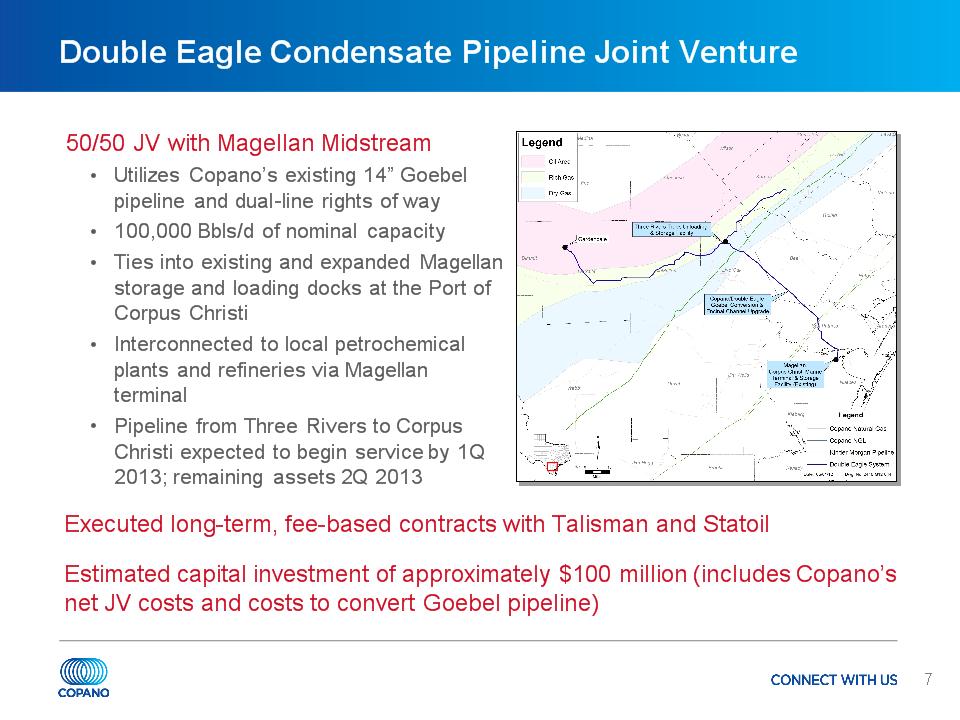
* Double Eagle Condensate Pipeline Joint Venture 50/50 JV with Magellan Midstream Utilizes Copano’s existing 14” Goebel pipeline and dual-line rights of way 100,000 Bbls/d of nominal capacity Ties into existing and expanded Magellan storage and loading docks at the Port of Corpus Christi Interconnected to local petrochemical plants and refineries via Magellan terminal Pipeline from Three Rivers to Corpus Christi expected to begin service by 1Q 2013; remaining assets 2Q 2013 Executed long-term, fee-based contracts with Talisman and Statoil Estimated capital investment of approximately $100 million (includes Copano’s net JV costs and costs to convert Goebel pipeline)
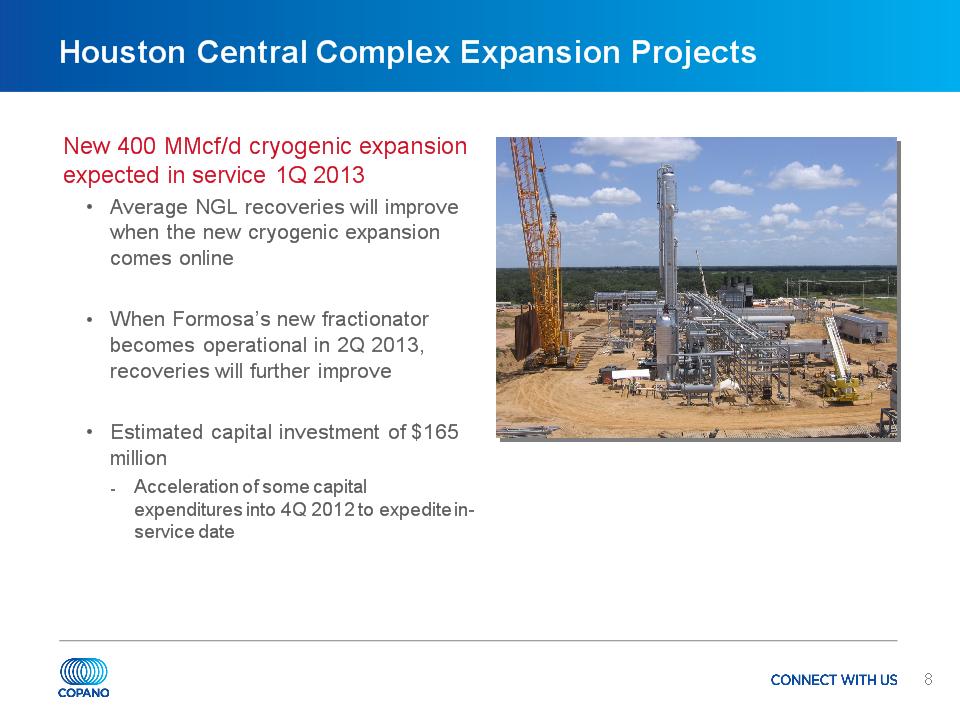
* Houston Central Complex Expansion Projects New 400 MMcf/d cryogenic expansion expected in service 1Q 2013 Average NGL recoveries will improve when the new cryogenic expansion comes online When Formosa’s new fractionator becomes operational in 2Q 2013, recoveries will further improve Estimated capital investment of $165 million Acceleration of some capital expenditures into 4Q 2012 to expedite in-service date
* Houston Central Complex Expansion Projects Second 400 MMcf/d cryogenic expansion further enhances NGL recoveries when placed in service in mid-2014 Supported by long-term producer contracts and higher recovery rates In May, executed long-term, firm commitment for 125,000 MMBtu/d from major producer In October, expanded and extended producer contract under 10-year volume commitment; expected to fill remaining capacity in this cryogenic expansion with peak volumes of 300,000 MMBtu/d Expected capital investment of $190 million at a 5x multiple Following second cryogenic expansion, Copano will have 1 Bcf/d of highly efficient processing capacity backed by long-term producer commitments Key driver to creating long-term unitholder value from Eagle Ford Shale play
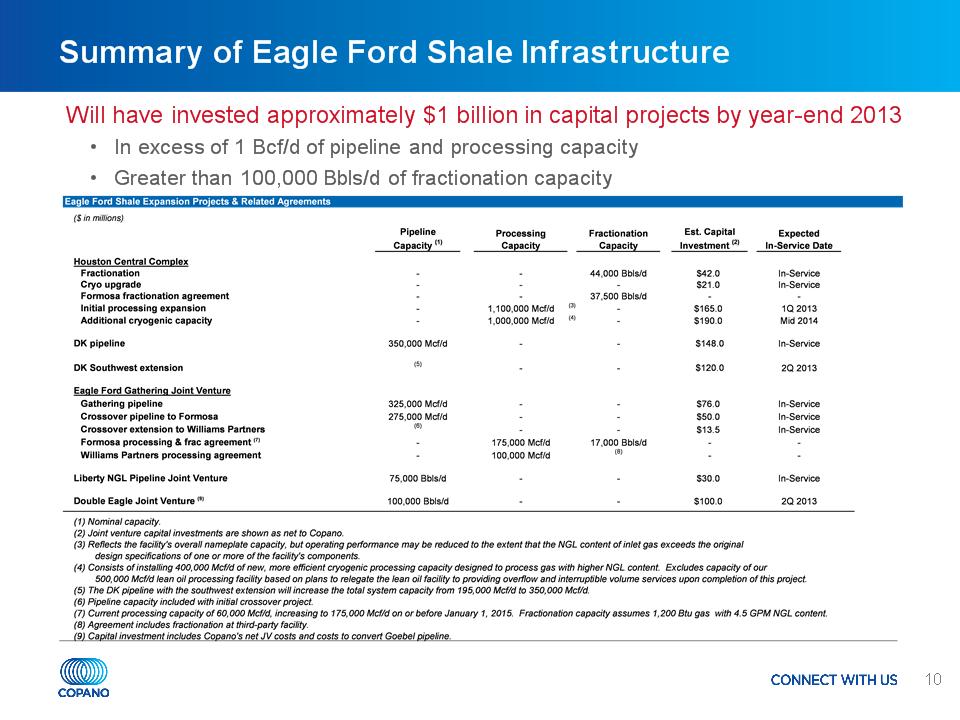
* Summary of Eagle Ford Shale Infrastructure Will have invested approximately $1 billion in capital projects by year-end 2013 In excess of 1 Bcf/d of pipeline and processing capacity Greater than 100,000 Bbls/d of fractionation capacity
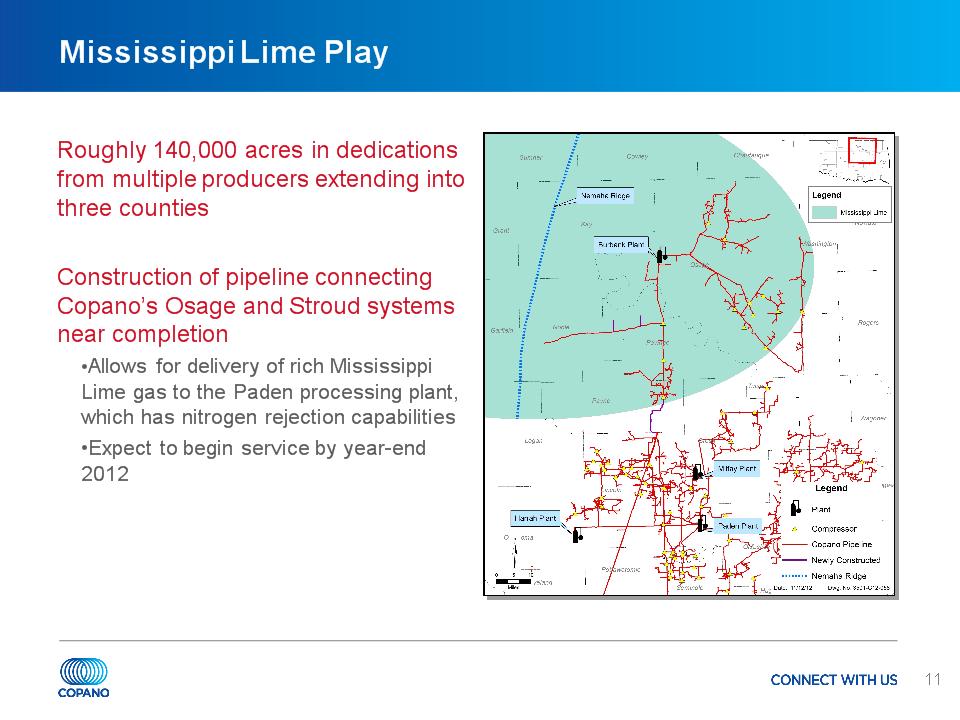
* Mississippi Lime Play Roughly 140,000 acres in dedications from multiple producers extending into three counties Construction of pipeline connecting Copano’s Osage and Stroud systems near completion Allows for delivery of rich Mississippi Lime gas to the Paden processing plant, which has nitrogen rejection capabilities Expect to begin service by year-end 2012
* Organic Projects – Texas & Oklahoma Business Segment Updates Finance & Commodity Risk Management Agenda Organic Projects Texas & Oklahoma Business Segment Updates Finance & Commodity Risk Management
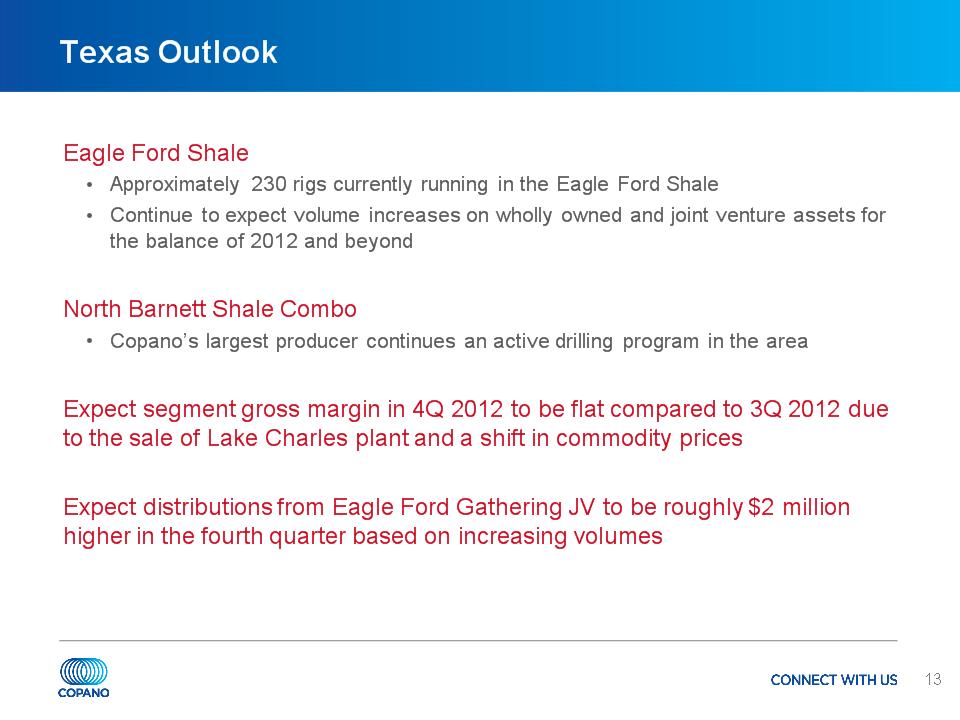
* Texas Outlook Eagle Ford Shale Approximately 230 rigs currently running in the Eagle Ford Shale Continue to expect volume increases on wholly owned and joint venture assets for the balance of 2012 and beyond North Barnett Shale Combo Copano’s largest producer continues an active drilling program in the area Expect segment gross margin in 4Q 2012 to be flat compared to 3Q 2012 due to the sale of Lake Charles plant and a shift in commodity prices Expect distributions from Eagle Ford Gathering JV to be roughly $2 million higher in the fourth quarter based on increasing volumes
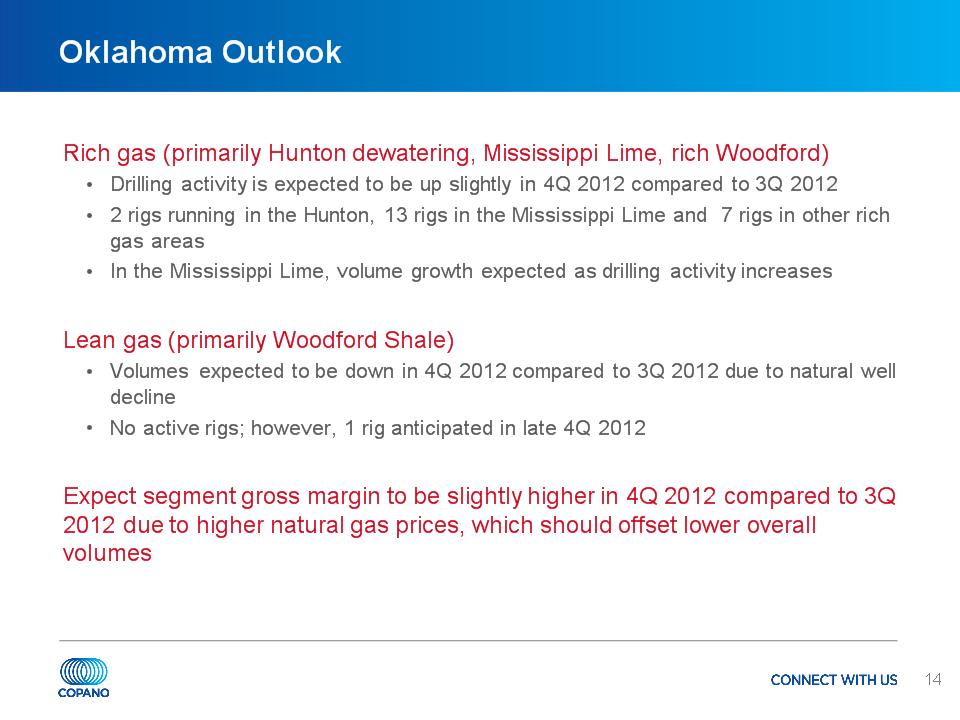
* Oklahoma Outlook Rich gas (primarily Hunton dewatering, Mississippi Lime, rich Woodford) Drilling activity is expected to be up slightly in 4Q 2012 compared to 3Q 2012 2 rigs running in the Hunton, 13 rigs in the Mississippi Lime and 7 rigs in other rich gas areas In the Mississippi Lime, volume growth expected as drilling activity increases Lean gas (primarily Woodford Shale) Volumes expected to be down in 4Q 2012 compared to 3Q 2012 due to natural well decline No active rigs; however, 1 rig anticipated in late 4Q 2012 Expect segment gross margin to be slightly higher in 4Q 2012 compared to 3Q 2012 due to higher natural gas prices, which should offset lower overall volumes
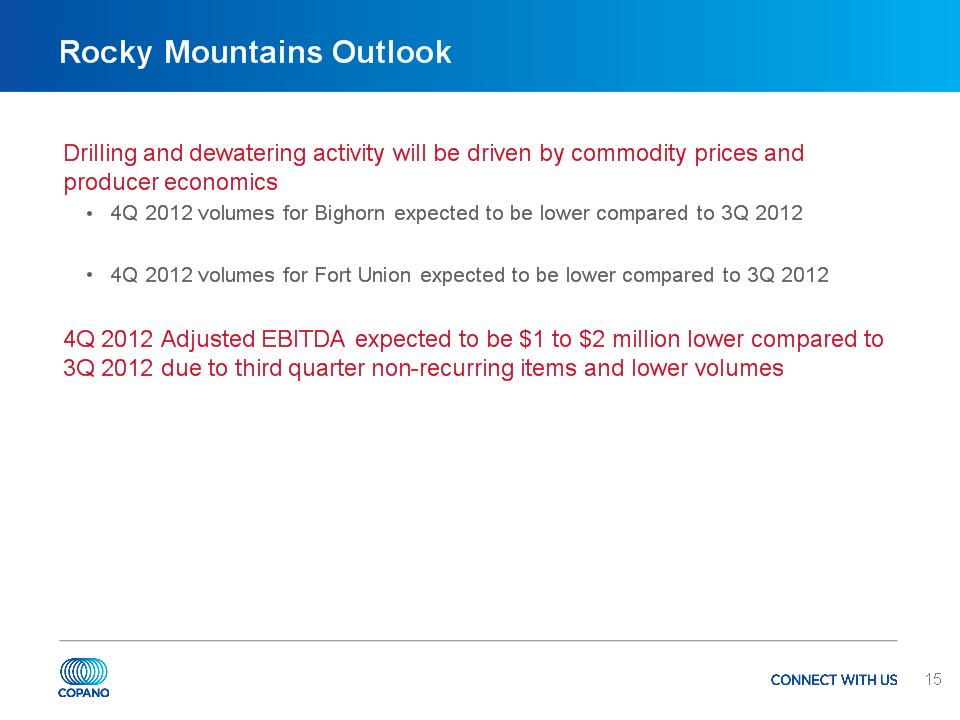
* Rocky Mountains Outlook Drilling and dewatering activity will be driven by commodity prices and producer economics 4Q 2012 volumes for Bighorn expected to be lower compared to 3Q 2012 4Q 2012 volumes for Fort Union expected to be lower compared to 3Q 2012 4Q 2012 Adjusted EBITDA expected to be $1 to $2 million lower compared to 3Q 2012 due to third quarter non-recurring items and lower volumes
* Organic Projects – Texas & Oklahoma Business Segment Updates Finance & Commodity Risk Management Agenda Organic Projects Texas & Oklahoma Business Segment Updates Finance & Commodity Risk Management
* Recent Equity Offering October 2012 equity offering Issued approximately 6.5 million common units at $32.13 per unit Approximately $200 million in net proceeds Proceeds used to reduce revolver borrowings Enhances balance sheet and liquidity available to fund expansion capex Pro forma total leverage of approximately 3.7x at September 30, 2012
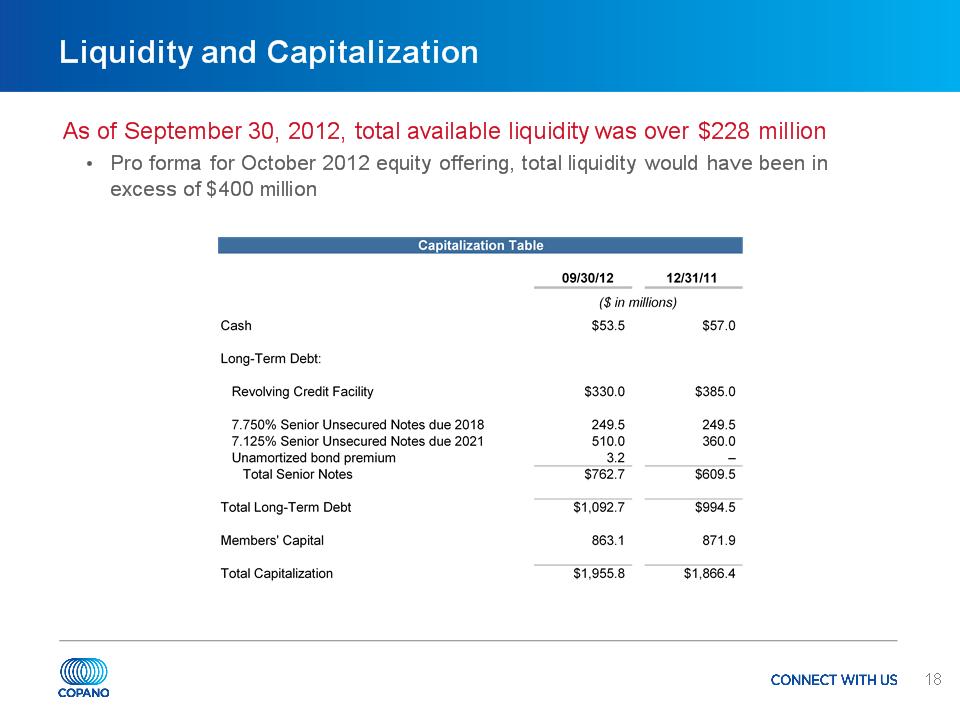
* Liquidity and Capitalization As of September 30, 2012, total available liquidity was over $228 million Pro forma for October 2012 equity offering, total liquidity would have been in excess of $400 million
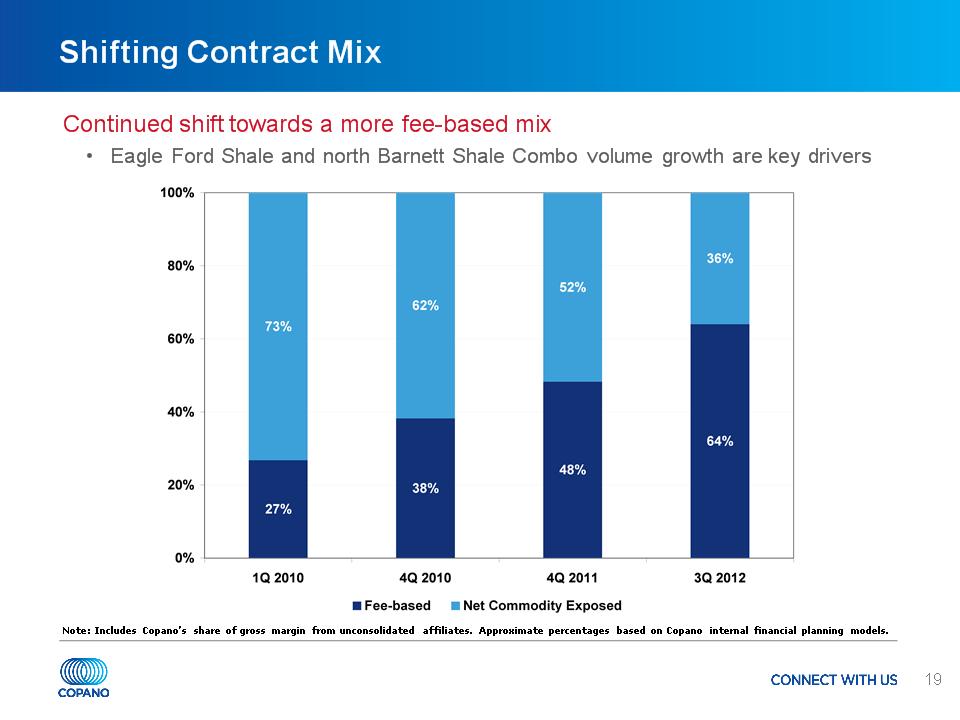
* Shifting Contract Mix Continued shift towards a more fee-based mix Eagle Ford Shale and north Barnett Shale Combo volume growth are key drivers Note: Includes Copano’s share of gross margin from unconsolidated affiliates. Approximate percentages based on Copano internal financial planning models.
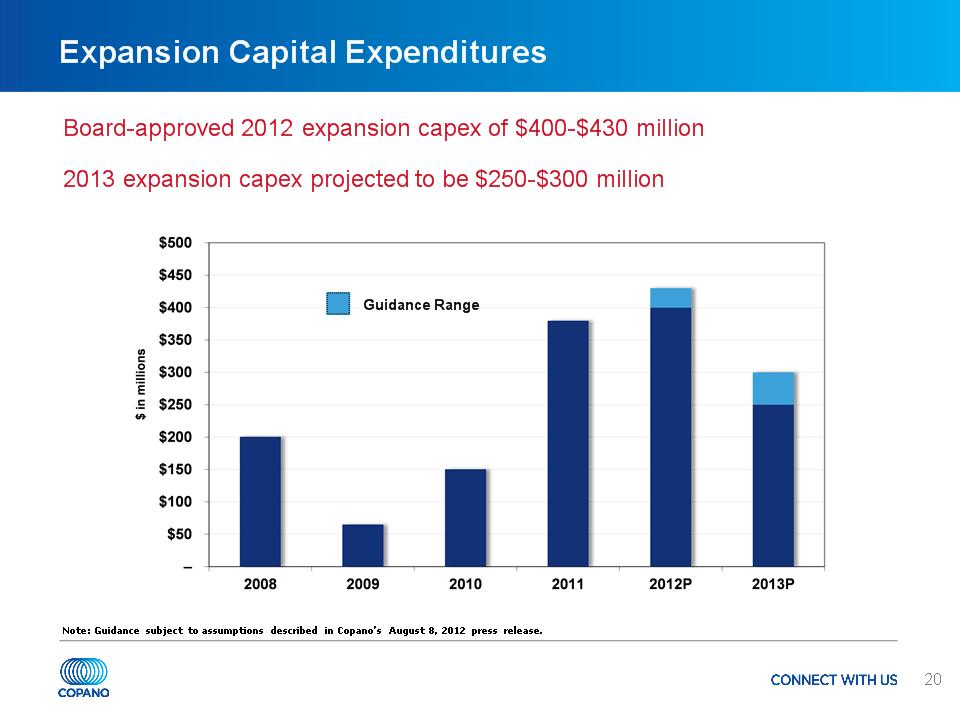
* Expansion Capital Expenditures Board-approved 2012 expansion capex of $400-$430 million 2013 expansion capex projected to be $250-$300 million Guidance Range Note: Guidance subject to assumptions described in Copano’s August 8, 2012 press release.
* Hedging Strategy Continued shift towards a more fee-based contract mix Reliance on hedging will decrease as contract mix changes over time 2012 hedged near policy limits for all products except ethane Approximately 90% of propane, butane, natural gasoline and condensate exposure hedged Approximately 40% of ethane exposure hedged 2013 hedged near policy limits for all products except ethane Between 70% and 90% of propane, butane, natural gasoline and condensate exposure hedged Used ethane swaps and natural gas calls to hedge ethane fractionation spread 2014 hedging positions continue to be added Approximately 25% of condensate exposure hedged
* Appendix
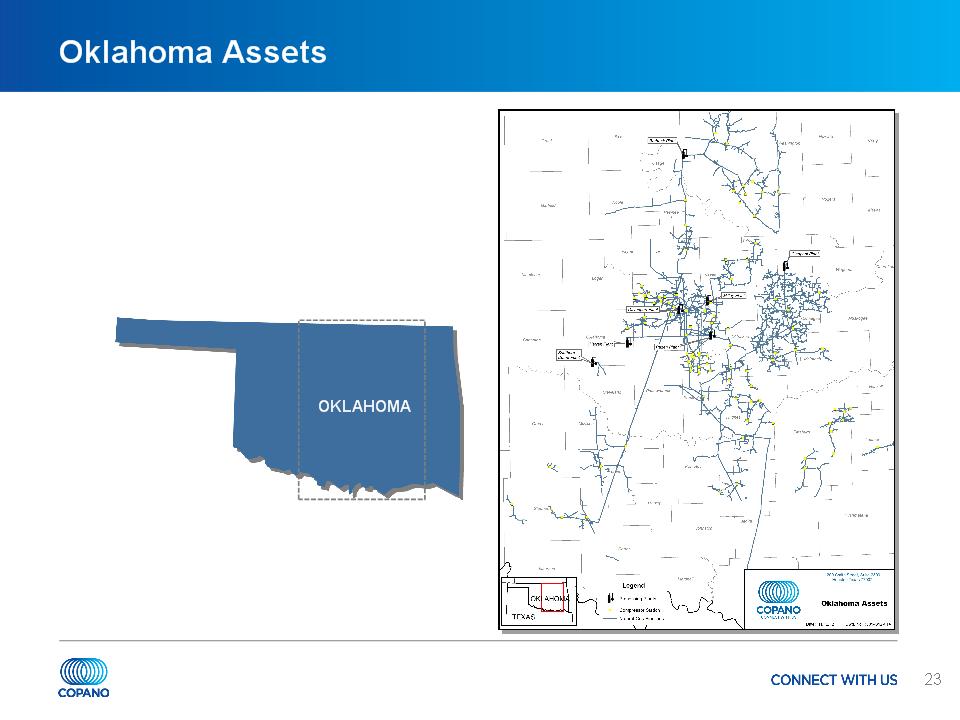
* Oklahoma Assets OKLAHOMA
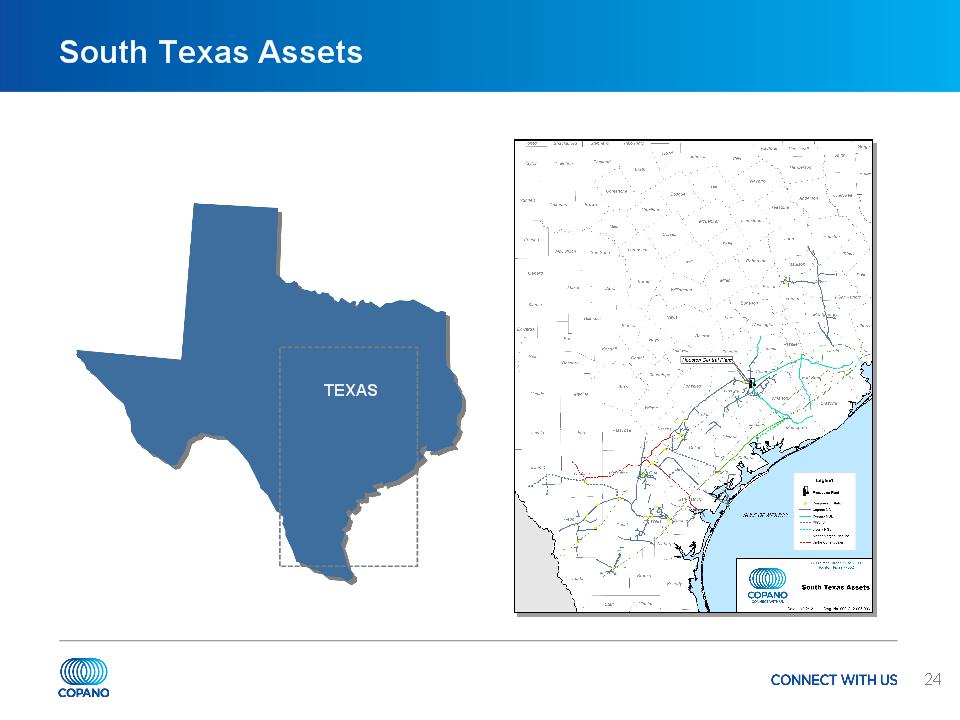
* South Texas Assets OKLAHOMA TEXAS
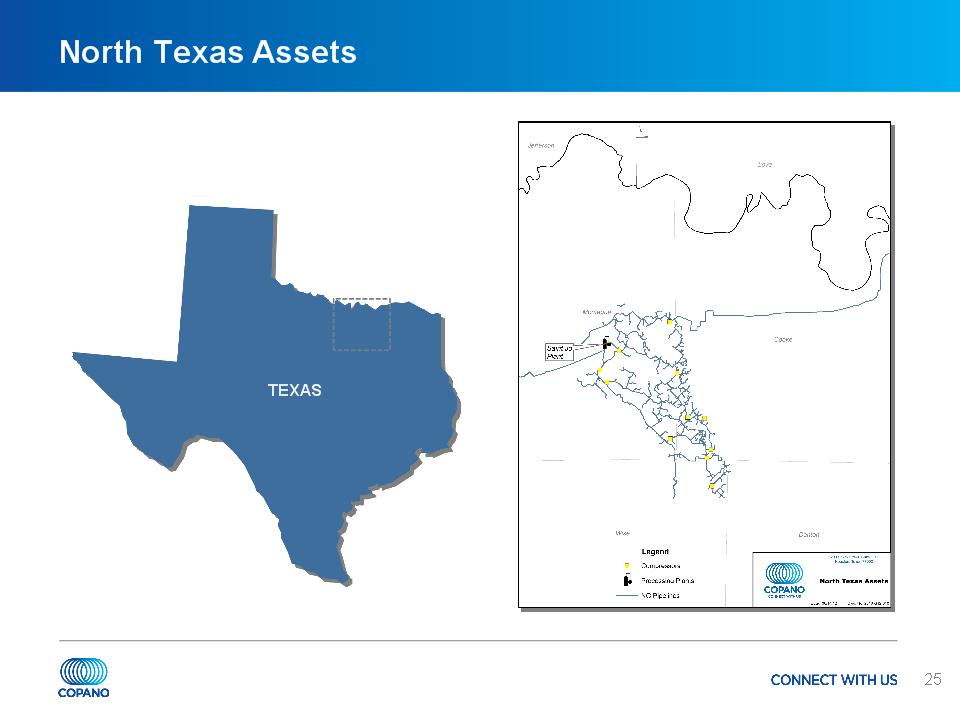
* North Texas Assets TEXAS
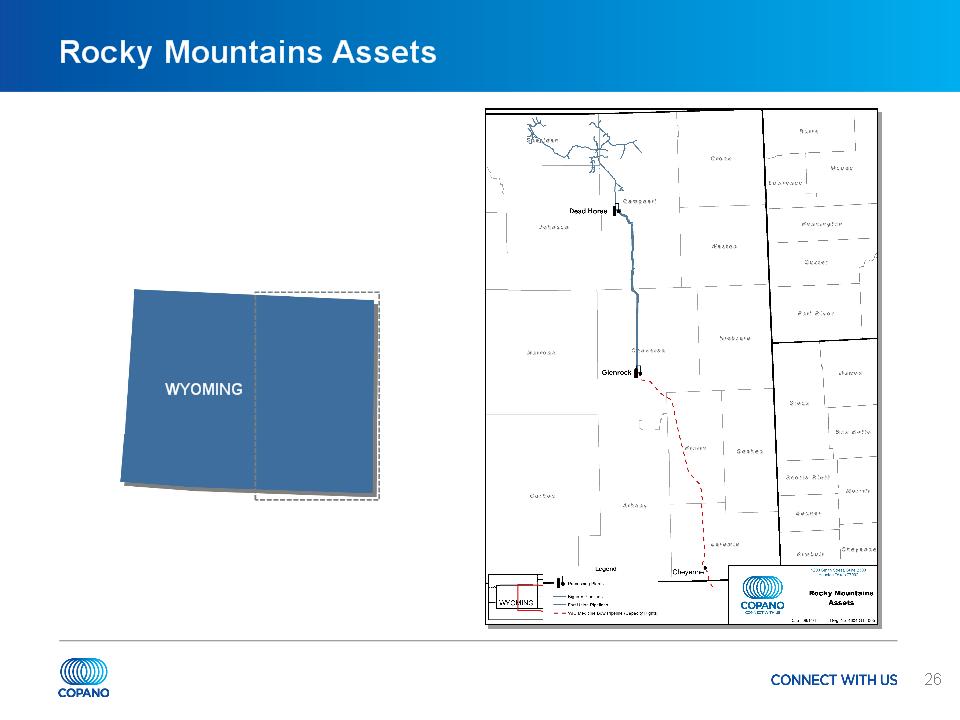
* Rocky Mountains Assets WYOMING
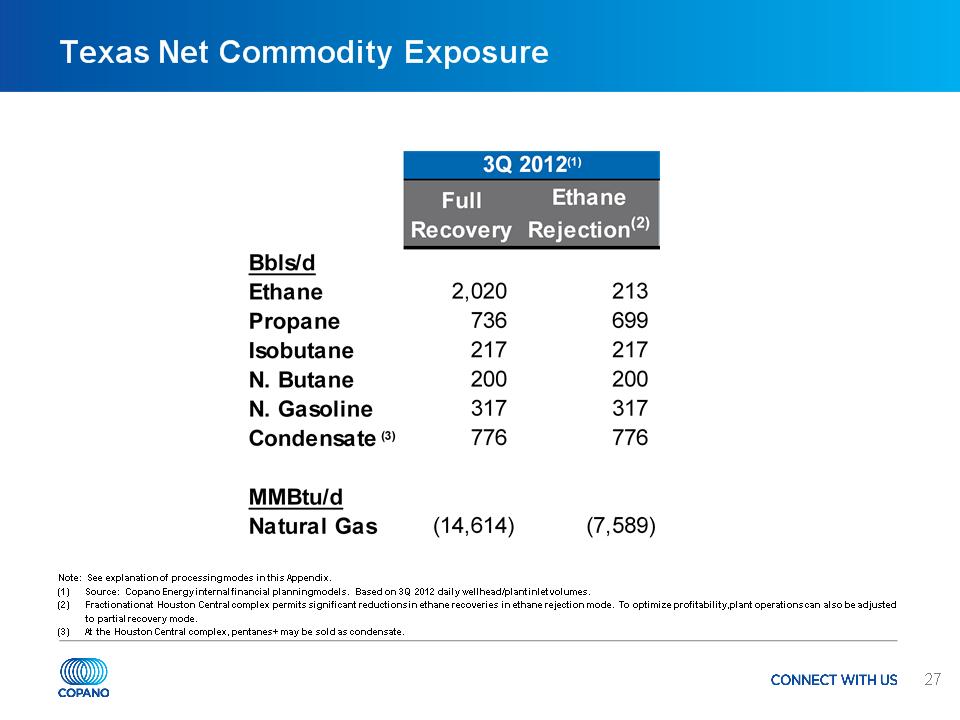
* Texas Net Commodity Exposure Note: See explanation of processing modes in this Appendix. (1) Source: Copano Energy internal financial planning models. Based on 3Q 2012 daily wellhead/plant inlet volumes. (2) Fractionation at Houston Central complex permits significant reductions in ethane recoveries in ethane rejection mode. To optimize profitability, plant operations can also be adjusted to partial recovery mode. (3) At the Houston Central complex, pentanes+ may be sold as condensate.
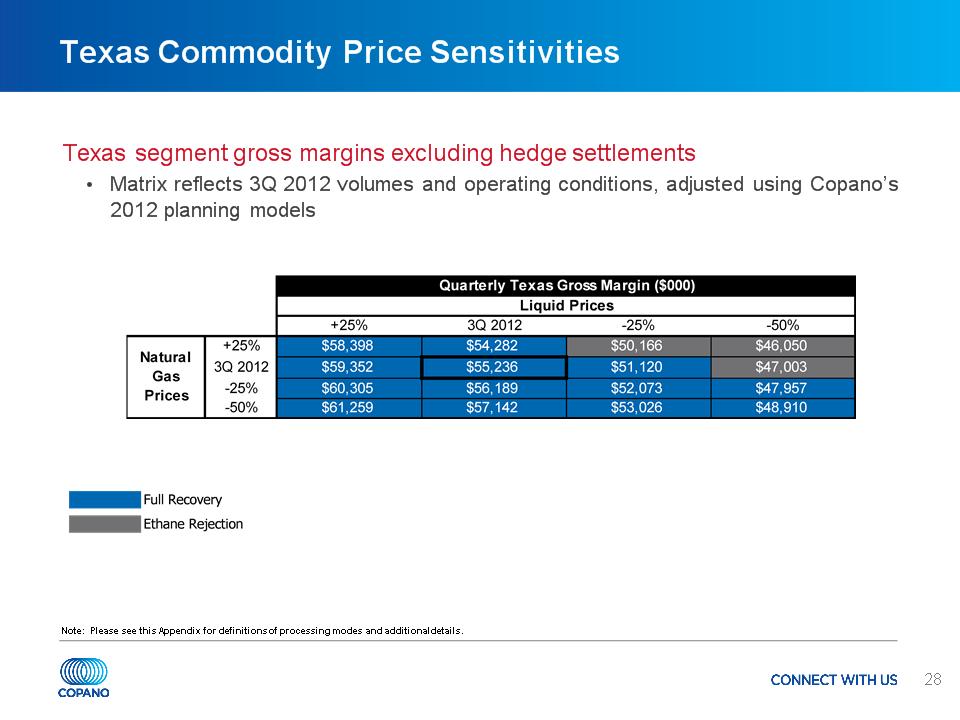
* Texas Commodity Price Sensitivities Texas segment gross margins excluding hedge settlements Matrix reflects 3Q 2012 volumes and operating conditions, adjusted using Copano’s 2012 planning models Note: Please see this Appendix for definitions of processing modes and additional details.
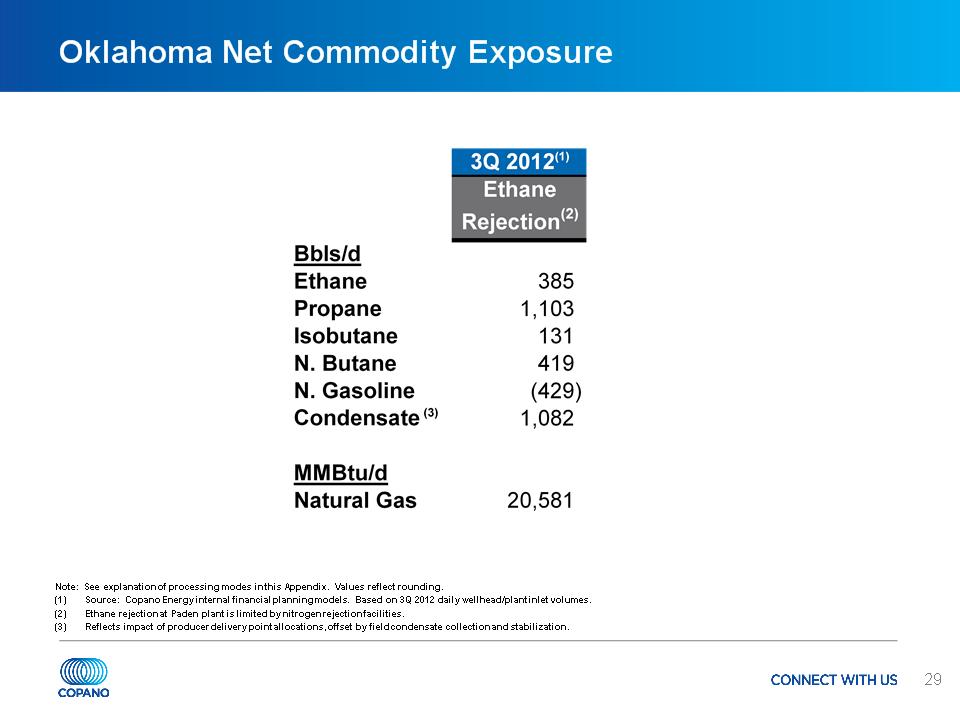
* Oklahoma Net Commodity Exposure Note: See explanation of processing modes in this Appendix. Values reflect rounding. (1) Source: Copano Energy internal financial planning models. Based on 3Q 2012 daily wellhead/plant inlet volumes. (2) Ethane rejection at Paden plant is limited by nitrogen rejection facilities. (3) Reflects impact of producer delivery point allocations, offset by field condensate collection and stabilization.
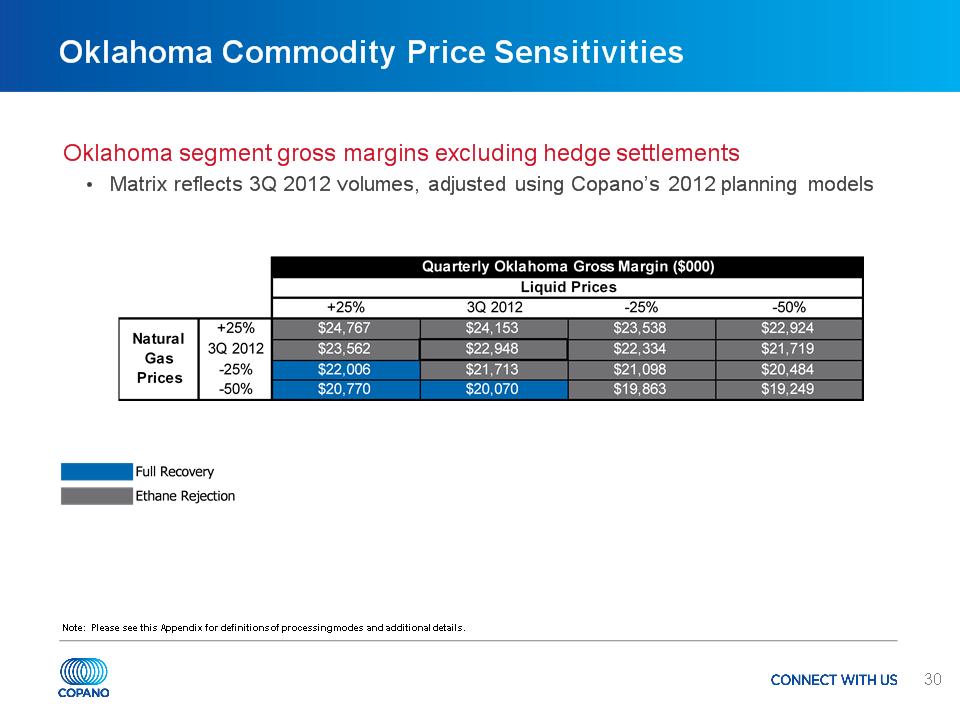
* Oklahoma Commodity Price Sensitivities Oklahoma segment gross margins excluding hedge settlements Matrix reflects 3Q 2012 volumes, adjusted using Copano’s 2012 planning models Note: Please see this Appendix for definitions of processing modes and additional details.
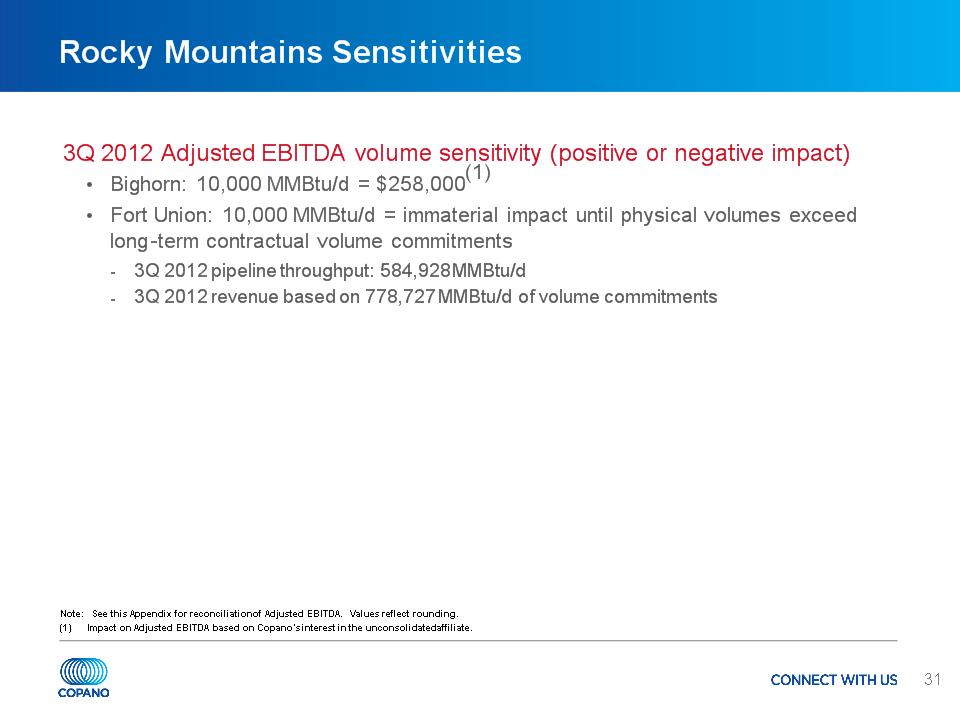
* Rocky Mountains Sensitivities 3Q 2012 Adjusted EBITDA volume sensitivity (positive or negative impact) Bighorn: 10,000 MMBtu/d = $258,000(1) Fort Union: 10,000 MMBtu/d = immaterial impact until physical volumes exceed long-term contractual volume commitments 3Q 2012 pipeline throughput: 584,928 MMBtu/d 3Q 2012 revenue based on 778,727 MMBtu/d of volume commitments Note: See this Appendix for reconciliation of Adjusted EBITDA. Values reflect rounding. (1) Impact on Adjusted EBITDA based on Copano’s interest in the unconsolidated affiliate.
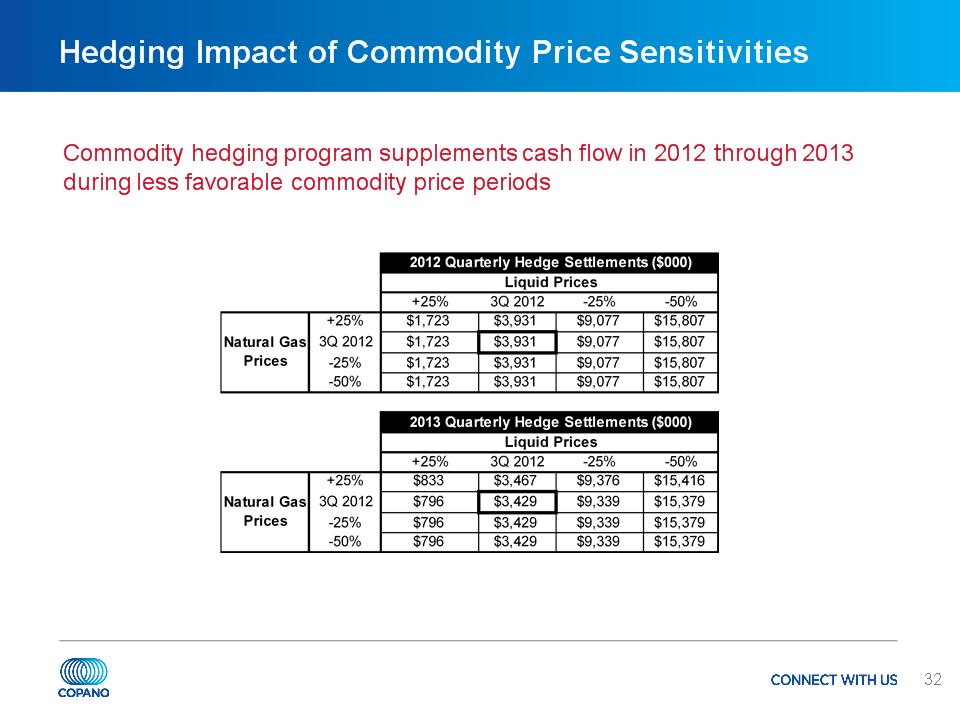
* Hedging Impact of Commodity Price Sensitivities Commodity hedging program supplements cash flow in 2012 through 2013 during less favorable commodity price periods
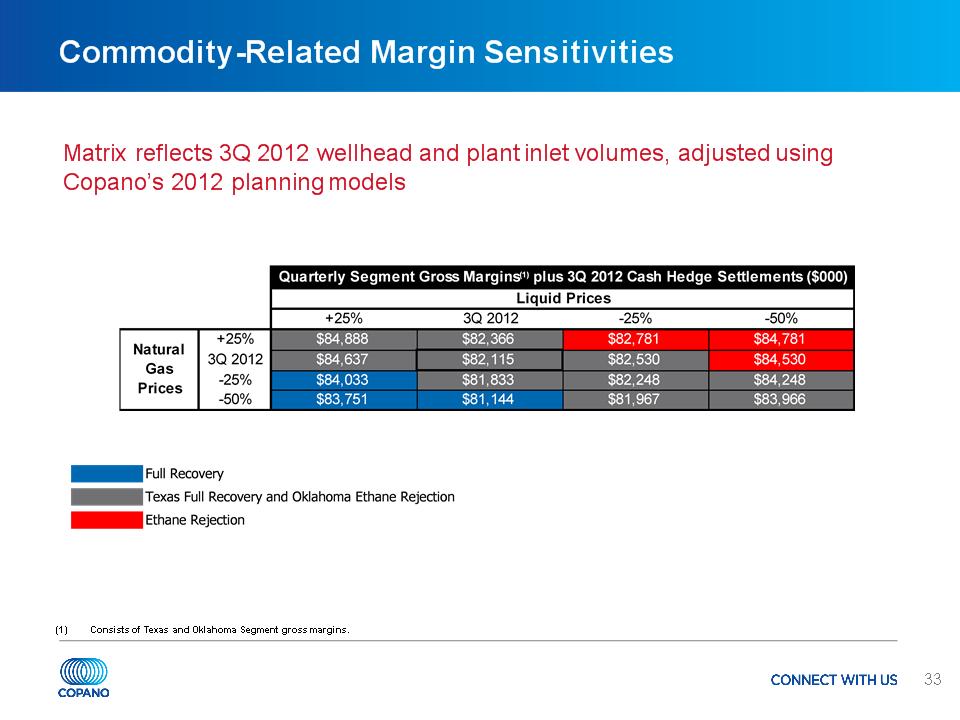
* Commodity-Related Margin Sensitivities Matrix reflects 3Q 2012 wellhead and plant inlet volumes, adjusted using Copano’s 2012 planning models (1) Consists of Texas and Oklahoma Segment gross margins.
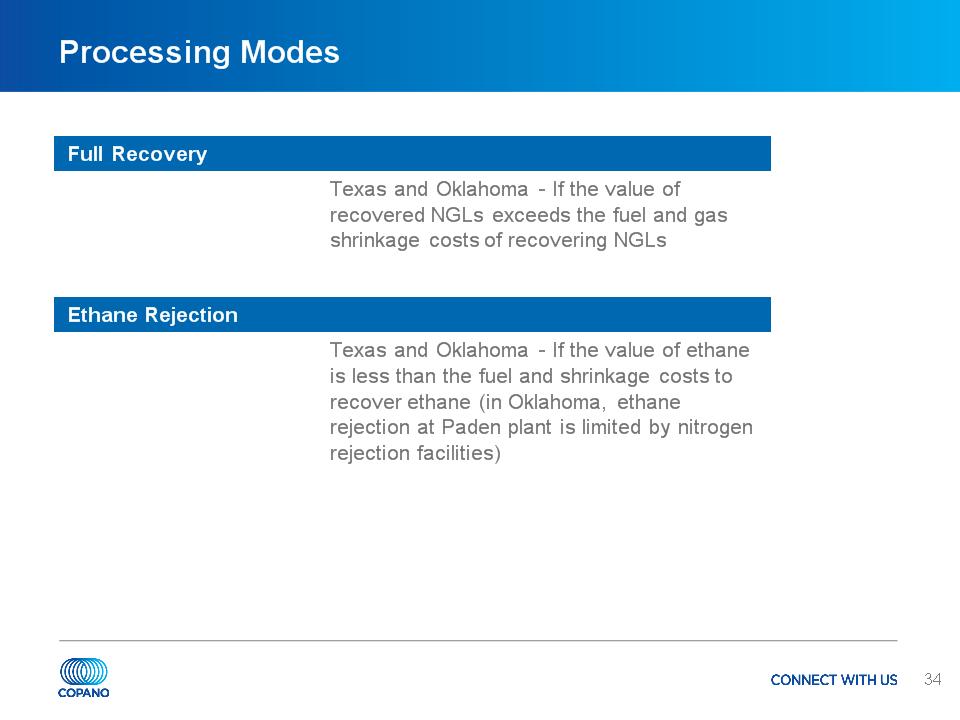
* Processing Modes Full Recovery Texas and Oklahoma – If the value of recovered NGLs exceeds the fuel and gas shrinkage costs of recovering NGLs Ethane Rejection Texas and Oklahoma – If the value of ethane is less than the fuel and shrinkage costs to recover ethane (in Oklahoma, ethane rejection at Paden plant is limited by nitrogen rejection facilities)
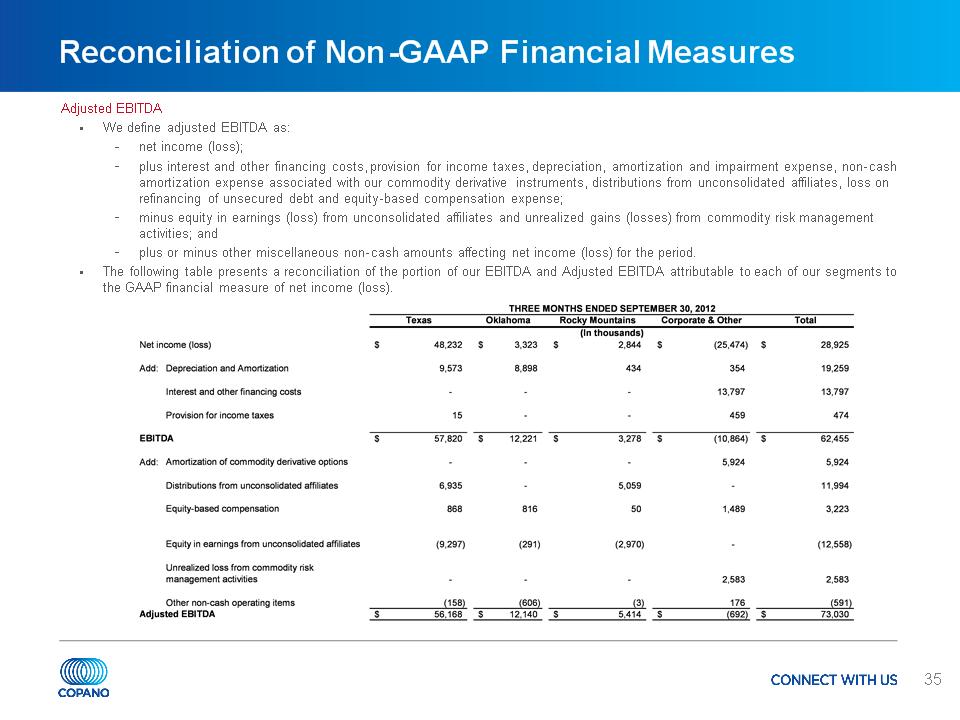
* Reconciliation of Non-GAAP Financial Measures Adjusted EBITDA We define adjusted EBITDA as: net income (loss); plus interest and other financing costs, provision for income taxes, depreciation, amortization and impairment expense, non-cash amortization expense associated with our commodity derivative instruments, distributions from unconsolidated affiliates, loss on refinancing of unsecured debt and equity-based compensation expense; minus equity in earnings (loss) from unconsolidated affiliates and unrealized gains (losses) from commodity risk management activities; and plus or minus other miscellaneous non-cash amounts affecting net income (loss) for the period. The following table presents a reconciliation of the portion of our EBITDA and Adjusted EBITDA attributable to each of our segments to the GAAP financial measure of net income (loss).