Attached files
| file | filename |
|---|---|
| 8-K - FORM 8-K - BANCORPSOUTH INC | d438936d8k.htm |
 BancorpSouth, Inc.
Investor Presentation
November 2012
Exhibit 99.1 |
 Forward Looking Information
2
Certain statements contained in this presentation and the accompanying slides may not be based on
historical facts and are “forward-looking statements” within the meaning of
Section 27A of the Securities Act of 1933, as amended, and Section 21E of the Securities Exchange Act of 1934, as amended. These forward-looking
statements may be identified by reference to a future period or by the use of forward-looking
terminology, such as “anticipate,” “believe,” “estimate,” “expect,” “foresee,”
“may,” “might,” “will,” “intend,” “could,”
“would” or “plan,” or future or conditional verb tenses, and variations or negatives of such terms. These forward-looking statements
include, without limitation, statements about maturities of our CDs, our strategic focus, revenue
growth opportunities, branch expansion, fee revenue growth, integration of specialty lending
lines of business, improvement of asset quality, branch optimization, the effectiveness of our new regional management structure, geographic expansion
of mortgage originators, expansion of insurance agencies, marketing of foreclosed properties, our
ability to exit non-performing and criticized relationships, results of operations and
financial condition. We caution you not to place undue reliance on the forward-looking statements contained in this presentation, in that actual results could
differ materially from those indicated in such forward-looking statements as a result of a variety
of factors. These factors include, but are not limited to, conditions in the financial markets
and economic conditions generally, the ongoing debt crisis and the downgrade of the sovereign credit ratings for various nations, the adequacy of the
Company’s provision and allowance for credit losses to cover actual credit losses, the credit
risk associated with real estate construction, acquisition and development loans, losses
resulting from the significant amount of the Company’s other real estate owned, limitations on the Company’s ability to declare and pay dividends, the short-
term and long-term impact of changes to banking capital standards on the Company’s regulatory
capital and liquidity, the impact of legal or administrative proceedings, the availability of
capital on favorable terms if and when needed, liquidity risk, governmental regulation, including the Dodd Frank Act, and supervision of the Company’s
operations, the impact of regulations on service charges on the Company’s core deposit accounts,
the susceptibility of the Company’s business to local economic conditions, the soundness
of other financial institutions, changes in interest rates, the impact of monetary policies and economic factors on the Company’s ability to attract
deposits or make loans, volatility in capital and credit markets, reputational risk, the impact of
hurricanes or other adverse weather events, any requirement that the Company write down
goodwill or other intangible assets, diversification in the types of financial services the Company offers, competition with other financial services
companies, risks in connection with completed or potential acquisitions, the Company’s growth
strategy, interruptions or breaches in the Company’s information system security, the
failure of certain third party vendors to perform, dilution caused by the Company’s issuance of any additional shares of its common stock to raise capital or
acquire other banks, bank holding companies, financial holding companies and insurance agencies, the
effectiveness of the Company’s internal controls, other factors generally understood to
affect the financial results of financial services companies and other factors detailed from time to time in the Company’s press releases and filings
with the Securities and Exchange Commission. Forward-looking statements speak only as of the date
they were made, and, except as required by law, we do not undertake any obligation to update or
revise forward-looking statements to reflect events or circumstances after the date of this presentation. Certain tabular presentations
may not reconcile because of rounding. Unless otherwise noted, any quotes in this presentation can be
attributed to company management. |
 3
Locations as of September 30, 2012
Footprint –
260 Bank Locations |
 30
Insurance Locations With 164 Licensed Producers 4
Locations and head count as of September 30, 2012 |
 72
Mortgage Locations With 104 Originators 5
Locations and head count as of September 30, 2012 |
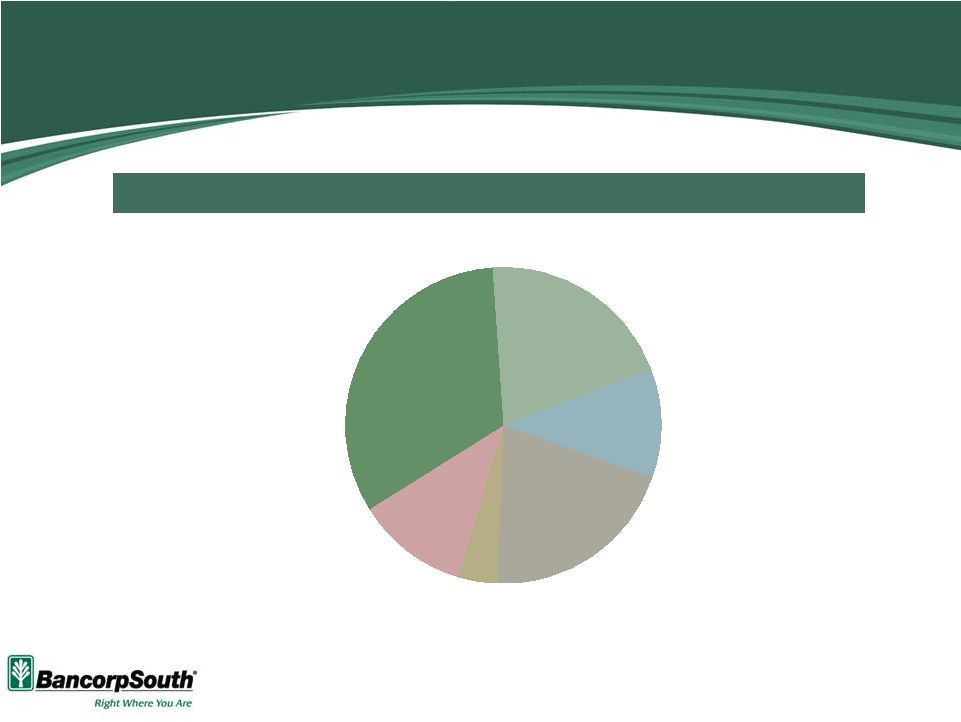 Diversified Revenue Stream
Percentages and amounts based on data for the nine months ended September 30,
2012 *Excludes net securities gains of $0.3 million and negative MSR valuation
adjustment of $3.3 million Almost 40% of Total Revenue is Derived from
Noninterest Sources Total Noninterest Revenue of $212.3M*
6
Insurance
Commissions
33%
Mortgage
lending
20%
Card and
merchant fees
11%
Service
charges
20%
Trust income
4%
Other
12% |
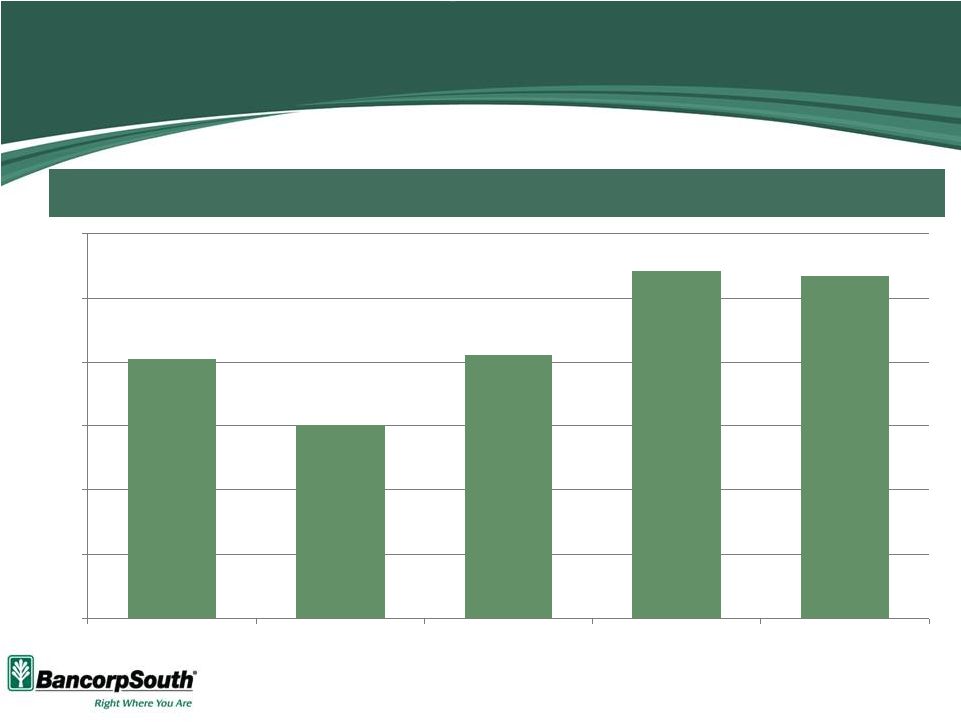
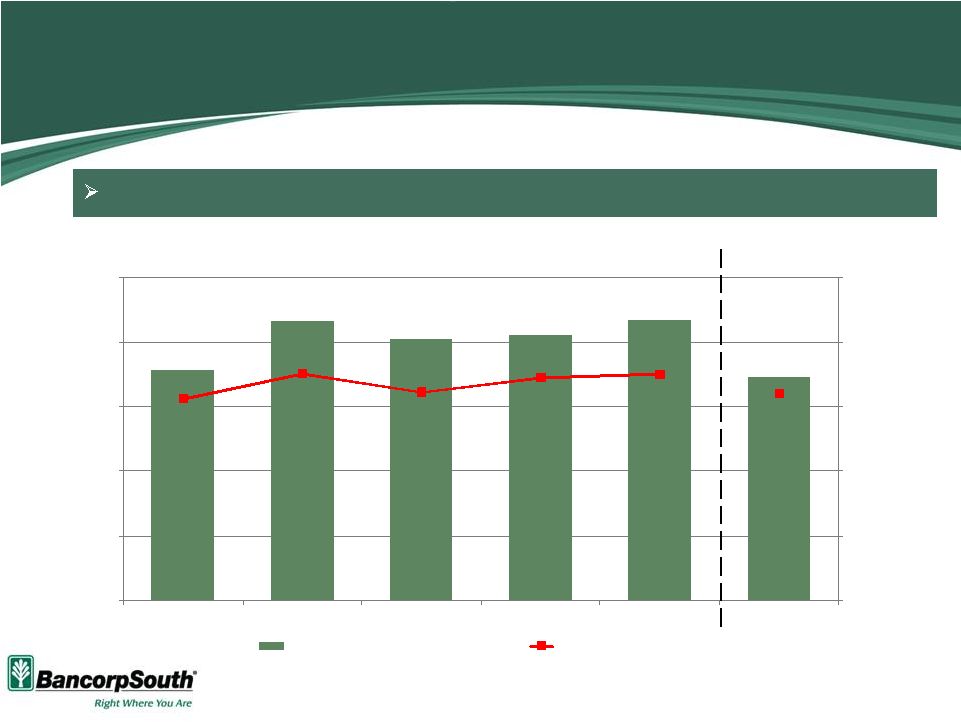 $71
$87
$81
$82
$87
$69
$0
$200
$400
$600
$800
$1,000
$0
$20
$40
$60
$80
$100
2007
2008
2009
2010
2011
9/30/12
Insurance Commission Revenue
Premium Dollars Written
7
Insurance Commissions
Insurance Commissions Account for Approximately 1/3 of Noninterest Revenue
Fiscal Year
Year-to-Date
Dollars in millions
Premium Dollars Written
Commission Revenue |
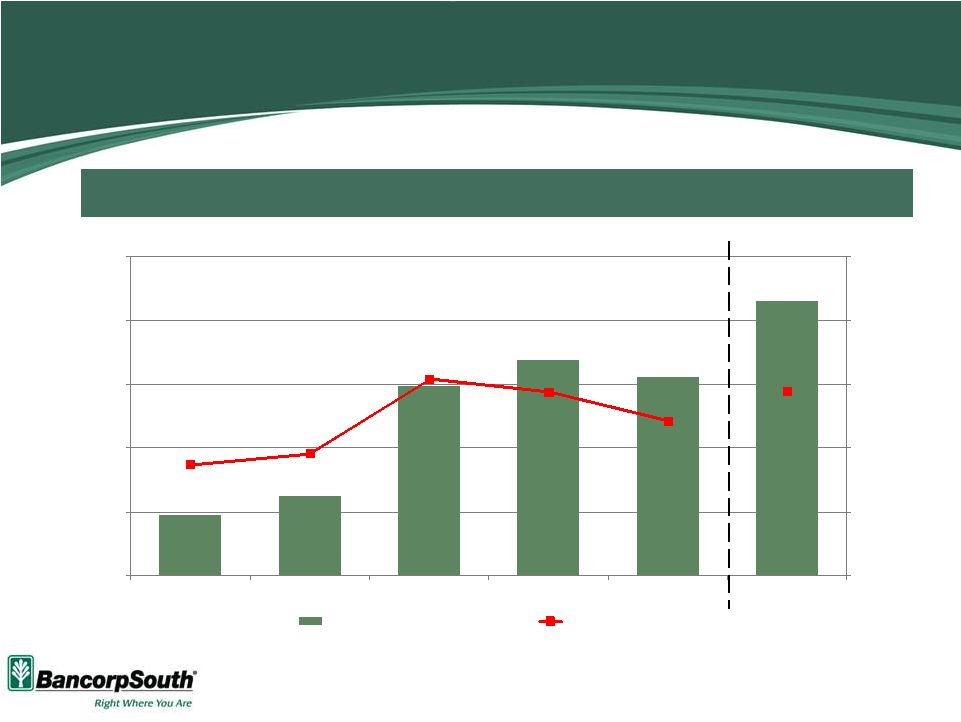 $10
$13
$30
$34
$31
$43
$0
$500
$1,000
$1,500
$2,000
$2,500
$0
$10
$20
$30
$40
$50
2007
2008
2009
2010
2011
9/30/12
Mortgage Lending Revenue*
Mortgage Production
8
Mortgage Lending Revenue
Record Mortgage Production of $608 Million for the Third Quarter
Fiscal Year
Year-to-Date
Dollars in millions
*Excludes MSR valuation adjustments
Revenue
Production |
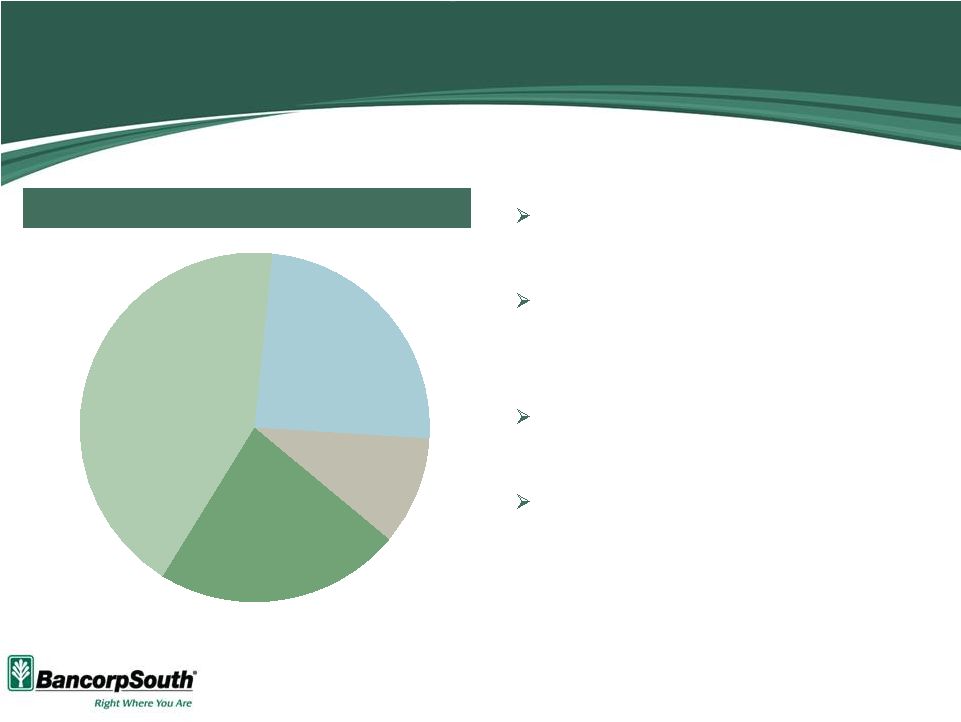 Non-Interest
Bearing
23%
Interest Bearing
DDA
43%
Time
24%
Savings
10%
Core Deposit Franchise
Reduced reliance on public funds
deposits and single service CDs
Noninterest bearing deposits have
grown approximately 13% since
September 30, 2011
Cost of total deposits for the quarter
ended September 30, 2012 was 0.52%
Approximately $938 million in CDs
maturing over the next two quarters at a
weighted average rate of approximately
0.77%
As of and for the period ended September 30, 2012
(except where otherwise indicated)
$11.0B Total
Deposit Composition
9 |
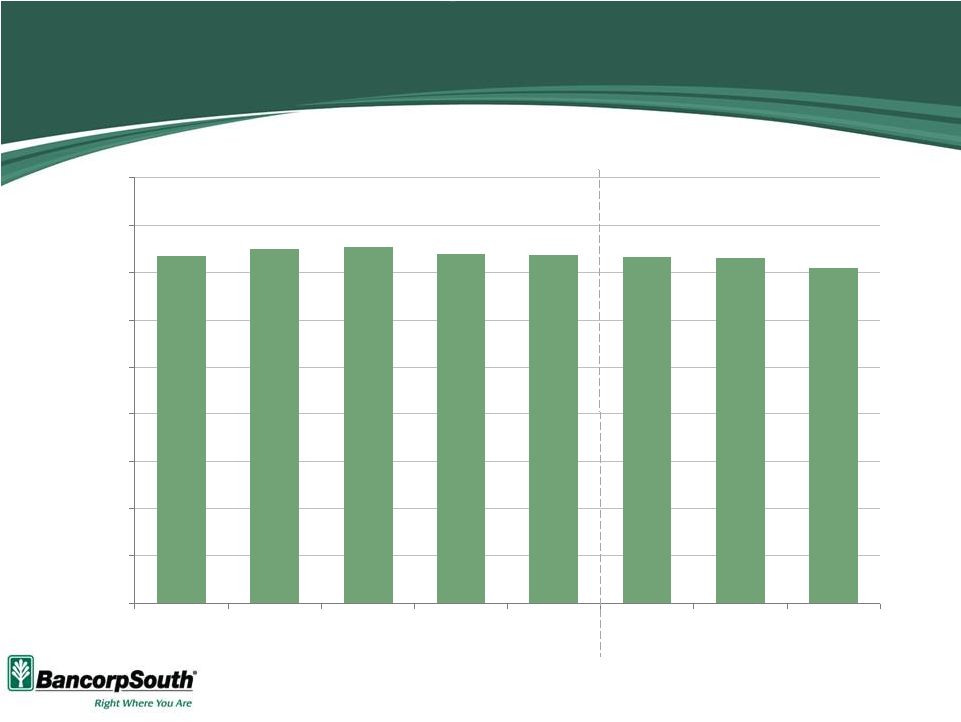 3.68%
3.75%
3.77%
3.70%
3.69%
3.66%
3.65%
3.55%
0.00%
0.50%
1.00%
1.50%
2.00%
2.50%
3.00%
3.50%
4.00%
4.50%
2007
2008
2009
2010
2011
3/31/12
6/30/12
9/30/12
Net Interest Margin
Fiscal Year
Quarter Ended
Shown on a fully taxable equivalent basis
10 |
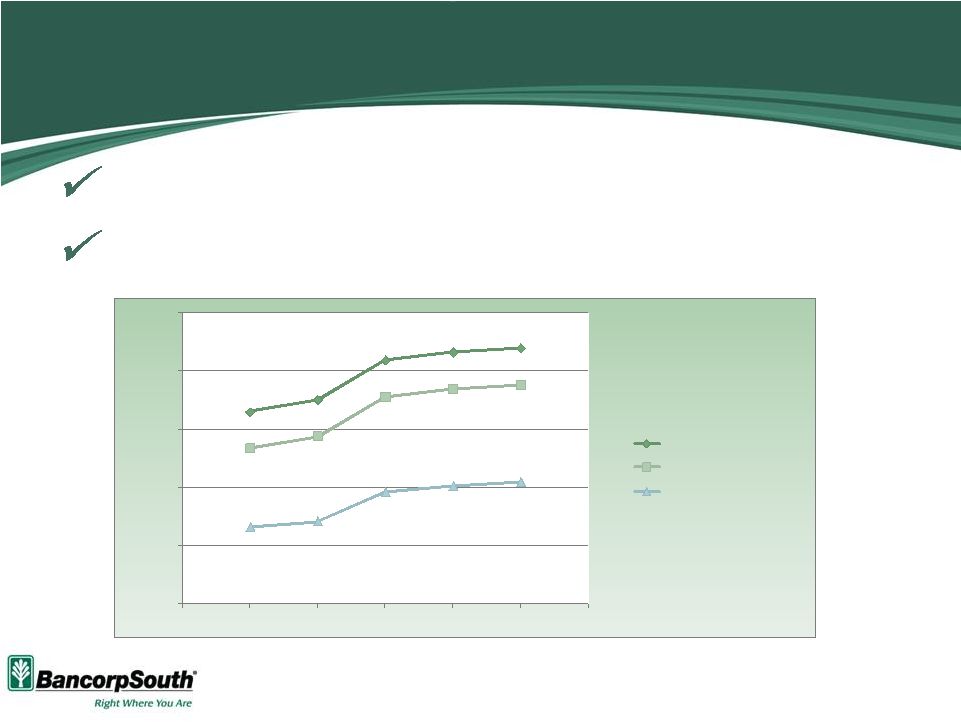 Strong Core Capital Base
Core capital base consisting of 100% common equity
Continued improvement in capital levels, internally generated and
through common stock offering in January 2012
11
6.00%
8.00%
10.00%
12.00%
14.00%
16.00%
9/30/11
12/31/11
3/31/12
6/30/12
9/30/12
Total capital
Tier I capital
Tier I leverage capital
14.81%
13.55%
10.22%
12.62%
11.36%
8.66% |
 12
Financial Highlights |
 Third
Quarter Financial Highlights At and for the three months ended September 30,
2012 13
Net income of $23.8 million, or $0.25 per diluted share
Record mortgage production of $608 million, which contributed to
$16.8 million of mortgage lending revenue excluding a negative MSR
valuation adjustment of $3.2 million
Sequential quarter growth in other noninterest revenue sources
including credit and debit card fees, service charges, and insurance
commissions
Continued improvement in many credit quality indicators including
total NPLs and NPAs, classified loans, and nonaccrual loan formation
and stabilization in other such indicators including the provision for
credit losses and net charge-offs
Capital ratios continue to improve |
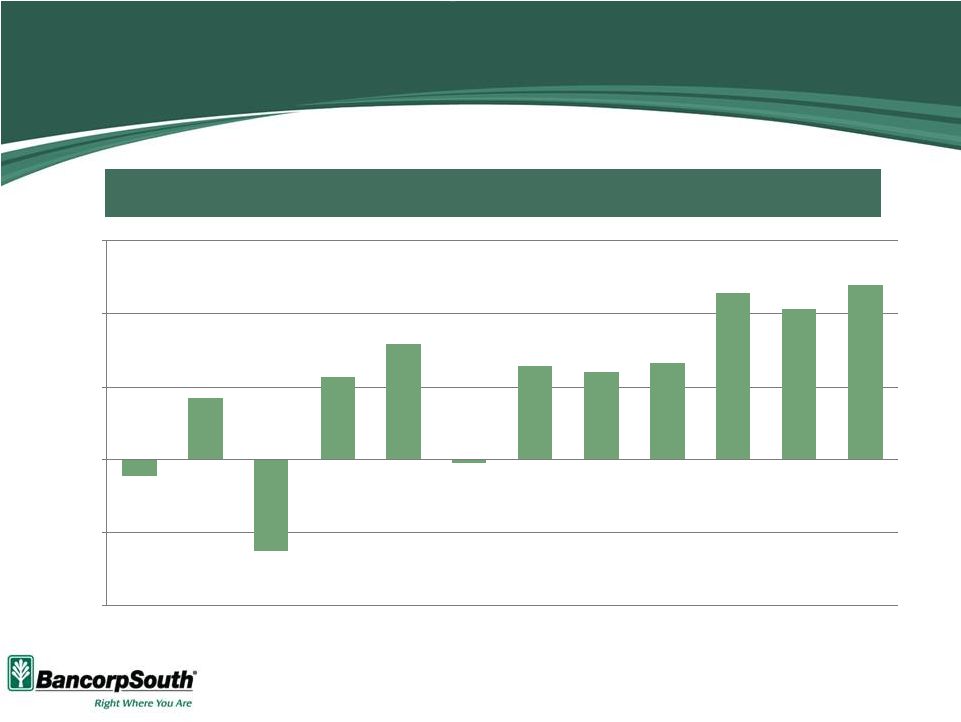 Net
Income Meaningful Improvement in Profitability Levels
14
Net Income for quarters ended as of dates shown
Dollars in millions
($2.1)
$8.4
($12.6)
$11.3
$15.8
($0.5)
$12.8
$11.9
$13.3
$22.9
$20.6
$23.8
($20)
($10)
$0
$10
$20
$30
12/31/09
3/31/10
6/30/10
9/30/10
12/31/10
3/31/11
6/30/11
9/30/11
12/31/11
3/31/12
6/30/12
9/30/12 |
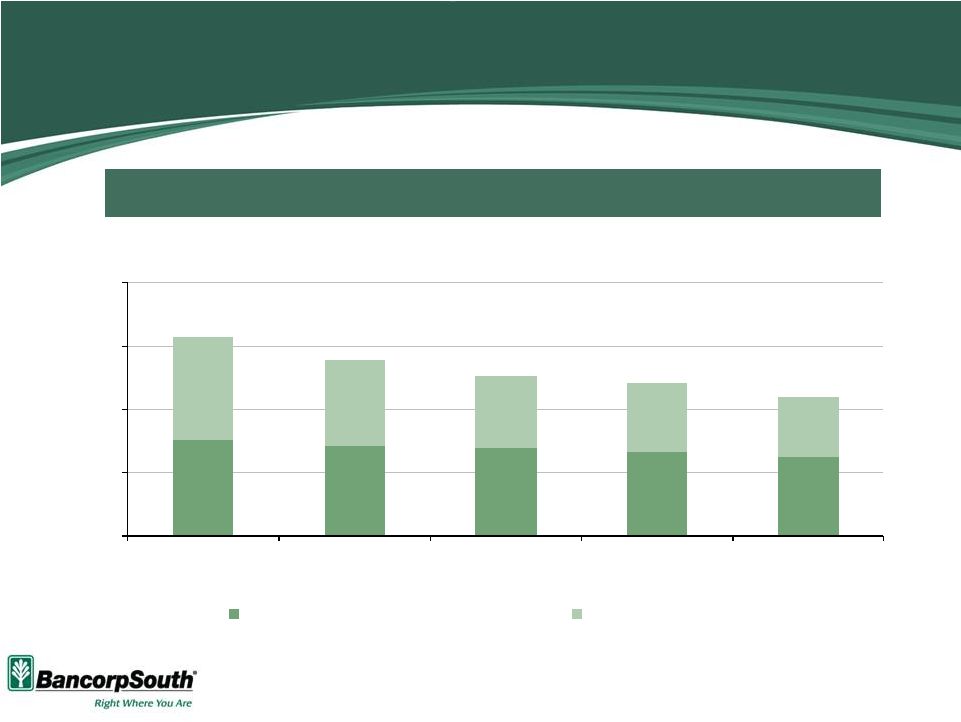
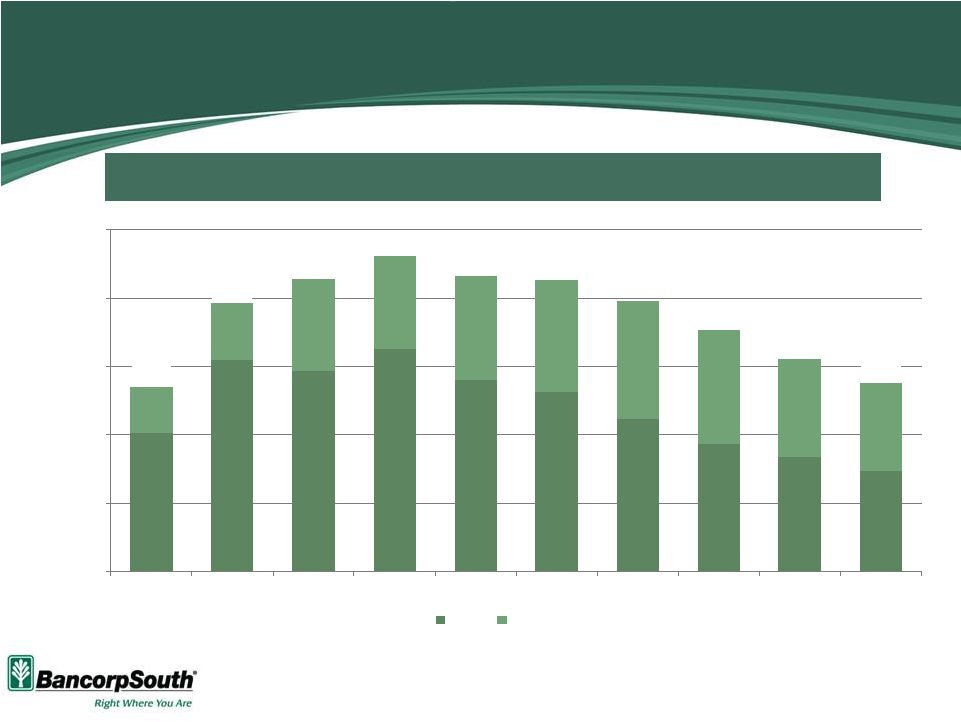 NPA
Improvement Dollars in millions
NPLs include non-accrual loans, loans 90+ days past due and restructured
loans NPAs include NPLs and other real estate owned
Total NPAs Have Declined $185 Million Since the Peak at 3/31/11
15
$302
$409
$394
$425
$380
$363
$322
$285
$267
$247
$68
$83
$133
$136
$151
$163
$174
$168
$144
$128
$370
$492
$528
$561
$531
$525
$496
$453
$411
$376
$100
$200
$300
$400
$500
$600
6/30/10
9/30/10
12/31/10
3/31/11
6/30/11
9/30/11
12/31/11
3/31/12
6/30/12
9/30/12
NPLs
OREO |
 Dollars in millions
Data for quarters ended as of dates shown
Payments Received on Non-Accrual Loans
16
Payments of $110 million received on non-accrual loans over the past 5
quarters $20.2
$15.1
$20.6
$27.1
$26.7
$0
$5
$10
$15
$20
$25
$30
9/30/11
12/31/11
3/31/12
6/30/12
9/30/12 |
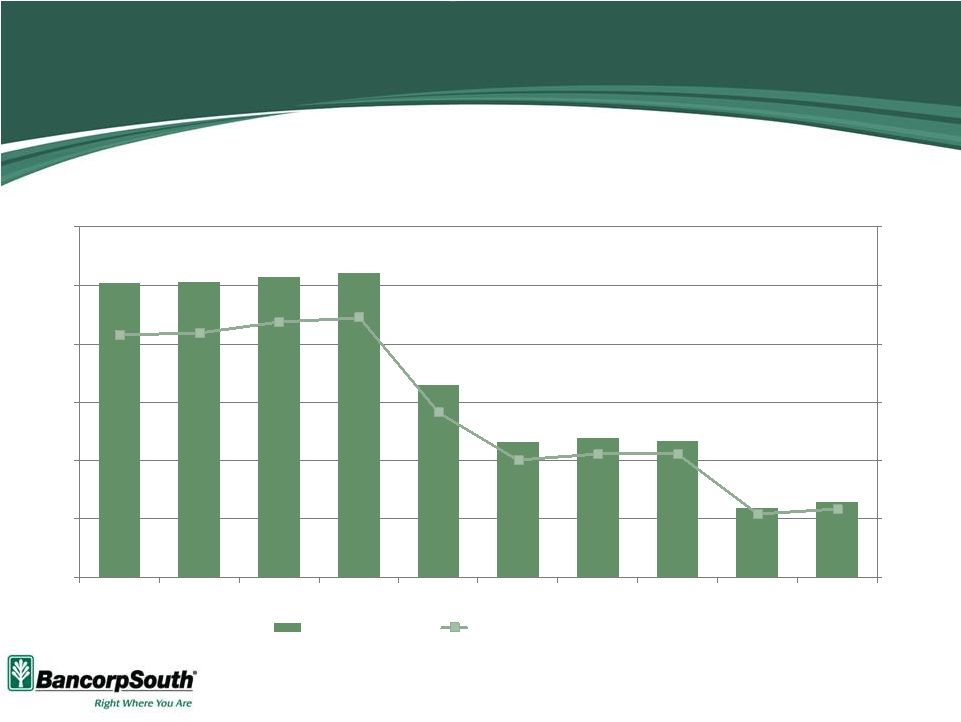
 $0
$100
$200
$300
$400
9/30/11
12/31/11
3/31/12
6/30/12
9/30/12
Non-Accrual Lns Paying as Agreed
All Other Non-Accrual Lns
Non-Accrual Loans
51%
54%
55%
57%
57% of non-accrual loans were paying as agreed as of September 30, 2012
48%
17
Dollars in millions
“Paying as Agreed”
includes loans < 30 days past due with payments occurring at least
quarterly |
 Dollars in millions
Data for quarters ended as of dates shown
Positive Trend in Net Charge-Offs
% Avg. Loans
18
$50
$51
$51
$52
$33
$23
$24
$23
$12
$13
0.0%
0.5%
1.0%
1.5%
2.0%
2.5%
3.0%
$0
$10
$20
$30
$40
$50
$60
6/30/10
9/30/10
12/31/10
3/31/11
6/30/11
9/30/11
12/31/11
3/31/12
6/30/12
9/30/12
Net charge-offs
Net charge-offs / average loans |
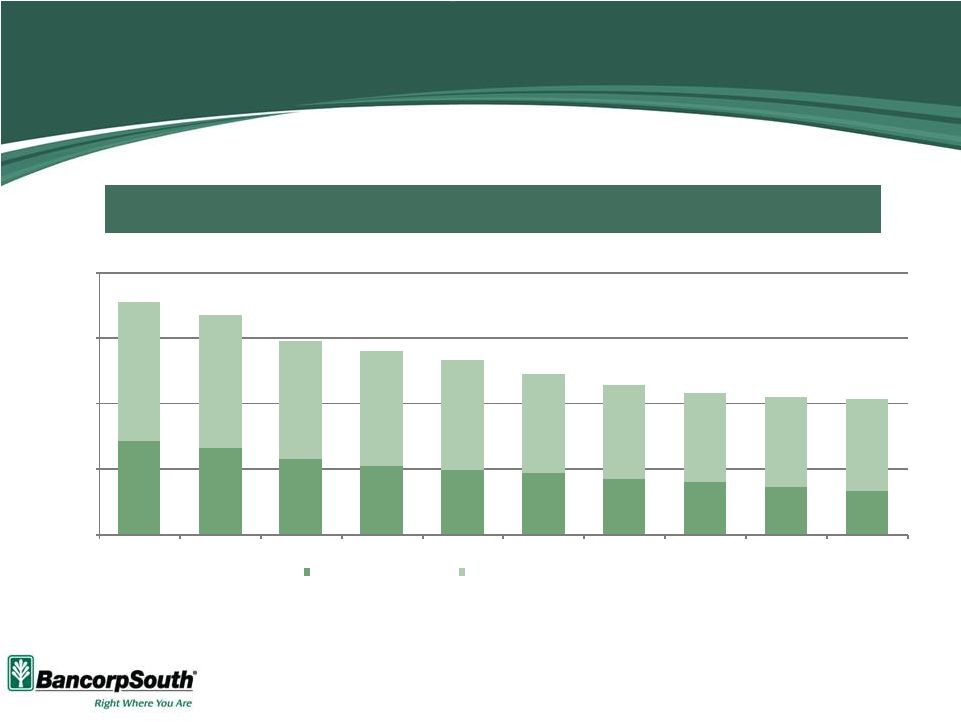 Decreased Exposure in CAD Portfolio
Dollars in millions
Net loans and leases
Residential CAD has declined almost 50% over the past 2 years
19
$570
$523
$456
$420
$393
$377
$342
$317
$288
$263
$1,419
$1,336
$1,175
$1,117
$1,061
$977
$908
$858
$835
$824
$0
$400
$800
$1,200
$1,600
6/30/10
9/30/10
12/31/10
3/31/11
6/30/11
9/30/11
12/31/11
3/31/12
6/30/12
9/30/12
Residential CAD
All Other Construction, Acquisition and Development |
 20
Strategic Focus |
 Strategic Focus
Revenue Growth Opportunities
Pursue quality loan growth
Branch expansion in certain growth markets
Continue to focus on fee revenue growth
Expand mortgage originators geographically
Continue to seek opportunities for expansion in insurance
Integration of specialty lending lines of business into general banking
structure Efficiency Opportunities
Continue progress in improving asset quality
Aggressively market foreclosed properties
Directed exits of non-performing and criticized relationships
Branch optimization
Monitoring of headcount
Geographic reorganization of general bank from 10 regions to 4 regions
21 |
 Summary
Measurable increases in profitability levels
Consistent core earnings with almost 40% of total revenue
derived from noninterest sources
Record mortgage loan production
Growth
in
other
noninterest
revenue
sources
including
credit
and
debit
card fees, service charges, and insurance commissions
Continued progress in improving asset quality
6
th
consecutive quarter of improvement in total NPLs and NPAs
Stabilization of provision and net charge-off levels
Revenue growth opportunities
Efficiency and expense control initiatives
Data as of and for the quarter ended September 30, 2012
22 |