Attached files
| file | filename |
|---|---|
| 8-K - FORM 8-K - Ameris Bancorp | d440604d8k.htm |
 Third Quarter 2012
Investor Presentation
Exhibit 99.1 |
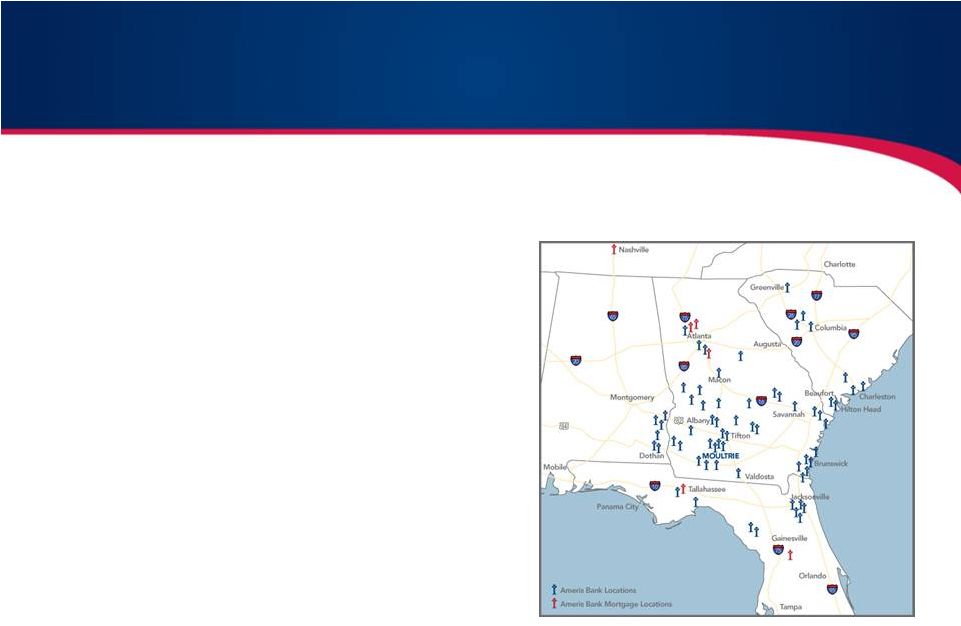 Corporate
Profile •
Headquartered in Moultrie, Georgia
•
Founded in 1971 as American Banking
Company
•
Historically grown through acquisitions of
smaller banks in areas close to existing
operations
•
Recent growth through de novo expansion
strategy and 10 FDIC-assisted transactions
•
Four state footprint with 66 offices
•
Approximately 872 FTEs managing 200,000
core customer accounts
•
Assets –
$2.9 billion
Loans –
$2.0 billion
Deposits –
$2.6 billion
2 |
 Realize the
positive impacts of our Earnings Strategies •
Design and implement strategies to build more efficient banking platform. Rationalize
branch network and position Bank for faster growth in assets.
•
Continue to drive double digit growth in loans and low-cost/no-cost funding.
•
Build
additional
non-interest
income
lines
of
businesses
to
drive
revenue
towards
the
top
quartile of our peer group. Leverage premier mortgage platform for better
profitability. •
Recognize a reduction in credit related expenses commensurate with the significant reduction
in classified and non-accrual assets.
Position Ameris Bank as a Consolidator in our 4 Southeastern States
•
FDIC
Assisted
acquisitions
–
Slowing
pipeline
of
opportunities
but
our
markets
still
have
majority
of
potential
deals.
Interest
in
both
Strategic
(builds
market
share)
and
Financial
(builds excess TCE and T1 capital).
•
Traditional
M&A
–
Early
stages
of
a
growing
pipeline
of
opportunities
in
our
footprint
on
larger, thinly capitalized institutions.
Continue Improving Credit Quality
•
Continue to manage strategies that restore historic quality to our Balance Sheet.
•
Reduce credit-related operating expenses incrementally throughout 2012.
3
Current Focus |
 •
Diversified loan portfolio across five regions
–
Inland Georgia –
51%
–
Coastal Georgia –
15%
–
Alabama –
9%
•
In-house lending limit of $7.5 million versus $75 million legal limit
–
5 loans greater than $5 million
•
Loan participations less than 1.00% of total loans
•
Aggressive management of concentrations of credit
•
Top
25
relationships
are
only
10.3%
of
total
loans
4
–
South Carolina –
13%
–
Florida –
12%
Loan Type
Average Loan
Size
Average Rate
Commercial R/E
$ 347,487
5.42 %
C&D
108,514
5.39
Residential
72,066
5.74
C&I
59,831
5.03
Consumer
6,970
6.53
Agriculture
118,634
5.83
Total
$ 81,632
5.55 %
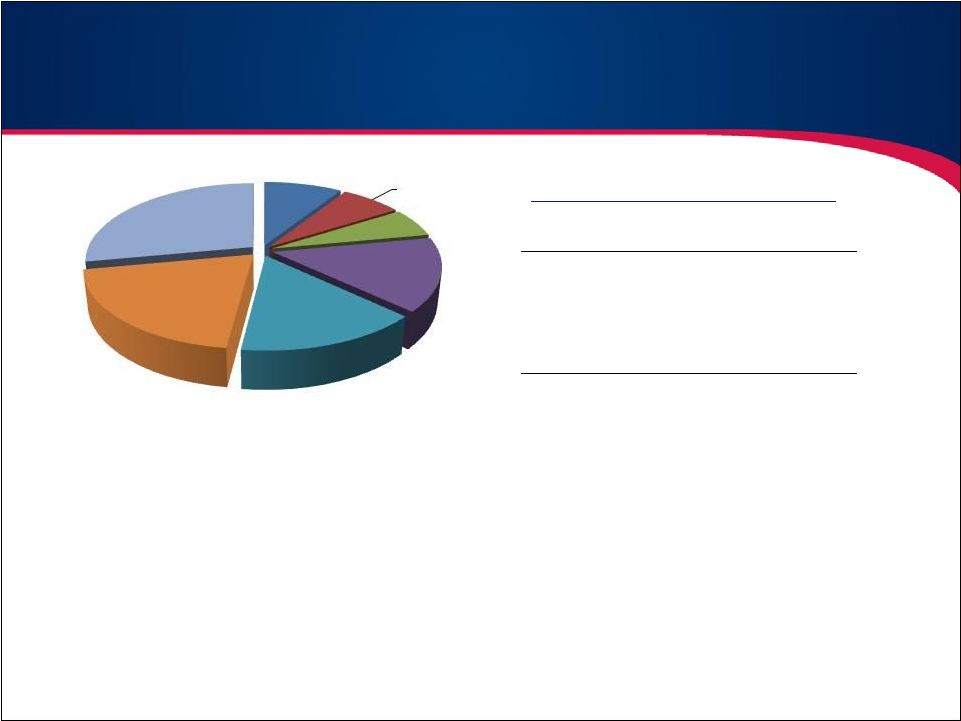
Loan Portfolio Detail
Loan Portfolio Detail –
9/30/12
Agriculture
9%
Construction
6%
owner
occupied CRE
15%
Owner
Occupied CRE
15%
Consumer
Installment &
Residential
20%
Covered
28%
C&I
7%
Non
- |
 |
 •
Leveraging presence in new markets (top five markets
account for 70% of pipeline: Atlanta, Jacksonville,
Columbia, Savannah, Charleston
•
Upgrading production positions in key markets: limited
changes to expense base but higher levels of quality
production
•
Expanding Mortgage Strategy: Jumbo mortgages,
wholesale, warehouse LOC
•
Leveraging Agricultural expertise: better yields than in
CRE due to limited competition
•
Specialty lines of business that would diversify loan
portfolio
•
Yields on current production approximately
5.25%
•
2/3
rds
of production is with existing customers –
higher rates (40bps-50bps from relationships)
•
Diversified loan types –
not solely chasing CRE
or competing with low rates that do not
compensate for term or quality
6
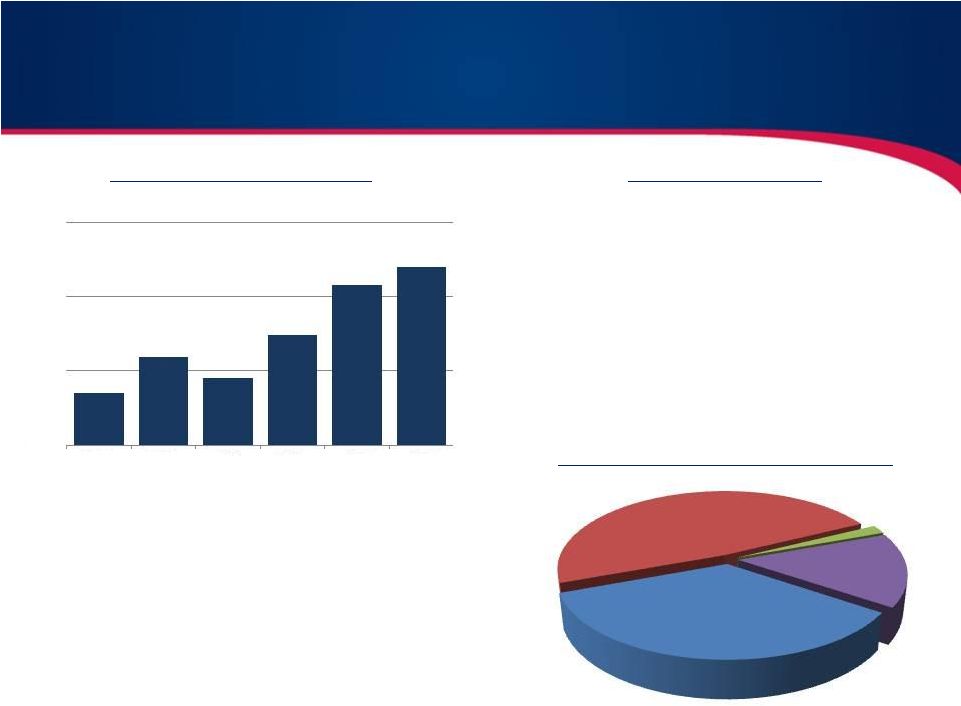
Loan Growth Opportunity
Growth in Loan Pipelines
Lending Strategies
Portfolio Diversification by Type
Comm'l, Finc'l
& Agriculture,
34.9%
Commercial
R/E, 48.3%
Construction,
1.8%
Residential
R/E, 15.0%
$120.4
$168.1
$139.7
$197.5
$264.9
$289.1
$50.0
$150.0
$250.0
$350.0
2Q 11
3Q 11
4Q 11
1Q 12
2Q 12
3Q 12
Loan Pipeline EOQ
(in millions) |
 7
(1)
Excludes covered assets, where applicable
dollars in millions, except per share data
Q3 '11
Q4 '11
Q1 '12
Q2 '12
Q3 '12
YTD Change
BALANCE SHEET
Assets
$3,010
$2,994
$3,043
$2,920
$2,949
(2.03)
%
Loans, net
1,929
1,868
1,949
1,941
2,015
4.46
Tang Common Equity / Assets
7.96%
7.96%
7.95%
8.41%
8.27%
3.89
Tangible Book Value
$10.08
$10.06
$10.15
$10.29
$10.23
1.49
PERFORMANCE
Pre-tax, pre-credit earnings
$15,433
$15,030
$13,634
$14,700
$13,728
(11.05)
%
as a percentage of average assets
2.01%
2.01%
1.84%
1.99%
1.86%
Revenue (ex acquisition gains)
$34,880
$35,259
$34,954
$37,756
$38,069
9.14
as a percentage of average assets
4.64%
4.71%
4.59%
5.17%
5.16%
OPEX (ex credit costs)
$20,501
$20,926
$21,507
$23,200
$25,104
22.45
as a percentage of average assets
2.72%
2.80%
2.83%
3.18%
3.41%
Diluted earnings per share
0.66
0.01
0.19
0.07
0.04
(93.94)
Net interest margin (TE)
4.44 %
5.21 %
4.48 %
4.66 %
4.52 %
1.80
Efficiency ratio (ex credit costs)
58.78%
59.35%
61.53%
61.45%
75.68%
28.76
CREDIT QUALITY
(1)
NPAs / Assets
3.77%
4.05%
3.03%
2.89%
2.58%
(31.56)
%
Classified Assets / Capital
41.78
43.93
35.07
32.05
31.44
(24.75)
Reserves / Loans
2.57
2.64
2.17
1.92
1.80
(29.96)
Reserves / NPLs
59.66
49.64
54.90
58.98
67.76
13.58
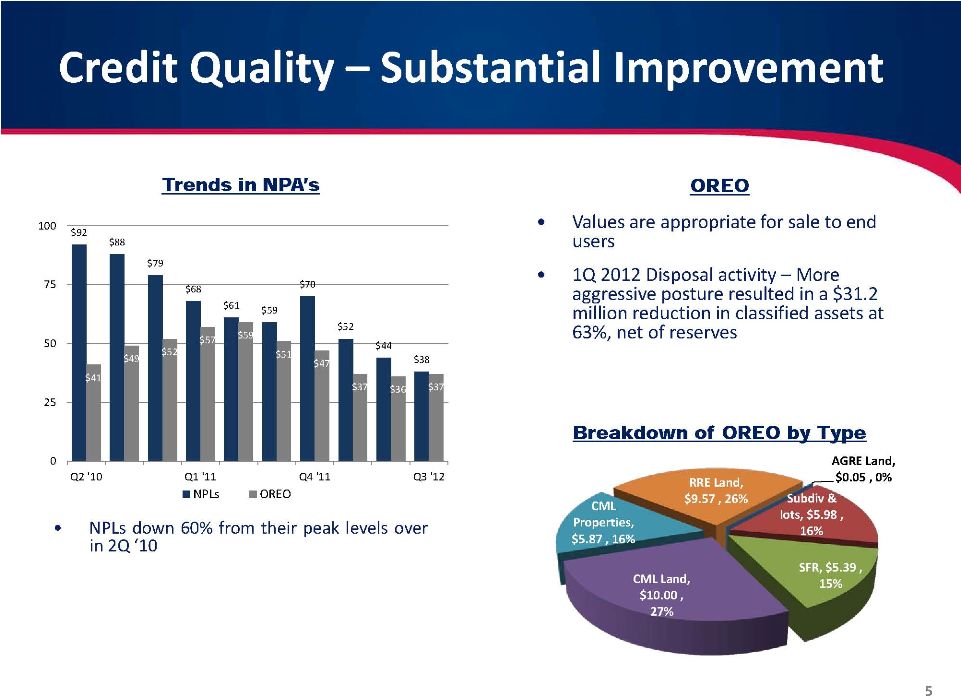
Third Quarter Update |
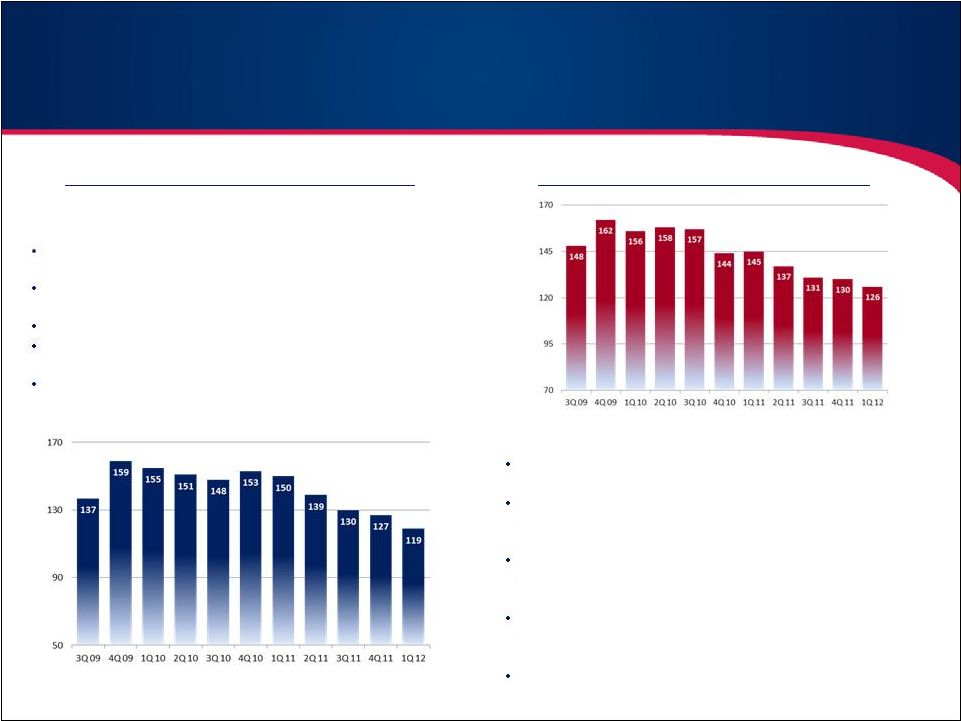
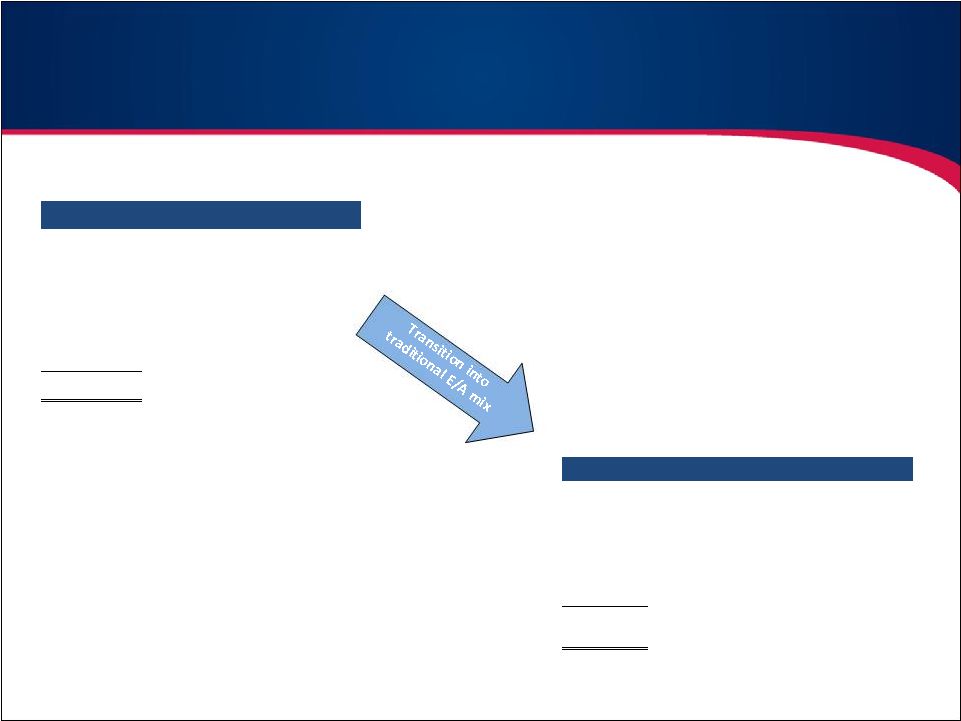 Short-term
plan to convert low yielding assets into traditional earning asset mix Pickup in net
interest income from the strategy is approximately $24.6 million
•
•
•
•
8
Balance
Type
75,961
Legacy NPAs
88,895
Covered OREO
198,440
Covered OREO
123,448
Covered NPLs
111,251
S/T assets
597,995
Total Low Yielding Assets
Balance
Type
448,496
Loans
(75% weighting, 5.00% yields)
119,599
Investments
(20% weight, 2.00% yields)
29,900
S/T assets
(5% weighting, 0.25% yields)
597,995
Traditional E/A mix
•
Majority of the conversion of low yielding assets expected
inside of 2 years
•
Cash flows here do not factor in “growth”; Management
believes growth is possible and costs of new deposits in
3Q 2012 was approximately 0.40%
Earnings Growth –
Expansion/Remix of Earning Assets
Reshuffling asset mix is 100% incremental to ROA
After tax pickup of $0.68 per share and 54bps improvement in
ROA
Loan generation engine in place, focused on lending niches,
larger relationships in growth markets, existing customers
Some loan growth may come from additional FDIC
transactions where assets have higher yields than calculated
here |
 9
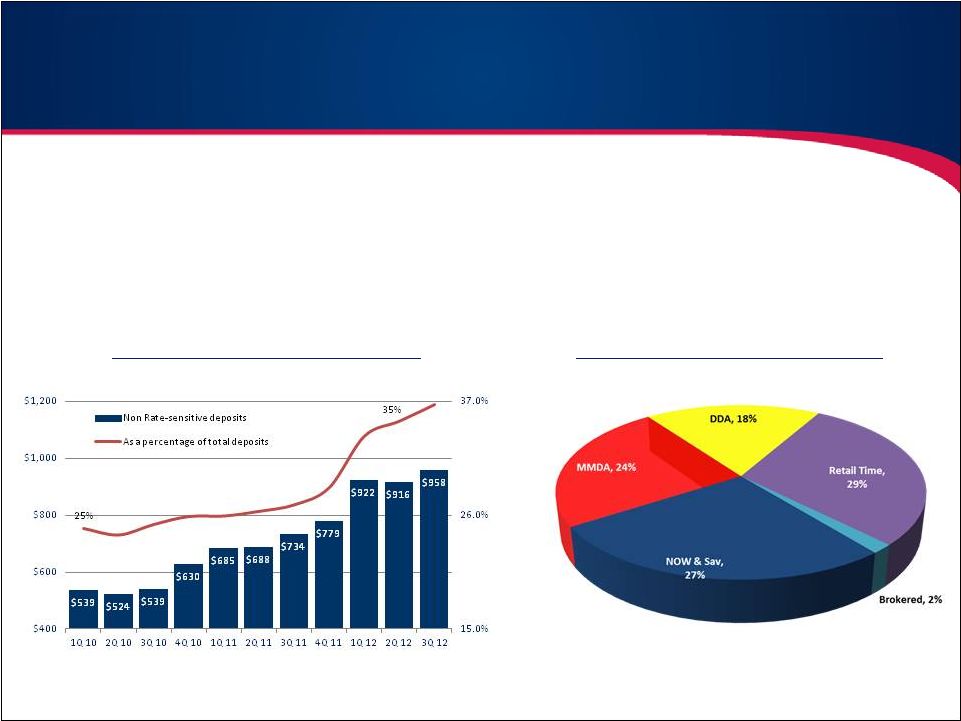
•
31.1%
-
Growth rate in Non-interest Bearing Demand during last 12 months
•
61.0%
-
Percentage of deposits in retail oriented transaction style accounts
•
98.0%
-
Percentage
of
Bank’s
total
funding
through
deposits
that
“walks
through
our
front
doors”
(2Q
‘12)
“Zero”
cost deposits include non-interest bearing checking, NOW accounts and Savings accounts that
cost less than 0.25% and are deemed to have very little sensitivity to changing interest
rates.. Local Deposit Customers
Drive Profitability & Long Term Franchise Value
“Zero”
Cost
Deposits
–
9/30/12
Deposit
Composition
–
9/30/12 |
 10
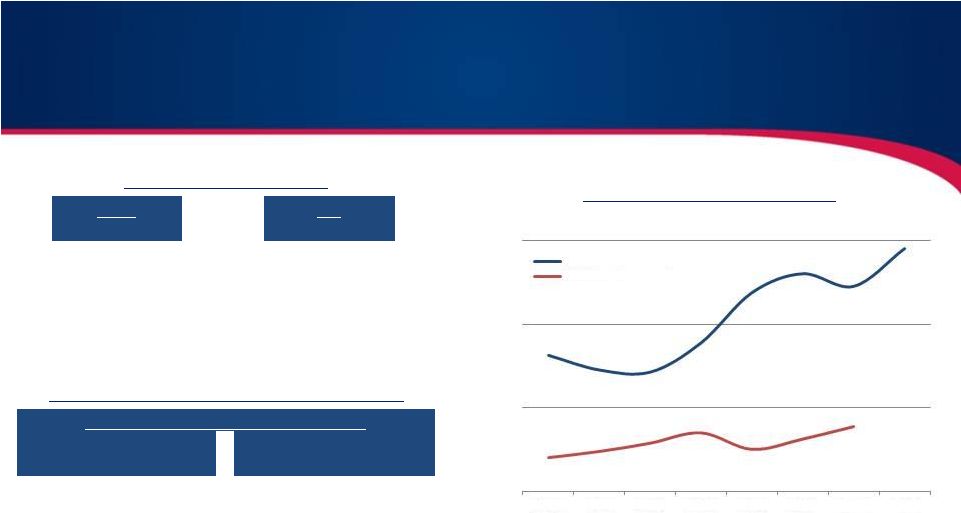
(1)
Maturity and Repricing Opportunity are amounts and yields maturing in the designated
quarter (2)
Ameris Bank net interest margin on a fully taxable-equivalent basis, excludes H/C level
TRUPs .
Loans
CDs
Quarter
Yield
Quarter
Yield
Q3 '11
5.62%
Q3 '11
0.96%
Q4 '11
5.38%
Q4 '11
0.67%
Q1 '12
5.48%
Q1 '12
0.65%
Q2 '12
5.45%
Q2 '12
0.54%
Q3 '12
5.28%
Q3 '12
0.51%
Upcoming
Maturities
and
Expected
Renewals:
Quarter
Loans -
Balance
Maturing
Yield
Quarter
CDs -
Balance
Maturing
Cost
Q3 '12
$ 144,165
5.82%
Q3 '12
$ 232,812
1.05%
Q4 '12
$ 123,207
5.98%
Q4 '12
$ 186,914
0.89%
•
Maturing
Balances
and
yields
relative
to
“Acquisition
Yields”
are
still
in
Ameris
Bank’s
favor
•
53.5% -
Increase in new loan volume in Q2 2012 vs. Q3 2011
Net Interest Margin
Net
Interest
Margin
(2)
(%)
Maturity
&
Repricing
Opportunity
(1)
“Acquisition Yields”
3.50
3.90
4.30
4.70
Q3 '10
Q4 '10
Q1 '11
Q2 '11
Q3 '11
Q4 '11
Q1 '12
Q2 '12
ABCB Net Interest Margin
UBPR Peer Group
4.15
4.07
4.45
4.66 |
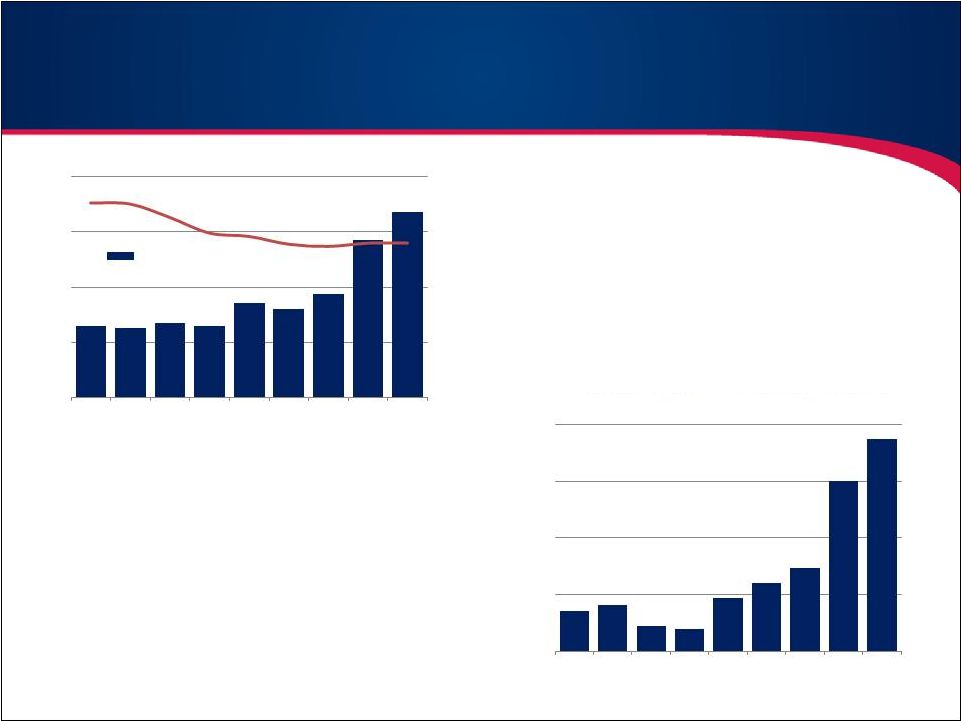 Significant
growth
in
mortgage
revenue
–
currently
all
from
retail
activities
•
Still hiring highly experienced, high volume teams
•
Current retail production is $30mm per month, potential
and platform to double in 12-18 months
Started wholesale activities in 2Q 2012
•
Hiring experienced relationship managers from large
wholesale players
•
Larger volume opportunity in wholesale relative to retail
activities
11
Serious about building strength and diversification in non-
interest income sources
•
Moving away from deposit charges
•
Researching unique lines of business
•
Momentum in our numbers coming from mortgage
revenue; we believe we can duplicate that strategy
with other LOBs by hiring expertise
Peer group comparison are banks greater than $3 billion
•
BOLI transaction in the 3Q will increase annual
revenue by $2.6 million and NII/Assets by 0.05%
Earnings Growth –
Non-Interest Income
0.82%
0.82%
0.84%
0.82%
0.93%
0.90%
0.97%
1.21%
1.34%
0.50%
0.75%
1.00%
1.25%
1.50%
3Q 10
4Q 10
1Q 11
2Q 11
3Q 11
4Q 11
1Q 12
2Q 12
3Q 12
Non-Interest Income to Assets
ABCB
713
806
450
382
930
1,209
1,475
3,001
3,740
0
1,000
2,000
3,000
4,000
3Q 10
4Q 10
1Q 11
2Q 11
3Q 11
4Q 11
1Q 12
2Q 12
3Q 12
Mortgage Revenue |
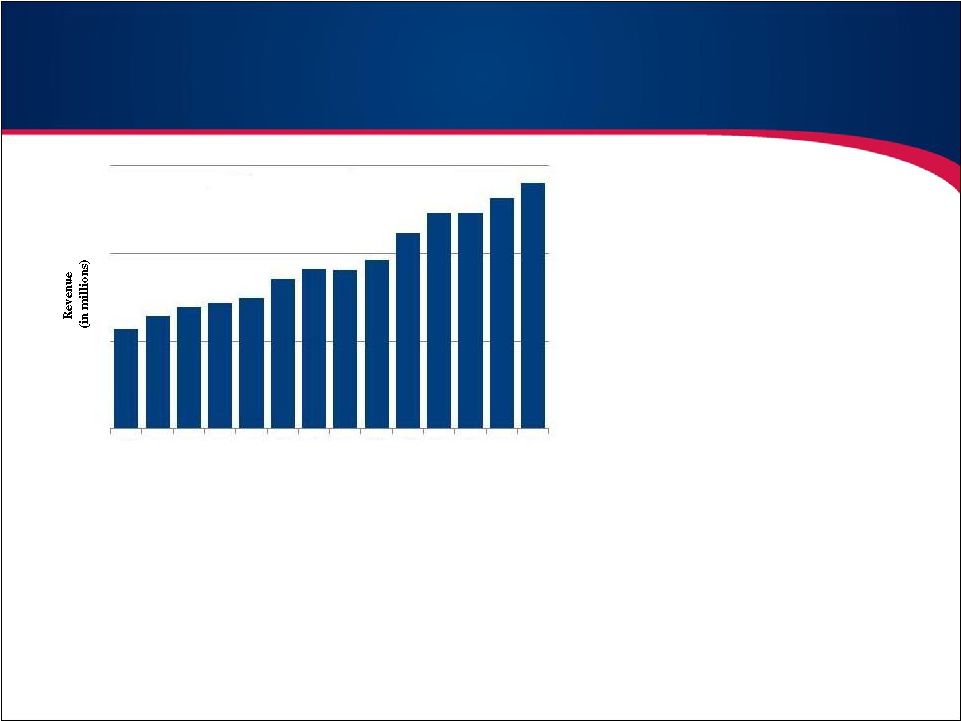 •15.0%
compounded annual growth rate in total revenue over the last three years
•Revenue has grown twice as fast as earning assets
•Significant amount of assets that will be deployed
over the next 3 years that will significantly boost
revenue and earnings
•
27.4% -
CGR for mortgage related
revenue
•
23.6% -
CGR for debit interchange
fees
•
7.8% -
CGR for analysis and
overdraft fees
•
2011 revenue gains boosted by improved net interest margins from
deployment of short-term assets
•
2012-2015 strategy demands:
•
Diversification of revenue with more emphasis on highly profitable
non-interest income LOB’s that enhance ROA and reduce burden on
capital leverage
•
Protect our advantage from strong net interest margins with emphasis on
creating a highly favorable funding mix
12
Earnings Growth
–
Continued Growth in Revenue
$21.4
$23.9
$25.0
$28.3
$29.3
$34.6
$38.1
$10.0
$20.0
$30.0
$40.0
2Q
2009
3Q
2009
4Q
2009
1Q
2010
2Q
2010
3Q
2010
4Q
2010
1Q
2011
2Q
2011
3Q
2011
4Q
2011
1Q
2012
2Q
2012
3Q
2012
Recurring Quarterly Revenue
(in millions)
Revenue growth through this cycle with
opportunistic strategies: |
 13
Significant Leverage Opportunities in Operating Expense
Current Efficiency Projects and Branch Rationalization -
•
Branch structure being critically analyzed to determine most efficient operating style.
5 branches already decided with several more being decided during fourth
quarter. Annualized potential savings in excess of $5.0 million.
•
Bank operations and corporate support being realigned to be more
efficient and to bring assets/employees in line
with peers. Annualized savings of over $5.0 million by end of 2013.
FDIC Insurance is going to decrease substantially
•
$3.0 million reduction in FDIC insurance starting in January 2013 when the prepaid assessment
is fully amortized. M&A opportunities exist where primary catalyst for the deal is
operating leverage •
Our M&A strategy is building in existing markets where we can leverage current management
and facilities. •
Our core processor contract allows for 50% reduction in processing costs.
•
Believe we can integrate targets with less than 2.00% incremental opex/assets.
Non-provision credit costs are moderating quickly
•
$3.7 million in 3Q 2012 and $3.4 million in 2Q 2012 vs. $9.0 million and $7.8 million in same
quarters in 2011. Expect moderation in these costs in 4Q 2012 and into 2013 as credit
quality has improved to peer level. Earnings Growth
–
Operating Expense Leverage |
 (1)
Banks in Ga, Fl, Al and SC with Texas Ratio over 50% but below 100%. Total assets under
$2 billion. Excludes banks with covered assets (2)
Banks in Ga, Fl, Al and SC with Texas Ratio over 100%. Total assets under $2
billion. Excludes banks with covered assets 14
“Traditional”
M&A
20% of all banks under $2 billion in our four states have Tx
ratio between 50% and 100%
Some improvement in number of “problem”
banks, but
almost always from deleveraging vs. new capital or earnings
growth
Credit marks in purchase transaction are very punitive given
levels of classified assets and limit acquirers ability to
maintain TBV levels in recapitalization
These banks are receiving significant pressure from regulatory
agencies to strategically develop sources of capital and a rapid
path to profitability
Similar in average assets to “loss share”
M&A opportunities
“Loss-Share”
M&A
20% of all banks
under $2 billion in our four states have Tx ratio over 100%
Majority remaining are smaller banks where consolidation
opportunities would favor Ameris Bank
Average assets of approximately $250 million
Regulatory pressure to “make something happen”
on capital
levels and problem assets
Average Tier 1 leverage (incl h/c debt) of approximately 5.00%
Potential Consolidation Opportunities
(Data for Banks in our 4-State Footprint)
Traditional M&A Opportunities
(1)
“Loss-Share”
M&A
Opportunities
(2) |
 |