Attached files
| file | filename |
|---|---|
| 8-K - 8-K - REGIONS FINANCIAL CORP | d434666d8k.htm |
 Bank of America Merrill
Lynch Banking and Financial
Services Conference
November 14, 2012
David Turner
Chief Financial Officer
EXHIBIT 99.1 |
 2
RELATIONSHIP BANK FOCUSED ON SHARED VALUE
•
Bank Associates: 23,361
•
Assets: $122B
•
Loans: $75B
•
Deposits: $95B
•
Branches: 1,716
•
ATMs: 2,061
•
Market Cap: $10.2B*
•
85% of deposits in 7 core states
*As of September 30, 2012
Ranked 4th or Better in Market Share
Business Services
›
Small
and
mid
sized C&I lending
›
Commercial Real Estate
›
Equipment Finance
Consumer Services
›
Mortgage
›
Home Equity
›
Credit Card
›
Direct Lending
›
Indirect Auto
Wealth Management
›
Institutional
Services
›
Private
Wealth Management
›
Investment Services
›
Insurance
- |
 3
TARGETING A MORE BALANCED LOAN PORTFOLIO
CONSUMER SERVICES
•
39% of Total Loan Portfolio
•
Mortgage loan production totaled $2.2 billion in 3Q
•
Indirect auto lending grew 25% YoY or 10% linked quarter
•
$1B Regions-branded credit card portfolio now serviced in-
house
3Q12 Consumer Services Loans: $29B
BUSINESS SERVICES
•
61% of Total Loan Portfolio
•
Focused on middle market and small business
•
Broad based middle-market commercial loan growth across
footprint and industries
3Q12 Business Services Loans: $46B
* Includes commercial real estate owner occupied loans
1st Mort
45%
Home
Equity
41%
Indirect
7%
Credit
Card
3%
Other
4%
C&I
58%
CRE
23%
IRE
19%
* |
 BUSINESS SERVICES FOCUSED ON SPECIALIZED
INDUSTRIES
Transportation
Restaurant
Healthcare
Technology/Defense
Energy
(Houston)
(Atlanta)
(Charlotte)
(Nashville)
4
•
Specialized lending groups
are headquartered
throughout our footprint
•
Integrated approach to
specialized lending where
local bankers work with
experienced specialized
lenders to meet customer
needs
•
Our goal is to be the
premier corporate middle
market bank for the
specialized industries we
serve
•
Experienced positive year
over year growth in all
industries
|
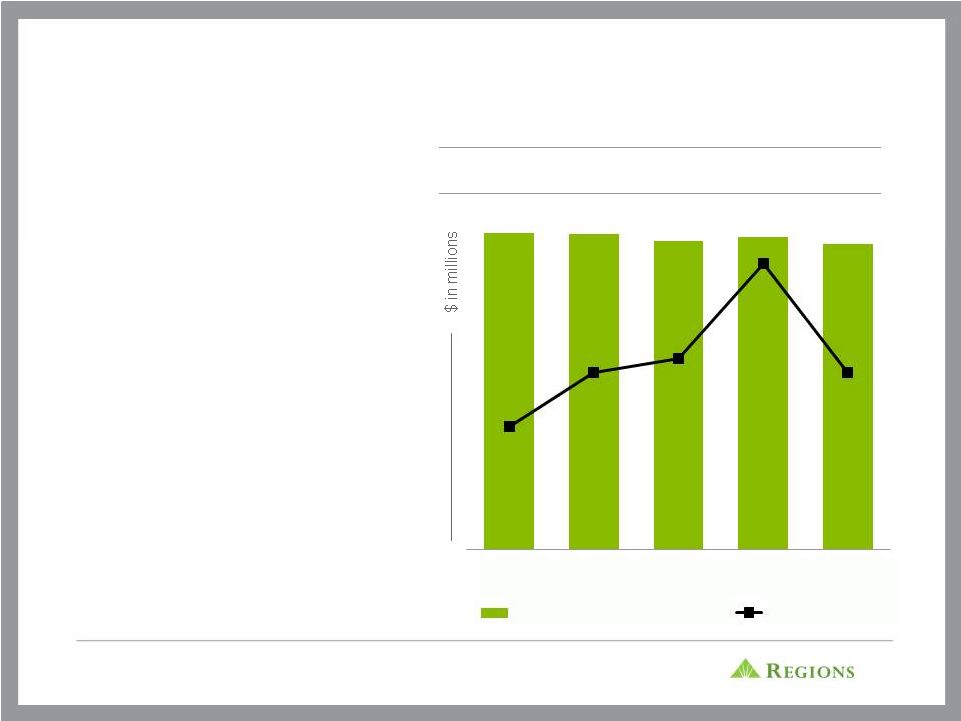
 LOAN
COMMITMENTS AND LOANS OUTSTANDING INCREASE Commitments and
Outstandings •
Commitments increased $3.5 billion since last year to $32.2 billion; line
utilization up 60 bps year-over-year •
Pipelines remain solid and are slightly above the same level at this time last
year as our clients fund capital expenditures, working capital needs, and,
increasingly, M&A activity •
Commercial & industrial loan balances on an average basis increased $570
million*, or 2% linked quarter reflecting strength in our middle market
portfolio *Excludes $185 million of remaining loans related to the Morgan
Keegan sale that were transferred off balance sheet in the third quarter
5
10,069
10,592
11,265
11,631
12,428
12,764
13,275
13,858
14,148
25,020
26,272
26,992
28,029
28,731
29,929
30,801
31,242
32,228
40.2%
40.3%
41.7%
41.5%
43.3%
42.6%
43.1%
44.4%
43.9%
3Q10
4Q10
1Q11
2Q11
3Q11
4Q11
1Q12
2Q12
3Q12
Outstandings
Commitments
Utilization Rate |
 6
LOAN BALANCE TRENDS
•
Total
loans
2
were
down
$758
million
dollars or 1% linked quarter
•
Investor real estate totaled $8.7 billion
at quarter end and has now been
reduced to 12% of total loans down
from 15% one year ago
•
Investor real estate expected to
continue the decline at a moderate
pace over the remainder of 2012
•
Total loan yields were down 11 basis
points linked quarter due to the
prolonged low rate environment and
increasing pricing competition,
primarily within our middle market
segment
Total
Loan
Balances
1
and
Loan
Yields
1 Ending balances
2 Excludes $185 million of remaining loans related to the Morgan Keegan sale
that were transferred off balance sheet in the third quarter |
 7
FUNDING MIX CONTINUES TO IMPROVE AS DEPOSIT
COSTS DECLINED 4 BPS
•
Avg. time deposits as a % of avg.
deposits decreased to 16% in 3Q12
from 22% in 3Q11
•
Deposit repricing opportunities
remain, maturities include:
•
4Q12 -
$3B at 2.10%
•
1H13 -
$4.9B at 1.69%
•
2H13 -
$2.3B at 0.66%
•
Deposit costs declined 4 bps linked
quarter, down 18 bps year-over-year
•
Total funding costs improved to 56
bps, down 19 bps from one year ago
* Average Balances
Deposit Balances* and Deposit Costs
74,778
75,381
77,008
78,688
79,073
21,369
19,774
19,053
17,175
15,536
$96,147
$95,155
$96,061
$95,863
$94,609
46 bps
40 bps
37 bps
32 bps
28 bps
3Q11
4Q11
1Q12
2Q12
3Q12
Low Cost Deposits
Time Deposits + Other
Deposit Cost |
 8
NET INTEREST MARGIN IMPACTED BY CONTINUED LOW
RATE ENVIRONMENT
•
Net interest margin was impacted by
the continued low rate environment,
which drove overall higher
prepayment rates
•
Securities portfolio yield impacted by
increased prepayments and lower
reinvestment yields
•
Non-accrual loans impacted NIM by
10 bps in Q3 versus 7 bps in Q2;
Q2 benefitted from larger than usual
full loan payoffs
•
Cash reserves negatively impacted
net interest margin 7 bps in 3Q12
compared to 8 bps in 2Q12, an
improvement of 1 bp
Net
Interest
Income
and
Net
Interest
Margin
$859
$858
$839
$850
$830
3.04%
3.08%
3.09%
3.16%
3.08%
3Q11
4Q11
1Q12
2Q12
3Q12
Net Interest Income (FTE)
Net Interest Margin |
 9
RECORD MORTGAGE INCOME DRIVES NON-INTEREST
REVENUE HIGHER
•
Non-interest revenue increased 5%
linked quarter
•
Mortgage revenues increased 18%
linked quarter and 56% over last year
•
50% of applications for new
Regions mortgage customers
•
YTD HARP II loans of $1.2 billion,
exceeding original goal of $1 billion
for the full year
•
Mortgage loan production of $2.2
billion reflects an increase of 8%
from the second quarter
Fee Income by Quarter
(1)
(1)
From continuing operations
310
263
254
233
244
68
57
77
90
106
24
24
23
23
18
27
26
28
26
28
84
137
142
135
137
$513
$507
$524
$507
$533
3Q11
4Q11
1Q12
2Q12
3Q12
Service charges
Mortgage Income
Credit Card/Bankcard Income
Insurance Income
Other |
 10
NON-INTEREST EXPENSES IMPACTED BY CREDIT
EXPENSES
(1)
From continuing operations adjusted to exclude goodwill -Non-GAAP, see
appendix for GAAP to Non-GAAP reconciliation •
Non-interest expenses were up 3% linked
quarter due to an increase in credit related
expenses, credit card conversion expenses and
salaries and benefits
•
Other real estate expenses increased $3 million
over prior quarter
•
Held for sale experienced net gains of $17
million related to property sales, reflecting asset
value improvements, compared to $26 million in
net gains in the prior quarter
•
Overall 2012 expenses from continuing
operations are expected to be down from 2011
as a result of continued and disciplined focus
on cost control
Other Real Estate and HFS Expenses
$850
$871
$913
$842
$869
3Q11
4Q11
1Q12
2Q12
3Q12
$48
$33
$15
$(16)
$(4)
3Q11
4Q11
1Q12
2Q12
3Q12
1
Non-Interest
Expenses |
 11
CONTINUED MOMENTUM IN ASSET QUALITY METRICS
NPLs and Coverage Ratio
Business Services Criticized Loans
Loan Loss Provision
30% Decline in Total NPLs*
30% Decline*
91% Decline*
*Year-over-year change
**Excludes loans held for sale
NPL Gross Migration
39% Decline*
$7,305
$6,370
$5,979
$5,436
$5,131
3Q11
4Q11
1Q12
2Q12
3Q12
$755
$561
$381
$315
$463
3Q11
4Q11
1Q12
2Q12
3Q12
$2,710
$2,372
$2,151
$1,915
$1,884
109%
116%
118%
120%
109%
3Q11
4Q11
1Q12
2Q12
3Q12
NPLs**
358
282
191
136
145
153
148
141
129
117
(156)
(135)
(215)
(239)
(229)
$355
$295
$117
$26
$33
3Q11
4Q11
1Q12
2Q12
3Q12
Business Services and HFS
Consumer
Reserve Reduction
ALL / NPL** |
 12
CAPITAL RATIOS REMAIN STRONG
Loan
to
Deposit
Ratio
Tier 1 Capital Ratio
Tier
1
Common
Ratio
(1)
Non-GAAP
–
See
appendix
for
reconciliation
(2)
Includes Series A Preferred Stock and associated warrant
(3)
Based on ending balances
•
Basel III Tier 1 Common ratio
(1)
estimated
under the new proposed rules at 8.7%
•
Loan to deposit ratio remains low,
allowing Regions to be ready for loan
growth when the market demand
increases
(1)
(2)
9.0%
9.4%
10.5%
11.0%
11.5%
3.8%
3.9%
3.8%
12.8%
13.3%
14.3%
11.0%
11.5%
3Q11
4Q11
1Q12
2Q12
3Q12
Tier 1 Capital Excluding TARP
TARP Impact
83%
81%
79%
80%
79%
3Q11
4Q11
1Q12
2Q12
3Q12
8.2%
8.5%
9.6%
10.0%
10.5%
3Q11
4Q11
1Q12
2Q12
3Q12
(3)
(1) |
 13
APPENDIX |
 14
FORWARD-LOOKING STATEMENTS
This presentation may include forward-looking statements which reflect Regions’ current views
with respect to future events and financial performance. The Private Securities Litigation
Reform Act of 1995 (“ the Act” ) provides a “ safe harbor” for forward-looking statements which are identified as such and are accompanied by the
identification of important factors that could cause actual results to differ materially from the
forward-looking statements. For these statements, we, together with our subsidiaries,
claim the protection afforded by the safe harbor in the Act. Forward-looking statements are not based on historical information, but rather are related to
future operations, strategies, financial results or other developments. Forward-looking statements
are based on management’s expectations as well as certain assumptions and estimates
made by, and information available to, management at the time the statements are made. Those statements are based on general assumptions and are
subject to various risks, uncertainties and other factors that may cause actual results to differ
materially from the views, beliefs and projections expressed in such statements. These
risks, uncertainties and other factors include, but are not limited to, those described below: › The Dodd-Frank Wall Street Reform and Consumer Protection Act (the “ Dodd-Frank
Act” )became law in July 2010, and a number of legislative, regulatory and tax
proposals remain pending. Future and proposed rules, including those that are part of the Basel III process are expected to require banking institutions to increase
levels of capital. All of the foregoing may have significant effects on Regions and the financial
services industry, the exact nature and extent of which cannot be determined at this
time. › Possible additional loan losses, impairment of goodwill and other intangibles, and
adjustment of valuation allowances on deferred tax assets and the impact on earnings and
capital. › Possible changes in interest rates may increase funding costs and reduce
earning asset yields, thus reducing margins. Increases in benchmark interest rates would also
increase debt service requirements for customers whose terms include a variable interest rate, which
may negatively impact the ability of borrowers to pay as contractually obligated. ›
Possible changes in general economic and business conditions in the United States in general and in the communities Regions serves in particular, including any prolonging or
worsening of the current unfavorable economic conditions including unemployment levels.
› Possible changes in the creditworthiness of customers and the possible impairment of the
collectability of loans. › Possible changes in trade, monetary and fiscal policies, laws
and regulations and other activities of governments, agencies, and similar organizations, may have an adverse effect
on business.
› Possible regulations issued by the Consumer Financial Protection Bureau or other regulators
which might adversely impact Regions' business model or products and services. › Possible
stresses in the financial and real estate markets, including possible deterioration in property values.
› Regions' ability to manage fluctuations in the value of assets and liabilities and
off-balance sheet exposure so as to maintain sufficient capital and liquidity to support Regions'
business.
› Regions' ability to expand into new markets and to maintain profit margins in the face of
competitive pressures. › Regions' ability to develop competitive new products and services
in a timely manner and the acceptance of such products and services by Regions' customers and potential
customers.
› Regions' ability to keep pace with technological changes.
› Regions' ability to effectively manage credit risk, interest rate risk, market risk,
operational risk, legal risk, liquidity risk, reputational risk, and regulatory and compliance risk.
› Regions’ ability to ensure adequate capitalization which is impacted by inherent
uncertainties in forecasting credit losses. › The cost and other effects of material
contingencies, including litigation contingencies, and any adverse judicial, administrative or arbitral rulings or proceedings.
› The effects of increased competition from both banks and non-banks.
› The effects of geopolitical instability and risks such as terrorist attacks.
› Possible changes in consumer and business spending and saving habits could affect Regions'
ability to increase assets and to attract deposits. › The effects of weather and natural
disasters such as floods, droughts, wind, tornados and hurricanes, and the effects of man-made disasters.
› Possible downgrades in ratings issued by rating agencies.
› Possible changes in the speed of loan prepayments by Regions’ customers and loan
origination or sales volumes. › Possible acceleration of prepayments on
mortgage-backed securities due to low interest rates and the related acceleration of premium amortization on those securities.
› The effects of problems encountered by larger or similar financial institutions that adversely
affect Regions or the banking industry generally. › Regions’ ability to receive
dividends from its subsidiaries. › The effects of the failure of any component of
Regions’ business infrastructure which is provided by a third party. › Changes in
accounting policies or procedures as may be required by the Financial Accounting Standards Board or other regulatory agencies.
› The effects of any damage to Regions reputation resulting from developments
related to any of the items identified above. › The foregoing list of factors is not
exhaustive. For discussion of these and other factors that may cause actual results to differ from expectations, look under the captions
“ Forward-Looking Statements” and “ Risk Factors” in Regions’ Annual
Report on Form 10-K for the year ended December 31, 2011 and the "Foward-Looking Statements"
section of Regions' Quarterly Reports on Form 10-Q for the quarters ended March 31, June 30, and
September 30, 2012.
The words "believe," "expect," "anticipate," "project," and similar
expressions often signify forward-looking statements. You should not place undue reliance on any
forward-looking statements, which speak only as of the date made. We assume no obligation to
update or revise any forward-looking statements that are made from time to time. |
 15
NON-GAAP RECONCILIATION: NON-INTEREST EXPENSE
($ amounts in millions)
9/30/12
6/30/12
3/31/12
12/31/11
9/30/11
Continuing Operations
Non-interest expense (GAAP)
869
$
842
$
913
$
1,124
$
850
$
Adjustments:
Securities impairment, net
-
(2)
-
(2)
-
Branch consolidation and property and equipment charges
-
-
-
2
-
Goodwill impairment
-
-
-
(253)
-
Adjusted non-interest expense (non-GAAP)
G
869
$
840
$
913
$
871
$
850
$
Quarter Ended
The table below presents non-interest expense (GAAP) excluding certain adjustments to arrive at
adjusted non-interest expense (non- GAAP). Regions believes that the exclusion of these
adjustments provides a meaningful base for period-to-period comparisons, which
management believes will assist investors in analyzing the operating results of the Company and
predicting future performance. This non-GAAP financial measure is also used by
management to assess the performance of Regions' business. It is possible that the
activities related to the adjustments may recur; however, management does not consider the activities
related to the adjustments to be indications of ongoing operations. Regions believes that
presentation of this non-GAAP financial measure will permit investors to assess the
performance of the Company on the same basis as that applied by management . |
 16
NON-GAAP RECONCILIATION: TIER 1 COMMON
($ amounts in millions, except per share data)
9/30/12
6/30/12
3/31/12
12/31/11
9/30/11
As of and for Quarter Ended
TIER
1
COMMON
RISK-BASED
RATIO CONSOLIDATED
Stockholders' equity (GAAP)
14,901
$
14,455
$
17,534
$
16,499
$
17,263
$
Accumulated other comprehensive (income) loss
(202)
(54)
60
69
(92)
Non-qualifying goodwill and intangibles
(4,836)
(4,852)
(4,881)
(4,900)
(5,649)
Disallowed deferred tax assets
(238)
(336)
(345)
(432)
(506)
Disallowed servicing assets
(33)
(33)
(36)
(35)
(35)
Qualifying non-controlling interests
93
92
92
92
92
Qualifying trust preferred securities
846
846
846
846
846
Tier 1 capital (regulatory)
10,531
$
10,118
$
13,270
$
12,139
$
11,919
$
Qualifying non-controlling interests
(93)
(92)
(92)
(92)
(92)
Qualifying trust preferred securities
(846)
(846)
(846)
(846)
(846)
Preferred stock
-
-
(3,429)
(3,419)
(3,409)
Tier 1 common equity (non-GAAP)
O
9,592
$
9,180
$
8,903
$
7,782
$
7,572
$
Risk-weighted assets (regulatory)
P
91,723
91,779
92,546
91,449
92,786
Tier 1 common risk-based ratio (non-GAAP)
O/P
10.5%
10.0%
9.6%
8.5%
8.2%
The following table provides calculations of Tier 1 capital (regulatory) and "Tier 1 common
equity" (non-GAAP). Traditionally, the Federal Reserve and other banking
regulatory bodies have assessed a bank's capital adequacy based on Tier 1 capital, the calculation of
which is prescribed in amount by federal banking regulations. In connection with
the Company's Comprehensive Capital Assessment and Review ("CCAR"), these regulators are supplementing their assessment of the capital
adequacy of a bank based on a variation of Tier 1 capital, known as Tier 1 common equity. While
not prescribed in amount by federal banking regulations, analysts and banking regulators
have assessed Regions' capital adequacy using the Tier 1 common equity measure. Because Tier 1 common equity is not formally defined
by GAAP or prescribed in any amount by federal banking regulations, this measure is considered to be a
non-GAAP financial measure and other entities may calculate it differently than
Regions' disclosed calculations. Since analysts and banking regulators may assess Regions' capital adequacy using Tier 1 common equity,
management believe s that it is useful to provide investors the ability to assess Regions' capital
adequacy on this same bases. Tier 1 common equity is often expressed as a percentage of risk-weighted assets. Under the
risk-based capital framework, a company's balance sheet assets and credit equivalent
amounts of off-balance sheet items are assigned to one of four broad risk categories. The aggregated dollar amount in each category is then
multiplied by the risk-weighted category. The resulting weighted values from each of the four
categories are added together and this sum is the risk-weighted assets total that, as
adjusted, comprises the denominator of certain risk-based capital ratios. Tier 1 capital is then divided by this denominator (risk-weighted assets) to
determine the Tier 1 capital ratio. Adjustments are made to Tier 1 capital to arrive at Tier 1
common equity (non-GAAP). Tier 1 common equity (non-GAAP) is also divided by the
risk-weighted assets to determine the Tier 1 common equity ratio (non-GAAP). The amounts disclosed as risk-weighted assets are calculated consistent
with banking regulatory requirements.
|
 17
NON-GAAP RECONCILIATION: TIER 1 CAPITAL
Regions' Series A preferred stock was repurchased on April 4, 2012 and the warrant
to purchase 48.3 million shares of Regions common stock was retired on May
2, 2012. The following table presents the calculations of Tier 1 capital and the Tier 1 capital
ratio,
adjusted
as
if
the
repurchase
of
the
shares
and
the
retirement
of
the
warrant
occurred
on
the
last
day
of
the
quarter
for
each
prior period presented. The amount retired includes the Series A preferred
stock plus the remaining balance of the related discount. ($ amounts in
millions) 9/30/12
6/30/12
3/31/12
12/31/11
9/30/11
TIER 1 RISK-BASED RATIO
Stockholders' equity
14,901
$
14,455
$
17,534
$
16,499
$
17,263
$
Accumulated other comprehensive (income) loss
(202)
(54)
60
69
(92)
Non-qualifying goodwill and intangibles
(4,836)
(4,852)
(4,881)
(4,900)
(5,649)
Disallowed deferred tax assets
(238)
(336)
(345)
(432)
(506)
Disallowed servicing assets
(33)
(33)
(36)
(35)
(35)
Qualifying non-controlling interests
93
92
92
92
92
Qualifying trust preferred securities
846
846
846
846
846
Tier 1 capital as reported
10,531
$
10,118
$
13,270
$
12,139
$
11,919
$
Series A Preferred Stock Retirement (Reduction to Stockholders' equity)
-
$
-
$
(3,500)
$
(3,500)
$
(3,500)
$
Retirement
of
warrant
to
purchase
48.3
million
shares
of
Regions
common
stock
-
-
(45)
(45)
(45)
Tier 1 capital as adjusted to exclude Series A Preferred Stock
10,531
$
10,118
$
9,725
$
8,594
$
8,374
$
Risk-weighted assets
(1)
91,723
91,779
92,546
91,449
92,786
Tier
1
capital
ratio
(1)
11.5%
11.0%
14.3%
13.3%
12.8%
(1)
11.5%
11.0%
10.5%
9.4%
9.0%
Quarter Ended
Tier 1 capital ratio excluding Series A Preferred Stock and associated warrant |
 18
NON-GAAP RECONCILIATION: BASEL III
Estimate based on June
2012 U.S. Notices of
Proposed Rulemaking
($ amounts in millions)
9/30/2012
Stockholders' equity (GAAP)
14,901
$
Non-qualifying goodwill and intangibles
(4,987)
Adjustments, including other comprehensive income related to cash flow hedges,
disallowed deferred
tax assets, threshold deductions and other adjustments
(312)
Basel III Tier 1 Common (non-GAAP)
9,602
$
Basel I risk-weighted assets
91,723
$
Basel III risk-weighted assets
110,449
$
Basel III Tier 1 Common Ratio
8.7%
(1)
Under Basel III, regulatory capital must be reduced by purchased credit card relationship intangible
assets. The majority of these assets are allowed in Basel I capital. (2)
Regions continues to develop systems and internal controls to precisely calculate risk-weighted
assets as required by Basel III. The amount included above is a reasonable approximation, based
on our understanding of the requirements.
The following table provides calculations of Tier 1 common, based on Regions’ current
understanding of Basel III requirements, as proposed by the U.S. Notices of Proposed Rulemaking
released in June 2012. Regions currently calculates its risk-based capital ratios under guidelines adopted by the
Federal Reserve based on the 1988 Capital Accord (“Basel I”) of the Basel Committee on
Banking Supervision (the “Basel Committee”). In December 2010, the Basel
Committee released its final framework for Basel III, which will strengthen international capital and liquidity regulation. In June 2012, U.S.
Regulators released three separate Notices of Proposed Rulemaking covering U.S. implementation of the
Basel III framework. When implemented by U.S. bank regulatory agencies and fully
phased-in, Basel III will change capital requirements and place greater emphasis on common equity.
Implementation of Basel III will begin on January 1, 2013, and will be phased in over a six-year
period. The calculations provided below are estimates, based on Regions’ current
understanding of the framework, including the Company’s reading of the requirements, and informal feedback received
through the regulatory process. Regions’ understanding of the framework is evolving and
will likely change as the regulations are finalized. Because the Basel III implementation
regulations are not formally defined by GAAP and have not yet been finalized and codified, these measures are considered to be
non-GAAP financial measures, and other entities may calculate them differently from Regions’
disclosed calculations. Since analysts and banking regulators may assess Regions’
capital adequacy using the Basel III framework, we believe that it is useful to provide investors the ability to assess
Regions’ capital adequacy on the same basis. (2)
(1) |
 |