Attached files
| file | filename |
|---|---|
| 8-K - CURRENT REPORT OF MATERIAL EVENTS OR CORPORATE CHANGES - DYNEGY INC. | a12-26955_18k.htm |
Exhibit 99.1
|
|
Dynegy Inc. Clint Freeland, Chief Financial Officer 2012 Citi High Yield and Leveraged Finance Conference November 14, 2012 |
|
|
Forward-Looking Statements 2 Cautionary Statement Regarding Forward-Looking Statements This presentation contains statements reflecting assumptions, expectations, projections, intentions or beliefs about future events that are intended as “forward looking statements.” You can identify these statements by the fact that they do not relate strictly to historical or current facts. Management cautions that any or all of Dynegy’s forward-looking statements may turn out to be wrong. Please read Dynegy’s annual, quarterly and current reports filed under the Securities Exchange Act of 1934, including its 2011 Form 10-K as amended, and first, second and third quarter 2012 Forms 10-Q, for additional information about the risks, uncertainties and other factors affecting these forward-looking statements and Dynegy generally. Dynegy’s actual future results may vary materially from those expressed or implied in any forward-looking statements. All of Dynegy’s forward-looking statements, whether written or oral, are expressly qualified by these cautionary statements and any other cautionary statements that may accompany such forward-looking statements. In addition, Dynegy disclaims any obligation to update any forward-looking statements to reflect events or circumstances after the date hereof. Non-GAAP Financial Measures This presentation contains non-GAAP financial measures including EBITDA, Adjusted EBITDA and Net Debt. Reconciliations of these measures to the most directly comparable GAAP financial measures to the extent available without unreasonable effort are contained herein. To the extent required, statements disclosing the utility and purposes of these measures are set forth in Item 2.02 to our current report on Form 8-K filed with the SEC on November 7, 2012, which is available on our website free of charge, www.dynegy.com. |
|
|
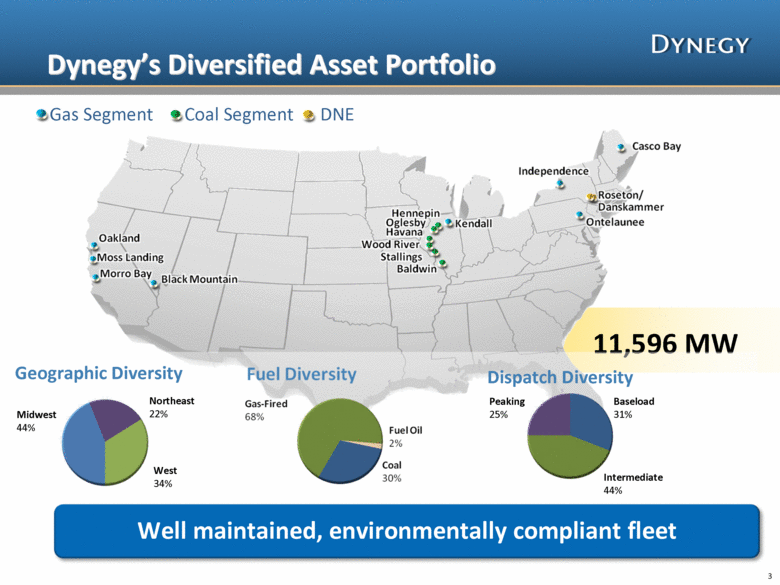
Dynegy’s Diversified Asset Portfolio 3 11,596 MW Dispatch Diversity Peaking 25% Intermediate 44% Baseload 31% Geographic Diversity Midwest 44% Northeast 22% West 34% Gas Segment Coal Segment DNE Well maintained, environmentally compliant fleet |
|
|
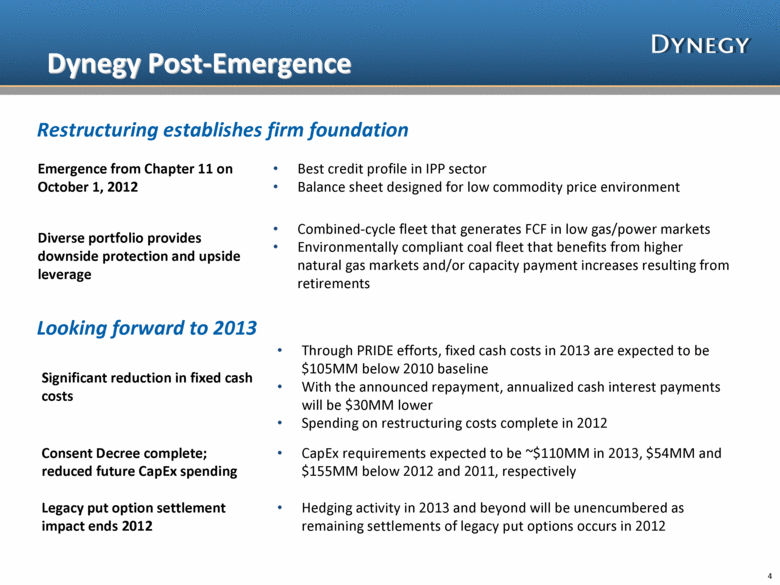
Dynegy Post-Emergence 4 Emergence from Chapter 11 on October 1, 2012 Best credit profile in IPP sector Balance sheet designed for low commodity price environment Diverse portfolio provides downside protection and upside leverage Combined-cycle fleet that generates FCF in low gas/power markets Environmentally compliant coal fleet that benefits from higher natural gas markets and/or capacity payment increases resulting from retirements Significant reduction in fixed cash costs Through PRIDE efforts, fixed cash costs in 2013 are expected to be $105MM below 2010 baseline With the announced repayment, annualized cash interest payments will be $30MM lower Spending on restructuring costs complete in 2012 Consent Decree complete; reduced future CapEx spending CapEx requirements expected to be ~$110MM in 2013, $54MM and $155MM below 2012 and 2011, respectively Legacy put option settlement impact ends 2012 Hedging activity in 2013 and beyond will be unencumbered as remaining settlements of legacy put options occurs in 2012 Restructuring establishes firm foundation Looking forward to 2013 |
|
|
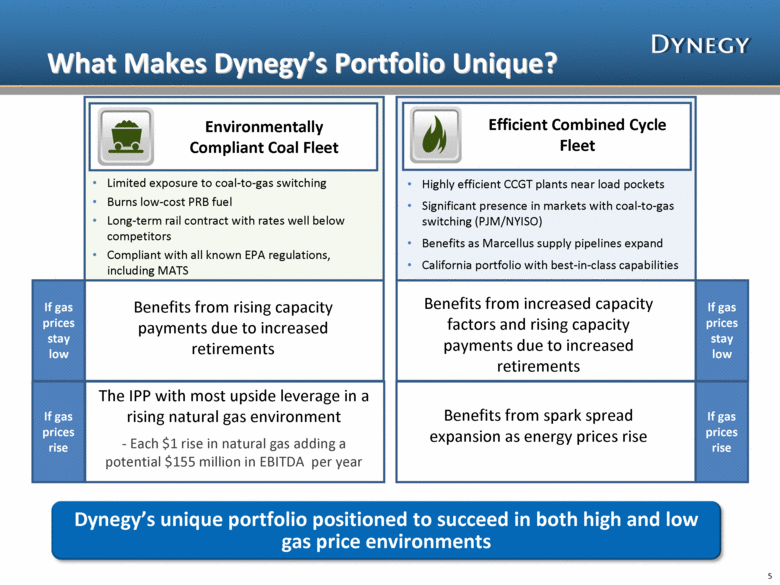
What Makes Dynegy’s Portfolio Unique? 5 Limited exposure to coal-to-gas switching Burns low-cost PRB fuel Long-term rail contract with rates well below competitors Compliant with all known EPA regulations, including MATS Highly efficient CCGT plants near load pockets Significant presence in markets with coal-to-gas switching (PJM/NYISO) Benefits as Marcellus supply pipelines expand California portfolio with best-in-class capabilities If gas prices stay low If gas prices rise Benefits from rising capacity payments due to increased retirements The IPP with most upside leverage in a rising natural gas environment - Each $1 rise in natural gas adding a potential $155 million in EBITDA per year Benefits from increased capacity factors and rising capacity payments due to increased retirements Benefits from spark spread expansion as energy prices rise Dynegy’s unique portfolio positioned to succeed in both high and low gas price environments If gas prices stay low If gas prices rise Efficient Combined Cycle Fleet Environmentally Compliant Coal Fleet |
|
|
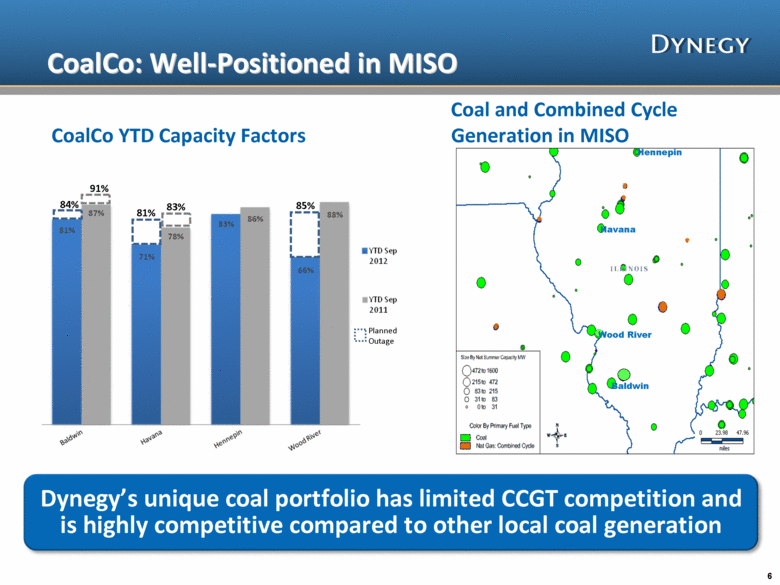
6 CoalCo: Well-Positioned in MISO Hennepin Havana Wood River Baldwin CoalCo YTD Capacity Factors Coal and Combined Cycle Generation in MISO Dynegy’s unique coal portfolio has limited CCGT competition and is highly competitive compared to other local coal generation 84% 91% 81% 83% 85% Planned Outage |
|
|
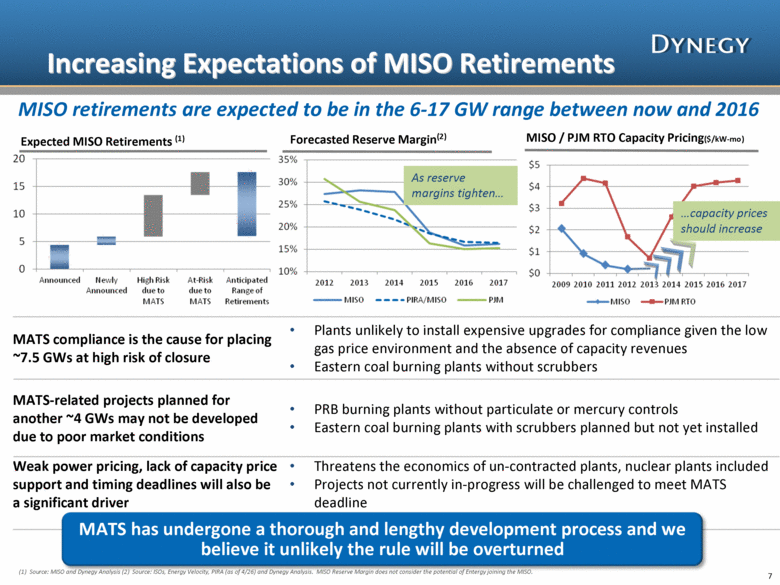
Increasing Expectations of MISO Retirements MISO retirements are expected to be in the 6-17 GW range between now and 2016 MATS compliance is the cause for placing ~7.5 GWs at high risk of closure Plants unlikely to install expensive upgrades for compliance given the low gas price environment and the absence of capacity revenues Eastern coal burning plants without scrubbers MATS-related projects planned for another ~4 GWs may not be developed due to poor market conditions PRB burning plants without particulate or mercury controls Eastern coal burning plants with scrubbers planned but not yet installed Weak power pricing, lack of capacity price support and timing deadlines will also be a significant driver Threatens the economics of un-contracted plants, nuclear plants included Projects not currently in-progress will be challenged to meet MATS deadline MATS has undergone a thorough and lengthy development process and we believe it unlikely the rule will be overturned Expected MISO Retirements (1) Forecasted Reserve Margin(2) (1) Source: MISO and Dynegy Analysis (2) Source: ISOs, Energy Velocity, PIRA (as of 4/26) and Dynegy Analysis. MISO Reserve Margin does not consider the potential of Entergy joining the MISO. MISO / PJM RTO Capacity Pricing($/kW-mo) As reserve margins tighten capacity prices should increase 7 |
|
|
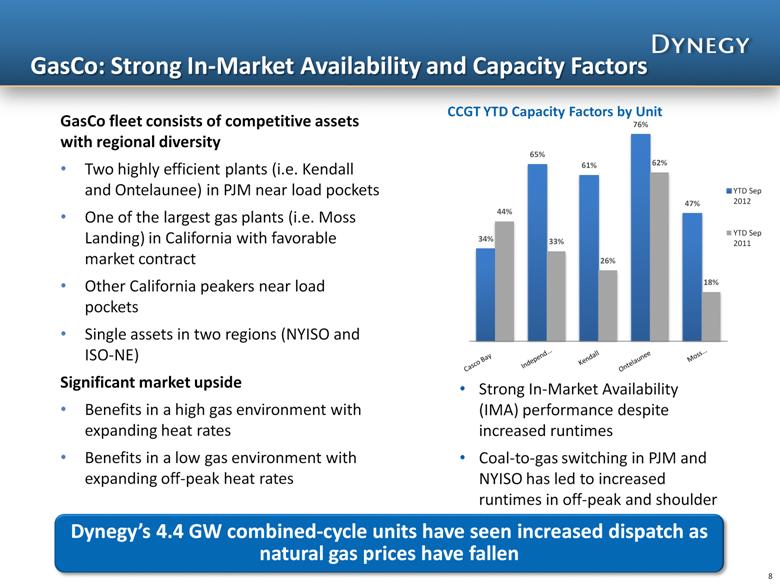
GasCo: Strong In-Market Availability and Capacity Factors 8 CCGT YTD Capacity Factors by Unit GasCo fleet consists of competitive assets with regional diversity Two highly efficient plants (i.e. Kendall and Ontelaunee) in PJM near load pockets One of the largest gas plants (i.e. Moss Landing) in California with favorable market contract Other California peakers near load pockets Single assets in two regions (NYISO and ISO-NE) Significant market upside Benefits in a high gas environment with expanding heat rates Benefits in a low gas environment with expanding off-peak heat rates Strong In-Market Availability (IMA) performance despite increased runtimes Coal-to-gas switching in PJM and NYISO has led to increased runtimes in off-peak and shoulder hours Dynegy’s 4.4 GW combined-cycle units have seen increased dispatch as natural gas prices have fallen |
|
|
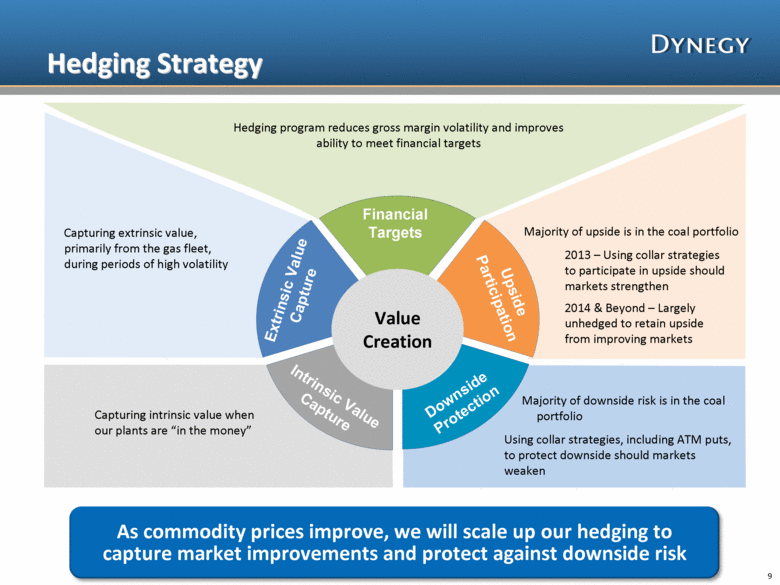
9 Hedging Strategy Value Creation Hedging program reduces gross margin volatility and improves ability to meet financial targets Majority of upside is in the coal portfolio Upside Participation Downside Protection Extrinsic Value Capture Financial Targets Intrinsic Value Capture 2013 – Using collar strategies to participate in upside should markets strengthen 2014 & Beyond – Largely unhedged to retain upside from improving markets Capturing extrinsic value, primarily from the gas fleet, during periods of high volatility As commodity prices improve, we will scale up our hedging to capture market improvements and protect against downside risk Capturing intrinsic value when our plants are “in the money” Using collar strategies, including ATM puts, to protect downside should markets weaken Majority of downside risk is in the coal portfolio |
|
|
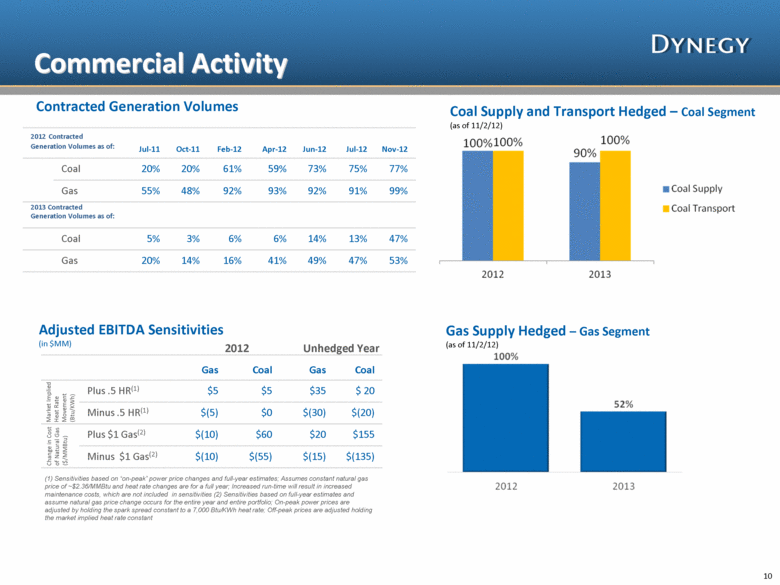
Commercial Activity 10 Contracted Generation Volumes Coal Supply and Transport Hedged – Coal Segment (as of 11/2/12) Gas Coal Gas Coal Plus .5 HR(1) $5 $5 $35 $ 20 Minus .5 HR(1) $(5) $0 $(30) $(20) Plus $1 Gas(2) $(10) $60 $20 $155 Minus $1 Gas(2) $(10) $(55) $(15) $(135) Adjusted EBITDA Sensitivities (in $MM) 2012 Unhedged Year Market Implied Heat Rate Movement (Btu/KWh) Change in Cost of Natural Gas ($/MMBtu) (1) Sensitivities based on “on-peak” power price changes and full-year estimates; Assumes constant natural gas price of ~$2.36/MMBtu and heat rate changes are for a full year; Increased run-time will result in increased maintenance costs, which are not included in sensitivities (2) Sensitivities based on full-year estimates and assume natural gas price change occurs for the entire year and entire portfolio; On-peak power prices are adjusted by holding the spark spread constant to a 7,000 Btu/KWh heat rate; Off-peak prices are adjusted holding the market implied heat rate constant Gas Supply Hedged – Gas Segment (as of 11/2/12) 2012 Contracted Generation Volumes as of: Jul-11 Oct-11 Feb-12 Apr-12 Jun-12 Jul-12 Nov-12 Coal 20% 20% 61% 59% 73% 75% 77% Gas 55% 48% 92% 93% 92% 91% 99% 2013 Contracted Generation Volumes as of: Coal 5% 3% 6% 6% 14% 13% 47% Gas 20% 14% 16% 41% 49% 47% 53% |
|
|
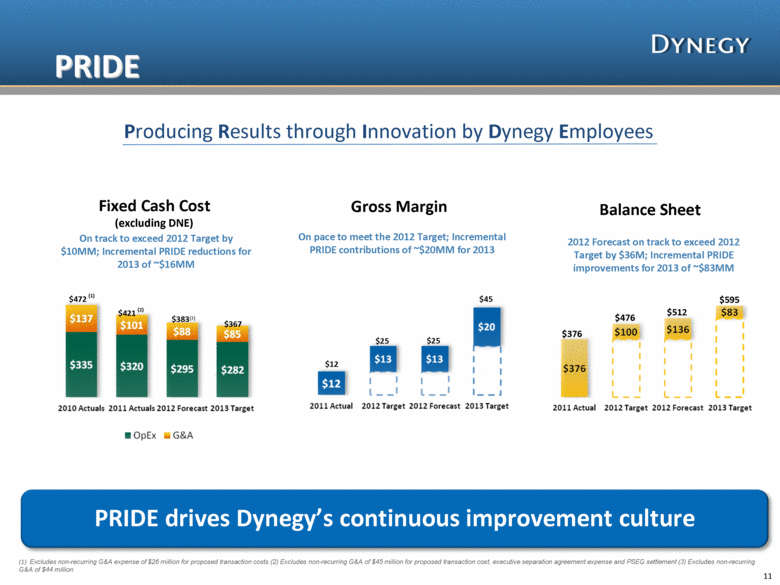
11 Fixed Cash Cost (excluding DNE) Gross Margin Balance Sheet On track to exceed 2012 Target by $10MM; Incremental PRIDE reductions for 2013 of ~$16MM PRIDE drives Dynegy’s continuous improvement culture On pace to meet the 2012 Target; Incremental PRIDE contributions of ~$20MM for 2013 $25 $25 $12 $472 (1) $421 (2) 2012 Forecast on track to exceed 2012 Target by $36M; Incremental PRIDE improvements for 2013 of ~$83MM $383(3) PRIDE (1) Excludes non-recurring G&A expense of $26 million for proposed transaction costs (2) Excludes non-recurring G&A of $45 million for proposed transaction cost, executive separation agreement expense and PSEG settlement (3) Excludes non-recurring G&A of $44 million $367 $45 Producing Results through Innovation by Dynegy Employees $376 $476 $512 $595 |
|
|
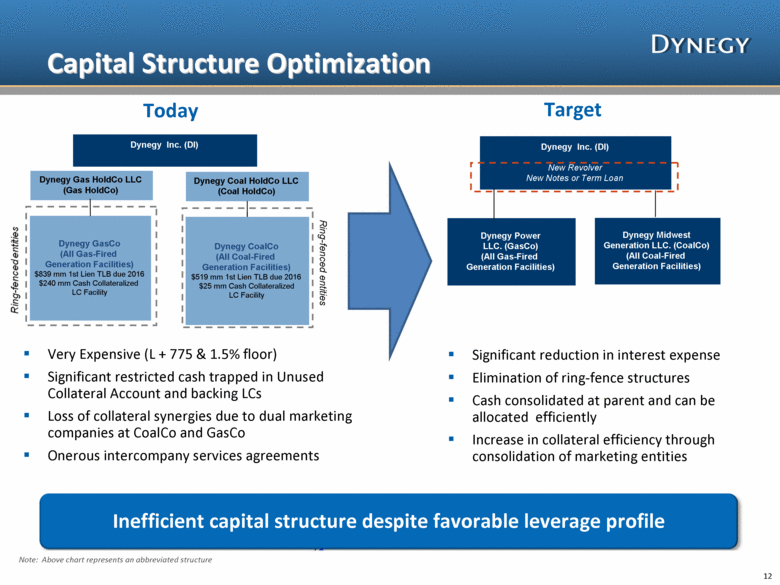
Dynegy Inc. (DI) Dynegy Coal HoldCo LLC (Coal HoldCo) Ring-fenced entities Dynegy Gas HoldCo LLC (Gas HoldCo) Dynegy CoalCo (All Coal-Fired Generation Facilities) $519 mm 1st Lien TLB due 2016 $25 mm Cash Collateralized LC Facility Dynegy GasCo (All Gas-Fired Generation Facilities) $839 mm 1st Lien TLB due 2016 $240 mm Cash Collateralized LC Facility 10 Capital Structure Optimization Inefficient capital structure despite favorable leverage profile Very Expensive (L + 775 & 1.5% floor) Significant restricted cash trapped in Unused Collateral Account and backing LCs Loss of collateral synergies due to dual marketing companies at CoalCo and GasCo Onerous intercompany services agreements 12 Dynegy Inc. (DI) New Revolver New Notes or Term Loan Dynegy Power LLC. (GasCo) (All Gas-Fired Generation Facilities) Dynegy Midwest Generation LLC. (CoalCo) (All Coal-Fired Generation Facilities) Significant reduction in interest expense Elimination of ring-fence structures Cash consolidated at parent and can be allocated efficiently Increase in collateral efficiency through consolidation of marketing entities Today Target Note: Above chart represents an abbreviated structure |
|
|
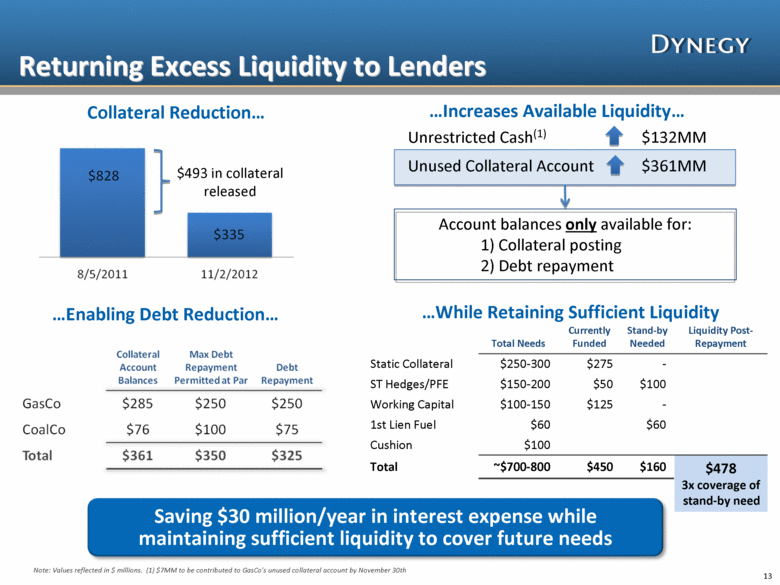
13 Returning Excess Liquidity to Lenders Note: Values reflected in $ millions. (1) $7MM to be contributed to GasCo’s unused collateral account by November 30th Total Needs Currently Funded Stand-by Needed Liquidity Post- Repayment Static Collateral $250-300 $275 - ST Hedges/PFE $150-200 $50 $100 Working Capital $100-150 $125 - 1st Lien Fuel $60 $60 Cushion $100 Total ~$700-800 $450 $160 $478 3x coverage of stand-by need Collateral Reduction Increases Available Liquidity Account balances only available for: 1) Collateral posting 2) Debt repayment Enabling Debt Reduction While Retaining Sufficient Liquidity Unrestricted Cash(1) $132MM Unused Collateral Account $361MM $493 in collateral released Saving $30 million/year in interest expense while maintaining sufficient liquidity to cover future needs |
|
|
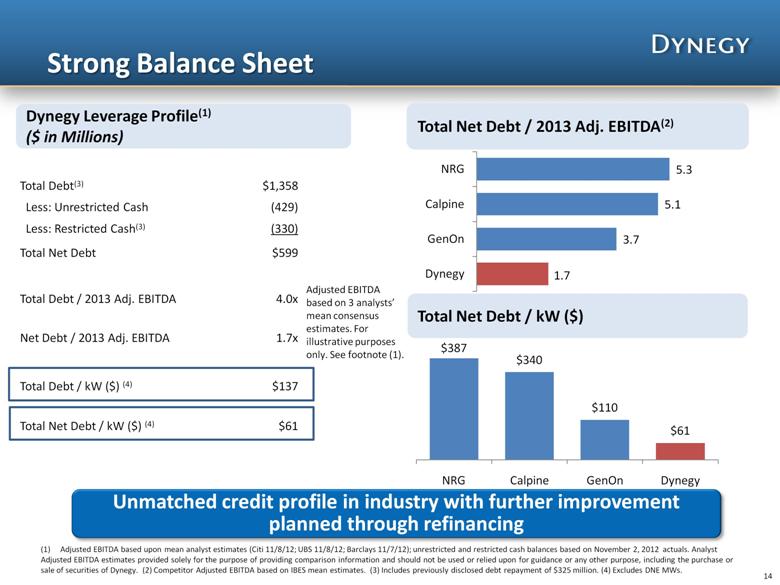
Strong Balance Sheet Unmatched credit profile in industry with further improvement planned through refinancing Total Debt(3) $1,358 Less: Unrestricted Cash (429) Less: Restricted Cash(3) (330) Total Net Debt $599 Total Debt / 2013 Adj. EBITDA 4.0x Net Debt / 2013 Adj. EBITDA 1.7x Total Debt / kW ($) (4) $137 Total Net Debt / kW ($) (4) $61 Dynegy Leverage Profile(1) ($ in Millions) Total Net Debt / 2013 Adj. EBITDA(2) Total Net Debt / kW ($) 14 Adjusted EBITDA based upon mean analyst estimates (Citi 11/8/12; UBS 11/8/12; Barclays 11/7/12); unrestricted and restricted cash balances based on November 2, 2012 actuals. Analyst Adjusted EBITDA estimates provided solely for the purpose of providing comparison information and should not be used or relied upon for guidance or any other purpose, including the purchase or sale of securities of Dynegy. (2) Competitor Adjusted EBITDA based on IBES mean estimates. (3) Includes previously disclosed debt repayment of $325 million. (4) Excludes DNE MWs. Adjusted EBITDA based on 3 analysts’ mean consensus estimates. For illustrative purposes only. See footnote (1). (1) |
|
|
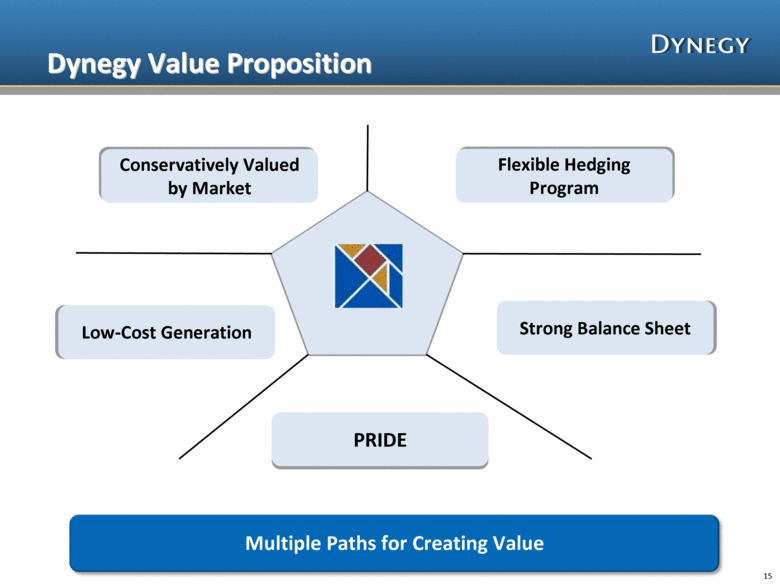
Dynegy Value Proposition Multiple Paths for Creating Value 15 Conservatively Valued by Market Flexible Hedging Program Low-Cost Generation Strong Balance Sheet PRIDE |