Attached files
| file | filename |
|---|---|
| 8-K - FORM 8-K - ASPEN INSURANCE HOLDINGS LTD | d438450d8k.htm |
 INVESTOR
PRESENTATION
THIRD QUARTER 2012
Aspen Insurance Holdings Limited
Exhibit 99.1 |
 AHL: NYSE
2
This
slide
presentation
is
for
information
purposes
only.
It
should
be
read
in
conjunction
with
our
financial
supplement
posted
on
our
website
on
the
Investor
Relations
page
and with
other
documents
filed
or
to
be
filed
shortly
by
Aspen
Insurance
Holdings
Limited
(the
“Company”
or
“Aspen”)
with
the
US
Securities
and
Exchange
Commission.
Non-GAAP Financial Measures
In presenting Aspen's results, management has included and discussed certain
"non-GAAP financial measures", as such term is defined in Regulation G. Management believes
that these non-GAAP financial measures, which may be defined differently by
other companies, better explain Aspen's results of operations in a manner that allows for a more
complete understanding of the underlying trends in Aspen's business. However, these
measures should not be viewed as a substitute for those determined in accordance with
GAAP. The reconciliation of such non-GAAP financial measures to their
respective most directly comparable GAAP financial measures in accordance with Regulation G is
included
herein
or
in
the
financial
supplement,
as
applicable,
which
can
be
obtained
from
the
Investor
Relations
section
of
Aspen's
website
at
www.aspen.co.
Application of the Safe Harbor of the Private Securities Litigation Reform Act of
1995: This
presentation
contains,
written
or
oral
"forward-looking
statements"
within
the
meaning
of
the
US
federal
securities
laws.
These
statements
are
made
pursuant
to
the
safe
harbor provisions of the Private Securities Litigation Reform Act of 1995.
Forward-looking statements include all statements that do not relate solely to historical or current facts,
and
can
be
identified
by
the
use
of
words
such
as
"expect,"
"intend,"
"plan,"
"believe,"
“do
not
believe,”
“aim,”
"project,"
"anticipate,"
"seek,"
"will,"
"estimate,"
"may,"
"continue,"
“guidance,”
and similar expressions of a future or forward-looking nature.
All forward-looking
statements
address
matters
that
involve
risks
and
uncertainties.
Accordingly,
there
are
or
will
be
important
factors
that
could
cause
actual
results
to
differ
materially from those indicated in these statements. Aspen believes these factors
include, but are not limited to: the possibility of greater frequency or severity of claims and loss
activity, including as a result of natural or man-made (including economic and
political risks) catastrophic or material loss events, than our underwriting, reserving, reinsurance
purchasing or investment practices have anticipated; the reliability of, and
changes in assumptions to, natural and man-made catastrophe pricing, accumulation and estimated
loss
models;
evolving
issues
with
respect
to
interpretation
of
coverage
after
major
loss
events
and
any
intervening
legislative
or
governmental
action
and
changing
judicial
interpretation
and
judgments
on
insurers’
liability
to
various
risks;
the
effectiveness
of
our
loss
limitation
methods;
changes
in
the
total
industry
losses,
or
our
share
of
total
industry
losses,
resulting
from
past
events
and,with
respect
to
such
events,
our
reliance
on
loss
reports
received
from
cedants
and
loss
adjustors,
our
reliance
on
industry
loss
estimates
and
those
generated
by
modeling
techniques,
changes
in
rulings
on
flood
damage
or
other
exclusions
as
a
result
of
prevailing
lawsuits
and
case
law;
the
impact
of
acts of terrorism and acts of war and related legislation; decreased demand for our
insurance or reinsurance products and cyclical changes in the insurance and reinsurance
sectors;
any
changes
in
our
reinsurers’
credit
quality
and
the
amount
and
timing
of
reinsurance
recoverables;
changes
in
the
availability,
cost
or
quality
of
reinsurance
or
retrocessional coverage; the continuing and uncertain impact of the current
depressed economic environment in many of the countries in which we operate; the persistence of
the global financial crisis and the Eurozone debt crisis; the level of inflation in
repair costs due to limited availability of labor and materials after catastrophes; changes in
insurance and reinsurance market conditions; increased competition on the basis of
pricing, capacity, coverage terms or other factors and the related demand and supply
dynamics
as
contracts
come
up
for
renewal;
a
decline
in
our
operating
subsidiaries’
ratings
with
Standard
&
Poor’s
(“S&P”),
A.M.
Best
Company,
Inc.
(“A.M.
Best”)
or
Moody’s
Investor Service (“Moody’s”); our ability to execute our business
plan to enter new markets, introduce new products and develop new distribution channels, including their
integration
into
our
existing
operations;
changes
in
general
economic
conditions,
including
inflation,
foreign
currency
exchange
rates,
interest
rates
and
other
factors
that
could
affect our investment portfolio; the risk of a material decline in the value or
liquidity of all or parts of our investment portfolio; changes in our ability to exercise capital
management initiatives or to arrange banking facilities as a result of prevailing
market changes or changes in our financial position; changes in government regulations or tax
laws in jurisdictions where we conduct business; Aspen Holdings or Aspen Bermuda
becoming subject to income taxes in the United States or the United Kingdom; loss of key
personnel;
and
increased
counter
party
risk
due
to
the
credit
impairment of financial
institutions.
For
a
more
detailed
description
of
these
uncertainties
and
other factors,
please
see
the
"Risk
Factors"
section
in
Aspen's
Annual
Report
on
Form
10-K
as
filed
with
the
US
Securities
and
Exchange
Commission
on
February
28,
2012.
Aspen
undertakes
no
obligation to publicly update or revise any forward-looking statements, whether
as a result of new information, future events or otherwise. Readers are cautioned not to place
undue reliance on these forward-looking statements, which speak only as of the
dates on which they are made. In addition, any estimates relating to loss
events involve the exercise of considerable judgment and reflect a combination of ground-up evaluations, information available to date
from
brokers
and
cedants,
market
intelligence,
initial
tentative
loss
reports
and
other
sources.
The
actuarial
range
of
reserves
and
management's
best
estimate
represents
a
distribution
from
our
internal
capital
model
for
reserving
risk
based
on
our
then
current
state
of
knowledge
and
explicit
and
implicit
assumptions
relating
to
the
incurred
pattern
of claims,
the
expected
ultimate settlement
amount,
inflation
and
dependencies
between
lines
of
business.
Due
to
the
complexity
of
factors
contributing
to
the
losses
and
the
preliminary nature of the information used to prepare these estimates, there can be
no assurance that Aspen’s ultimate losses will remain within the stated amounts.
SAFE HARBOR DISCLOSURE |
 AHL: NYSE
3
•
Who We Are & What We Do
•
The Aspen Approach
•
Aspen’s Natural Catastrophe Exposures: Major Peril Zones
•
Delivering Strong Investment Returns
•
Proactive Management of Capital
•
Financial Highlights 3Q 2012 and YTD 2012
•
Appendix
•
Hurricane Sandy Industry Loss Estimates
•
Aspen’s Market Share of Industry Insured Losses, Net
•
Investment Portfolio by Asset Type
•
European Investment Exposure
•
Reserve Position
CONTENTS |
 STRONG
BALANCE SHEET
MULTI-PLATFORM
APPROACH
WELL DIVERSIFIED
PORTFOLIO
•
$3.6bn of shareholders’
equity as at September 30,
2012
•
Ratings of A/Stable (S&P),
A2/Stable (Moody’s) and
A/Stable (A.M. Best)
•
Diluted BVPS CAGR of
10.1% over five years to
September 30, 2012
•
$1.3bn ordinary capital
returned to shareholders
2003 –
3Q 2012
•
3 main underwriting
locations: London,
Bermuda and US
•
Branch offices: Paris,
Zurich, Cologne,
Singapore, Dublin and
US
•
More than 800
employees in 30 offices
across eight countries
•
Specialized in providing
customized underwriting
solutions to clients and
brokers across an array
of geographies, products
and perils
•
49% Reinsurance, 51%
Insurance
(3)
•
55% Property, 45%
Casualty
(3)
AHL: NYSE
4
•
Bermudian domiciled Specialty Insurer and Reinsurer
•
Founded
2002;
IPO
2003;
current
market
capital
of
$2.3bn
(1)
•
$2.2bn GWP in 2011; $2.4bn
± 5% GWP in
2012 (2)
(1) As at October 31, 2012
(2) Expected full year 2012 as at October 24, 2012
(3) Last twelve months through September 30, 2012
WHO WE ARE
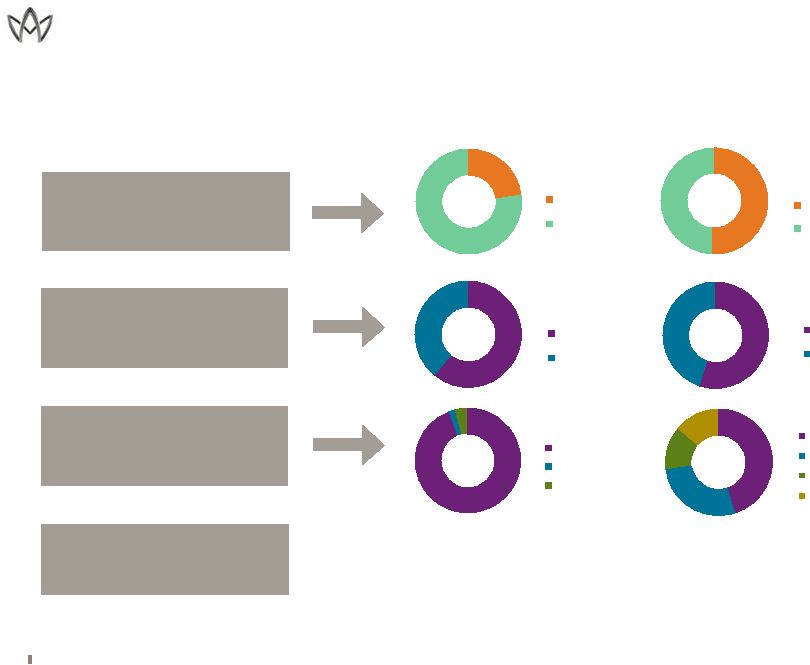
ASPEN GROUP |
 AHL: NYSE
5
INSURANCE VS.
REINSURANCE
(1)
PROPERTY VS.
CASUALTY
(1)
GWP BY “CORE”
PLATFORM
(1)
GLOBAL FOOTPRINT
•
176 employees
•
4 offices, 3 countries
•
800+ employees
•
30 offices, 8 countries
2003
September 30, 2012
(1)
By Gross Written Premium last twelve months through September 30, 2012
23%
77%
Insurance
Reinsurance
61%
39%
Property
Casualty
94%
UK
US
Bermuda
51%
49%
Insurance
Reinsurance
55%
45%
Property
Casualty
45%
28%
13%
14%
UK
US
Other
Bermuda
WHAT WE DO
ASPEN GROUP |
 ASPEN
APPROACH:
•
Established market leader
•
Presence in major market hubs enables close proximity to
customers
•
Deep expertise and understanding of client needs and
risks
•
Focus on smaller, specialized companies and risks to
maintain portfolio diversity
•
Focus on clients where reinsurance and reinsurance
relationships are a vital part of their business needs
AHL: NYSE
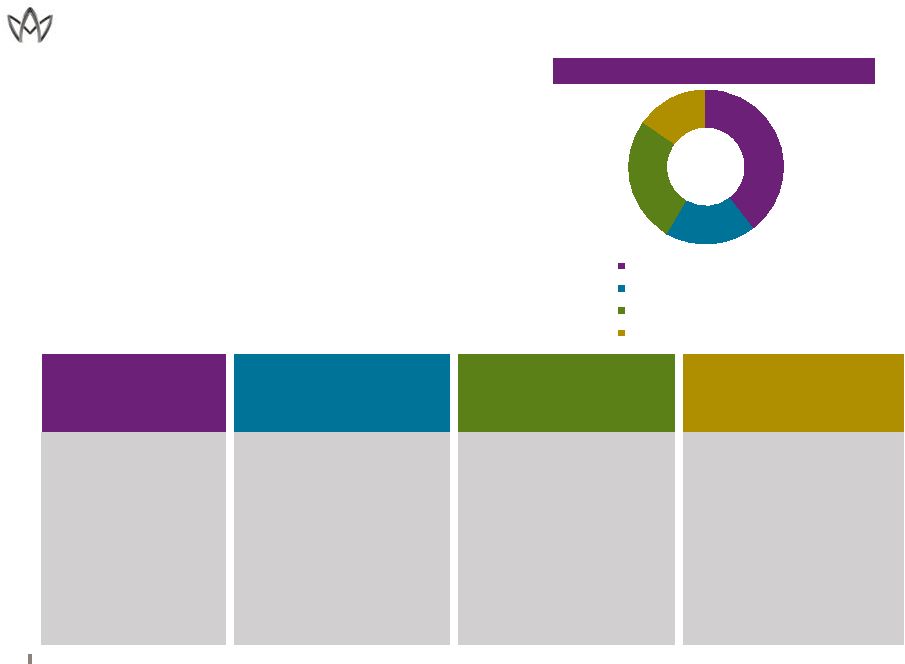
6
OTHER PROPERTY
REINSURANCE
CASUALTY REINSURANCE
SPECIALTY REINSURANCE
•
Treaty Catastrophe
•
Treaty Risk Excess
•
Treaty Pro Rata
•
Global Property Facultative
•
US Casualty Treaty
•
International Casualty
Treaty
•
Global Casualty Facultative
•
Credit & Surety
•
Agriculture
•
Other Specialty including
Aviation, Energy and
Marine
ANALYSIS
OF
GWP
BY
BUSINESS
LINE
(1)
(1)
Gross Written Premium for the last twelve months through September 30, 2012
PROPERTY CATASTROPHE
REINSURANCE
WHAT WE DO
REINSURANCE: OVERVIEW AND STRATEGY
24%
26%
27%
23%
Property Catastrophe Reinsurance
Other Property Reinsurance
Casualty Reinsurance
Specialty Reinsurance |
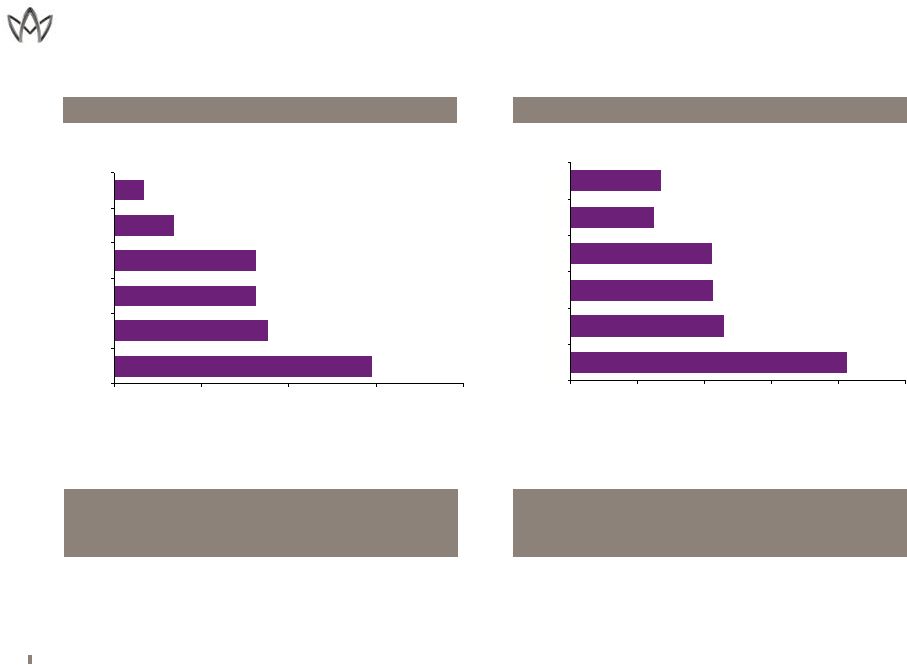
 ASPEN
APPROACH: •
Innovative specialist ‘E&S’
type approach to underwriting
within insurance operations
•
Strong emphasis on complex risks
•
Portfolio of highly differentiated insurance risks
•
Divisional focus complements in-house underwriting expertise
AHL: NYSE
7
MARINE, ENERGY,
AVIATION AND
TRANSPORTATION
FINANCIAL AND
PROFESSIONAL LINES
PROPERTY INSURANCE
CASUALTY INSURANCE
•
Marine, Energy, and
Construction Liability
•
Energy Property
•
Marine Hull
•
Specie
•
Aviation
•
US Marine
•
Financial Institutions
•
Credit, Political & Terrorism
•
Kidnap & Ransom
•
UK Professional Indemnity
•
UK Management Liability
•
Technology Liability
•
US Professional Liability
•
US Management Liability
•
Surety
•
US Property
•
US Programs
•
UK Property
•
UK Regional Property
•
Global Casualty
•
UK Liability
•
UK Regional Liability
•
Environmental Liability
•
US Primary Casualty
•
US Excess Casualty
ANALYSIS
OF
GWP
BY
BUSINESS
LINE
(1)
(1)
Gross Written Premium for the last twelve months through September 30, 2012
40%
19%
26%
15%
Marine, Energy and Transportation
Financial and Professional Lines
Property Insurance
Casualty Insurance
WHAT WE DO
INSURANCE: OVERVIEW AND STRATEGY |
 AHL: NYSE
8
•
Continue
diversification
strategy
by
product
and
geography,
with
a
focus
on more pronounced growth markets
•
Further development of local market strategy with dedicated teams in:
•
Continental Europe (Zurich), Asia (Singapore), Latin America (Miami)
and Middle East (London)
•
Implementation of cross-selling strategy to drive synergies across
Property, Casualty and Specialty Lines
•
Improving the Market
•
Provide our underwriters with data and facts to support the argument
for improved prices
•
Development of specific actions, by product and territory, to achieve
more adequate rates
Selective
Growth
in
Exposures
We
Know
and
Understand,
Subject
to
Market
Conditions
Business
Key Elements
THE ASPEN APPROACH
REINSURANCE: 2012 AND BEYOND |
 •
Strong leadership
•
Established teams –
Property, Professional Liability, Management Liability,
Marine,
Primary
Casualty,
Surety,
Excess
Casualty,
Environmental
Liability
and Programs
•
Building
momentum
–
teams
executing
on
strategies
with
all
licenses
in
place
AHL: NYSE
9
•
Round
out
‘London
Market’
portfolio
•
Further development of UK regional platform
•
Established a foothold in the Swiss insurance market
•
Strong demand for Marine, Energy, Political Risk and Kidnap & Ransom
Selective
Growth
in
Exposures
We
Know
and
Understand,
Subject
to
Market
Conditions
Platform
Key Elements
THE ASPEN APPROACH
INSURANCE: 2012 AND BEYOND |
 AHL: NYSE
10
(1)
1 in 100 year tolerance: 17.5% of total
shareholders’
equity
250
year
return
period
as
%
of
total
Shareholders’
Equity
100
year
return
period
as
%
of
total
Shareholders’
Equity
14.7%
8.8%
8.1%
8.1%
3.4%
1.7%
0%
5%
10%
15%
20%
U.S. All Wind
California EQ
European Wind
Japan All Perils
U.S. Pacific NW EQ
U.S. Eastern EQ
100 year return period as % of Total Shareholders' Equity
ASPEN’S NATURAL CATASTROPHE EXPOSURES: MAJOR PERIL ZONES
1 in 250 year tolerance: 25.0% of total
shareholders’
equity
20.7%
11.5%
10.7%
10.6%
6.2%
6.8%
0%
5%
10%
15%
20%
25%
250 year return period as % of Total Shareholders' Equity
U.S. All Wind
California EQ
European Wind
Japan All Perils
U.S. Pacific NW EQ
U.S. Eastern EQ
Based on Shareholders' equity of $3,554.2 million at September 30, 2012. The estimates reflect Aspen's
own view of the modelled maximum losses at the return periods shown which include input from
various third party vendor models and our own proprietary adjustments to these models. Catastrophe loss experience may materially differ from the modelled PML’s
due to limitations in one or more of the models or uncertainties in the application of policy terms
and limits. |
 0%
5%
10%
15%
20%
25%
30%
Corporate bonds
Agency MBS
Cash and cash equivalents
US government
Foreign government
Short-term
Agency debentures
Equity
Bonds backed by foreign government
CMBS
ABS
Munis
High Yield
FDIC guaranteed
AHL: NYSE
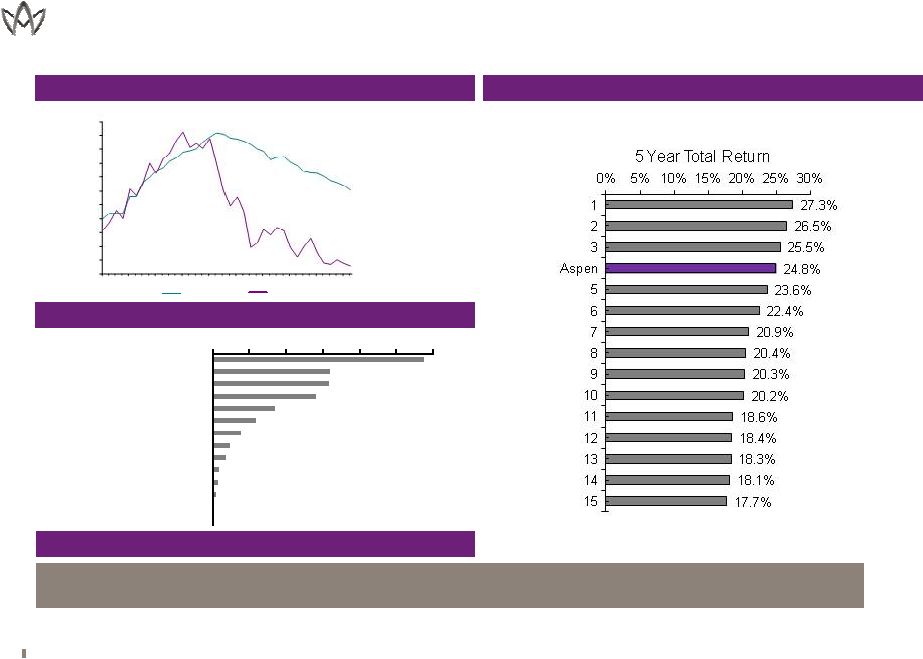
DELIVERING STRONG INVESTMENT RETURNS
11
(1)
(1)
INVESTMENT PORTFOLIO ASSET CLASS AND SECTOR ALLOCATIONS
$8.1 BILLION AS AT SEPTEMBER 30, 2012
Outperformance vs. Peers; Aspen Ranked #4 for 5 Year Total Return
5 YEAR TOTAL RETURN
(1)
VS. PEERS
(2)
ASPEN’S FIXED INCOME BOOK YIELD vs. 3 YR TREASURY YIELD SINCE 2003
(1) 5 year cumulative performance as at June 30, 2012
(2) Peers
include
ACGL,
ALTE,
AWH,
AXS,
ENH,
MRH,
PRE,
PTP,
RE,
RNR,
TRH,
XL
–
VR
data
not
available
for
5
years
3.0%
0.3%
0.0%
0.5%
1.0%
1.5%
2.0%
2.5%
3.0%
3.5%
4.0%
4.5%
5.0%
5.5%
2003
2004
2005
2006
2007
2008
2009
2010
2011
2012
Aspen FI Book Yield
3YR Treas Mkt Yield |
 AHL: NYSE
12
CAPITAL MANAGEMENT STRATEGY
•
Maintain capital at levels that satisfy all regulatory and rating agency
requirements as well as internal metrics
•
Optimize capital structure; conservatively leverage the balance sheet using high
equity content preferred shares
•
Issued $160 million 7.250% Perpetual Non-Cumulative Preference Shares in April
2012 •
Competitive dividend yield; quarterly dividend increased 13% in 1Q 2012
•
Return capital to shareholders
•
Continue to monitor trading activity to repurchase shares at attractive
levels •
Repurchased $50 million of ordinary shares in the open market under the share
repurchase program in the year to September 30, 2012
•
Remaining $142 million share repurchase authorization at September 30, 2012;
replaced with a new share repurchase authorization of $400 million in
October 2012 September 30, 2012
Debt/total capital
12.3%
Debt and preferred/total capital
24.8%
(1)
Capital Requirement Based On Disciplined Risk Management Approach
PROACTIVE MANAGEMENT OF CAPITAL |
 AHL: NYSE
13
QUARTER ENDED SEPTEMBER 30
2012
2011
CHANGE
Gross written premiums
558.4
495.6
12.7%
Net written premiums
507.1
462.6
9.6%
Net earned premiums
516.2
486.9
6.0%
Underwriting income including corporate
expenses
67.4
15.3
340.5%
Net investment income
48.6
57.3
(15.2%)
Net income after tax
115.1
21.2
442.9%
FINANCIAL RATIOS
Loss ratio
49.4%
62.9%
Policy acquisition expense ratio
20.0%
19.2%
General, administrative and corporate
expense ratio
17.6%
14.8%
Combined ratio
87.0%
96.9%
Annualized operating ROE
(2)
13.2%
7.2%
Diluted operating EPS
(1)
1.34
0.68
Diluted book value per share
41.53
38.07
9.1%
FINANCIAL HIGHLIGHTS: 3Q 2012
Note:
See
Aspen's
quarterly
financial
supplement
for
a
reconciliation
of
operating
income
to
net
income,
average
equity
to
closing
shareholders’
equity,
diluted
book value
per
share
to
basic
book
value
per
share
in
the
Investor
Relations
section
of
Aspen's
website
at
www.aspen.co.
NM: Not meaningful
(1)
(
$ millions, except per share data) |
 AHL: NYSE
14
NINE MONTHS ENDED SEPTEMBER 30
2012
2011
CHANGE
Gross written premiums
2,007.1
1,749.1
14.8%
Net written premiums
1,722.5
1,497.9
15.0%
Net earned premiums
1,525.0
1399.1
9.0%
Underwriting income / (loss) including
corporate expenses
163.7
(229.1)
NM
Net investment income
153.8
171.4
(10.3%)
Net income / (loss) after tax
278.4
(122.5)
NM
FINANCIAL RATIOS
Loss ratio
52.5%
83.0%
Policy acquisition expense ratio
19.8%
18.7%
General, administrative and corporate
expense ratio
17.0%
14.7%
Combined ratio
89.3%
116.4%
Annualized operating ROE
(2)
12.0%
(4.4%)
Diluted operating EPS
(1)
3.53
(1.32)
Diluted book value per share
41.53
38.07
9.1%
FINANCIAL HIGHLIGHTS: YTD 2012
(
$ millions, except per share data)
NM: Not meaningful
(1)
Note:
See
Aspen's
quarterly
financial
supplement
for
a
reconciliation
of
operating
income
to
net
income,
average
equity
to
closing
shareholders’
equity,
diluted
book value
per
share
to
basic
book
value
per
share
in
the
Investor
Relations
section
of
Aspen's
website
at
www.aspen.co. |
 APPENDIX |
 AHL: NYSE
16
LOSS ESTIMATES: ECONOMIC AND INSURED
•
Moody’s
•
As of 11/1, estimated the total economic losses from Sandy at
$50bn •
The
$50bn
estimate
is
the
sum
of
“Lost
output”
estimated
at
$19.9bn
and
“Damages”
of
$30bn
•
EQECAT
•
As
of
11/1,
estimated
insured
losses
of
$10-$20bn
with
total
economic
losses
of
$30
-
$50bn
•
AIR
•
As of 10/30, estimated insured losses ranging from $7bn to $15bn, to
include: •
Insured physical damage to property both structures and contents
•
Additional living expenses for residential claims
•
For residential lines AIR believe insurers will ultimately pay 10% of modeled
storm surge damage as wind losses
•
For commercial lines insured physical damage to structures and contents and
business interruption directly caused by storm surge; assumes a 10%
take-up rate for commercial flood policies; business interruption
losses
include
direct
and
indirect
losses
for
insured
risks
that
experience
physical
loss
•
RMS
•
An 11/2 press release indicated it was too early to calculate reliable loss
•
“The event is still live and several variables are yet to play out,
consequently, it remains too early to provide a reliable estimate of the
total insured losses. In particular the speed of restoration of power, and pumping out of
floodwaters from towns and transport systems remain major unknowns. Our experience
shows that these key variables will play a significant part in the ultimate
loss.” •
A significant source of the damage from Sandy may arise from flood rather than
wind. Thus a wind PML is not a reliable benchmark to gauge
exposure. (1)
It is too early for Aspen to provide a reliable estimate of losses related to
Sandy HURRICANE SANDY INDUSTRY LOSS ESTIMATES |
 AHL: NYSE
17
(1)
0.0%
0.2%
0.4%
0.6%
0.8%
1.0%
1.2%
1.4%
1.6%
Hur. Ike
(2008)
Hur. Gustav
(2008)
Chile Eq.
(2010)
NZ1 Darfield
Eq. (2010)
Tohuku
(2011)
US weather
incl Joplin
(2011)
NZ2 Litteton
Eq. (2011)
Australian
Weather
(2011)
Thailand
Floods
(2011)
Hurricane
Irene (2011)
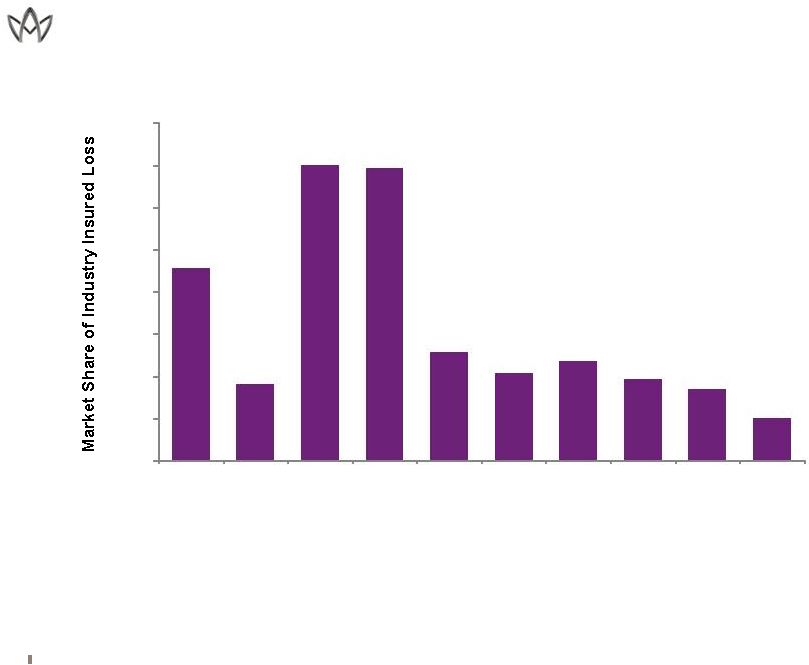
ASPEN’S MARKET SHARE OF INDUSTRY INSURED LOSSES, NET
•
Although
historical
loss
percentages
are
interesting
data
points
they
are
not
reliable
indicators
for future losses
•
Every
event
is
considerably
different
as
well
as
the
business
mix
of
companies’
books
change
over time
0.9%
0.4%
1.4%
1.4%
0.5%
0.4%
0.5%
0.4%
0.3%
0.2% |
 AHL: NYSE
18
CASH, SHORT-TERM
SECURITIES AND EQUITY
SECURITIES
GOVERNMENT / AGENCY
STRUCTURED SECURITIES
CREDIT SECURITIES
Short-term securities
505.3
US government
1,107.4
Asset-backed securities
65.1
Corporate bonds
1,842.3
Equity securities
197.1
Agency debentures
313.7
Agency rated mortgage-
backed securities (GNMA,
FINMA, FHLB)
1,288.2
FDIC guaranteed
corporate bonds
3.0
Cash and cash
equivalents
1,374.2
Foreign governments
650.3
Non-agency rated
commercial mortgage-
backed securities
75.6
Foreign corporates
455.6
Investment in Cartesian
Iris Offshore Fund L.P.
34.8
Bonds backed by
foreign government
139.1
Municipal bonds
42.8
Q3 2012
2,111.4
Q3 2012
2,071.4
Q3 2012
1,428.9
Q3 2012
2,482.8
Q2 2012
2,033.1
Q2 2012
1,943.8
Q2 2012
1,447.4
Q2 2012
2,400.0
TOTAL
INVESTMENT
PORTFOLIO
AT
MARKET
VALUE
($
millions)
(1)
:
$8,094.5
Overall Portfolio Asset Allocations Have Not Changed Significantly During
2012 (1) As at September 30, 2012, including cash and cash
equivalents INVESTMENT PORTFOLIO BY ASSET TYPE |
  AHL:
NYSE 19
($ in millions except for percentages)
Note
-
Aspen
takes
the
lower
of
the
Moody’s
and
S&P
ratings.
•
Eurozone exposures consist of sovereigns, equities, and high quality corporates
with 90% having a rating of “A”
or higher, with de minimis exposure to Italian and Spanish corporate
bonds •
Eurozone exposure is approximately 4% of Aspen’s aggregate investment
portfolio •
Aspen has no exposure to the sovereign debt of Greece, Ireland, Italy, Portugal or
Spain COUNTRY
AAA
AA
A
BBB
NR
MARKET
VALUE
MARKET
VALUE %
UNREALIZED
PRE-TAX
Austria
-
20.2
-
-
-
20.2
2.2%
0.1
Belgium
-
-
3.0
-
3.5
6.5
0.7%
1.5
Denmark
19.8
-
-
0.4
-
20.2
2.2%
0.0
Finland
11.2
-
-
-
2.0
13.2
1.4%
0.7
France
4.5
68.8
17.7
1.6
15.5
108.1
11.7%
5.3
Germany
56.7
6.1
15.9
2.8
2.0
83.5
9.0%
4.1
Italy
-
-
-
0.7
2.0
2.7
0.3%
0.0
Netherlands
24.4
22.5
15.6
-
4.5
67.0
7.2%
3.2
Norway
14.0
16.6
-
-
-
30.6
3.3%
1.8
Spain
-
-
-
3.4
-
3.4
0.4%
-
Sweden
-
17.8
-
1.0
8.0
26.8
2.9%
1.9
Switzerland
6.0
25.2
72.8
1.1
14.0
119.1
12.9%
10.4
United Kingdom
275.5
10.7
80.0
14.0
43.6
423.8
45.8%
22.9
European Exposures
Q3 2012
412.1
187.9
205.0
25.0
95.1
925.1
100.0%
51.9
RATINGS
EUROPEAN INVESTMENT EXPOSURE |
 AHL: NYSE
20
AS AT SEPTEMBER 30, 2012
CASE
IBNR
TOTAL
Reinsurance
1,371.4
1,574.7
2,946.2
Insurance
815.4
878.1
1,693.4
GROUP TOTAL
2,186.8
2,452.8
4,639.6
Note: Refer to our 2011 annual report on Form 10-K for a discussion of
assumptions and uncertainties relating to the Company's reserves. Source:
Aspen Company Data Incurred But Not Reported (IBNR) Represented 53% of Total
Reserves at September 30, 2012 ($ in millions)
RESERVE POSITION |
 |