Attached files
| file | filename |
|---|---|
| 8-K - FORM 8-K - UDR, Inc. | d437801d8k.htm |
Exhibit 99.1
| Acoma - Denver, CO November 2012 |
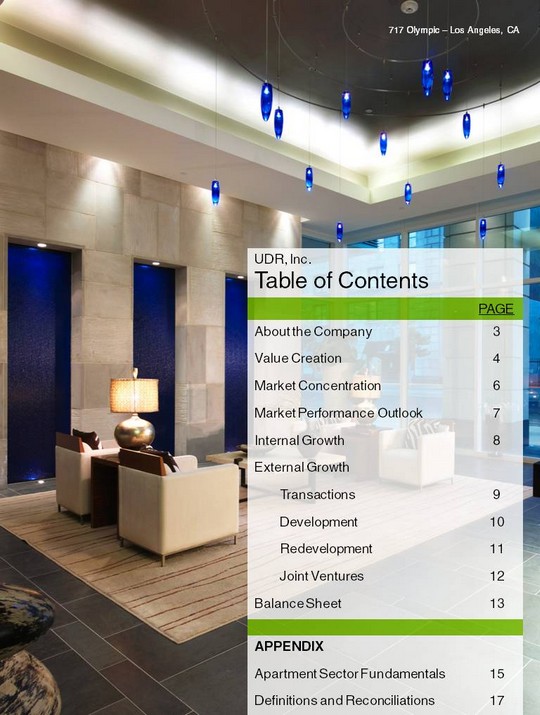
| 717 Olympic - Los Angeles, CA UDR, Inc. Table of Contents UDR, Inc. Table of Contents PAGE About the Company 3 Value Creation 4 Market Concentration 6 Market Performance Outlook 7 Internal Growth 8 External Growth Transactions 9 Development 10 Redevelopment 11 Joint Ventures 12 Balance Sheet 13 APPENDIX Apartment Sector Fundamentals 15 Definitions and Reconciliations 17 |
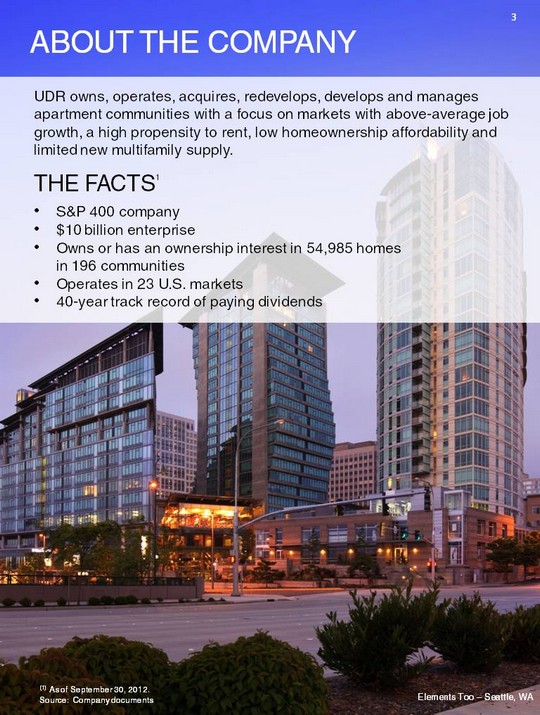
| UDR owns, operates, acquires, redevelops, develops and manages apartment communities with a focus on markets with above-average job growth, a high propensity to rent, low homeownership affordability and limited new multifamily supply. THE FACTS1 S&P 400 company $10 billion enterprise Owns or has an ownership interest in 54,985 homes in 196 communities Operates in 23 U.S. markets 40-year track record of paying dividends Elements Too - Seattle, WA 3 ABOUT THE COMPANY (1) As of September 30, 2012. Source: Company documents |

| Ashton Judiciary Square - Washington, D.C. UDR's portfolio has created value in-line with that of its peer group average over the past ten years: UDR NAV/sh* growth: +6.4% UDR Dividend/sh* component: +6.4% UDR Current Value Net Income (CVNI)/sh* growth: +13% * See pages 17-20 for definitions and additional information. All data provided by Green Street Advisors. Peer group includes AEC, AIV, AVB, BRE, CPT, CLP, EQR, ESS, HME, MAA and PPS. Source: Green Street Advisors 4 VALUE CREATION |
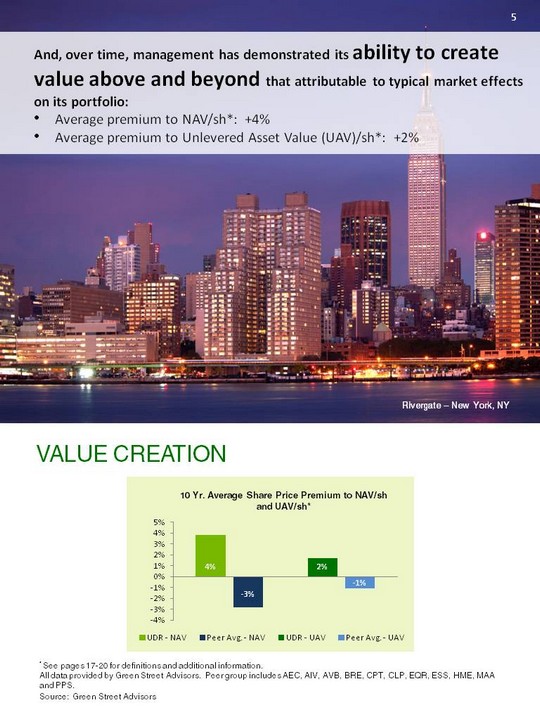
| Rivergate - New York, NY 5 And, over time, management has demonstrated its ability to create value above and beyond that attributable to typical market effects on its portfolio: Average premium to NAV/sh*: +4% Average premium to Unlevered Asset Value (UAV)/sh*: +2% * See pages 17-20 for definitions and additional information. All data provided by Green Street Advisors. Peer group includes AEC, AIV, AVB, BRE, CPT, CLP, EQR, ESS, HME, MAA and PPS. VALUE CREATION Source: Green Street Advisors |

| MARKET CONCENTRATION The Olivian - Seattle, WA Core Market Capital Warehouse Market Non-Core Market Source: Company documents Core Markets: Seattle, San Francisco Bay Area, Los Angeles, Orange County, San Diego, Denver, Austin, Dallas, Boston, New York, NY, Baltimore/Washington D.C. area, Philadelphia. Capital Warehouse Markets: Portland, Inland Empire, Nashville, Richmond, Tampa, Orlando, Other FL. Non-Core Markets: Sacramento, Monterey Peninsula, Norfolk. 6 UDR's core markets generate 75% of its net operating income. This contribution percentage will continue to grow. ~47% of UDR's communities are A- quality or above ~53% fall between B+ and B- quality 36% of portfolio NOI 43% of portfolio NOI |
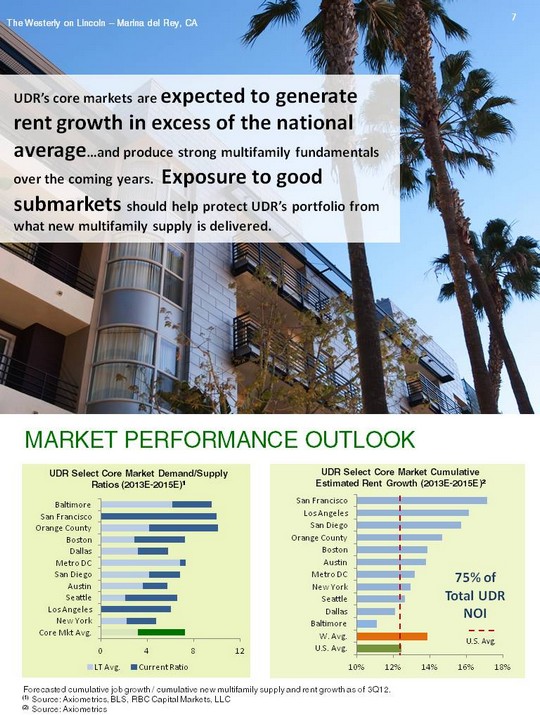
| The Westerly on Lincoln - Marina del Rey, CA UDR's core markets are expected to generate rent growth in excess of the national average...and produce strong multifamily fundamentals over the coming years. Exposure to good submarkets should help protect UDR's portfolio from what new multifamily supply is delivered. 75% of Total UDR NOI Forecasted cumulative job growth / cumulative new multifamily supply and rent growth as of 3Q12. (1) Source: Axiometrics, BLS, RBC Capital Markets, LLC (2) Source: Axiometrics 7 UDR Select Core Market Demand/Supply Ratios (2013E-2015E)1 MARKET PERFORMANCE OUTLOOK |
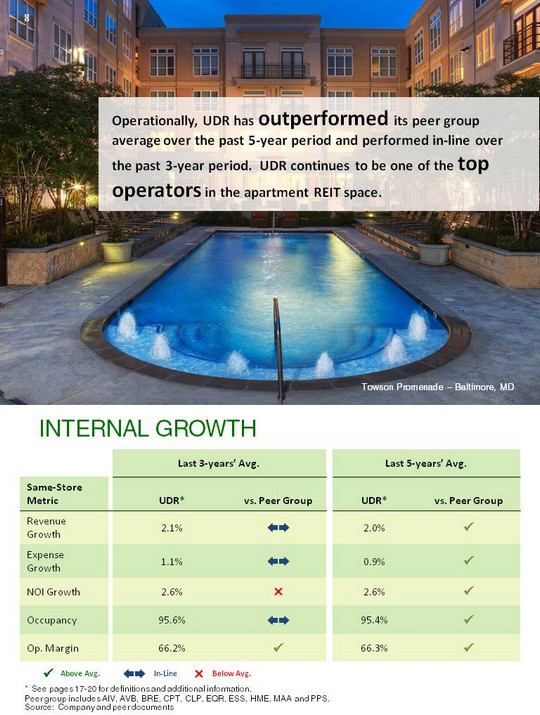
| UDR has outperformed versus its peer group on last 3- and 5-year's bases and continues to be one of the top operators in the apartment REIT space. Last 3-years' Avg. Last 3-years' Avg. Last 5-years' Avg. Last 5-years' Avg. Same-Store Metric UDR* vs. Peer Group UDR* vs. Peer Group Revenue Growth 2.1% ?? 2.0% ? Expense Growth 1.1% ?? 0.9% ? NOI Growth 2.6% ? 2.6% ? Occupancy 95.6% ?? 95.4% ? Op. Margin 66.2% ? 66.3% ? 8 Source: Company and peer documents * See pages 17-20 for definitions and additional information. Peer group includes AIV, AVB, BRE, CPT, CLP, EQR, ESS, HME, MAA and PPS. INTERNAL GROWTH ? Above Avg. ?? In-Line ? Below Avg. Operationally, UDR has outperformed its peer group average over the past 5-year period and performed in-line over the past 3-year period. UDR continues to be one of the top operators in the apartment REIT space. Towson Promenade - Baltimore, MD 8 |
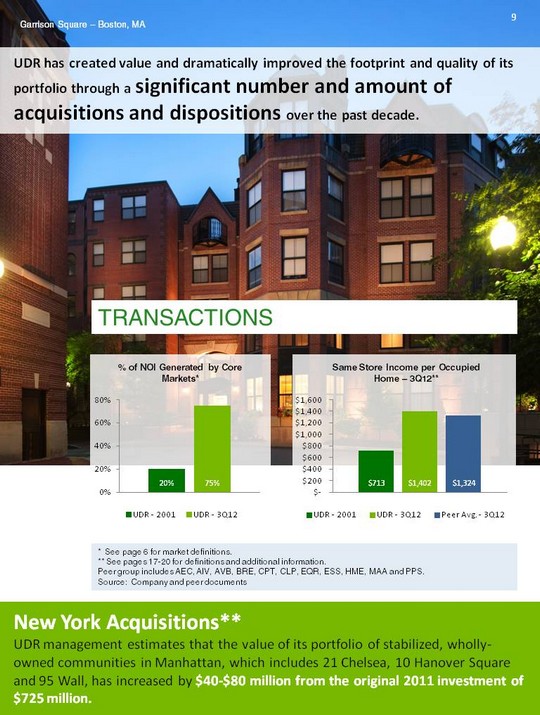
| UDR has created value and dramatically improved the footprint and quality of its portfolio through a significant number and amount of acquisitions and dispositions over the past decade. New York Acquisitions** UDR management estimates that the value of its portfolio of stabilized, wholly-owned communities in Manhattan, which includes 21 Chelsea, 10 Hanover Square and 95 Wall, has increased by $40-$80 million from the original 2011 investment of $725 million. 9 * See page 6 for market definitions. ** See pages 17-20 for definitions and additional information. Peer group includes AEC, AIV, AVB, BRE, CPT, CLP, EQR, ESS, HME, MAA and PPS. Source: Company and peer documents Garrison Square - Boston, MA |
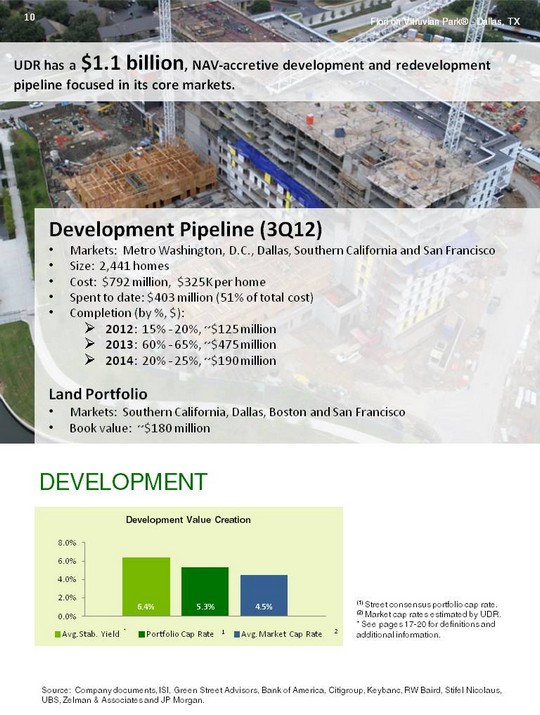
| Fiori on Vitruvian Park(r) - Dallas, TX UDR has a $1.1 billion, NAV-accretive development and redevelopment pipeline focused in its core markets. Development Pipeline (3Q12) Markets: Metro Washington, D.C., Dallas, Southern California and San Francisco Size: 2,441 homes Cost: $792 million, $325K per home Spent to date: $403 million (51% of total cost) Completion (by %, $): 2012: 15% - 20%, ~$125 million 2013: 60% - 65%, ~$475 million 2014: 20% - 25%, ~$190 million Land Portfolio Markets: Southern California, Dallas, Boston and San Francisco Book value: ~$180 million 10 (1) Street consensus portfolio cap rate. (2) Market cap rates estimated by UDR. * See pages 17-20 for definitions and additional information. Source: Company documents, ISI, Green Street Advisors, Bank of America, Citigroup, Keybanc, RW Baird, Stifel Nicolaus, UBS, Zelman & Associates and JP Morgan. DEVELOPMENT |

| REDEVELOPMENT CitySouth - San Francisco, CA Source: Company documents Redevelopment Pipeline (3Q12) Markets: Metro Washington, D.C., Southern California and New York, NY Size: 2,585 homes Cost: $279 million, $108K per home Spent to date: $65 million (23% of total cost) Completion (by %, $): 2013: 30% - 35%, ~$95 million 2014: 65% - 70%, ~$185 million UDR's redevelopment strategy is two-pronged. It aims to meaningfully increase rents and also reposition a community, thereby driving cap rate compression. Redevelopment generally provides the best risk-adjusted return when allocating capital, but the available pool of candidates is relatively limited. 11 (1) Includes Barton Creek Landing, CitySouth, Highlands of Marin and The Whitmore. (2) Only in-process projects with a meaningful sample size of renovated homes are included in analysis. UDR has generated an 8% average return on incremental capital invested in its four redevelopment projects that stabilized in 2010 or 2011(1). |
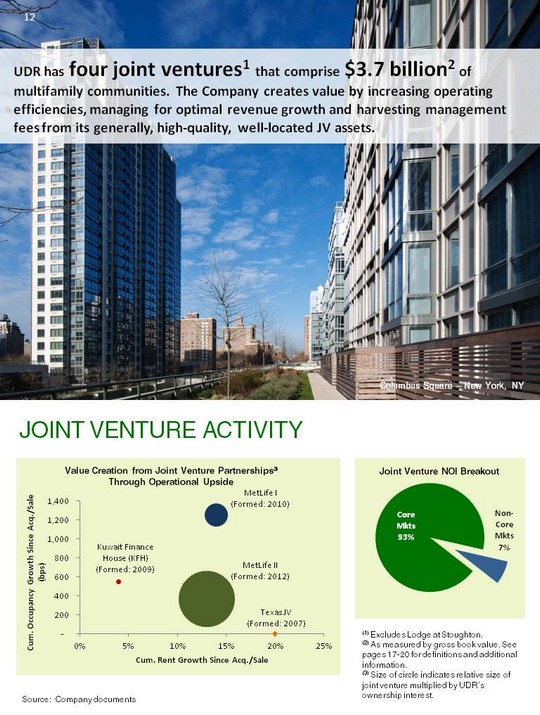
| UDR has four joint ventures1 that comprise $3.7 billion2 of multifamily communities. The Company creates value by increasing operating efficiencies, managing for optimal revenue growth and harvesting management fees from its generally, high-quality, well- located JV assets. 12 Source: Company documents Columbus Square - New York, NY JOINT VENTURE ACTIVITY (1) Excludes Lodge at Stoughton. (2) As measured by gross book value. See pages 17-20 for definitions and additional information. (3) Size of circle indicates relative size of joint venture multiplied by UDR's ownership interest. |

| View 14 - Washington, D.C. Source: Company documents UDR's balance sheet metrics have improved meaningfully over the past three years. UDR intends to operate at a lower leverage profile moving forward and will continue to examine opportunistic ways to further decrease its leverage over the coming years. The Company has ample liquidity to meet its future external growth obligations. Metric YE 2009 3Q12 Leverage1 55% ? 38% Secured debt to total assets 31% ? 16% Unencumbered assets, gross value ($B)2 $3.2 ? $5.5 Net debt to EBITDA* 10.0x ? ~7.0x3 (1) Leverage is defined as debt to total assets. (2) Based on historical cost. (3) Net Debt to Annualized 3Q EBITDA. * See pages 17-20 for definitions and additional information. 13 BALANCE SHEET |
| Ashton Westwood - Los Angeles, CA UDR, Inc. Appendix UDR, Inc. Appendix Apartment Sector Fundamentals 15 Definitions and Reconciliations 17 14 |
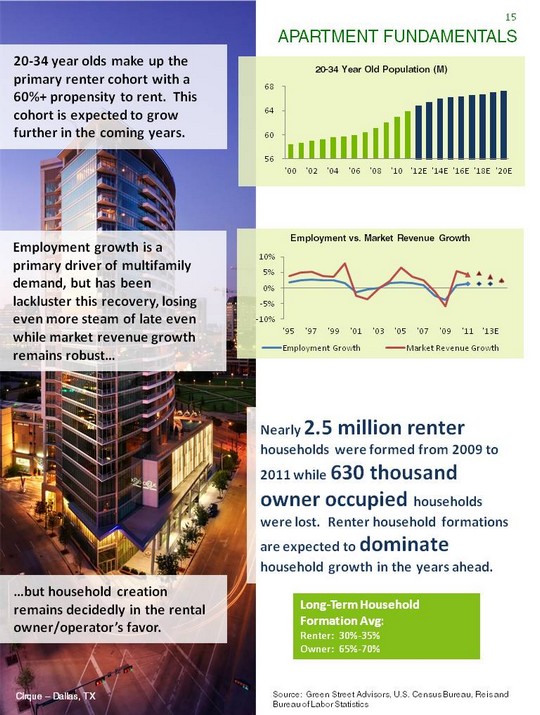
| Source: Green Street Advisors, U.S. Census Bureau, Reis and Bureau of Labor Statistics Long-Term Household Formation Avg: Renter: 30%-35% Owner: 65%-70% Cirque - Dallas, TX APARTMENT FUNDAMENTALS 15 20-34 year olds make up the primary renter cohort with a 60%+ propensity to rent. This cohort is expected to grow further in the coming years. Employment growth is a primary driver of multifamily demand, but has been lackluster this recovery, losing even more steam of late even while market revenue growth remains robust... ...but household creation remains decidedly in the rental owner/operator's favor. Nearly 2.5 million renter households were formed from 2009 to 2011 while 630 thousand owner occupied households were lost. Renter household formations are expected to dominate household growth in the years ahead. |
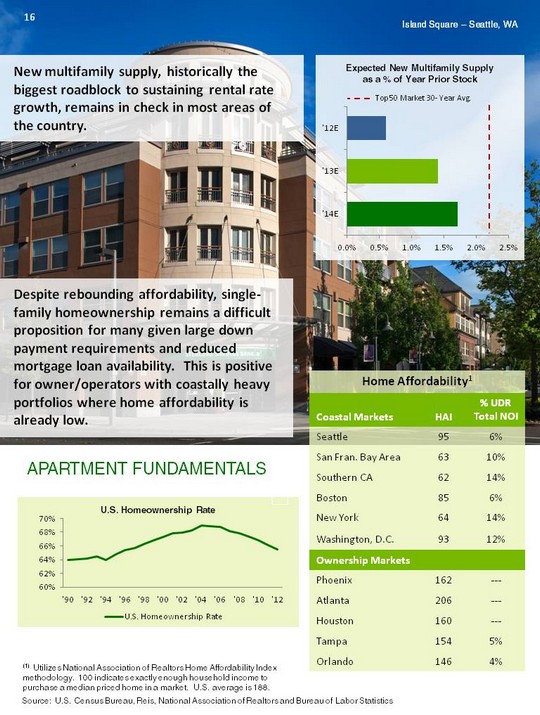
| New multifamily supply, historically the biggest roadblock to sustaining rental rate growth, remains in check in most areas of the country. Home Affordability1 Home Affordability1 Home Affordability1 Coastal Markets HAI % UDR Total NOI Seattle 95 6% San Fran. Bay Area 63 10% Southern CA 62 14% Boston 85 6% New York 64 14% Washington, D.C. 93 12% Ownership Markets Ownership Markets Ownership Markets Phoenix 162 --- Atlanta 206 --- Houston 160 --- Tampa 154 5% Orlando 146 4% Source: U.S. Census Bureau, Reis, National Association of Realtors and Bureau of Labor Statistics 16 (1) Utilizes National Association of Realtors Home Affordability Index methodology. 100 indicates exactly enough household income to purchase a median priced home in a market. U.S. average is 188. Despite rebounding affordability, single-family homeownership remains a difficult proposition for many given large down payment requirements and reduced mortgage loan availability. This is positive for owner/operators with coastally heavy portfolios where home affordability is already low. APARTMENT FUNDAMENTALS Island Square - Seattle, WA |
| Elements Too - Seattle, WA UDR: DEFINITIONS AND RECONCILIATIONS Net Asset Value: UDR's Net Asset Value ("NAV") growth over time is provided by Green Street Advisors ("GSA"). GSA calculates NAV by estimating marked-to-market value of assets less marked-to-market value of liabilities divided by total outstanding diluted shares and operating units. Additional information on GSA's NAV methodology is available in "Green Street's NAV-based Pricing Model" published on October 3, 2005. This report is available at www.greenst.com.* Management views NAV as a useful metric for investors as it provides context to portfolio value changes over time based on widely accepted market inputs. Unlevered Asset Value: UDR's Unlevered Asset Value ("UAV") over time is provided by GSA. GSA calculates UAV by estimating marked-to-market value of assets divided by total outstanding diluted shares and operating units outstanding. Additional information on GSA's UAV methodology is available in "Green Street's NAV-based Pricing Model" published on October 3, 2005. This report is available at www.greenst.com.* Management views UAV as a useful metric for investors as it provides context to portfolio value changes over time based on widely accepted market inputs. Current Value Net Income: Current Value Net Income ("CVNI") is an indexed metric developed by GSA that combines monthly measures of NAV per share growth with monthly dividends per share re-invested over time at a coincident NAV per share. Additional information on how GSA uses CVNI growth in its valuation methodology is available in "Green Street's NAV-based Pricing Model" published on October 3, 2005. This report is available at www.greenst.com.* Management views CVNI as a useful metric for investors as it is highly correlated to Total Shareholder Returns over long periods of time and it is an indicator of portfolio value creation irrespective of dividend payout versus cash flow reinvestment policies. Same-store: Same-store includes those communities acquired, developed, and stabilized prior to July 1, 2011 and held as of September 30, 2012. These communities were owned and had stabilized occupancy and operating expenses as of the beginning of the prior year, there is no plan to conduct substantial redevelopment activities, and the community is not held for disposition within the current year. A community is considered to have stabilized occupancy once it achieves 90% occupancy for at least three consecutive months. * Green Street Advisors ("GSA") is an independent research, trading and consulting firm. By referencing reports included on GSA's website, UDR does not intend to incorporate any of the information included on that website into this presentation, or to otherwise adopt or endorse any analysis, statements or communications made by GSA on its website or elsewhere. 17 |
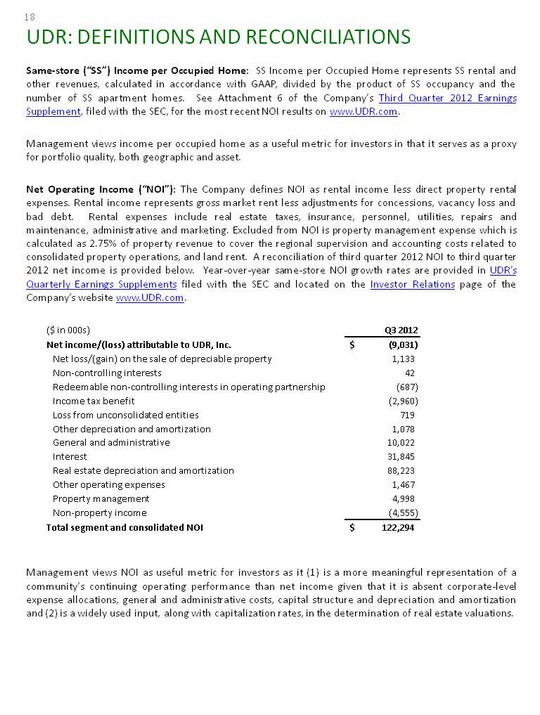
| Elements Too - Seattle, WA UDR: DEFINITIONS AND RECONCILIATIONS Same-store ("SS") Income per Occupied Home: SS Income per Occupied Home represents SS rental and other revenues, calculated in accordance with GAAP, divided by the product of SS occupancy and the number of SS apartment homes. See Attachment 6 of the Company's Third Quarter 2012 Earnings Supplement, filed with the SEC, for the most recent NOI results on www.UDR.com. Management views income per occupied home as a useful metric for investors in that it serves as a proxy for portfolio quality, both geographic and asset. Net Operating Income ("NOI"): The Company defines NOI as rental income less direct property rental expenses. Rental income represents gross market rent less adjustments for concessions, vacancy loss and bad debt. Rental expenses include real estate taxes, insurance, personnel, utilities, repairs and maintenance, administrative and marketing. Excluded from NOI is property management expense which is calculated as 2.75% of property revenue to cover the regional supervision and accounting costs related to consolidated property operations, and land rent. A reconciliation of third quarter 2012 NOI to third quarter 2012 net income is provided below. Year- over-year same-store NOI growth rates are provided in UDR's Quarterly Earnings Supplements filed with the SEC and located on the Investor Relations page of the Company's website www.UDR.com. Management views NOI as useful metric for investors as it (1) is a more meaningful representation of a community's continuing operating performance than net income given that it is absent corporate-level expense allocations, general and administrative costs, capital structure and depreciation and amortization and (2) is a widely used input, along with capitalization rates, in the determination of real estate valuations. 18 |
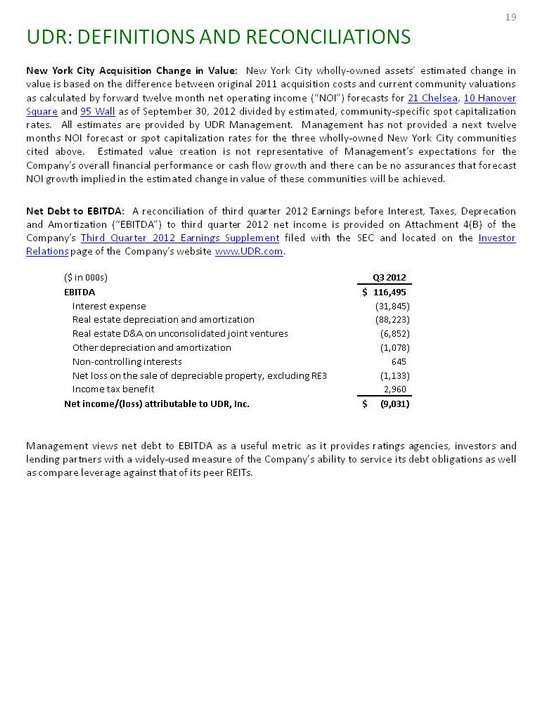
| Elements Too - Seattle, WA UDR: DEFINITIONS AND RECONCILIATIONS New York City Acquisition Change in Value: New York City wholly-owned assets' estimated change in value is based on the difference between original 2011 acquisition costs and current community valuations as calculated by forward twelve month net operating income ("NOI") forecasts for 21 Chelsea, 10 Hanover Square and 95 Wall as of September 30, 2012 divided by estimated, community-specific spot capitalization rates. All estimates are provided by UDR Management. Management has not provided a next twelve months NOI forecast or spot capitalization rates for the three wholly-owned New York City communities cited above. Estimated value creation is not representative of Management's expectations for the Company's overall financial performance or cash flow growth and there can be no assurances that forecast NOI growth implied in the estimated change in value of these communities will be achieved. Net Debt to EBITDA: A reconciliation of third quarter 2012 Earnings before Interest, Taxes, Deprecation and Amortization ("EBITDA") to third quarter 2012 net income is provided on Attachment 4(B) of the Company's Third Quarter 2012 Earnings Supplement filed with the SEC and located on the Investor Relations page of the Company's website www.UDR.com. Management views net debt to EBITDA as a useful metric as it provides ratings agencies, investors and lending partners with a widely-used measure of the Company's ability to service its debt obligations as well as compare leverage against that of its peer REITs. 19 |
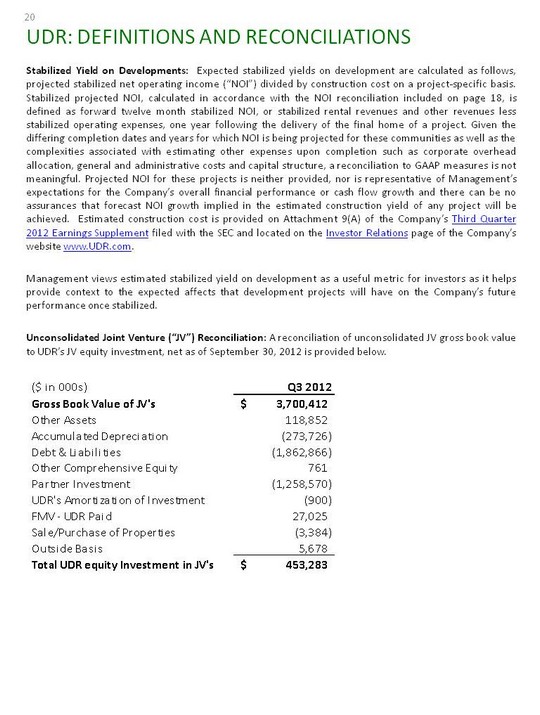
| Elements Too - Seattle, WA UDR: DEFINITIONS AND RECONCILIATIONS Stabilized Yield on Developments: Expected stabilized yields on development are calculated as follows, projected stabilized net operating income ("NOI") divided by construction cost on a project- specific basis. Stabilized projected NOI, calculated in accordance with the NOI reconciliation included on page 18, is defined as forward twelve month stabilized NOI, or stabilized rental revenues and other revenues less stabilized operating expenses, one year following the delivery of the final home of a project. Given the differing completion dates and years for which NOI is being projected for these communities as well as the complexities associated with estimating other expenses upon completion such as corporate overhead allocation, general and administrative costs and capital structure, a reconciliation to GAAP measures is not meaningful. Projected NOI for these projects is neither provided, nor is representative of Management's expectations for the Company's overall financial performance or cash flow growth and there can be no assurances that forecast NOI growth implied in the estimated construction yield of any project will be achieved. Estimated construction cost is provided on Attachment 9(A) of the Company's Third Quarter 2012 Earnings Supplement filed with the SEC and located on the Investor Relations page of the Company's website www.UDR.com. Management views estimated stabilized yield on development as a useful metric for investors as it helps provide context to the expected affects that development projects will have on the Company's future performance once stabilized. Unconsolidated Joint Venture ("JV") Reconciliation: A reconciliation of unconsolidated JV gross book value to UDR's JV equity investment, net as of September 30, 2012 is provided below. 20 |

| NOTES 21 |

| NOTES 22 |
| Elements Too - Seattle, WA UDR: DISCLOSURES Forward-Looking Statement Certain statements made in this presentation may constitute "forward-looking statements." Words such as "expects," "intends," "believes," "anticipates," "plans," "likely," "will," "seeks," "estimates" and variations of such words and similar expressions are intended to identify such forward-looking statements. Forward-looking statements, by their nature, involve estimates, projections, goals, forecasts and assumptions and are subject to risks and uncertainties that could cause actual results or outcomes to differ materially from those expressed in a forward-looking statement, due to a number of factors, which include, but are not limited to, unfavorable changes in the apartment market, changing economic conditions, the impact of inflation/deflation on rental rates and property operating expenses, expectations concerning availability of capital and the stabilization of the capital markets, the impact of competition and competitive pricing, acquisitions, developments and redevelopments not achieving anticipated results, delays in completing developments, redevelopments and lease-ups on schedule, expectations on job growth, home affordability and demand/supply ratio for multifamily housing, expectations concerning development and redevelopment activities, expectations on occupancy levels, expectations concerning the Vitruvian Park(r) development, expectations concerning the joint ventures with third parties, expectations that automation will help grow net operating income, expectations on annualized net operating income and other risk factors discussed in documents filed by the Company with the Securities and Exchange Commission from time to time, including the Company's Annual Report on Form 10-K and the Company's Quarterly Reports on Form 10-Q. Actual results may differ materially from those described in the forward-looking statements. These forward-looking statements and such risks, uncertainties and other factors speak only as of the date of this presentation, and the Company expressly disclaims any obligation or undertaking to update or revise any forward-looking statement contained herein, to reflect any change in the Company's expectations with regard thereto, or any other change in events, conditions or circumstances on which any such statement is based, except to the extent otherwise required under the U.S. securities laws. This presentation and these forward-looking statements include UDR's analysis and conclusions and reflect UDR's judgment as of the date of these materials. UDR assumes no obligation to revise or update to reflect future events or circumstances. 23 |
| Investor Relations Contact: Chris Van Ens cvanens@udr.com 720.348.7762 |