Attached files
| file | filename |
|---|---|
| 8-K - 8-K - PennyMac Mortgage Investment Trust | a12-26891_18k.htm |
| EX-99.1 - EX-99.1 - PennyMac Mortgage Investment Trust | a12-26891_1ex99d1.htm |
| EX-99.3 - EX-99.3 - PennyMac Mortgage Investment Trust | a12-26891_1ex99d3.htm |
Exhibit 99.2
|
|
PennyMac Mortgage Investment Trust November 8, 2012 Third Quarter 2012 Earnings Report |

|
|
3Q12 Earnings Report 2 This presentation contains forward-looking statements within the meaning of Section 21E of the Securities Exchange Act of 1934, as amended, regarding management’s beliefs, estimates, projections and assumptions with respect to, among other things, the Company’s financial results, future operations, business plans and investment strategies, as well as industry and market conditions, all of which are subject to change. Words like “believe,” “expect,” “anticipate,” “promise,” “plan,” and other expressions or words of similar meanings, as well as future or conditional verbs such as “will,” “would,” “should,” “could,” or “may” are generally intended to identify forward-looking statements. Actual results and operations for any future period may vary materially from those projected herein, from past results discussed herein, or illustrative examples provided herein. Factors which could cause actual results to differ materially from historical results or those anticipated include, but are not limited to: changes in general business, economic, market and employment conditions from those expected; continued declines in residential real estate and disruption in the U.S. housing market; the availability of, and level of competition for, attractive risk-adjusted investment opportunities in residential mortgage loans and mortgage-related assets that satisfy our investment objectives and investment strategies; changes in our investment or operational objectives and strategies, including any new lines of business; the concentration of credit risks to which we are exposed; the availability, terms and deployment of short-term and long-term capital; unanticipated increases in financing and other costs, including a rise in interest rates; the performance, financial condition and liquidity of borrowers; increased rates of delinquency or decreased recovery rates on our investments; increased prepayments of the mortgage and other loans underlying our investments; changes in regulations or the occurrence of other events that impact the business, operation or prospects of government sponsored enterprises; changes in government support of homeownership; changes in governmental regulations, accounting treatment, tax rates and similar matters; and our ability to satisfy complex rules in order to qualify as a REIT for U.S. federal income tax purposes. You should not place undue reliance on any forward-looking statement and should consider all of the uncertainties and risks described above, as well as those more fully discussed in reports and other documents filed by the Company with the Securities and Exchange Commission from time to time. The Company undertakes no obligation to publicly update or revise any forward-looking statements or any other information contained herein, and the statements made in this presentation are current as of the date of this presentation only. Forward-Looking Statements |
|
|
3Q12 Earnings Report 3 Third Quarter 2012 Highlights Net Income of $40.4 million on net investment income of $99.2 million Diluted EPS of $0.81 per share, and dividend of $0.57 per share Business segment pre-tax earnings reflect continued strength of the business model Correspondent Lending: $37.4 million Investment Activities: $21.5 million Correspondent lending continues its strong growth in the third quarter Funding volume: $6.3 billion in unpaid principal balance (UPB), up 87% from the second quarter Conventional purchases of $3.7 billion, 59% of total Lock volume: $8.5 billion in UPB, up 84% from the second quarter Conventional lock volume of $5.5 billion, 64% of total Acquired a distressed whole loan pool totaling over $357 million in UPB, which settled in September Issued over $359 million of equity during the quarter |

|
|
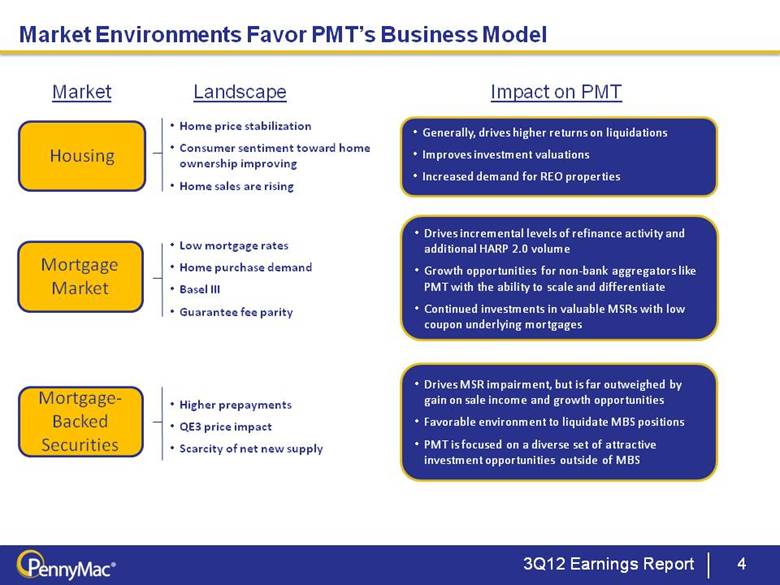
Landscape Market Environments Favor PMT’s Business Model 3Q12 Earnings Report 4 Housing Mortgage Market Mortgage-Backed Securities Generally, drives higher returns on liquidations Improves investment valuations Increased demand for REO properties Home price stabilization Consumer sentiment toward home ownership improving Home sales are rising Low mortgage rates Home purchase demand Basel III Guarantee fee parity Higher prepayments QE3 price impact Scarcity of net new supply Impact on PMT Drives incremental levels of refinance activity and additional HARP 2.0 volume Growth opportunities for non-bank aggregators like PMT with the ability to scale and differentiate Continued investments in valuable MSRs with low coupon underlying mortgages Drives MSR impairment, but is far outweighed by gain on sale income and growth opportunities Favorable environment to liquidate MBS positions PMT is focused on a diverse set of attractive investment opportunities outside of MBS Market |
|
|
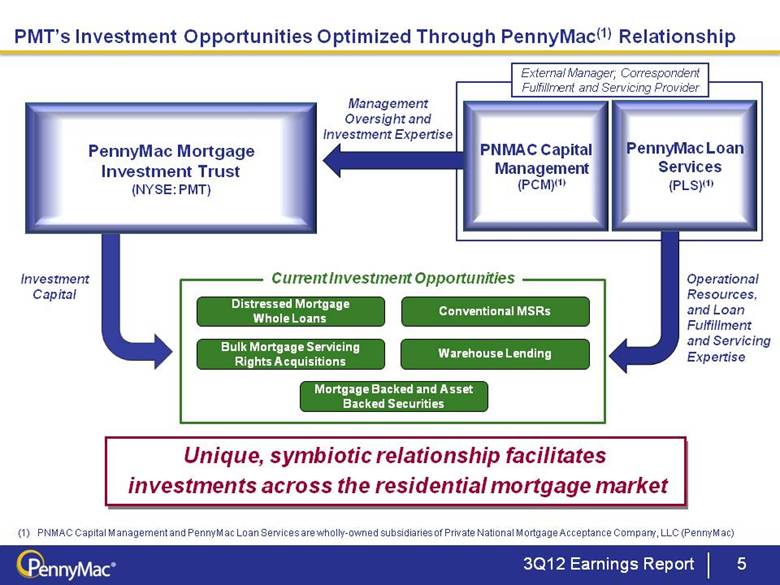
3Q12 Earnings Report 5 PennyMac Mortgage Investment Trust (NYSE: PMT) External Manager; Correspondent Fulfillment and Servicing Provider Unique, symbiotic relationship facilitates investments across the residential mortgage market PMT’s Investment Opportunities Optimized Through PennyMac(1) Relationship Operational Resources, and Loan Fulfillment and Servicing Expertise Investment Capital Current Investment Opportunities Management Oversight and Investment Expertise PNMAC Capital Management (PCM)(1) PennyMac Loan Services (PLS)(1) PNMAC Capital Management and PennyMac Loan Services are wholly-owned subsidiaries of Private National Mortgage Acceptance Company, LLC (PennyMac) Distressed Mortgage Conventional MSRs Whole Loans Bulk Mortgage Servicing Warehouse Lending Rights Acquisitions MortgageBacked and Asset Backed Securities |
|
|
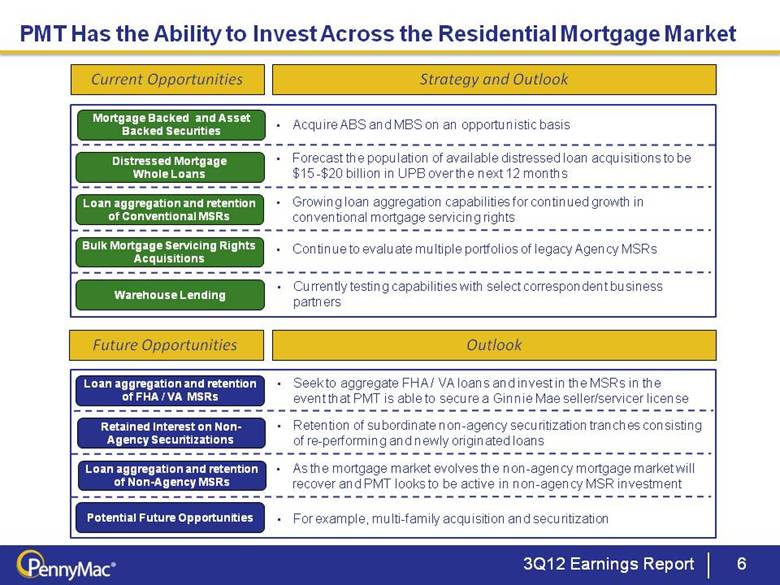
3Q12 Earnings Report 6 For example, multi-family acquisition and securitization PMT Has the Ability to Invest Across the Residential Mortgage Market Current Opportunities Strategy and Outlook Acquire ABS and MBS on an opportunistic basis Forecast the population of available distressed loan acquisitions to be $15 -$20 billion in UPB over the next 12 months Growing loan aggregation capabilities for continued growth in conventional mortgage servicing rights Continue to evaluate multiple portfolios of legacy Agency MSRs Seek to aggregate FHA / VA loans and invest in the MSRs in the event that PMT is able to secure a Ginnie Mae seller/servicer license Currently testing capabilities with select correspondent business partners Retention of subordinate non-agency securitization tranches consisting of re-performing and newly originated loans Future Opportunities Outlook As the mortgage market evolves the non-agency mortgage market will recover and PMT looks to be active in non-agency MSR investment Mortgage Backed and Asset Backed Securities Distressed Mortgage Whole Loans Loan aggregation and retention of Conventional MSRs Bulk Mortgage Servicing Rights Acquisitions Warehouse Lending Future Opportunities Loan aggregation and retention of FHA / VA MSRs Retained Interest on Non-Agency Securitizations Loan aggregation and retention of Non-Agency MSRs PotentialFutureOpportunities |
|
|
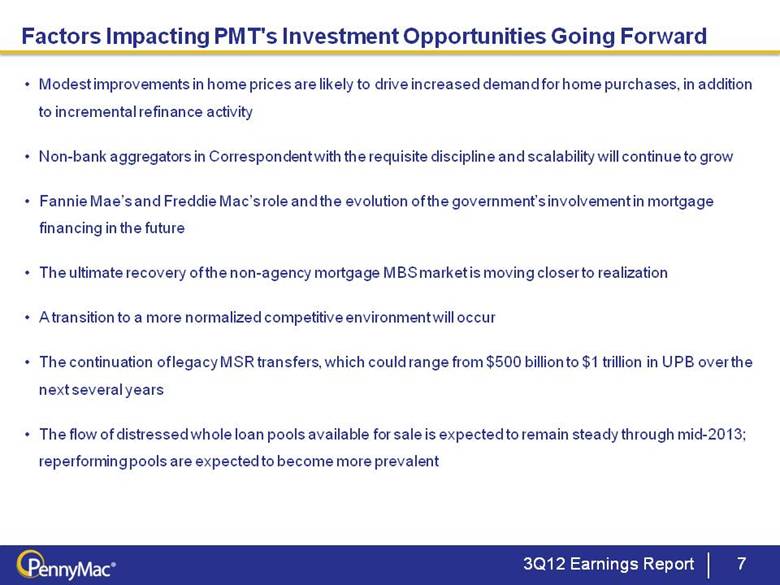
Modest improvements in home prices are likely to drive increased demand for home purchases, in addition to incremental refinance activity Non-bank aggregators in Correspondent with the requisite discipline and scalability will continue to grow Fannie Mae’s and Freddie Mac’s role and the evolution of the government’s involvement in mortgage financing in the future The ultimate recovery of the non-agency mortgage MBS market is moving closer to realization A transition to a more normalized competitive environment will occur The continuation of legacy MSR transfers, which could range from $500 billion to $1 trillion in UPB over the next several years The flow of distressed whole loan pools available for sale is expected to remain steady through mid-2013; reperforming pools are expected to become more prevalent Factors Impacting PMT's Investment Opportunities Going Forward 3Q12 Earnings Report 7 |
|
|
Mortgage Investment Activities |

|
|
Correspondent Purchase Volume and Mix 3Q12 Earnings Report 9 Correspondent Success Fuels Continued Investments in MSRs (1) For FHA/VA, PMT earns a sourcing fee and interest income for its holding period and does not pay a fulfillment fee. (1) ($ in millions) Correspondent loan purchases totaled $6.3 billion in 3Q12, up 87% vs. 2Q12 Interest rate lock commitments: $8.5 billion Conventional & Jumbo loans comprised approximately 59% of total fundings October purchases reached $3.3 billion; Year-end target of $3.5 billion of purchases per month MSR Portfolio and MSR Asset ($ in millions) UPB Solid MSR portfolio growth continued in 3Q12, rising over 100% Q/Q MSRs remain a key investment opportunity Ability to organically grow a valuable MSR portfolio in the current low rate environment is a key differentiating factor for PMT |

|
|
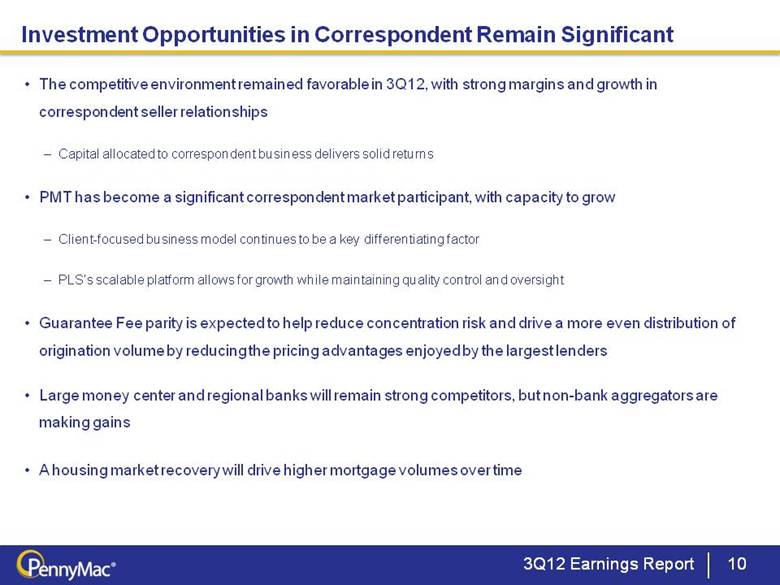
The competitive environment remained favorable in 3Q12, with strong margins and growth in correspondent seller relationships Capital allocated to correspondent business delivers solid returns PMT has become a significant correspondent market participant, with capacity to grow Client-focused business model continues to be a key differentiating factor PLS’s scalable platform allows for growth while maintaining quality control and oversight Guarantee Fee parity is expected to help reduce concentration risk and drive a more even distribution of origination volume by reducing the pricing advantages enjoyed by the largest lenders Large money center and regional banks will remain strong competitors, but non-bank aggregators are making gains A housing market recovery will drive higher mortgage volumes over time Investment Opportunities in Correspondent Remain Significant 3Q12 Earnings Report 10 |
|
|
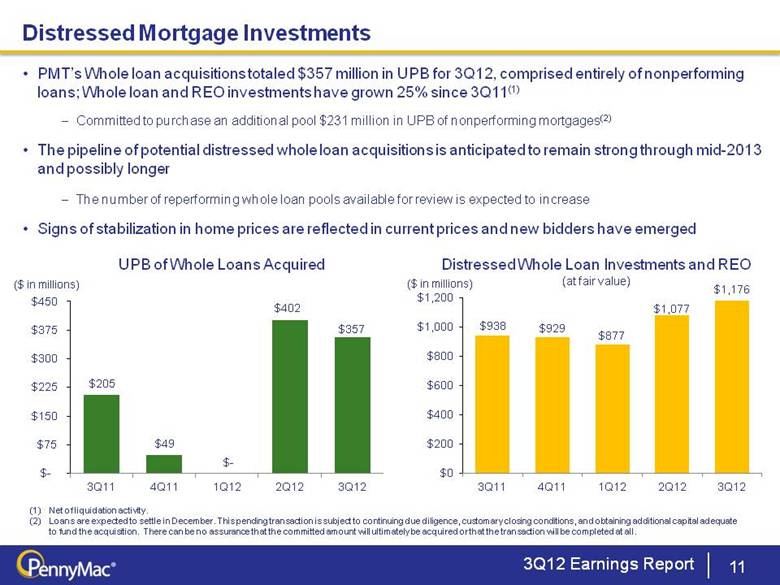
Distressed Whole Loan Investments and REO (at fair value) PMT’s Whole loan acquisitions totaled $357 million in UPB for 3Q12, comprised entirely of nonperforming loans; Whole loan and REO investments have grown 25% since 3Q11(1) Committed to purchase an additional pool $231 million in UPB of nonperforming mortgages(2) The pipeline of potential distressed whole loan acquisitions is anticipated to remain strong through mid-2013 and possibly longer The number of reperforming whole loan pools available for review is expected to increase Signs of stabilization in home prices are reflected in current prices and new bidders have emerged 11 Distressed Mortgage Investments 3Q12 Earnings Report UPB of Whole Loans Acquired Net of liquidation activity. Loans are expected to settle in December. This pending transaction is subject to continuing due diligence, customary closing conditions, and obtaining additional capital adequate to fund the acquisition. There can be no assurance that the committed amount will ultimately be acquired or that the transaction will be completed at all. ($ in millions) ($ in millions) (1) (2) |
|
|
Specialty Servicing Expertise Drives Investment Returns 3Q12 Earnings Report 12 Outcomes After First Twelve Months of PennyMac Ownership (1) Based on a static population of 3,165 non-performing and underperforming whole loans with UPB of $878 million and an average delinquency at acquisition of 12 months Outcome refers to loans resolved via one of the outcomes shown in the chart above from an original loan population at 9-30-11 of 7,126 loans with UPB of 1.31 billion. PLS’s specialty servicing expertise seeks to drive beneficial outcomes for shareholders and borrowers Success in avoiding foreclosure is a direct result of strategic efforts by PLS and their extensive specialty servicing expertise Analyzing a portfolio of loans held by PMT over the last twelve months, you can observe: 44% of the loans in the portfolio had some specific resolution(2) Of those resolutions, alternatives to foreclosure were achieved in over 61% of the loan outcomes 33% of the loans were either brought current, modified, or had a full payoff Helping borrowers keep their home is a priority for PMT, and one which optimizes shareholders’ returns in many cases Effective servicing execution drives investment performance |

|
|
Financial Results |

|
|
Mortgage assets rose 20% Q/Q to $2.1 billion The growth was driven by an 84% Q/Q increase in correspondent loans acquired for sale and a 10% rise in distressed whole loans Investments in mortgage servicing rights increased 98% Q/Q to $65 million, and MBS positions were liquidated, with proceeds allocated to higher yielding opportunities 3Q12 Earnings Report 14 Mortgage Asset Growth Continues Mortgage Assets (at fair value) ($ in millions) MBS DWLInvestments REO CorrespondentLoans Acquiredfor Sale MSRs |

|
|
3Q12 Earnings Report 15 Solid Growth In Net Income and Dividends Net Income and Dividends(1) Net income reached $40.4 million, an increase of 37% Q/Q and up 97% from 3Q11 The growth was primarily driven by a 54% Q/Q increase in net investment income, which reached $99 million for the quarter and included $49.8 million gains from correspondent loans Net income was reduced by higher tax provisioning levels due to a larger portion of income coming from Correspondent Lending, which resides in the taxable REIT subsidiary ($ in millions) Declared in the quarter following the period for which earnings are reported. Net Income Dividends |

|
|
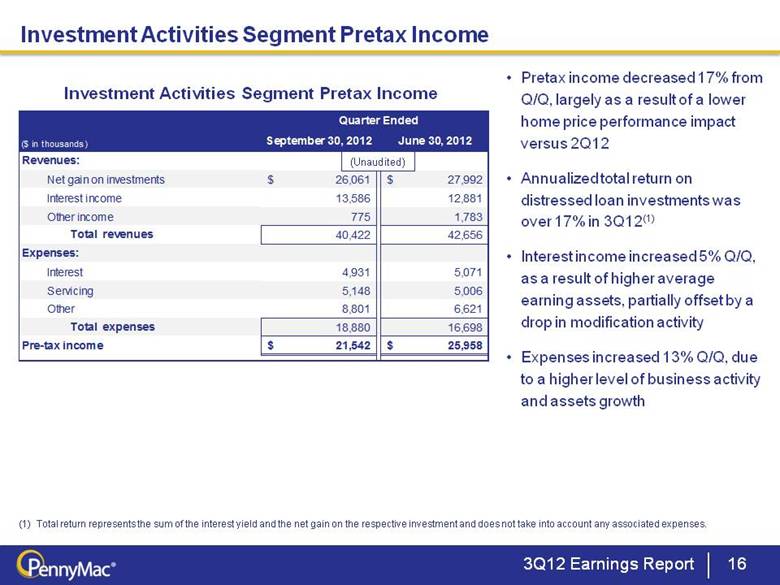
3Q12 Earnings Report 16 Investment Activities Segment Pretax Income Pretax income decreased 17% from Q/Q, largely as a result of a lower home price performance impact versus 2Q12 Annualized total return on distressed loan investments was over 17% in 3Q12(1) Interest income increased 5% Q/Q, as a result of higher average earning assets, partially offset by a drop in modification activity Expenses increased 13% Q/Q, due to a higher level of business activity and assets growth Investment Activities Segment Pretax Income Total return represents the sum of the interest yield and the net gain on the respective investment and does not take into account any associated expenses. (Unaudited) Quarter Ended ($ in thousands) September 30, 2012 June 30, 2012 Revenues: Net gain on investments 26,061 $ 27,992 $ Interest income 13,586 12,881 Other income 775 1,783 Total revenues 40,422 42,656 Expenses: Interest 4,931 5,071 Servicing 5,148 5,006 Other 8,801 6,621 Total expenses 18,880 16,698 Pre-tax income 21,542 $ 25,958 $ |
|
|
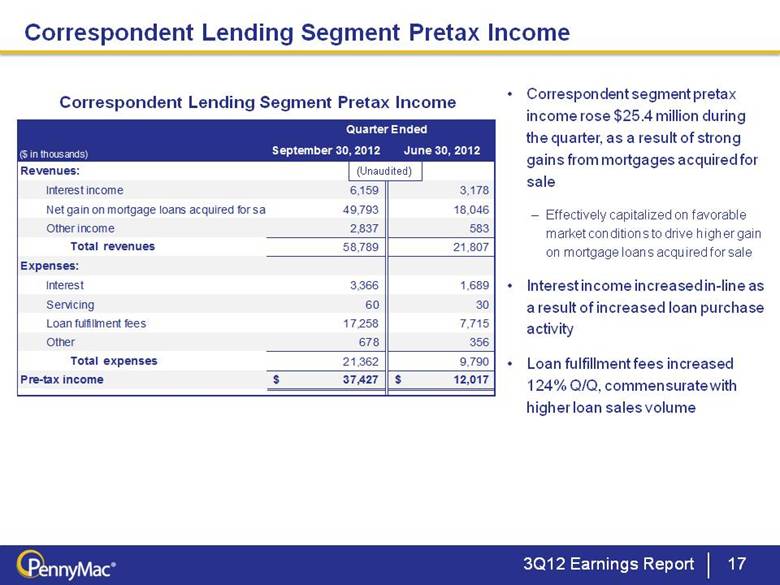
3Q12 Earnings Report 17 Correspondent Lending Segment Pretax Income Correspondent segment pretax income rose $25.4 million during the quarter, as a result of strong gains from mortgages acquired for sale Effectively capitalized on favorable market conditions to drive higher gain on mortgage loans acquired for sale Interest income increased in-line as a result of increased loan purchase activity Loan fulfillment fees increased 124% Q/Q, commensurate with higher loan sales volume Correspondent Lending Segment Pretax Income (Unaudited) Quarter Ended ($ in thousands) September 30, 2012 June 30, 2012 Revenues: Interest income 6,159 3,178 Net gain on mortgage loans acquired for sale 49,793 18,046 Other income 2,837 583 Total revenues 58,789 21,807 Expenses: Interest 3,366 1,689 Servicing 60 30 Loan fulfillment fees 17,258 7,715 Other 678 356 Total expenses 21,362 9,790 Pre-tax income 37,427 $ 12,017 $ |
|
|
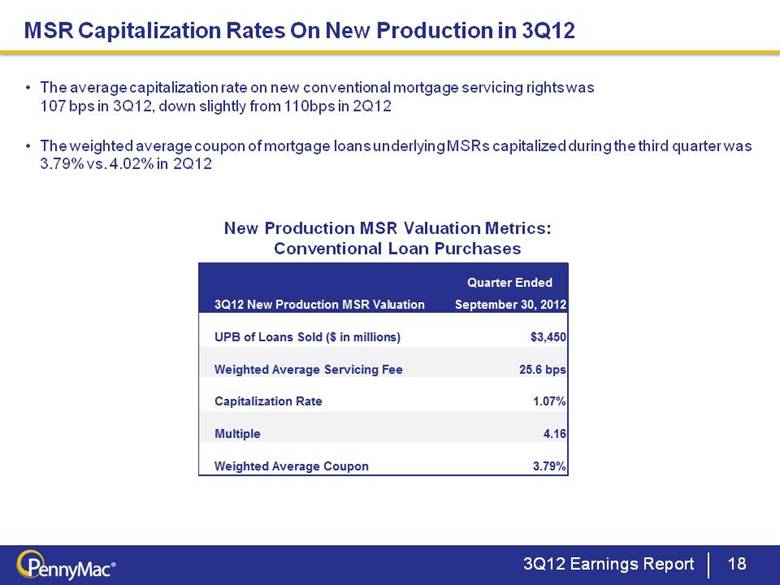
3Q12 Earnings Report 18 MSR Capitalization Rates On New Production in 3Q12 The average capitalization rate on new conventional mortgage servicing rights was 107 bps in 3Q12, down slightly from 110bps in 2Q12 The weighted average coupon of mortgage loans underlying MSRs capitalized during the third quarter was 3.79% vs. 4.02% in 2Q12 New Production MSR Valuation Metrics: Conventional Loan Purchases Quarter Ended 3Q12 New Production MSR Valuation September 30, 2012 UPB of Loans Sold ($ in millions) $3,450 Weighted Average Servicing Fee 25.6 bps Capitalization Rate 1.07% Multiple 4.16 Weighted Average Coupon 3.79% |
|
|
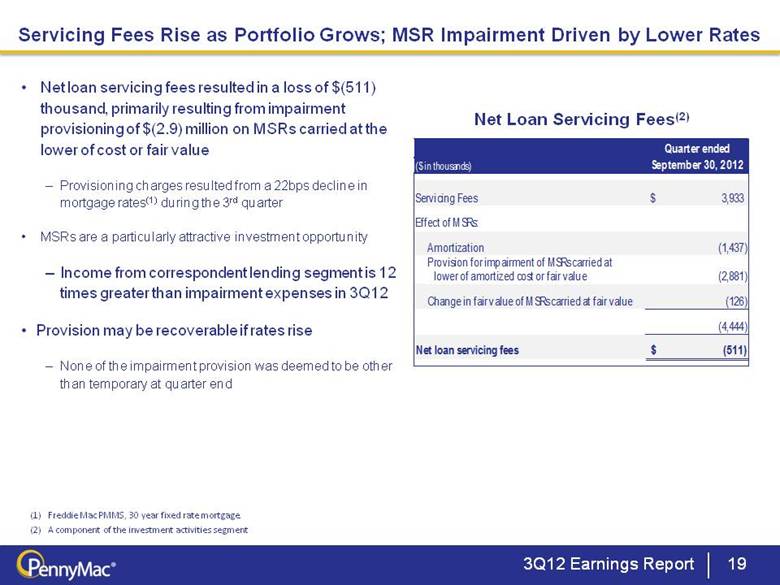
Net loan servicing fees resulted in a loss of $(511) thousand, primarily resulting from impairment provisioning of $(2.9) million on MSRs carried at the lower of cost or fair value Provisioning charges resulted from a 22bps decline in mortgage rates(1) during the 3rd quarter MSRs are a particularly attractive investment opportunity Income from correspondent lending segment is 12 times greater than impairment expenses in 3Q12 Provision may be recoverable if rates rise None of the impairment provision was deemed to be other than temporary at quarter end 3Q12 Earnings Report 19 Servicing Fees Rise as Portfolio Grows; MSR Impairment Driven by Lower Rates Net Loan Servicing Fees(2) Freddie Mac PMMS, 30 year fixed rate mortgage. A component of the investment activities segment Quarter ended ($ in thousands) September 30, 2012 Servicing Fees 3,933 $ Effect of MSRs: Amortization (1,437) Provision for impairment of MSRs carried at lower of amortized cost or fair value (2,881) Change in fair value of MSRs carried at fair value (126) (4,444) Net loan servicing fees (511) $ |
|
|
3Q12 Earnings Report 20 PMT’s REIT Income and Asset Test Results Income Test Requirements YTD Status As of 9/30/12 Notes At least 75% of income must be derived from interest on obligations secured by mortgages or interests in real property, gain from the disposition of non-dealer real property and qualified temporary investment income 94% Income associated with the income test excludes income derived in the TRS At least 95% of income must be derived from the above sources plus dividends and interest, and gain from disposition of securities 99% Predominantly all of the income in the REIT is derived from mortgages and real property Asset Test Requirements YTD Status As of 9/30/12 Notes At least 75% of REIT assets must consist of real estate assets, cash and cash items, government securities, and qualified temporary investments 85% Management of the QRS remains an ongoing focus which is achieved by the purchase of qualified REIT assets, investment in qualified temporary investments, and other strategic investments No more than 25% of REIT assets can consist of securities of taxable REIT subsidiaries 14% |

|
|
Key Takeaways |

|
|
Key Takeaways 3Q12 Earnings Report 22 PMT’s investments delivered solid returns and significant opportunities exist in today’s mortgage market Correspondent growth drives ongoing investment in valuable MSRs Distressed whole loan investments remain a key investment strategy The re-emergence of the non-agency market will drive significant future opportunities The current environment favors PMT’s business model and diversity of investment capabilities Investment opportunities are enhanced through its symbiotic relationship with its investment manager, PCM, and its affiliated servicer and fulfillment provider, PLS PMT continues to produce outstanding results from its current opportunities, while strategically positioning for future opportunities across the mortgage market |
|
|
Appendix |

|
|
Portfolio Acquisitions Are Progressing in Line With Expectations 3Q12 Earnings Report 24 (1) Ratio of unpaid principal balance remaining to unpaid principal balance at acquisition Purchase 3Q12 Purchase 3Q12 Purchase 3Q12 Purchase 3Q12 Balance ($mm) 182.7 $ 81.1 Balance ($mm) 195.5 $ 77.0 Balance ($mm) 146.2 $ 61.6 Balance ($mm) 277.8 $ 160.9 Pool Factor (1) 1.00 0.44 Pool Factor (1) 1.00 0.39 Pool Factor (1) 1.00 0.42 Pool Factor (1) 1.00 0.58 Current 6.2% 26.8% Current 5.1% 28.2% Current 1.2% 25.2% Current 5.0% 28.6% 30 1.6% 4.3% 30 2.0% 5.5% 30 0.4% 4.8% 30 4.0% 6.2% 60 5.8% 6.2% 60 4.1% 2.7% 60 1.3% 2.9% 60 5.1% 5.8% 90+ 37.8% 13.0% 90+ 42.8% 15.1% 90+ 38.2% 14.4% 90+ 26.8% 11.6% FC 46.4% 39.8% FC 45.9% 34.9% FC 58.9% 39.3% FC 59.1% 37.1% REO 2.3% 9.9% REO 0.0% 13.6% REO 0.0% 13.4% REO 0.0% 10.6% Purchase 3Q12 Purchase 3Q12 Purchase 3Q12 Purchase 3Q12 Balance ($mm) 515.1 $ 348.9 Balance ($mm) 259.8 $ 193.6 Balance ($mm) 542.6 $ 346.3 Balance ($mm) 49.0 $ 44.5 Pool Factor (1) 1.00 0.68 Pool Factor (1) 1.00 0.75 Pool Factor (1) 1.00 0.64 Pool Factor (1) 1.00 0.91 Current 2.0% 25.1% Current 11.5% 29.0% Current 0.6% 10.4% Current 0.2% 7.5% 30 1.9% 4.3% 30 6.5% 5.5% 30 1.3% 2.2% 30 0.1% 0.0% 60 3.9% 4.0% 60 5.2% 4.8% 60 2.0% 1.6% 60 0.2% 0.0% 90+ 25.9% 10.9% 90+ 31.2% 14.9% 90+ 22.6% 15.6% 90+ 70.4% 43.0% FC 66.3% 46.1% FC 43.9% 36.5% FC 73.0% 59.4% FC 29.0% 47.1% REO 0.0% 9.5% REO 1.7% 9.3% REO 0.4% 10.8% REO 0.0% 2.5% Purchase 3Q12 Balance ($mm) 402.5 $ 383.1 Pool Factor (1) 1.00 0.95 Current 45.0% 43.6% 30 4.0% 7.2% 60 4.3% 2.5% 90+ 31.3% 25.2% FC 15.3% 20.0% REO 0.1% 1.6% No Pools Purchased in this Quarter. 2Q12 1Q12 1Q10 2Q10 3Q10 4Q10 1Q11 2Q11 3Q11 4Q11 |

|
|
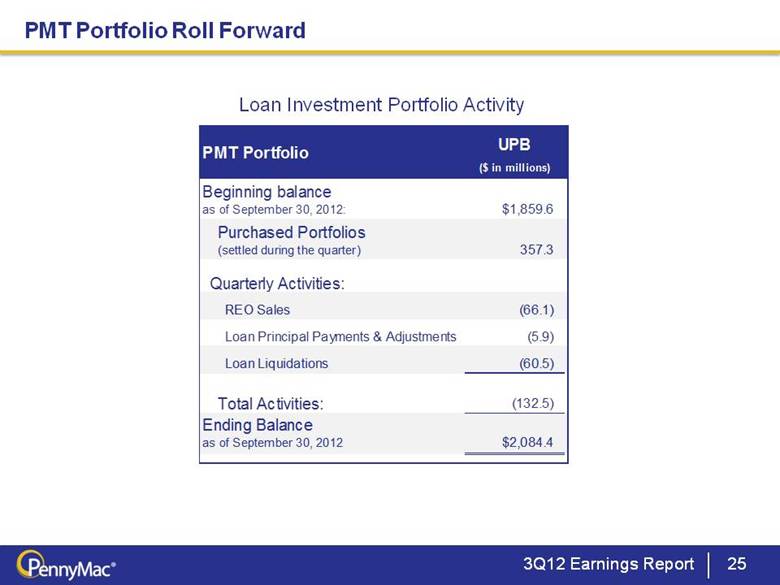
3Q12 Earnings Report 25 PMT Portfolio Roll Forward Loan Investment Portfolio Activity UPB ($ in millions) Beginning balance as of September 30, 2012: $1,859.6 Purchased Portfolios (settled during the quarter) 357.3 Quarterly Activities: REO Sales (66.1) Loan Principal Payments & Adjustments (5.9) Loan Liquidations (60.5) Total Activities: (132.5) Ending Balance as of September 30, 2012 $2,084.4 PMT Portfolio |