Attached files
| file | filename |
|---|---|
| 8-K - FORM 8-K - PATHEON INC | d438034d8k.htm |
 Patheon
Lender Information
November 13, 2012
Exhibit 99.1 |
 1
Forward Looking Statements
•
This presentation contains forward-looking statements or information which reflect Patheon
Inc.’s (“Patheon,” the
“Company,”
“we,”
“us,”
or “our”) expectations regarding possible events, conditions, our future
growth, results of
operations, performance, and business prospects and opportunities. All statements, other than
statements of historical fact, are forward-looking statements. Forward-looking
statements necessarily involve significant known and unknown risks, assumptions and
uncertainties that may cause our actual results in future periods to differ materially from those
expressed or implied by such forward-looking statements, including risks related to our
ability to complete the proposed acquisition of Sobel USA and Banner Europe (together
“Banner Pharmacaps” or “Banner”) and the related equity and
debt financings; integration of and achievement of our intended objectives with respect to our
acquisition of Banner; and compliance with our debt covenants and our debt service
obligations. For additional information regarding risks and uncertainties that could
affect our business, please see our 2011 Form 10-K and our subsequent filings with the U.S.
Securities and Exchange Commission and the Canadian Securities Administrators. Accordingly, you
are cautioned not to place undue reliance on forward-looking statements.
•
These forward-looking statements are made as of the date hereof, and except as
required by law, we assume no
obligation to update or revise them to reflect new events or circumstances.
|
 2
Use of Non-GAAP Measures
•
This presentation includes certain financial measures that have not been prepared in accordance
with accounting principles generally accepted in the United States
(“GAAP”). These measures include Adjusted EBITDA, Pro Forma (“PF”) Adjusted EBITDA, PF Adjusted EBITDA less Maintenance
Capex, PF Revenues, PF Gross Profit and Free Cash Flow. Certain of these measures
are presented both for the Company on a standalone basis an on a combined basis with the
estimated results of Banner. •
References in this presentation to “Adjusted EBITDA” are to income (loss) before
discontinued operations before repositioning expenses, interest expense, net, foreign
exchange losses reclassified from other comprehensive income, refinancing expenses, gains and losses on sale of fixed assets,
gain on extinguishment of debt, income taxes, asset impairment charge, depreciation and
amortization and other income and expenses. •
References in this presentation to “PF Adjusted EBITDA ” are to Adjusted EBITDA
adjusted for certain non-cash or other costs, including stock-based compensation
expenses, consulting fees and executive severance, and cost savings/revenue enhancements, on a pro forma basis, from
transformational initiatives implemented by management.
•
References in this presentation to “PF Adjusted EBITDA less Maintenance Capex” are to
PF Adjusted EBITDA less capital expenditures to maintain the Company’s facilities
instead of grow the Company’s revenue. •
References in this presentation to “PF Revenues” and “PF Gross Profit” are
to revenues and gross profit, respectively, adjusted for costs associated with a product
recall by a customer and cost savings/revenue enhancements, on a pro forma basis, from transformational initiatives implemented by
management.
•
References in this presentation to “Total PF Adjusted EBITDA,” “Total PF
Adjusted EBITDA less Maintenance Capex,” “Total PF Revenues” and “Total
PF Gross Profit” are to the corresponding non-GAAP measures presented on an uncombined
basis as adjusted for the estimated pro forma adjusted EBITDA, revenue or gross profit,
as applicable, for Banner and expected synergies from the Banner acquisition.
•
References in this presentation to “Free Cash Flow” are to net cash flows from
operating activities, less purchase of property, plant and equipment, and changes in
accrued expenses related to capital expenditures. •
Since non-GAAP measures, including the measures referenced above and in the presentation,
do not have a standardized meaning, they may not be comparable to similar measures
presented by other issuers. Readers are cautioned that these non-GAAP measures are not based on any
comprehensive set of accounting rules or principles and that they should be considered only in
conjunction with, and not as a substitute for, or superior to, income (loss) before
discontinued operations determined in accordance with GAAP as indicators of performance and not as a substitute
for, or superior to, operating cash flow as an indicator of liquidity, as applicable. These
non-GAAP measures are subject to inherent limitations because (i) they do not
reflect all of the expenses and cash flow associated with income (loss) before discontinued operations and operating cash
flow, respectively, determined in accordance with GAAP and (ii) the composition of these
non-GAAP measures involved the exercise of judgment by management. •
Reconciliations of the non-GAAP measures used in this presentation to their closest U.S.
GAAP measures are included in the appendix to this presentation.
|
 Financial
Information on a GAAP and Non-GAAP Basis US $ millions
2009
2010
2011
2012E
Revenue
655.1
671.2
700
740.9
Gross Profit
144.1
134.4
131.8
157.2
Income (loss) before disc.
operations
1.1
(2.9)
(15.8)
(102.6)
Cash provided by operating
activities
39.1
50.0
22.9
31.5
Cash used in investing activities
(49.3)
(50.0)
(47.4)
(49.3)
Cash provided by financing
activities
13.6
31.6
2.7
26.0
•
Certain non-GAAP information relating to the preliminary results of Patheon for fiscal 2012
and additional non-GAAP information about other completed fiscal years are being
disclosed in this presentation. •
Presented in the table below is certain selected financial information of Patheon, including
the most directly comparable GAAP measures to certain financial measures that are
included in this presentation that have not been prepared in accordance with GAAP.
3 |
 4
Outline
•
Introductions
•
Transaction Summary
•
Executive Summary
•
Patheon Update
•
Acquisition Summary
•
Key Credit Strengths
•
Historical Financial Review |
 5
Introductions |
 6
Presenters Overview
Stuart Grant
Executive Vice President, Chief Financial Officer, Patheon
James Mullen
Chief Executive Officer, Patheon
Michael Lytton
Executive Vice President, Corporate Development and Strategy, and General Counsel,
Patheon |
 7
Patheon Leadership
James Mullen
CEO
•
Mr. Mullen joined Patheon in 2011 as CEO
•
Prior to joining Patheon, he served as CEO
and President at Biogen Idec Inc. from 2003
to 2010, one of the world's largest
biotechnology companies
•
Mr. Mullen was responsible for merger of
Biogen and Idec Pharmaceuticals, serving as
CEO and President of Biogen from 2000 to
2002, and Chairman, CEO and President of
Biogen until merger was complete in 2003
•
Additionally, Mr. Mullen held various operating
positions at Biogen prior to becoming CEO,
including Vice President, Operations, and
several manufacturing and engineering
positions over a nine-year period at
SmithKline Beckman
•
Mr. Mullen possesses over 30 years of
industry experience, ranging from
biotechnology, pharmaceuticals to specialty
chemicals, as well as extensive expertise in
pharmaceutical and biotech manufacturing,
engineering, sales, marketing, M&A
•
Mr. Mullen holds a Bachelor of Science in
chemical engineering from Rensselaer
Polytechnic Institute, and a Master of
Business Administration from Villanova
Stuart Grant
CFO
•
Mr. Grant joined Patheon in 2012 as CFO
•
Prior to joining Patheon, he served as Senior
Vice President and Chief Financial Officer of
BioCryst Pharmaceuticals, Inc., a small molecule
biotech company focused on infectious and
inflammatory disease and cancer
•
Mr. Grant was a key player in the creation and
execution of a company-wide strategy that
stabilized, funded and enabled
commercialization activities
•
Prior to BioCryst was Group Chief Financial
Officer for Serono SA, a global biotechnology
company
•
Additionally, Mr. Grant served in various senior
operating and financial roles, including Finance
Director for Swiss Manufacturing Operations and
then General Manager of the company's
Manufacturing Laboratories over 12 years
•
Mr. Grant spent 15 years in finance at Digital
Equipment Corporation, and several years
working as a tax consultant and senior auditor
for Price Waterhouse in Glasgow, Scotland
•
Mr. Lytton joined Patheon in 2011 as EVP,
Corporate Development
•
Prior to joining Patheon, he served as Executive
Vice President, Corporate and Business
Development of Biogen Idec from 2008-2011
•
Mr. Lytton was General Partner with Oxford
Bioscience Partners, a venture capital firm
investing in therapeutic, diagnostic and life
science tool companies from 2001 to 2008
•
Additionally, Mr. Lytton practiced law from
1984-2000 and specialized in representing
biomedical companies; he was Partner and a
member of the Executive Committee of law firm
Edwards Wildman Palmer and was Partner of
law firm Wilmer Hale
•
Mr. Lytton holds an undergraduate degree from
Princeton University, a Master of Science degree
in epidemiology from the London School of
Hygiene and Tropical Medicine at the University
of London, U.K., where he was a Fulbright
Scholar; he also has a Juris Doctor degree from
Harvard Law School
Michael Lytton
EVP Corporate Development |
 8
•
Strong market position and brand
•
Further strengthened with increased
customer focus
•
$650MM underlying revenue
–
Excludes one-time contract cancellation
benefit of $50MM
•
Increased PF revenue to
approximately $744MM
–
No single customer more than 11%
•
$33MM PF Adjusted EBITDA
excluding the contract cancellation
benefit
–
Weak base of earnings
–
Inefficient facility operations
•
Approximately $102MM in PF Adjusted
EBITDA
•
Improved profitability for all sites and major products
2011
2012
•
No free cash flow
•
Second half free cash flow estimated
to be $20MM
Patheon Transformation |
 9
Transaction Summary |
 10
Transaction Summary
•
On October 29 2012, Patheon, a leading provider of commercial manufacturing and
pharmaceutical development services of branded and generic prescription drugs to the
international pharmaceutical industry, entered into a definitive agreement to purchase
Banner Pharmacaps (the “Acquisition”) for $255 million –
Banner Pharmacaps is a gelatin-based (soft-gel / soft-caps) drug delivery and
specialty pharma company with operations in Europe and the Americas
–
Purchase price implies multiple of 10.2x Banner’s LTM PF Adjusted EBITDA, or 6.8x
including estimated synergies of $12.5 million
–
The Acquisition is expected to close in the fourth calendar quarter of 2012
•
Concurrent with the Transaction, Patheon is seeking to realign its balance sheet with its
strategy –
Transaction will refinance existing funded debt of $280 million principal value and $75
million Revolving Credit Facility (the “Refinancing”)
•
The Acquisition and the Refinancing (together the “Transaction”) will be supported by
(i) a new $565 million Term Loan B, as described in the debt commitment letter, and (ii)
an equity commitment letter from JLL of up to $30 million, and will also include (iii)
an $85 million Revolving Credit Facility expected to be undrawn at closing The combined
company would have generated ~$1 billion in revenue and ~$140 million in Total PF
Adjusted EBITDA in the LTM (net debt¹
would have been 3.9x Total PF Adjusted EBITDA)
•
¹
Total debt less cash and cash equivalents
th |
 11
Sources & Uses and Pro Forma Capitalization
Adjusted Capitalization
($MM)
Pro Forma Amount
x 10/31/2012
PF Adjusted EBITDA
% of Capitalization
Cash
$27.4
Revolver ($85.0)
(1)
$0.0
0.0x
0.0%
Term Loan B
$565.0
4.0x
52.3%
Short Term & Other Borrowings
$1.6
0.0x
0.1%
Total Debt
$566.6
4.1x
52.4%
Market Value of Patheon Equity
(3)
$514.0
3.7x
47.6%
Total Capitalization
$1,080.6
7.7x
100.0%
Total PF Adj. LTM EBITDA
$139.7
Bank Debt / PF Adj. EBITDA
4.0x
Total Debt / PF Adj. EBITDA
4.1x
Net Debt / PF Adj. EBITDA
3.9x
PF Adj. EBITDA / Net Interest Expense
4.1x
(PF
Adj.
EBITDA
–
Maintenance
Capex)
/
Net
Interest
Expense
3.3x
Sources
($MM)
(%)
Revolver ($85.0)
(1)
$0.0
0.0%
Term Loan B
$565.0
91.3%
Additional Cash Equity
$30.0
4.8%
Cash from Patheon
$24.0
3.9%
Total Sources
$619.0
100.0%
Uses
($MM)
(%)
Banner Purchase Price
$255.0
41.2%
Refi. Existing Patheon Bonds
$280.0
45.2%
Breakage Costs of Bonds
(2)
$25.0
4.0%
Refi. Existing ABL
$30.0
4.8%
Total Fees and Expenses
$29.0
4.7%
Uses
$619.0
100.0%
(1)
Assumes no amount drawn at transaction close
(2)
Estimated breakage costs at transaction close
(3)
Based on shares outstanding multiplied by share price of $3.75 as of 11/01/12 and
includes $30MM of additional cash equity; converts CAD/USD at 1.0 |
 12
Executive Summary |
 13
Executive Summary
•
Patheon is a leading Contract Development and Manufacturing Organization (“CDMO”)
with global reach and
long-standing
client
relationships
–
In 2011, the Board strengthened the management team with senior leaders from biopharma
industry –
Management refocused the Company on efficiency, delivery and quality by implementing
strategies to improve operations, procurement and pricing
•
Patheon transformation initiatives are moving along very well and will result in an estimated
$40 million in Adjusted EBITDA impact in FY 2012, before consulting fees.
•
Industry dynamics are strong in both PDS and CMO market segments, and Patheon believes it is
well positioned for continued growth in the future
•
Banner Pharmacaps acquisition is an opportunity for Patheon to deepen its presence in oral
dosage manufacturing and own products and proprietary technologies, as well as enter
Latin America •
Combined entity with over $1 billion in estimated revenue and $140 million in combined PF
Adjusted EBITDA will enhance our position as a leading CDMO with a stronger brand name,
more diversified customer and product base, and a healthy balance sheet that we believe
will de-lever quickly over time |
 14
Patheon Update |
 15
Patheon Overview
•
Market leading CDMO with global footprint in growing industry
of pharmaceutical outsourcing
•
2012 estimated PF Revenues of $744 million and PF Adjusted
EBITDA of approximately $102 million, respectively
•
Operates in two distinct yet synergistic segments
•
Commercial Manufacturing Outsourcing
(“CMO”)
–
~$605 million 2012 revenue (82% of Revenue)
–
Long-cycle, diversified, sticky customer base
•
Pharmaceutical Development Services (“PDS”)
–
~$139 million 2012 revenue (18% of Revenue)
–
Short-cycle, helps to fuel CMO segment
•
Core dosage form expertise in solids and steriles
•
Over 4,000 employees across 11 facilities
•
Listed on the Toronto Stock Exchange (Ticker: PTI)
PDS
CMO
•
Research Triangle Park, USA
•
San Francisco, USA
•
Cincinnati, USA
•
Manati, Puerto Rico
•
Whitby, Canada
•
Toronto, Canada
•
Bourgoin, France
•
Swindon, England
•
Milton Park, England
•
Monza, Italty
•
Ferento, Italty
Patheon’s Global Network |
 16
CMO and PDS are distinct businesses with PDS originating 25% of CMO business
CMO –
$605MM
•
~ 5-year contract duration
•
Size $100K –
$50MM+
•
Longer cycle
•
Diversified
•
High barrier to switch
PDS –
$139MM
•
6 –
12 contract month duration
•
Size $100K –
$1MM
•
Shorter cycle with initial project typically
generating 2.5x revenue over time
•
Fuels CMO business with 25% of CMO revenue
starting in PDS
Patheon Participates in Two Business Segments Across
a Broadly Diversified Customer Base
Top 20 PDS Clients
(1)
Top 20 CMO Clients
(1)
All Others
All Others
Top Client Y
Top Client X
Top 5 CMO clients do not overlap with Top 5 PDS clients
(1)
YTD 2012 |
 17
Patheon is the Only Company with a Leadership Position in
both CMO and PDS Markets
CMO
PDS
$12.3Bn Market Size
(1)
(+5% Growth Rate)
$1.4Bn Market Size
(1)
(+7% Growth Rate)
•
Healthy growth (5%) expected in simple oral,
but much higher in steriles (10%+)
•
Patheon is vendor of choice since it can take
products from development into
manufacturing
•
Higher growth rates at 7%
•
Patheon is a leader in the PDS market
segment and well regarded for its scientific
expertise
Catalent
Patheon
Famar
Baxter
FAREVA
Holdings
Vetter
Haupt
Aenova
All Other
Catalent
100+
Others
Patheon
Almac
Lancaster
Labs
SGS
PPD
Aptuit
AAIPharma
(1)
Market size as of 2011 |
   18
Source: EvaluatePharma®
(1)
Only those companies that publicly disclose sales are included
(2)
Novartis and Sanofi are not counted among the Generics companies
Patheon Serves Each of the Four Major Customer
Segments and Each is Growing Rapidly
520
437
18
152
194
12
22
77
110
81
1,000+
66
•
Most receptive to outsource partners that
can supply complex products
•
10% of Patheon revenues in 2011
•
Outsourcing
rate
varies
(10
–
20%)
Generics
(2)
Emerging Pharma
< $500MM in Sales
Mid-size/Specialty
$500MM to $8Bn
in Sales
Large
Pharma / Biotech
> $8Bn in Sales
Pharma / Biotech
Market Segments
(1)
Number of
companies
Profile Attributes
Total Drug Sales ($MM)
2010
2016
•
Hold majority of commercial products
•
51% of Patheon revenues in 2011
•
Outsourcing
rate
is
low
10
–
20%
•
Hundreds of companies. Most drug
development begins here
•
12% of Patheon revenues in 2011
•
Outsourcing rate is high ~75%
•
Interest in end-to-end solutions
•
Smaller number of companies but
very receptive outsourcing partners
•
Want to deal with fewer service providers
•
26% of Patheon revenues in 2011
•
Outsourcing
rate
is
moderate
40
–
50%
•
Need to outsource driven by lack of capacity
16
23
263
16
Patheon
customers |
 19
Patheon has been Delivering against First Two Elements of Strategy
since Early 2011 and is now Moving Towards Later Elements
•
Benchmarking proved
Patheon lagged comps
in operations (per
production unit basis)
•
Transformation project
–
operations,
procurement, pricing,
G&A –
paid for itself in
one year
•
Network rationalization
•
Commercial team to
focus on key accounts
•
Executive insights -
solicit key customer
feedback for business
positives and key
improvements
•
Banner acquisition will
bring proprietary
products (Aleve,
Zyrtec, ibuprofen) and
soft-gel technologies
•
Gain direct exposure
to emerging markets
(Latin America)
•
Top 10 CMOs are less than 50%
of market with remaining share
divided amongst 400 companies
•
Potentially 1/3 of companies could
exit; which we believe will help
with long-term pricing power
Strengthen
core operations
Sell business
differently
Enter logical
adjacencies
Drive industry
consolidation |
 20
Global support function simplification
Contract compliance
Pricing process: opportunity filter and standard costing
Global spending policies and discipline
Focused direct and indirect cost categories
Site OE transformations for both CMO and PDS
Capacity release of bottlenecks enables quick revenue gains
2012 Impact
($MM)
~8.7
~1.6
~1.8
Operational
Transformation
is
estimated
to
have
increased
Adjusted
EBITDA
by
approx.
$40
million
in
Fiscal
Year
2012
~28.0
Achieved Cost Savings & Pricing Initiatives
Operational
Excellence
Procurement
G&A
Pricing
Strengthen
core operations
1
2
3
4
5
6
7
Patheon set out to achieve $37MM in Adjusted EBITDA impact in 2012
|
 21
Solution and “targeted”
selling builds on our
strengths in PDS and CMO within solids and
sterile injectables
Recent major multi-year contract win with
Boehringer Ingelheim is an example of solution
selling to an important customer
Other examples include SoluPath™, P-Gels™, Quick to Clinic™, and
Sterile Backup Supply We have also been Selling the Business Differently by Offering
Integrated Solutions to Our Customers
Sell business
differently |
 22
Acquisition Summary |
 23
Banner Overview
Banner Company Overview
Banner Customers
•
#2 leading manufacturer of gelatin-based (soft-gel/gelcaps)
drug delivery and specialty pharmaceuticals
•
Owns IP related to 7 different technologies for:
–
Controlled release (time and target)
–
Absorption enhancement
–
Safety and compliance
•
Owns IP for 16 proprietary products currently in market and
owns IP for another 15+ proprietary products in the pipeline
•
Operates in 3 market segments: OTC, Rx and Nutritional and
sells direct to market for private label and OTC
•
1,284 employees worldwide
•
Headquartered in High Point, NC with additional facilities in
Alberta, Mexico City, and The Netherlands
Proprietary
Technology
•
Major Consumer Health Companies
Selling OTC
•
Leading Private Label Resellers
•
Consumer Buying Clubs
•
Major Generics Companies
•
Pharmacy Chains |
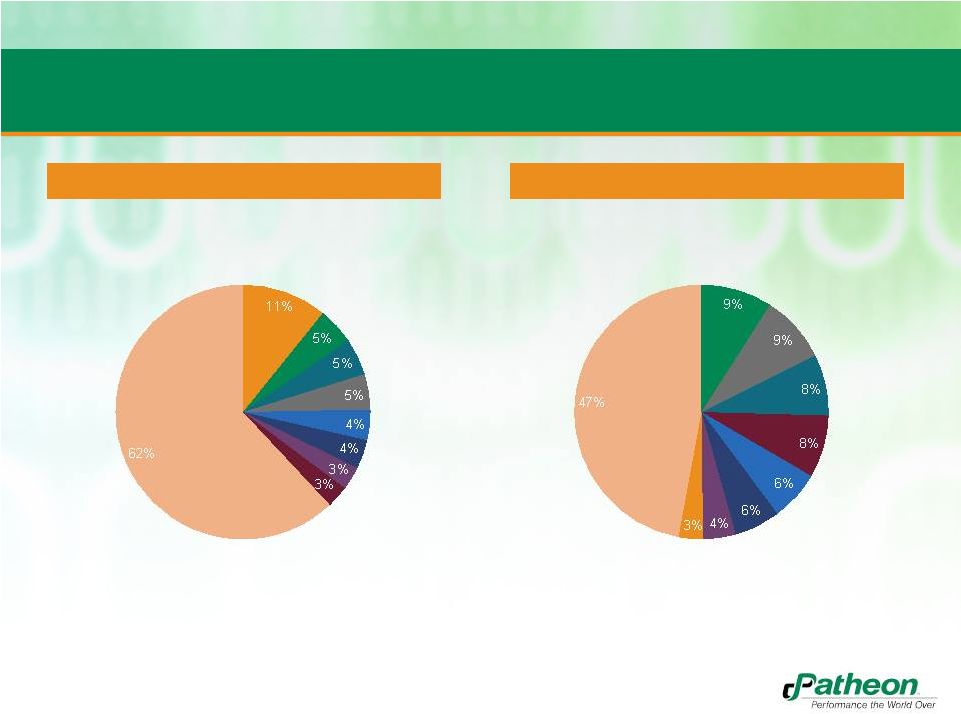
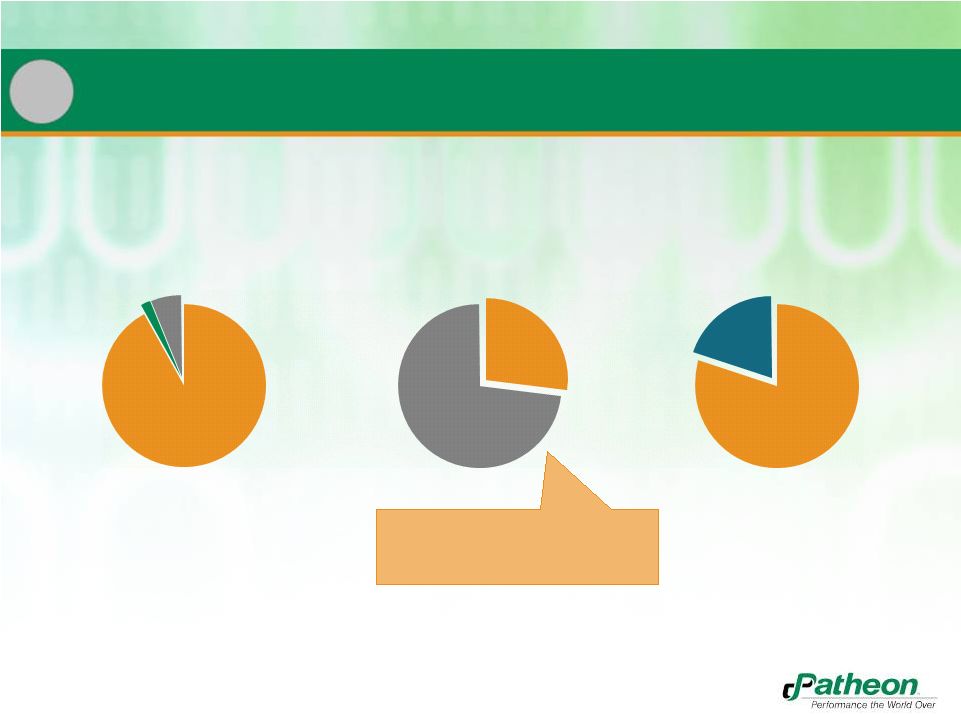
 24
Current Revenues are Generated Primarily in North
America and from a Portfolio of Proprietary Products
Europe
14%
Latin
America
16%
U.S. +
Canada
70%
CMO
38%
Proprietary
Products
62%
Sales by Geography
(1)
Sales by Segment
(1)
•
Expands Patheon’s presence in US, EU, and parts of Latin America
•
Patheon will continue to invest in proprietary products business, which should drive
margin expansion
(1)
LTM sales as of 9/30/2012 |
 25
Acquisition Rationale
•
Increases Size and Scale
in attractive CDMO market
–
Diversifies top line customers and channels
–
Allows for increase in capacity utilization and efficiency gains
•
Gives Patheon access to New Customer Segments (end-sellers, buying clubs, and broad
range of generics partnerships)
•
Adds Proprietary Technologies and Products
–
Gives Patheon proprietary products in attractive soft-gel market
•
Broadens combined company Geographic Footprint
–
Patheon gains greater access to Emerging Markets
–
Banner penetrates more deeply into Europe
•
Provides opportunity to Cross-sell Patheon and Banner Services
•
Allows Patheon to drive Operational Excellence across Banner network
•
Operational
synergies
of
approximately
$12.5
million
expected
to
be
delivered |
 26
Key Credit Strengths |
 27
Summary of Credit Highlights
Increased Diversity of Revenue and Profitability
1
Leading Positions in Large and Attractive Markets
3
Global and Diversified Manufacturing Network
5
Recurring Revenue Model with High Visibility
2
Best in Class Management Team
6
Industry Leading Quality Record
4 |
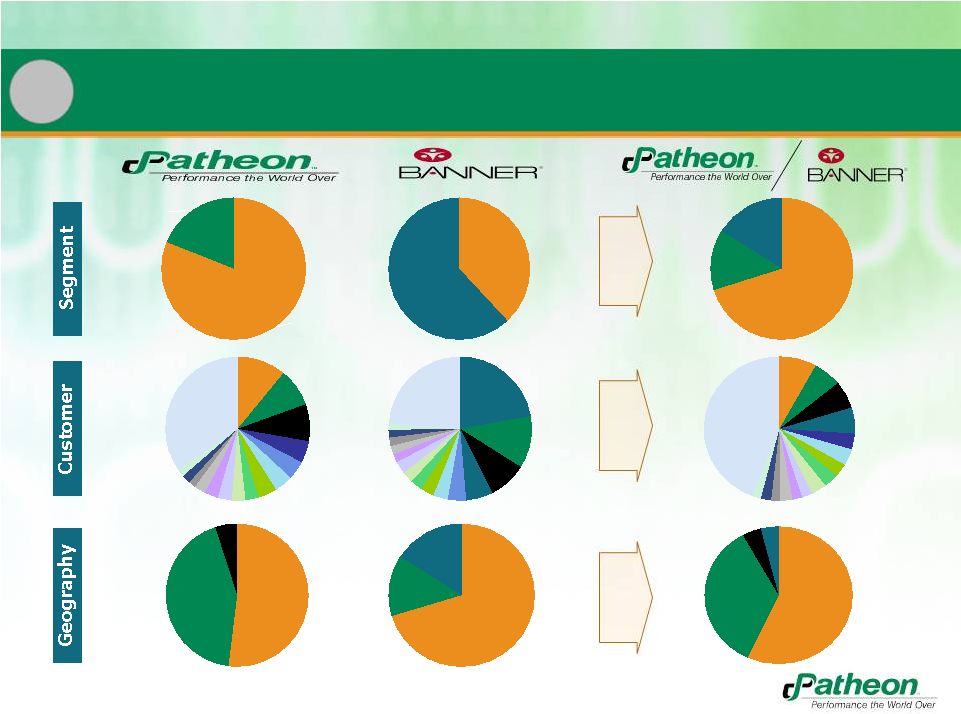 28
CMO
81%
PDS
19%
CMO
38%
Proprietary
62%
EUR
43%
NA
52%
NA
70%
EUR
14%
LatAm
16%
1
Increased Diversity of Revenue and Profitability
$139MM
$167MM
$605MM
$104MM
$709MM
$139MM
$167MM
Rest 35%
#P1_11%
Other
5%
Other
4%
LatAM
4%
Rest 24%
Rest 44%
#P2_9%
#P3_8%
#B1_22%
#B2_12%
#B3_9%
#P1_8%
#P2_6%
#P3_6%
Note: Only one customer is a Top 15 customer for both Patheon (#7) and Banner (#12)
#P4_5%
#P5_4%
#B4_6%
#B5_4%
#B1_6%
#P4_4%
$320MM
$387MM
$37MM
$190MM
$38MM
$43MM
$577MM
$358MM
$43MM
$37MM
CMO
70%
PDS
14%
Proprietary
16%
NA
57%
EUR
35% |
 29
Under Contract
New Sales
New Sales
Recurring Revenue Model with High Visibility
Patheon CMO
Patheon PDS
Banner
Under Contract
Under Contract
New
Product
Launches
Other
•
PDS business under contract has
historically resulted in 2.5x initial
revenue over lifetime
92%
6%
2%
27%
73%
20%
80%
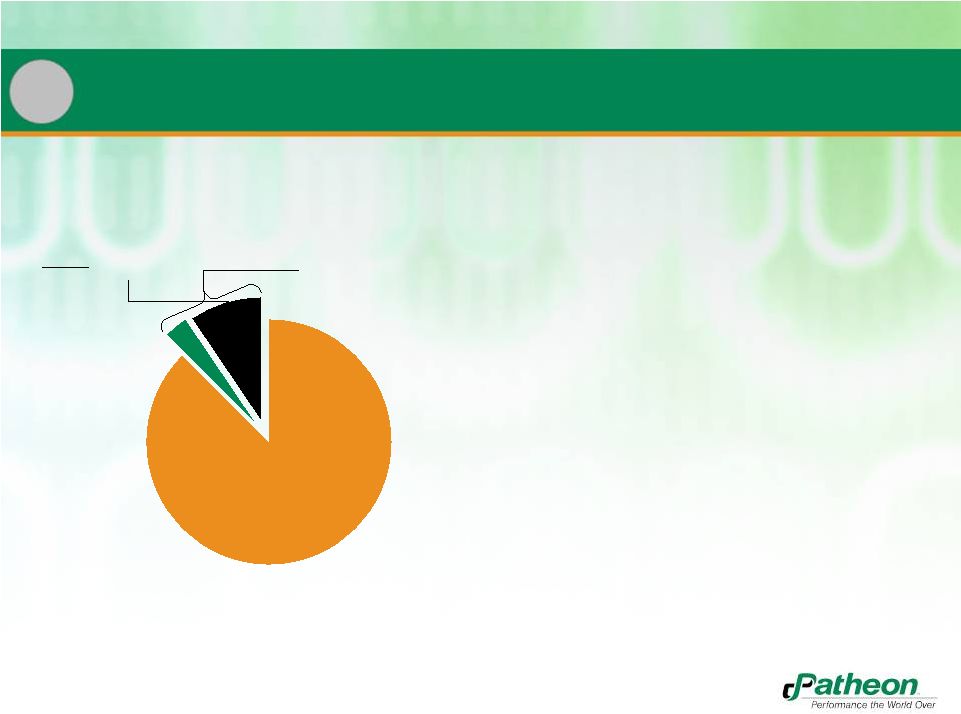
2 |
 30
$12.3Bn market size
(% Market Share)
Catalent
PF Patheon
Strides
Accucaps
Aenova
ProBio
Capsugel
All Others
$1.7Bn market size
(% Market Share)
Soft-gel
PF Patheon
Almac
Lancaster Labs
SGS
Aptuit
AAIPharma
Catalent
PPD
All Others
Hospira
Famar
Corden Pharma
LTS
All Others
Baxter
FAREVA Holdings
Vetter
Haupt
Aenova
Recipharm
Catalent
PF Patheon
$1.4Bn market size
(% Market Share)
PDS
#1
Market
Share
#2
Market
Share
Leading Positions in Large and Attractive Markets
CMO
#2
Market
Share
11%
6%
5%
5%
4%
4%
3%
3%
2%
2%
2%
2%
51%
32%
16%
11%
7%
4%
4%
3%
23%
9%
9%
8%
8%
6%
6%
4%
3%
47%
3 |
 31
•
Neither Patheon nor Banner has had
any warning letters in last 5 years
•
4.2 inspections / audits per week
•
Nearly 1 in every 3 inspections
resulted in zero observations
•
19 pre-approval inspections waived
•
Thorough understanding of
worldwide compliance issues gained
through global reach
Regulatory Scrutiny Continues to Increase
Source: Data from November 2006 through July 2011
102
Regulatory
Agency Inspections
30
Agency
Inspections with
ZERO
Observations
Inspections and Audits,
2007 to 2011
934
934
Customer Audits
Customer Audits
1,036
Total
4
Industry Leading Quality Record |
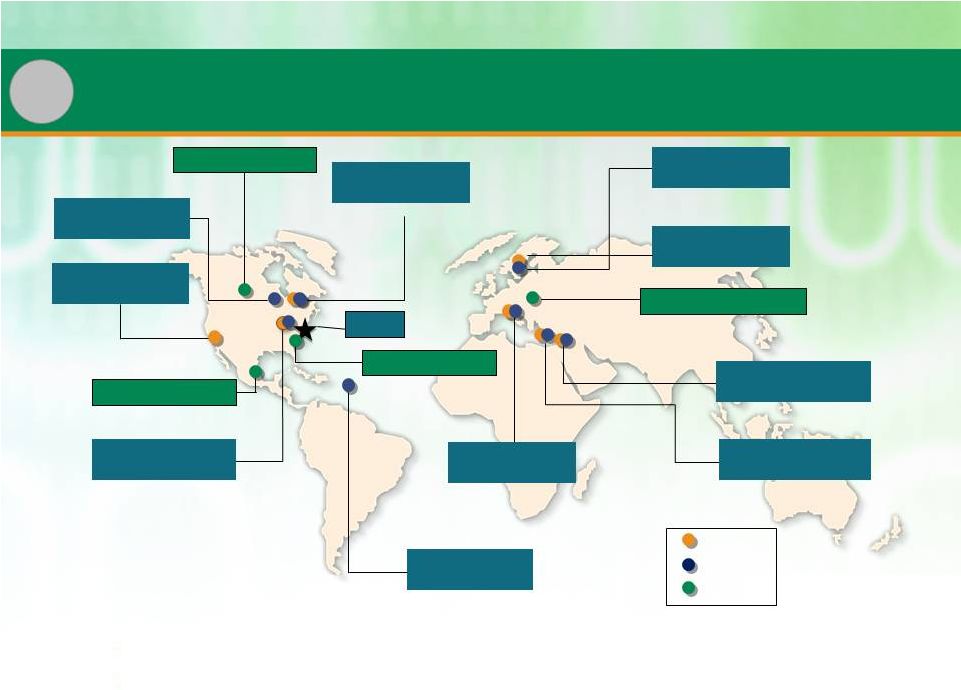 32
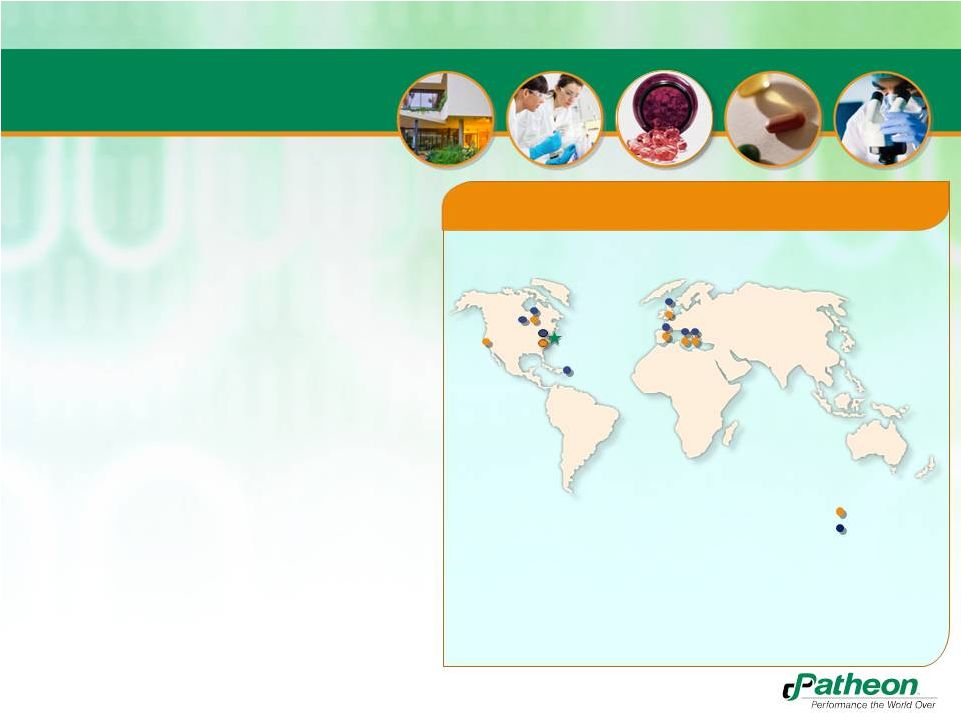
Global and Diversified Manufacturing Network
PDS
CMO
Banner
•
Global facility base diversifies supply chain and reduces risk of disruption
•
Patheon customers can typically optimize location
Cincinnati, USA
(PDS, CMO solid/sterile)
Mexico City, Mexico
San Francisco, USA
(PDS development)
Toronto, Canada
(PDS, CMO solids)
Alberta, Canada
Whitby, Canada
(PDS, CMO solids)
Swindon, England
(PDS, CMO sterile)
HQ
High Point, NC
Bourgoin, France
(PDS, CMO solids)
Manatí, Puerto Rico
(CMO solids)
Ferentino, Italy
(PDS, CMO sterile)
Monza, Italy
(PDS, CMO solid/sterile)
Tilburg, Netherlands
Milton Park, England
(PDS development)
5 |
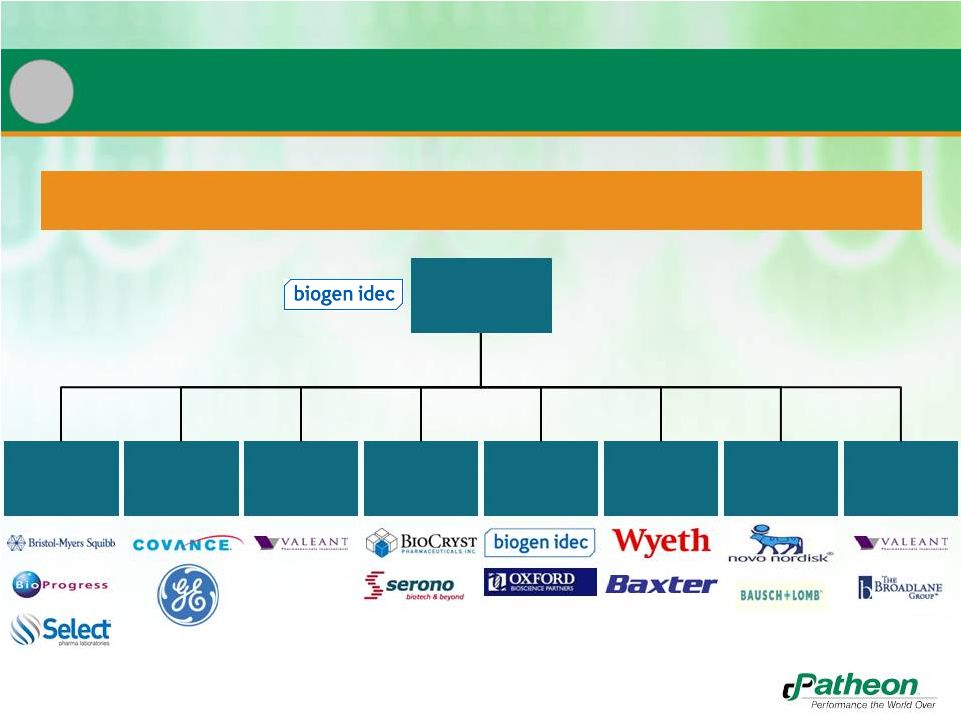 33
Proven ability to drive value through growing core business, expanding into
ancillary markets and integrating complementary acquisitions
James Mullen
Chief Executive
Officer (CEO)
6
Best in Class Management Team
Antonella Mancuso
Global Commercial
Operations and Chief
Manufacturing Officer
Michael Lehmann
Global PDS
President
Geoffrey Glass
Global Sales and
Marketing
Stuart Grant
Chief Financial Officer
Michael Lytton
Development &
Strategy, General
Counsel
Harry Gill
Quality and
Continuous
Improvement
Rebecca
HollandNew
Human Resources
Paul Garofolo
Global PDS
Operations |
 34
Historical Financial Review |
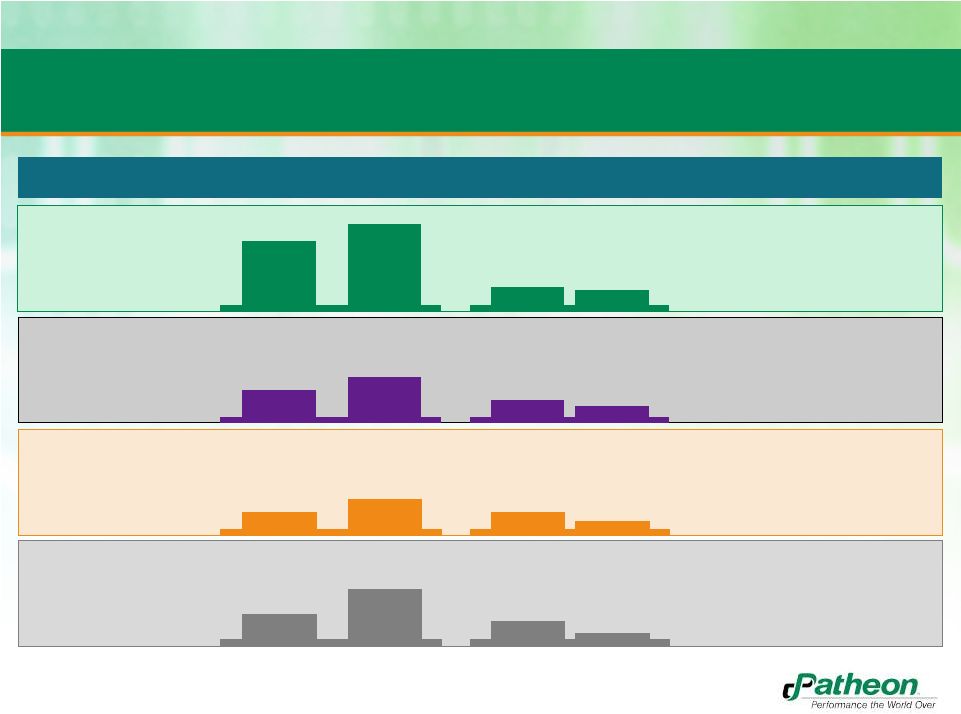
 35
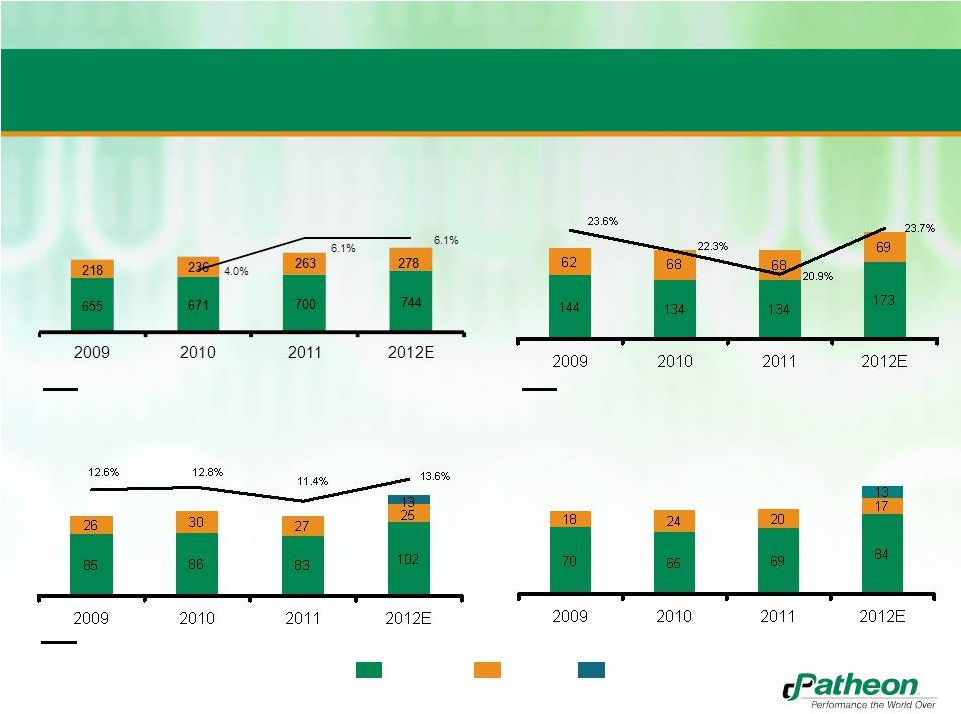
Patheon Standalone Historical Financial Performance
PF Revenue
($MM)
PF Gross Profit
($MM)
% Growth
% Margin
PF Adjusted EBITDA
($MM)
PF Adjusted EBITDA less Maintenance Capex
($MM)
% Margin
650
50
4.3%
2.5%
6.3%
2009
2010
2011
2012E
144
134
84
173
50
22.0%
20.0%
23.3%
19.1%
2009
2010
2011
2012E
134
70
65
19
84
50
2009
2010
2011
2012E
69
85
86
33
102
50
12.9%
12.8%
13.7%
11.9%
2009
2010
2011
2012E
83
Patheon
Benefit of contract cancellation
655
671
700
744
(8.7%) |
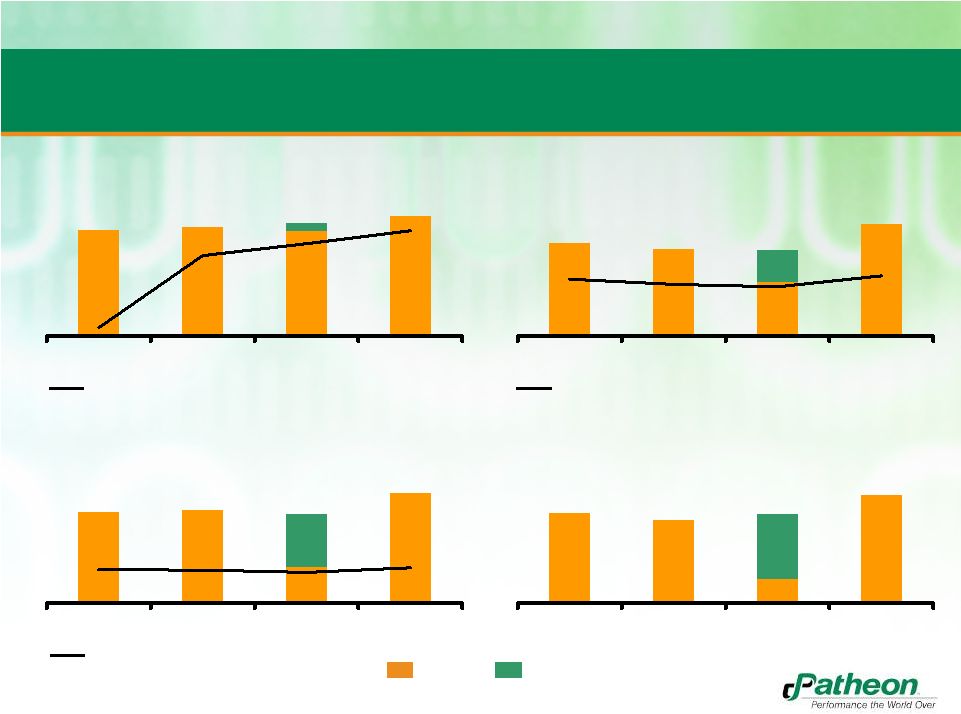
 Combined
Historical and Pro Forma Financial Performance Total PF Adj. EBITDA
($MM)
Total PF Adj. EBITDA less Maint. Capex
($MM)
PF Revenue
($MM)
Total PF Gross Profit
($MM)
Patheon
Banner
Run Rate Synergies
% Growth
% Margin
% Margin
873
907
963
1,022
206
202
242
202
111
116
110
140
88
89
89
114
36 |
 37
Credit Facilities Overview |
 38
Summary of Key Terms
Borrower
Patheon Inc.
Guarantors
Material wholly-owned subsidiaries (excluding certain subsidiaries in jurisdictions where
security interests are difficult to perfect or enforce)
Security
First
priority
lien
on
all
tangible
and
intangible
assets
of
the
Borrower
and
Guarantors
Purpose
To fund the acquisition of Banner and refinance existing debt
Lead Arrangers and
Bookrunners
Morgan Stanley Senior Funding, Inc., UBS Securities LLC, Credit Suisse Securities (USA) LLC,
KeyBank National Association
Administrative Agent
Morgan Stanley Senior Funding, Inc.
Facility and Pricing
Tranche
Amount
Maturity
Revolver
$85 million
5 Years
Term Loan B
$565 million
7 Years
Accordion
$140 million, plus unlimited amounts subject to pro forma First Lien Net Leverage of 4.0x (50
bps MFN applicable during first 18 months of facility)
Amortization
Revolver: None
Term Loan B: 1% per annum
Optional Redemption
101 soft call for first year, prepayable at par thereafter
Mandatory
Repayments
50% excess cash flow sweep with leveraged based step-downs based on net total leverage,
100% of asset sale proceeds, 100% of debt issuance proceeds
Financial Covenants
Revolver:
1st
lien
leverage
covenant
when
>
20%
of
RC
used
with
cushions
set
30%
with
step-downs
to
4.25x
Term Loan B: None
Other Covenants
Customary and standard affirmative and negative covenants, including: limitations on
indebtedness, limitations on liens,
limitations
on
dispositions,
restrictions
on
transactions
with
affiliates,
limitations
on
investments
and
acquisitions |
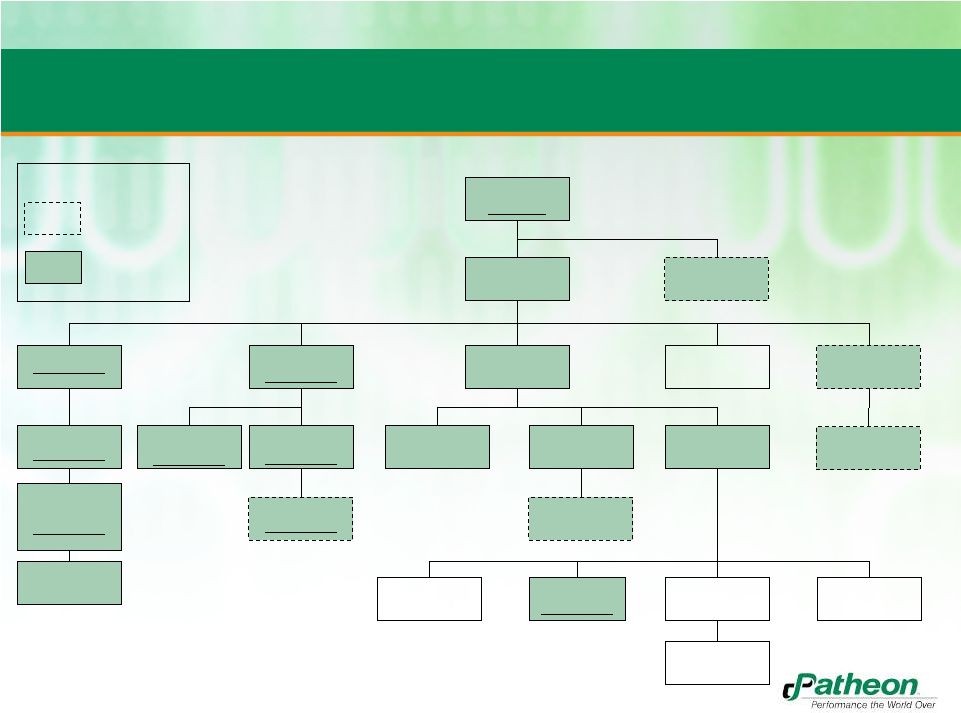 39
Patheon Finance
LLC
(US)
Patheon, Inc.
(CAN)
Parent Borrower
Patheon (UK) Ltd
(UK)
Subsidiary Borrower
Patheon B.V.
(NL)
Patheon
International AG
(CH)
Patheon
International Inc
(CAN)
Patheon
Holdings SAS
(FR)
Patheon Italia SpA
(IT)
Patheon US
Holdings LLC
(US)
Patheon
France SAS
(FR)
Patheon KK
(Japan)
Patheon US
Holdings Inc. (US)
Subsidiary Borrower
Patheon
Pharmaceuticals, Inc.
(US)
Subsidiary Borrower
Patheon
Pharmaceuticals
Services Inc. (US)
Subsidiary Borrower
Patheon PR LLC (US)
Subsidiary Borrower
Patheon Puerto Rico
Inc. (PR)
Subsidiary Borrower
Patheon PR
Acquisitions
Corporation
(PR)
Subsidiary Borrower
CEPH International
Corporation
(US)
Pharmacaps Mexicana
S.A. de C.V.
(MEX)
Gelcaps Exportadora
de Mexico S.A. de C.V.
(MEX)
Pro Forma Organizational Structure
Loan parties represent 81% of each of combined revenues and assets
Banner Pharmacaps,
LLC (US)
Subsidiary Borrower
Banner Pharamcaps
Europe B.V.
(NL)
Banner Pharamcaps
Europe Holding Coop
(NL)
Legend
Banner entities
Banner Pharmacaps
Ltd.
(CAN)
Loan parties |
 40
Summary of Credit Highlights
Increased Diversity of Revenue and Profitability
1
Leading Positions in Large and Attractive Markets
3
Global and Diversified Manufacturing Network
5
Recurring Revenue Model with High Visibility
2
Best in Class Management Team
6
Industry Leading Quality Record
4 |
 41
Appendix |
 42
(1) Represents amortization of stock-based compensation
and non-cash foreign exchange gains and losses.
(2) Represents
consulting
fees
related
to
Patheon's
operational
excellence
program
recorded
in
the
12
months
ended
October
31,
2012.
(3) Represents expenses related to a 2011 product recall by one
of Patheon's customers for product returns recorded in the second quarter of fiscal
2012 and executive severance paid to the company's former CFO in the
first quarter of fiscal 2012. (4)
Represents additional estimated savings/revenues from operational
excellence projects and Puerto Rico overhead savings that Patheon estimates
it would have recognized in fiscal 2012 had all such projects been
completed and fully implemented as of November 1, 2011. 2012 Quarterly PF
Adjusted and Adjusted EBITDA Bridges (unaudited)
Q1 2012
Q2 2012
Q3 2012
Q4 2012
Full Year
PF Adjusted EBITDA
6.0
24.6
36.6
35.0
102.2
Non-cash items (1)
(0.7)
(1.3)
(0.4)
(0.9)
(3.3)
Consulting fees (2)
(6.3)
(6.0)
(1.0)
-
(13.3)
Other items (3)
(0.4)
(2.4)
-
-
(2.8)
Pro forma cost savings (4)
(7.8)
(5.2)
(0.6)
(0.2)
(13.8)
Adjusted EBITDA
(9.2)
9.7
34.6
33.9
69.0
Depreciation and amortization
(10.6)
(10.8)
(9.3)
(9.9)
(40.6)
Repositioning expenses
(0.8)
(6.0)
(0.1)
1.7
(5.2)
Interest expense, net
(6.5)
(6.5)
(6.8)
(6.6)
(26.4)
Impairment charge
-
(57.9)
-
-
(57.9)
Loss on sale of capital assets
-
-
-
(0.6)
(0.6)
Benefit (provision) for income taxes
7.7
(8.0)
(3.3)
(38.3)
(41.9)
Miscellaneous
0.1
(0.1)
0.4
0.6
1.0
(Loss) income before discontinued operations
(19.3)
(79.6)
15.5
(19.2)
(102.6)
Actuals
Estimate |
 43
2009-2012 Annual PF Adjusted and Adjusted EBITDA Bridges
(unaudited)
2009
2010
2011
2012 Est.
$
$
$
$
Income (loss) before discontinued operations
1.1
(2.9)
(15.8)
(102.6)
Add (deduct):
Provision for (benefit from) income taxes
12.6
(13.8)
1.1
41.9
Loss on sale of capital assets
-
0.2
0.2
0.6
Refinancing expenses
-
12.2
-
-
Interest expense, net
15.4
19.6
25.6
26.4
Repositioning expenses
2.1
6.8
7.0
5.2
Depreciation and amortization
42.4
55.6
53.2
40.6
Asset impairment charge
-
3.6
-
57.9
Other
0.4
(0.4)
(4.9)
(1.0)
Adjusted EBITDA
74.0
80.9
66.4
69.0
Non-cash items (1)
1.0
2.3
3.5
3.3
Consulting fees
-
-
10.0
13.3
Special Committee costs
8.0
3.0
-
-
Other (2)
2.0
-
3.2
2.8
Pro forma cost savings/revenue (3)
-
-
-
13.8
PF Adjusted EBITDA
85.0
86.2
83.1
102.2
Banner Adjusted EBITDA (4)
25.5
30.4
27.1
25.0
Synergies (5)
12.5
Total PF Adjusted EBITDA
110.5
116.6
110.2
139.7
Years ended October
31,
(1)
Primarily stock-based compensation expenses.
(2)
Represents costs related to a recall by one of Patheon’s
customers (FY 2011 and FY 2012) and executive relocation and severance (FY 2009, 2011 and 2012).
(3)
Represents additional estimated savings/revenue from operational
excellence projects and Puerto Rico overhead savings that Patheon estimates it would have recognize
in fiscal 2012 had all such projects been completed and fully
implemented as of November 1, 2011. (4)
Represents LTM 10/31 Banner Pharmacaps estimated earnings before
interest expense, income tax expense, depreciation and amortization, foreign exchange gains and
losses, management fees, other income and expense, and pricing
allowance adjustments in FY 2011 and FY 2012.
(5)
Represents estimated annual synergies for FY 2012 resulting from
Patheon's expected acquisition of Banner Pharmacaps assuming completion of integration activities. |
 Total PF Revenue and Gross Profit Bridges
(unaudited)
Represents
estimated
revenue/gross
profit
for
Banner
for
the
12
months
ended
October
31
each
year.
Represents costs related to a recall by one of Patheon’s
customers. Represents
additional
estimated
savings/revenue
from
operational
excellence
projects
and
Puerto
Rico
overhead
savings
that
Patheon
expects
it
would have
recognized in fiscal 2012 had all such projects been completed and
fully implemented as of November 1, 2011. Revenue
2009
2010
2011
2012 Est.
$
$
$
$
Total PF revenue
872.8
907.5
963.0
1,022.2
Banner revenue (1)
217.7
236.3
263.0
278.4
PF revenue
655.1
671.2
700.0
743.8
Product recall costs (2)
1.7
2.4
Pro forma revenue (3)
0.5
Revenue
655.1
671.2
698.3
740.9
Gross profit
Total PF gross profit
205.7
202.3
201.5
242.4
Banner gross profit (1)
61.6
67.9
68.0
69.0
PF gross profit
144.1
134.4
133.5
173.4
Product recall costs (2)
1.7
2.4
Pro forma cost savings/revenue (3)
13.8
Gross Profit
144.1
134.4
131.8
157.2
Years ended October 31,
(1)
(2)
(3)
44
st |
 Bridges to
Cash Provided by Operating Activities (unaudited)
45
2009
2010
2011
2012 Est
Total PF Adjusted EBITDA
139.7
Total maintenance capex
Total PF Adjusted EBITDA less maintenance capex
87.9
88.6
89
Estimated Banner Adjusted EBITDA less maintenance capex (1)
17.5
24
20.2
17.6
Synergies
(2)
12.5
PF Adjusted EBITDA less maintenance capex
70.4
64.6
68.8
83.7
Maintenance capex
14.6
21.6
14.3
18.5
PF Adjusted EBITDA
85
86.2
83.1
102.2
Non-cash items
(3)
(1.0)
(2.3)
(3.5)
(3.3)
Consulting fees
(4)
(8.0)
(3.0)
(10.0)
(13.3)
Other items
(5)
(2.0)
(3.2)
(2.8)
Pro forma cost savings
(6)
-
-
-
(13.8)
Depreciation and amortization
(42.4)
(55.6)
(53.2)
(40.6)
Repositioning expenses
(2.1)
(6.8)
(7.0)
(5.2)
Interest expense, net
(15.4)
(19.6)
(25.6)
(26.4)
Impairment charge
(3.6)
(57.9)
Refinancing expenses
-
(12.2)
-
-
Benefit (provision) for income taxes
(12.6)
13.8
(1.1)
(41.9)
Miscellaneous
(0.4)
0.2
4.7
0.4
Income (loss) before discontinued operations
1.1
(2.9)
(15.8)
(102.6)
Depreciation and amortization
42.4
55.6
53.2
40.6
Stock-based compensation expense
1.1
2.3
3.5
3.4
Impairment charge
3.6
57.9
Loss on sale of capital assets
-
0.2
0.2
0.6
Deferred revenue amortization
(1.0)
(37.4)
(45.0)
(11.7)
Deferred financing charge amortization
0.6
2.5
1.1
1.1
Working capital changes
(10.8)
(2.6)
1.0
(8.6)
Change in other long term assets/liabilities
3.7
(17.5)
(4.6)
27.0
Change in deferred revenue
10.5
47.4
30.4
25.3
Miscellaneous
0.4
(0.5)
(0.1)
(1.1)
Cash used in discontinued operations
(8.9)
(0.7)
(1.0)
(0.4)
Cash provided by operating activities
39.1
50.0
22.9
31.5
Cash used in investing activities
(49.3)
(50.0)
(47.4)
(49.3)
Cash provided by financing activities
13.6
31.6
2.7
26.0
Represents LTM 10/31 Banner Pharmacaps estimated earnings before
interest expense, income tax expense, depreciation and amortization, foreign exchange gains and losses, management fees, other income and
expense, and FY 2011 and FY 2012 pricing allowance adjustments
reduced by estimated Maintenance Capex. Represents
estimated annual synergies for FY 2012 resulting from Patheon's expected acquisition of Banner Pharmacaps assuming completion of integration activities.
Primarily stock-based compensation expenses.
Represents consulting fees related to Patheon's operational excellence
program recorded in the 12 months ended October 31, 2012 and expenses associated with the Special Committee in 2009 and 2010 and SEC
registration in 2011.
Represents costs related to a recall by one of Patheon’s
customers (FY 2011 and FY 2012) and executive relocation and severance (FY 2009, 2011 and 2012).
Represents additional estimated savings/revenue from operational
excellence projects and Puerto Rico overhead savings that Patheon expects it would have
recognized in fiscal 2012 had all such projects been completed and
fully implemented as of November 1, 2011. (1)
(2)
(3)
(4)
(5)
(6)
113.8
25.9 |
 46
Maintenance Capex and Free Cash Flow Bridges
(unaudited)
Maintenance Capex
2009
2010
2011
2012 Est.
Maintenance capital expenditures
14.6
21.6
14.3
18.5
Project capital expenditures
34.5
27.1
33.5
32.4
Total Capital expenditures
49.1
48.7
47.8
50.9
Free cash flow
1st half
2nd half
2012 Est.
Cash flow (used in) provided by operating activities
(22.9)
54.4
31.5
Capital expenditures
(17.6)
(33.3)
(50.9)
Free cash flow
(40.5)
21.1
(19.4)
Cash flow used in investing activities
(17.5)
(31.8)
(49.3)
Cash flow provided by financing activities
27.7
(1.7)
26.0
Fiscal year 2012
Years ended October
31, |