Attached files
| file | filename |
|---|---|
| 8-K - 8-K - ORMAT TECHNOLOGIES, INC. | zk1212240.htm |
Exhibit 99.1

ORMAT Industries Ltd.
OREG 4
Power Plant
Asset Impairment Analysis
November 2012


Table of Contents
|
3
|
||
|
10
|
||
|
14
|
||
|
18
|
||
|
21
|
||
|
24
|
||
|
32
|
||
|
33
|
||
|
34
|
2
Overview
|
1.
|
At the request of ORMAT Industries Ltd. (hereinafter: "Ormat" and / or "the Company"), we have been commissioned perform an asset impairment analysis of the OREG 4 power generation station (hereinafter: "the Station") to be used in the financial statements of the Company and the Company's subsidiaries: Ormat Technologies Inc. (hereinafter "OTI"), Ormat Nevada Inc. (hereinafter "ONI") and OREG 4 inc. (hereinafter "OR4I") as of September 30, 2012. Ormat, OTI, ONI and OR4I hereinafter jointly referred to as "the Companies".
|
|
2
|
This document is intended only for internal use by the Companies and may not be used without our prior written consent, except for its inclusion with Ormat Industries' financial statements as of September 30, 2012.
|
|
3
|
For preparation of this analysis, we relied on information and/or explanations and/or projections and/or representations obtained from the Companies and/or from others on their behalf. Giza-Singer-Even assumes that this information is reliable and does not perform an independent review of this information; moreover, we have not become aware of anything which may indicate that such data may be unreasonable. This data has not been independently reviewed, and therefore this document does not constitute verification of the correctness, completeness and accuracy thereof. An economic analysis should reflect in a reasonable and fair manner the given situation at a given time, based on available information and with reference to underlying assumptions and estimated projections.
|
|
4
|
This document does not constitute nor replace a due diligence process. This document is not intended to determine a valuation for a specific investor and does not constitute advice nor legal opinion.
|
|
5
|
This document does not include an accounting audit with regard to conformity with accounting principles. Giza-Singer-Even is not responsible for the accounting presentation of the Companies' financial statements with regard to data accuracy and integrity and to implications of said accounting presentation, if any.
|
|
6
|
This document includes a description of key methodology highlights and an analysis summary. The description refers to the major substantive procedures we have applied and does not constitute a complete and detailed description of the Companies and their environments.
|
3
|
7
|
If the information and underlying data on which Giza-Singer-Even relied be incomplete, inaccurate or unreliable - the outcome of this document may be different. We reserve the right to update this document in light of any new data not provided to us. For the avoidance of doubt, this document is only valid as of its signing date.
|
|
8
|
This document includes forward-looking information, as defined in the Securities Act, 1968, which was obtained, inter alia, from the Company. In this opinion we referred, inter alia, to estimates, forecasts and assessments provided to us by management of the Companies. Materialization of this information is uncertain. This information is based in part on information available to the Company as of the document date, as well as on various assumptions and expectations concerning both the Companies and multiple external factors, including market conditions in which the Companies operate, potential competitors and general economic conditions. We emphasize that it is uncertain that these conjectures and expectations would materialize, in whole or in part.
|
|
9
|
We hereby confirm that we have no dependence on this work or on the Companies, other than the fact that we received a fee for this document. We also hereby confirm that our fees are not contingent upon the outcome of our work.
|
|
10
|
We hereby confirm that we have no personal interest in the Companies or in their controlling shareholders.
|
|
11
|
It should be noted that Giza-Singer-Even has compiled in recent years the following economic studies with regard to the Station:
|
|
Subject
|
Date
|
Applicable standards
|
Methodology
|
Valuation results (USD in thousands)
|
Key assumptions
|
|
|
WACC
|
Long-term growth rate
|
|||||
|
Impairment review
|
December 31, 2011
|
IFRS
|
DCF
|
Fair value: $6,800
Total undiscounted cash flow before tax: $12,240
|
8%
|
N/A
|
4
In addition, Giza-Singer-Even. from time to time, prepares economic opinions and provides economic and financial consulting services to controlling shareholders of the Companies and/or affiliates thereof and to the Company itself, including impairment review for financial statements of previous years.
|
12
|
Giza-Singer-Even Ltd. and any company directly and/or indirectly controlled there by, and any controlling shareholder, officer and employee thereof, shall not be held not responsible for any damage, loss or expense of any kind, direct and/or indirect incurred by anyone relying on this document in whole or in part. For the avoidance of doubt it is clarified that this document is not to be construed as an offer or recommendation or opinion with regard to the attractiveness of purchasing securities of the Companies.
|
|
13
|
The Companies shall not be eligible to receive from us, whether under contract or by law or otherwise, any amount with respect to any loss of profit, data or goodwill, or for any consequential, incidental, indirect, punitive or special damages in connection with claims arising from services rendered as part of this work or otherwise associated with the services provided by us in this work, whether the likelihood of such loss or damage was or was not anticipated, provided we have not acted with gross negligence and/or maliciously.
|
|
14
|
Furthermore, and without derogating from the foregoing, should we be required to pay any amount to any third party with respect to rendering the services listed in this document, by any legal proceeding or by any other binding proceeding, the Company commits to indemnify us for any such amount payable by us - immediately upon demand, provided we have not acted with gross negligence and/or maliciously.
|
Information Sources
Following are the main information sources used in preparation of this opinion:
|
ü
|
2009-2011 un-audited financial statements of OR4I and trial balance sheet as of September 30, 2012.
|
|
ü
|
Un-audited financial data for the Companies as of September 30, 2012
|
|
ü
|
The Station's 2012 operating budget and annual operating forecast for the Station (through 2029)
|
5
|
ü
|
Background material and market information from publicly-available information on websites, newspaper articles or other public sources.
|
|
ü
|
Data provided to us by the Company at our request, as noted in this document.
|
|
ü
|
Meetings and/or phone calls with the following Company officers:
|
|
|
§
|
Mr. Yossi Tenne, Chief Financial Officer, OTI and ONI
|
|
|
§
|
Mr. Amit Gorka, CFO and Company Comptroller, OTI and ONI
|
|
|
§
|
Mr. Eyal Hen, Director of Finance, Ormat Industries
|
Accounting Standards
At the Company's request, the valuation will be performed according to the following accounting standards:
|
a.
|
IAS 36, Asset Impairment with connection to Ormat's financial statements.
|
The objective of the standard is to specify procedures to be applied by corporations in order to ensure that assets thereof are not stated at amounts in excess of their recoverable amount. An asset is stated at an amount higher than its recoverable amount when its carrying amount exceeds the amount to be received from use or sale of the asset. In such case, the asset is impaired and the standard stipulates that the corporation should recognize an impairment loss. The standard further stipulates when the corporation should reverse an impairment loss, and requires certain disclosures with regard to impaired assets and to investments made in investees other than subsidiaries, which are stated in the financial statements in amounts which significantly exceed their market value or their net selling price.
The standard stipulates that the recoverable amount of an asset should be estimated whenever there are indications of possible impairment of said asset.
The standard requires an asset impairment loss to be recognized whenever the carrying amount of the asset exceeds its recoverable amount. An impairment loss is to be recognized on the income statement for those assets stated at cost, and is to be treated as a reduction of revaluation for those assets stated at the revaluated amount, in accordance with other accounting standards or subject to any statutory provisions.
6
The standard stipulates that the recoverable amount is to be calculated as the net sale price or value in use, whichever is higher:
|
|
(1)
|
The net sale price is the amount which may be received from sale of the asset in a transaction made in good faith between a willing buyer and a willing seller acting in an informed manner, net of any direct incremental realization cost.
|
|
|
(2)
|
The asset's value in use is the present value of the estimated future cash flows expected to arise from continued use of the asset and from its realization at the end of its useful life.
|
In determining the asset's value in use, the standard requires the corporation to use, inter alia:
|
|
(1)
|
Cash flow forecasts based on reasonable, well founded assumptions which:
|
|
|
§
|
Reflect the current state of the asset
|
|
|
§
|
Represent management's best estimate of the economic conditions which would prevail through the remaining useful life of the asset.
|
|
|
(2)
|
A pre-tax discount rate which reflects current market valuations of the time value of money and the asset-specific risk. The discount rate should not reflect any risk for which the future cash flows have already been adjusted.
|
The estimated recoverable amount is to be calculated for each asset separately. If this is not feasible, the standard requires the corporation to determine the recoverable amount of the cash-generating unit to which the asset belongs. A cash generating unit is the smallest identifiable group of assets which generates positive cash flows (inflows), which are essentially independent of inflows from other assets or asset groups.
In this study we referred to the OREG 4 Station as a cash-generating unit in accordance with clarifications from Company management.
|
b.
|
Accounting standard ASC360, US GAAP for evaluation of impairment of tangible assets on financial statements of Ormat subsidiaries - OTI, ONI, OR4I.
|
For purposes of ASC §360, impairment is the condition that exists when the carrying amount of a long-lived asset or asset group exceeds its Fair Value. An impairment loss shall be recognized only if the carrying amount of a long-lived asset (or asset group) is not recoverable and exceeds its Fair Value. ASC §360 defines a two-step testing process, the timing of the steps and the general valuation methods to be used in the testing process.
7
The first step is a Recoverability Test. The Recoverability Test compares the carrying amount of a long-lived asset (or asset group) to the sum of the undiscounted, pre-tax cash flows expected to result from the use and eventual disposition of the asset (or asset group) over the remaining life of the “primary asset” of the group. The primary asset is the principal long-lived tangible asset being depreciated or the intangible asset being amortized that is the most significant component asset from which the asset group derives its cash-flow generating capacity.
If the carrying amount is greater than the sum of the undiscounted, pre-tax cash flows then the second step is required.
Step 2 requires the determination of the Fair Value of the asset. The impairment loss, if any, is measured as the amount by which the carrying value of the asset exceeds its Fair Value. The carrying value of the asset is adjusted for the impairment prior to performing Step 1 of the ASC §350 goodwill impairment test.
ASC §360 requires that Companies test a long-lived asset (or asset group) for recoverability whenever events or changes in circumstances indicate that its carrying amount may not be recoverable. For long-lived assets or assets to be held and used, that asset group is defined by ASC §360 as the lowest level for which identifiable cash flows are largely independent of the cash flows of other groups of assets and liabilities. Goodwill shall be included in an asset group to be tested for impairment if the asset group is or includes a reporting unit.
Details of valuator
Giza-Singer-Even is a leading financial consulting and investment banking firm in Israel. The firm has extensive experience assisting large corporations, with prominent privatization processes and major deals in Israel, accumulated over its twenty-five years in business. Giza-Singer-Even operates in three segments, through independent business divisions: Economic consulting; investment banking and underwriting; analytical research and corporate governance.
8
This study was compiled by a team led by Eyal Szewach, Partner and Head of the Technology sector at Giza-Singer-Even; Eyal holds a B.Sc in Electrical Engineering from the Technion and an MBA from Tel Aviv University.
|
Sincerely yours,
|
|
 |
|
|
________________________
Giza-Singer-Even Ltd.
Date: November 8, 2012
|
9
Description of the Company its Operations
Ormat Technologies, Inc. is the only vertically-integrated company primarily engaged in the geothermal and recovered energy power business. The Company designs, develops, owns and operates geothermal and recovered energy-based power plants around the world. Additionally, the Company designs, manufactures and sells geothermal and recovered energy power units and other power-generating equipment, and provides related services. With more than four decades of experience in geothermal and recovered-energy generation, Ormat products and systems are covered by 75 U.S. patents. Ormat has engineered and built power plants totaling approximately 1300 MW of gross capacity. Ormat's current generating portfolio includes the following geothermal and recovered energy-based power plants: in the United States – Brady Complex, Brawley, Heber Complex, Jersey Valley, Mammoth Complex, Ormesa Complex, Puna, Steamboat Complex, OREG 1, OREG 2, OREG 3 and OREG 4; in Guatemala - Zunil and Amatitlan; in Kenya – Olkaria III; and, in Nicaragua - Momotombo.
Description valuated power generation station - OREG4:
The valuated power generation station is located in Colorado, USA. The Station, in operation since 2009, generates power by using the residual heat technology1 providing it to a local power company (Highline Electric Association) under a long-term contract. To generate power, the Station relies on heat emitted by adjacent gas pipes (belonging to Kinder Morgan Inc.) Consequently, the volume of gas transmitted through the pipes materially impacts the Station's power generation capacity, and directly affects the total power volume sold by the Station to the local power company.
1 See Target Market Overview chapter.
10
Company structure and ownership as of September 25, 2012
The following are shareholders of Ormat Industries:
|
Controlling shareholders
|
Holding stake (%)
|
|
Bronicki Investments
|
22.5%
|
|
Norstar
|
11.16%
|
|
FIMI Foundation
|
22.5%
|
|
Institutional investors
|
6.11%
|
|
Public holdings
|
37.73%
|
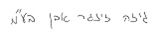
Following is the holding structure of OREG4 power station:
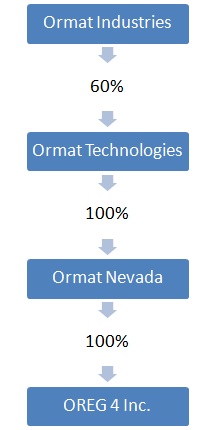
Valuation Methodology
In this study we evaluated the recoverable amount for the OREG 4 power plant for the purpose of impairment analysis. Since the Companies use different accounting rules in compiling their financial statements (IFRS for Ormat Industries and US-GAAP for the other companies), the impairment analysis was carried out as follows:
|
ü
|
IFRS
|
IAS 36 stipulates that the recoverable amount is to be calculated as the net sale price or value in use, whichever is higher:
|
|
·
|
Fair value - the net sale price is the amount which may be received from sale of the asset in a transaction made in good faith between a willing buyer and a willing seller acting in an informed manner, net of any direct incremental realization cost.
|
11
|
|
·
|
Value in use - the asset's value in use is the present value of the estimated future cash flows expected to arise from continued use of the asset and from its realization at the end of its useful life.
|
Due to the fact that in calculating fair value, an assumption was made that any willing buyer of the power generation station would be entitled to accelerated depreciation for this investment, according to US tax statute, we have based the value of the Station on calculation of its fair value, which is, given the tax benefits resulting from the foregoing, higher than its value in use (This is as opposed to OTI, that according to its management, cannot offset O4I's losses from depreciation in the coming years due to its significant amounts of carry forward losses).
|
ü
|
US-GAAP
|
According to this standard, a two-stage process is used to review for impairment:
|
|
·
|
Comparison of non-discounted, pre-tax cash flows to the carrying amount of the asset. If the carrying amount is lower, the second stage is performed.
|
|
|
·
|
Comparison of the fair value of the asset to its carrying amount and recognition of impairment as relevant.
|
Discount Rate (WACC)
The following table lists the major parameters used in estimating the appropriate discount rate for the Station.
|
Parameter
|
Value
|
|
Risk-free interest rate
|
2.5%
|
|
Beta
|
1.23
|
|
Market premium
|
6.04%
|
|
Specific risk premium
|
1.88%
|
|
Company’s cost of equity
|
11.8%
|
|
Cost of debt
|
6.75%
|
|
Tax rate
|
38%
|
|
D/V
|
54%
|
|
WACC (Rounded)
|
8.00%
|
Given the calculations above we used a representative after-tax discount rate of 8% (rounded) for valuation of the power plant.
12
Valuation
|
ü
|
Total un-discounted, pre-tax cash flow: Total un-discounted, pre-tax cash flow of the Station over its expected life amounts to $7,1782
|
|
ü
|
Fair value: The estimated value is the total fair value of the Station, expected to be received in an at-arms-length transaction for sale and purchase of the asset, as follows:
|
|
Estimated value
|
$ in thousands
|
|
Total fair value3 :
|
3,686
|
In calculating the fair value of the Station, we accounted for entitlement of any future buyer to accelerated depreciation upon acquiring the Station, as well as additional fixed depreciation at 3.55% (as provided to us by the Company, in accordance with US tax laws), permitting further amortization of the difference between the recoverable value of the asset and its carrying amount.
We note that, according to the Company, selling costs are negligible, and therefore estimated at zero.
Sensitivity Analysis
Below is a sensitivity analysis of the recoverable value of the Station to changes in the discount rate (WACC):
|
$ in thousands
|
6%
|
7%
|
8%
|
9%
|
10%
|
|
Recoverable amount
|
4,179
|
3,925
|
3,686
|
3,451
|
3,220
|
2 If ARO costs were to be included, the figure would have been $5,743 thousand
3 If ARO costs were to be included, the figure would have been $3,400 thousand
13
Description of the Company and operating segment
Ormat Technologies, Inc. is the only vertically-integrated company primarily engaged in the geothermal and recovered energy power business. The Company designs, develops, owns and operates geothermal and recovered energy-based power plants around the world. Additionally, the Company designs, manufactures and sells geothermal and recovered energy power units and other power-generating equipment, and provides related services. With more than four decades of experience in geothermal and recovered-energy generation, Ormat products and systems are covered by 75 U.S. patents. Ormat has engineered and built power plants totaling approximately 1300 MW of gross capacity. Ormat's current generating portfolio includes the following geothermal and recovered energy-based power plants: in the United States – Brady Complex, Brawley, Heber Complex, Jersey Valley, Mammoth Complex, Ormesa Complex, Puna, Steamboat Complex, OREG 1, OREG 2, OREG 3 and OREG 4; in Guatemala - Zunil and Amatitlan; in Kenya – Olkaria III; and, in Nicaragua - Momotombo.
Description valuated power generation station - OREG4:
The valuated power generation station is located in Colorado, USA. The Station, in operation since 2009, generates power by using the residual heat technology4 providing it to a local power company (Highline Electric Association) under a long-term contract. To generate power, the Station relies on heat emitted by adjacent gas pipes (belonging to Kinder Morgan Inc.) Consequently, the volume of gas transmitted through the pipes materially impacts the Station's power generation capacity, and directly affects the total power volume sold by the Station to the local power company.
4 See the Target Market Overview chapter.
14
Shareholders and Holding Structure
Following are the shareholders of Ormat Industries:
|
Controlling shareholders
|
Holding stake (%)
|
|
Bronicki Investments
|
22.5%
|
|
Norstar
|
11.16%
|
|
FIMI Foundation
|
22.5%
|
|
Institutional investors
|
6.11%
|
|
Public holdings
|
37.73%
|
Following is the holding structure of OREG4 power station:
Customer
Produces and sells electricity under a long-term contract with a local power company. OREG 4, has a long-term contract (through 2029) with a single client - Highline Electric Association, based on payment per MWh generated and actually consumed.
Raw materials and suppliers
|
ü
|
Raw materials - the raw material used to generate power is the heat generated by a compressor station on a gas transmission pipe located adjacent to the Station. This heat is used by the Station for generating power.
|
15
|
ü
|
Suppliers - suppliers of the Station are gas transmission companies, whose transmission infrastructure (which emits heat) is used by the Station in the power generation process.
|
Competition
The company faces competition with different properties:
|
ü
|
Large number of players - the renewable energy market is saturated with power generators and suppliers, competing with the Company's power station operation. However, the Company indicates that Siemens AG is its main competitor in the residual heat power generation segment, as well as other smaller generators in steam-based energy generation.
|
|
ü
|
Competition from legacy technologies - the Company faces competition at the product level from older, legacy technologies such as coal power generation technologies, petroleum technologies etc.
|
In addition, competition in this market is affected by several significant factors:
|
ü
|
Government incentives - market growth potential depends to a large degree on regulatory processes that encourage the purchase of power from 'green' sources, such as incentives for companies purchasing power produced from residual heat, mandatory quotas for energy purchased from renewable energy sources etc.
|
|
ü
|
Pricing of power - bidding for power supply is in the form of tenders published by local power companies, and the winning bidder is the company offering the lowest prices.
|
According to the Company, due to the Company's small share of the residual heat-based power generation market, and the fact that the company has a long-term contract, fluctuations in demand for power from residual energy as well as regulatory changes do not significantly affect results of the valuated Station. Nonetheless the volume of gas transmitted in gas pipes and operational status of these transmission pipes have a direct impact on results of the Station, as the residual heat used by the Station is emitted from gas pipes located nearby.
16
Seasonality
Power consumption is affected by seasonality, due to differences in use of electrical appliances between seasons, affecting power tariffs and consequently, revenues from power generators. Therefore, the supply of gas through the pipe is affected by seasonality (and consequently the Station's generation capacity is affected by seasonality). However, the Company indicates that price levels per MWh are pre-determined by a long-term contract with the local power company and are not affected by seasonality.
Generation Capacity
The Station operates one residual heat unit to generate power, with net generation capacity5 of 3.7 MW. The actual power generated, measured in MWh, directly depends on the volume of gas transmitted in the gas transmission pipes located adjacent to the Station. The Station stores residual heat emitted by the gas compression process in the transmission pipes, and uses it to generate power - i.e. the larger the gas volume transmitted in the pipes - the higher the utilization of the Station's generation capacity.
Below are details of the generation capacity and utilization at the Station, from 2010 to date
|
Generation capacity - OREG 4
|
2010
|
2011
|
Q1-Q3 2012 | |||||||||
|
Generation capacity - MW (maximum)
|
3.7 | 3.7 | 3.7 | |||||||||
|
Generation capacity - MWh
|
32,412 | 32,412 | 24,309 | |||||||||
|
Utilization
|
69 | % | 41 | % | 37 | % | ||||||
|
Total actual generation (MWh)
|
22,364 | 15,072 | 8,925 | |||||||||
|
Annual change (%)
|
n/a | (33 | )% | n/a | ||||||||
The decrease in generation capacity is due to lower volume of natural gas transmitted in the gas transmission pipes used by the Station for residual heat. This was due, according to the Company, to technical issues and fewer contracts to supply gas through the gas transmission pipes, faced by the gas company which owns the pipe (Trailblazer Inc.)
5 The gross generation capacity less power for internal use of the Station.
17
Overview6
Ormat is in the business of geothermal energy and energy generation by use of residual heat. The Company owns power generation stations using geothermal energy and residual heat around the world (USA, Africa, South America etc.) The valuated Station, located in Colorado, USA, generates power by using residual heat emitted by gas compression in transmission pipes located next to the Station. This chapter reviews the Company's market and its evolution, and describes the process of using alternative energy for power generation.
Energy sources produced from residual heat
Residual heat is an energy source produced as a byproduct from industrial processes, and is utilized to produce energy and electricity. An example of use of residual heat is the use by the valuated Station of heat emitted from compression in gas transmission pipes located next to it. The Station stores the emitted heat from the pipes due to compression of gas in the transmission pipes and channels it straight to the Station for generating power.
Residual heat sources have many advantages, as they are considered environmentally friendly and utilize existing energy, without using up non-renewable energy resources.
However, use of residual energy sources may be limited due to the fact that the amount of residual heat emitted is directly dependent on activity in the original heat sources. A decrease in activity of the original heat sources would decrease the volume of heat emitted as a result, and therefore may hinder maximum utilization of the heat source in the energy generation process.
Demand for renewable energy and related regulatory developments in the USA:
Growth of the alternative energy industry in recent years is directly attributable to public environmental concerns, mainly for two reasons - one, concern about air pollution resulting from use of different fuels for generating energy, and the other - using up natural resources such as coal, gas etc. Awareness of the rise in greenhouse gas concentration in the atmosphere, which is a phenomenon primarily caused by burning fuels, increased significantly in recent years in many countries7, including the USA. In view of growing concern, many US states are adopting new regulations that encourage utilities to purchase power generated from 'green' sources, such as electricity generated from renewable sources. The following examples reflect this trend:
|
ü
|
The State of Nevada requires that at least 15% of power generated by utilities in the State is to be generated from renewable energy sources, and this rate is expected to increase to 25% by 2025.
|
|
6
|
Source of market overview: Financial statements of Ormat Industries
|
|
7
|
This is reflected in the Kyoto Protocol, which encompasses laws designed to reduce greenhouse gas emissions, signed by many countries around the world.
|
18
|
ü
|
In the State of Hawaii, local utilities have been instructed to gradually transition to purchasing power from renewable energy sources: 15% by 2015, 20% by 2020 and 40% by 2030.
|
|
ü
|
California passed legislation instructing local utilities to purchase 33% of all power sold to end consumers from renewable energy sources, by 2020.
|
Such legislative changes, as well as tax benefits to power generators from renewable sources, accelerate activity in this market, along with growth in demand for power generated from such sources from customers who choose to switch to 'green' energy (as part of the increased awareness of this issue). Moreover, technology improvements lower the cost of power generation from renewable sources and increase the adoption rate of using renewable energy sources. The following chart shows the development of use of geothermal energy in the USA and around the world (source: GEA)
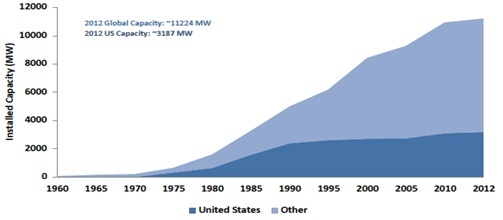
The above data shows that total use of renewable energy rose sharply over the past 40 years.
19
Success and risk factors in operations of the Company and the Station:
Below is an overview of the risks and opportunities that affect success in the operating segment of the valuated Station:
Risks and weaknesses in operating segment:
|
ü
|
High level of knowhow and technical skill - since revenues from power plants operating on residual heat directly depend on functioning of mechanical equipment in these stations, factors such as aging equipment and mechanical failures pose a risk to Station operations and routine function.
|
|
ü
|
Single customer - the Station signed a long term contract with a single client (a local electric company). Any impact to this client's operations would materially impact revenues and operations of the Station.
|
|
ü
|
Dependence on the amount of gas transmitted - due to the fact that the Station relies on the volume of residual heat generated from nearby gas pipes, there is significant dependence on the compressed gas volume transmitted through the pipes, as condition for maximum utilization of generation capacity. A decrease in the volume of gas transmitted in adjacent pipes results in lower utilization of the valuated Station's power generation capacity.
|
Opportunities and strengths:
|
ü
|
Long-term contract - the Company signed a long-term supply contract with a financial robust client, which enhances the certainty of receiving a stable cash flow over the long term.
|
|
ü
|
Regulatory developments that require the purchase of power generated from renewable sources - as set out above, most US states promote legislation to support purchase of power from renewable sources, so as to increase mandatory demand for the product sold by the valuated Station.
|
20
Balance Sheet
Below is a summary of balance sheet data for the Station8:
|
USD in thousands
|
30 Sep 2012
|
31 Dec 2011
|
31 Dec 2010
|
|||||||||
|
Current assets:
|
||||||||||||
|
Other accounts receivable
|
58 | 54 | 107 | |||||||||
|
Pre-paid expenses
|
23 | 15 | 13 | |||||||||
|
Total Current Assets
|
81 | 69 | 120 | |||||||||
|
Non-current assets:
|
||||||||||||
|
Fixed assets, net
|
12,264 | 12,692 | 13,265 | |||||||||
|
Total non-current assets
|
12,264 | 12,692 | 13,265 | |||||||||
|
Total assets
|
12,345 | 12,761 | 13,385 | |||||||||
|
Current liabilities:
|
||||||||||||
|
Accrued expenses
|
226 | 318 | 318 | |||||||||
|
Trade payables
|
6 | 6 | 12 | |||||||||
|
Total current liabilities
|
233 | 324 | 330 | |||||||||
|
Non-current liabilities:
|
||||||||||||
|
Loans from parent company
|
13,169 | 13,012 | 13,127 | |||||||||
|
Site disposal liabilities
|
333 | 313 | 288 | |||||||||
|
Total non-current liabilities
|
13,502 | 13,325 | 13,415 | |||||||||
|
Total liabilities
|
13,735 | 13,649 | 13,745 | |||||||||
|
Assets less liabilities
|
(1,390 | ) | (888 | ) | (360 | ) | ||||||
Note on key items:
|
ü
|
The item "loans from parent company" refers to the total investment made by the parent company in construction of the Station.
|
|
ü
|
The item "Site disposal liabilities" reflects the total outstanding expenditure due to the liability to dispose of the site at the end of the Station's operational life (a process known as ARO - Asset Retirement Obligation).
|
8 Financial data (balance sheet, income statement) are based on un-audited trial balance sheet of OREG4.
21
Income statements
Below are summary data from the Company's income statements:
|
$ in thousands
|
1-9/2012 | 2011 | 2010 | |||||||||
|
Revenues
|
438 | 719 | 1,039 | |||||||||
|
Cost of sales
|
351 | 645 | 635 | |||||||||
|
Gross income
|
87 | 74 | 404 | |||||||||
|
%
|
19.8 | % | 10.3 | % | 38.9 | % | ||||||
|
SG&A expenses
|
20 | 30 | 30 | |||||||||
|
%
|
4.6 | % | 4.2 | % | 2.9 | % | ||||||
|
EBITDA
|
66 | 44 | 374 | |||||||||
|
Operating margin (%)
|
15.2 | % | 6.1 | % | 36.0 | % |
Note on key items:
Sales: sales are affected by multiple parameters, as follows:
|
ü
|
Total generation capacity of the Station: According to the company, the Station's generation capacity is fixed, and stands at 3.7 MW generation capacity.
|
|
ü
|
Capacity utilization: Utilization is determined by two factors: the volume of gas passing through the transmission pipes, which affects the amount of residual heat generated from the gas compression process; and operational performance of the generation equipment at the Station, which usually ranges between 97% -99%. The volume of gas in the transmission pipes is determined by demand for gas by end consumers, and by operational performance of the transmission equipment, such that a drop in demand for natural gas, or damage to the pipes, would result in a decrease in power generated by the Station, and thus a decrease in total revenues.
|
|
ü
|
Price per MWh consumed: The Station has a long-term contract with a local utility. This contract specifies a fixed price for power consumed, which is increased (on nominal basis) annually by 2.7% through 2018, and by 2% from 2019 through the operational life of the Station. Note that consumed power is measured in MWh (Mega-Watt hour).
|
22
Revenues: Total revenues for the Station by various parameters are as follows:
|
Total revenues for Station
|
2010
|
2011
|
1-9/2012 | |||||||||
|
Total generation capacity (MW)
|
3.7 | 3.7 | 3.7 | |||||||||
|
Utilization
|
69 | % | 47 | % | 37 | % | ||||||
|
Total MWh actually sold
|
22,364 | 15,072 | 8,925 | |||||||||
|
Price per MWh sold ($)
|
0.046 | 0.048 | 0.049 | |||||||||
|
Total revenues for Station
|
1,039 | 719 | 438 | |||||||||
|
YoY %
|
n/a | (30.8 | )% | n/a | ||||||||
|
ü
|
In 2011 and 2012, the gas transmission company suffered technical issues with the gas transmission pipe which provides the Station with residual heat. This resulted in a lower volume of gas actually transmitted through the transmission pipe. Moreover, according to the Company, the gas pipe owner has not recently signed any new gas supply contracts, and therefore capacity utilization is low and expected to remain so. For these reasons, there was a decrease in capacity utilization at the Station.
|
Gross income: Below is the annual gross margin (excluding depreciation) from 2010 to date:
|
Cost of sales
|
2010
|
2011
|
1-9/2012 | |||||||||
|
Plant O&M
|
76 | 140 | 120 | |||||||||
|
Utilities
|
58 | 44 | 26 | |||||||||
|
Insurance
|
33 | 34 | 27 | |||||||||
|
Property tax
|
313 | 318 | 210 | |||||||||
|
Royalties
|
112 | 84 | 54 | |||||||||
|
Total expenditure
|
592 | 620 | 351 | |||||||||
|
Gross margin %
|
43 | % | 14 | % | 20 | % | ||||||
|
ü
|
The decrease in gross margin, after 2010, was due to lower sales by the Company - compared with a fairly constant cost of sales.
|
|
ü
|
Royalties are paid to the gas company for use of its transmission pipes. The cost agreed with the gas company is a base price per actually consumed MWh ($4.90 per MWh in 2012), which is increased by 2% annually, according to the contract.
|
General and administrative expenses
|
ü
|
General and administrative expenses of the Company are calculated by attributing HQ costs associated with operations of the various power stations, as follows:
|
|
Expense
|
2010
|
2011
|
1-9/2012 | |||||||||
|
G&A
|
30 | 30 | 20 | |||||||||
|
% of revenues
|
2.8 | % | 4.1 | % | 4.6 | % | ||||||
|
ü
|
The increase in G&A expenses in 2011-2012 was due to the fixed G&A expense component attributed to the Station, compared with lower sales for the year.
|
23
Overview
The recoverable amount for the Station was estimated using the discounted cash flow method (DCF). Discounting of non-leveraged cash flow is the commonly used method in financing theory for valuating a cash-generating asset.
In DCF analysis, the value of a company's operations equals the present value of the free, unleveraged cash flow generated over the specified forecast period, plus the present value of the company at the end of this period (residual value). The basis for evaluation using this method is analysis and estimation of the capacity of the business to generate cash flow and improve profitability in the future. These cash flows are discounted using appropriate, different discount rates which provide a reasonable range of values for the valued operations.
DCF analysis is appropriate and reasonable, so long as the basic assumptions underlying it are correct, relatively accurate and reflect the future with a high probability. Furthermore, the analysis is sensitive to selection of appropriate discount rates, the determination of which is, in itself, not an easy task and somewhat subjective. This means that the analysis, model and results are "good" or "correct" to the same degree that its major underlying assumptions with regard to future developments are "good" or "correct", and the discount rates selected are indeed appropriate.
Accounting standards
In this study we evaluated, as noted, the recoverable amount for the OREG 4 power generation station for the purpose of impairment review. Since the Companies use different accounting rules in compiling their financial statements (IFRS for Ormat Industries and US-GAAP for the other companies), the impairment analysis was carried out as follows:
|
ü
|
IFRS
|
IAS 36 stipulates that the recoverable amount is to be calculated as the net sale price or value in use, whichever is higher:
|
|
·
|
Fair value - the net sale price is the amount which may be received from sale of the asset in a transaction made in good faith between a willing buyer and a willing seller acting in an informed manner, net of any direct incremental realization cost.
|
24
|
|
·
|
Value in use - the asset's value in use is the present value of the estimated future cash flows expected to arise from continued use of the asset and from its realization at the end of its useful life.
|
Due to the fact that in calculating fair value, an assumption was made that any willing buyer of the power generation station would be entitled to accelerated depreciation for this investment, according to US tax statute, we have based the value of the Station on calculation of its fair value, which is, given the tax benefits resulting from the foregoing, higher than its value in use (This is as opposed to OTI, that according to its management, cannot offset O4I's losses from depreciation in the coming years due to its significant amounts of carry forward losses).
|
ü
|
US-GAAP
|
According to this standard, a two-stage process is used to review for impairment:
|
|
·
|
Comparison of non-discounted, pre-tax cash flows to the carrying amount of the asset. If the carrying amount is lower, the second stage is performed.
|
|
|
·
|
Comparison of the fair value of the asset to its carrying amount and recognition of impairment as relevant.
|
|
ü
|
Note regarding ARO cost (Asset Removal Obligation)
|
We did not include the ARO cost in the valuation as we understood from the Company that the ARO cost is not in the scope of this valuation according to the applicable accounting standards. The impact of ARO expenses is summarized in the Appendix.
Evaluation of the non-discounted pre-tax cash flow and fair value:
The following assumptions were used in modeling the Company's cash flow forecast:
25
Revenue forecast:
|
Revenues
|
Expected utilization
|
Price per MWh
|
||
|
Forecast year
|
Value
|
Assumption
|
Value
|
Assumption
|
|
2012
|
37%
|
Based on Company budget and assumptions
|
Nominal annual increase of 2.7% through 2018, and 2% through the Station's operational life.
|
According to the Company, and based on the contract with the local utility.
|
|
2013
|
39%
|
|||
|
2014-2029
|
48%
|
|||
|
ü
|
Company management anticipates a 37% utilization in 2012, 39% in 2013 and 48% thereafter, due to further technical issues of the gas pipe company in operating the transmission pipe and also, as we have been informed by the company, the gas pipe company has not recently signed any gas supply contracts, so utilization is low and expected to remain so.
|
|
ü
|
Projected utilization for the remaining model years, therefore, is based on Company estimates, and reflects the volume of gas transmitted in the transmission pipe in line with anticipated demand for gas. The utilization rate assumed for the remaining model years is 48%.
|
|
ü
|
The price per MWh charged by the Company is based on a contract signed with the local utility, which is increased, on nominal basis, by 2.7% (through 2018) and by 2% (through the Station’s operational life).
|
|
ü
|
Note that the projected generation capacity for the remaining operational life of the Station is unchanged, at an annual rate of 3.7 MW, or 32.4 thousand MWh per year.
|
Projected cost of sales:
|
2012 - 2030
|
Cost of sales
|
|
|
Value
|
Assumption
|
|
|
Plant O&M
|
2% annual increase, nominal
|
Based on long-term inflation rate
|
|
MM
|
||
|
Utilities
|
||
|
Insurance
|
||
|
Property tax
|
4% annual decrease, nominal
|
According to reduction in property value amortization for property tax calculation
|
|
Royalties
|
2% annual increase, nominal
|
Based on the contract signed with the client
|
26
|
ü
|
Payroll expenses, overhead and insurance - assumed long-term increase is linked to inflation, according to data from management and analysis of past results.
|
|
ü
|
Property tax - assumed annual 4% decrease, according to data from management with regard to property tax calculation in the USA based on the property value.
|
|
ü
|
Royalties - determined based on contract with the client and based on the projected volume of power generated.
|
Projected operating expenses:
|
2012 - 2030
|
Operating costs
|
|
|
Value
|
Assumption
|
|
|
G&A
|
2% annual increase, nominal
|
In line with long-term inflation rate in USA
|
|
ü
|
G&A expenses: Assumed inflation-linked increase, according to assumptions made by Company management.
|
Estimated long-term inflation rate in USA:
Since the valuation model for the power station is nominal, and since some Company assumptions are linked to the growth of long-term inflation in the USA, we based our assumptions on a 2% long-term inflation rate in the USA.9
Asset Removal Obligation (ARO)
According to the Company, the asset removal obligation (ARO) for the Station at the end of its operation in 2030, would amount to $1.4 million. This cost represents the cost of returning the land on which the Station is located to its former condition.
We did not include the ARO cost in the valuation as we understood from the Company that the ARO cost is not in the scope of this valuation according to the applicable accounting standards. The impact of ARO expenses is summarized in the Appendix.
|
9
|
Source: Livingston Survey (June 7, 2012), suggesting a long-term rate of U.S. consumer price index inflation of 2.5%, and based on the working assumption that Station operation is consistent with the Wholesale Index, which is lower in value than the consumer price index (about 2%). http://www.phil.frb.org/research-and-data/real-time-center/livingston-survey. As a supplementary test, we reviewed the long-term inflation rate in the USA, which is currently at 2%.
http://www.clevelandfed.org/research/data/inflation_expectations/index.cfm?DCS.nav=Local
|
27
Working capital:
Below is the calculation of the Company's working capital since 2010:
|
Working capital
|
30 Sep 2012
|
31 Dec 2011
|
31 Dec 2010
|
|||||||||
|
Trade receivables
|
58 | 54 | 107 | |||||||||
|
less
|
||||||||||||
|
Trade payables
|
6 | 6 | 12 | |||||||||
|
Working capital
|
52 | 48 | 119 | |||||||||
|
Working capital as % of turnover
|
8.9 | % | 6.7 | % | 11.5 | % | ||||||
|
ü
|
According to the foregoing, we assumed that working capital would stand at 9% of annual sales, based on the average data in the table above.
|
Total un-discounted cash flow:
|
Total un-discounted, pre-tax cash flow of the Station over its expected life is $7,17810
|
Projected tax expenses:
According to the Company, the appropriate tax rate is 38.01%, based on the statutory tax applicable to the Company (this is the weighted statutory tax rate combining the US federal tax and state tax).
Projected investments:
According to management, no capital expenditures are projected over the life of the Station.
Calculation of weighted average cost of capital (WACC):
Following are details regarding the calculation of the appropriate WACC:
|
ü
|
Cost of equity: The following table lists the major parameters we used in valuation of the appropriate cost of equity (Ke) for the Station being valued:
|
|
Parameter
|
Value
|
Note
|
|||||
|
Risk-free nominal interest
|
2.5 | % | 1 | ||||
|
Market premium
|
6.04 | % | 2 | ||||
|
Beta
|
1.23 | 3 | |||||
|
Specific risk premium
|
1.88 | % | 4 | ||||
|
Company’s cost of equity
|
11.8 | % | |||||
10 If ARO costs were to be included, the figure would have been $5,743 thousand
28
Notes to table:
|
|
1.
|
The nominal yield to maturity on US 20-year bonds, representing the remaining duration of the contract 11.
|
|
|
2.
|
Based on data by Damodaran 12.
|
|
|
3.
|
In order to determine the appropriate Beta, we reviewed a group of similar companies. From our review, there no public companies whose operations are identical to those of the Company, hence we have selected companies which are similar in some aspects to the Company, but which differ among themselves – in order to create a mix which would best reflect the Company’s attributes. The following table indicates the major findings of the review process and beta calculation, as highlighted below:
|
|
Company 13
|
Company description
|
Beta (Un-leveraged)
|
D/V |
Beta (leveraged)
|
|||||||||
|
Calpine Corp.
|
Generates and sells geothermal energy and energy produced from gas, in the USA & Canada
|
0.72 | 56 | % | 1.3 | ||||||||
|
Ram Power Corp.
|
Engaged in the acquisition, exploration and development of geothermal power stations in North- and South America
|
0.40 | 76 | % | 1.2 | ||||||||
|
U.S. Geothermal Power
|
Engaged in the acquisition, exploration and development of geothermal power stations in Western USA
|
0.90 | 52 | % | 1.5 | ||||||||
|
Nevada Geothermal Power
|
Engaged in generating power from geothermal sources in Western USA
|
0.03 | 99 | % | 1.7 | ||||||||
|
Alterra power Corp.
|
Engaged in acquisition, development and operation of power stations using geothermal energy sources
|
1.07 | 40 | % | 1.6 | ||||||||
|
Ormat Technologies
|
The company is a subsidiary of Ormat Industries, which generates and sells equipment for generating energy and power from geothermal sources and residual heat
|
0.71 | 52 | % | 1.2 | ||||||||
|
Median
|
--
|
0.71 | 54 | % | -- | ||||||||
|
|
4.
|
The specific risk premium is determined according to Ibbotson data, based on the relative size of the Company's market share.
|
11 Source: Federal Reserve website: http://www.federalreserve.gov/Releases/H15/Current
12 Source: Damodaran data http://pages.stern.nyu.edu/~adamodar
13 Source of Data: Capital IQ.
29
|
ü
|
Cost of debt: The cost of debt is determined based on the financial statements of Ormat Technologies, which consolidate the valued Station, and based on data provided to us by management. The price determined is based on interest paid by Ormat Technologies (which consolidates the Station) for pledged debentures it has issued. Consequently, the Company's cost of debt is 6.75% 14.
|
|
ü
|
Leverage: Based on review of similar companies and on industry attributes, and considering the company's current and anticipated capital structure, we assumed the company's normal leverage rate, over the long term, to be 54%.
|
|
ü
|
Tax: According to the Company, the appropriate tax rate is 38%, based on the statutory tax applicable to the Company (this is the weighted statutory tax rate combining the US federal tax and state tax).
|
Summary - WACC calculation
Below are details of the nominal after-tax WACC calculation:
|
Parameter
|
Value
|
|||
|
Company’s cost of equity
|
11.8 | % | ||
|
Cost of debt
|
6.75 | % | ||
|
Tax rate
|
38.01 | % | ||
|
D/V
|
54 | % | ||
|
WACC (Rounded)
|
8.0 | % | ||
|
ü
|
Given the calculations above, and based on the discount rate used in valuation of other assets owned by the Company, we elected to use a representative after-tax, rounded discount rate of 8% for valuation of the power station.
|
Cash flow period (Q4 2012 - 2030):
The cash flow forecast for Company operations relies inter alia, on the Company's operating results between 2010 - Q3 2012 as well as on estimates and projections received from the Company for the remaining years of operation of the Station (through 2029). According to management, no residual value is expected for the Station upon termination of the contract with the local utility; however, the Company expects ARO costs amounting to $1.4 million, payable in the final year of operation (2029).
|
14
|
Source: According to interest rate determined upon issuance of corporate debt in February 2011.
|
30
Cash flow forecast:
The Company's cash flow forecast is enclosed in appendix I below.
Tax benefit calculation:
According to management, a future acquirer of the Station is entitled to accelerated depreciation (for tax purposes) with respect to acquisition cost of the asset for several years (MACRS) at the following depreciation rates:
|
Year 1
|
Year 2
|
Year 3
|
Year 4
|
Year 5
|
Year 6
|
Year 7
|
Year 8
|
|
14.3%
|
24.5%
|
17.5%
|
12.5%
|
8.9%
|
8.9%
|
8.9%
|
4.5%
|
Moreover, according to the US tax code and according to management, a market participant is entitled to tax benefits in the form of fixed annual depreciation at 3.55%, equal to the difference between the recoverable value of the asset and remaining amount to be depreciated in Ormat's books (USD 4.85M according to the Company).
Therefore, in estimating the fair value, we considered the reduced tax liability for any market participant who would acquire the Station in an at-arms-length sale.
Note that depreciation rates are calculated as percentage of the Station sale price, hence an iterative calculation was made, by which we calculated the total projected depreciation expense for a future buyer of the asset. We also note that, according to the Company, selling costs are negligible, and therefore were valued at zero.
Total estimated fair value
|
According to applicable standards, we estimated the recoverable amount of the Station in accordance with the fair value of the Station (which is the higher of its fair value and value in use) in the amount of $ 3,68615 thousand.
|
15 If ARO costs were to be included, the figure would have been $3,400 thousand
31
Chapter 7 - Summary and Conclusions
Valuation summary
|
·
|
Total un-discounted, pre-tax cash flow of the Station over its expected life amounts to $7,17816.
|
|
·
|
The estimated fair value of the Station is $ 3,68617 thousand.
|
Sensitivity analysis
Below is sensitivity analysis of the recoverable value of the Station to changes in the discount rate (WACC):
|
Discount Rate
|
6%
|
7%
|
8%
|
9%
|
10%
|
|
Recoverable amount ($ in thousands)
|
4,179
|
3,925
|
3,686
|
3,451
|
3,220
|
Comparison to previous valuations
On December 31, 2011 an impairment review of the Station yielded the following results:
|
·
|
Total un-discounted, pre-tax cash flow of the Station over its expected life amounted to $12,240 thousand.
|
|
·
|
The estimated fair value of the Station amounted to $6,800 thousand.
|
The main reason for the discrepancy between values obtained in this study and values obtained previously is new, updated projections obtained from the Company which are significantly lower than projections obtained from the Company for the impairment review dated December 31, 2011. According to the Company, the main reason for the lower projections is that the gas pipe company has not recently signed any gas supply contracts recently and therefore utilization of the Station's generation capacity is low and expected to remain so.
16 If ARO costs were to be included, the figure would have been $5,743 thousand
17 If ARO costs were to be included, the figure would have been $3,400 thousand
32
Appendix I - Cash Flow Forecast
Below is the projected cash flow forecast for the operational life of OREG 4 station:
|
Fair Value ($'000)
|
||||||||||||||||||||||||||||||||||||||||||||||||||||||||||||||||||||||||||||
|
CF Projection
|
10-12 2012 | 2012 | 2013 | 2014 | 2015 | 2016 | 2017 | 2018 | 2019 | 2020 | 2021 | 2022 | 2023 | 2024 | 2025 | 2026 | 2027 | 2028 | 2029 | |||||||||||||||||||||||||||||||||||||||||||||||||||||||||
|
Capacity (MW)
|
3.7 | 3.7 | 3.7 | 3.7 | 3.7 | 3.7 | 3.7 | 3.7 | 3.7 | 3.7 | 3.7 | 3.7 | 3.7 | 3.7 | 3.7 | 3.7 | 3.7 | 3.7 | 3.7 | |||||||||||||||||||||||||||||||||||||||||||||||||||||||||
|
Actual Production (MWh)
|
8,103 | 32,412 | 32,412 | 32,412 | 32,412 | 32,412 | 32,412 | 32,412 | 32,412 | 32,412 | 32,412 | 32,412 | 32,412 | 32,412 | 32,412 | 32,412 | 32,412 | 32,412 | 32,412 | |||||||||||||||||||||||||||||||||||||||||||||||||||||||||
|
Utilization
|
36 | % | 37 | % | 39 | % | 48 | % | 48 | % | 48 | % | 48 | % | 48 | % | 48 | % | 48 | % | 48 | % | 48 | % | 48 | % | 48 | % | 48 | % | 48 | % | 48 | % | 48 | % | 48 | % | ||||||||||||||||||||||||||||||||||||||
|
Price per MWh
|
0.049 | 0.049 | 0.050 | 0.052 | 0.053 | 0.055 | 0.056 | 0.058 | 0.059 | 0.060 | 0.061 | 0.062 | 0.064 | 0.065 | 0.066 | 0.067 | 0.069 | 0.070 | 0.072 | |||||||||||||||||||||||||||||||||||||||||||||||||||||||||
|
Total Revenues
|
144 | 582 | 631 | 799 | 821 | 843 | 866 | 889 | 907 | 925 | 944 | 963 | 982 | 1,002 | 1,022 | 1,042 | 1,063 | 1,084 | 1,106 | |||||||||||||||||||||||||||||||||||||||||||||||||||||||||
|
Cost of Sales
|
117 | 468 | 451 | 514 | 462 | 488 | 458 | 511 | 457 | 486 | 456 | 515 | 458 | 491 | 460 | 525 | 464 | 502 | 469 | |||||||||||||||||||||||||||||||||||||||||||||||||||||||||
|
Gross Margin
|
27 | 114 | 180 | 285 | 359 | 356 | 408 | 378 | 451 | 439 | 487 | 447 | 524 | 510 | 561 | 517 | 599 | 582 | 636 | |||||||||||||||||||||||||||||||||||||||||||||||||||||||||
|
% of revenues
|
19 | % | 20 | % | 29 | % | 36 | % | 44 | % | 42 | % | 47 | % | 43 | % | 50 | % | 47 | % | 52 | % | 46 | % | 53 | % | 51 | % | 55 | % | 50 | % | 56 | % | 54 | % | 58 | % | ||||||||||||||||||||||||||||||||||||||
|
G&A
|
10 | 30 | 31 | 31 | 32 | 32 | 33 | 34 | 34 | 35 | 36 | 37 | 37 | 38 | 39 | 40 | 40 | 41 | 42 | |||||||||||||||||||||||||||||||||||||||||||||||||||||||||
|
EBITDA
|
17 | 84 | 149 | 254 | 328 | 323 | 375 | 344 | 416 | 404 | 452 | 411 | 487 | 472 | 523 | 477 | 558 | 541 | 594 | |||||||||||||||||||||||||||||||||||||||||||||||||||||||||
|
% of revenues
|
12 | % | 14 | % | 24 | % | 32 | % | 40 | % | 38 | % | 43 | % | 39 | % | 46 | % | 44 | % | 48 | % | 43 | % | 50 | % | 47 | % | 51 | % | 46 | % | 53 | % | 50 | % | 54 | % | ||||||||||||||||||||||||||||||||||||||
|
Total Depreciation
|
658 | 1,033 | 775 | 591 | 460 | 460 | 460 | 295 | 124 | 0 | 0 | 0 | 0 | 0 | 0 | 0 | 0 | 0 | ||||||||||||||||||||||||||||||||||||||||||||||||||||||||||
|
Pre-Tax income
|
(640 | ) | (884 | ) | (521 | ) | (264 | ) | (137 | ) | (85 | ) | (116 | ) | 121 | 280 | 452 | 411 | 487 | 472 | 523 | 477 | 558 | 541 | 594 | |||||||||||||||||||||||||||||||||||||||||||||||||||
|
Tax
|
(243 | ) | (336 | ) | (198 | ) | (100 | ) | (52 | ) | (32 | ) | (44 | ) | 46 | 106 | 172 | 156 | 185 | 180 | 199 | 181 | 212 | 206 | 226 | |||||||||||||||||||||||||||||||||||||||||||||||||||
|
Investment in Working Capital
|
1 | 4 | 15 | 2 | 2 | 2 | 2 | 2 | 2 | 2 | 2 | 2 | 2 | 2 | 2 | 2 | 2 | (46 | ) | |||||||||||||||||||||||||||||||||||||||||||||||||||||||||
|
Post Tax Cash Flow
|
260 | 481 | 437 | 426 | 373 | 405 | 386 | 369 | 296 | 278 | 253 | 300 | 291 | 322 | 294 | 344 | 334 | 414 | ||||||||||||||||||||||||||||||||||||||||||||||||||||||||||
|
Discounted Cash Flow
|
257 | 454 | 382 | 345 | 280 | 281 | 248 | 219 | 163 | 142 | 119 | 131 | 118 | 121 | 102 | 111 | 99 | 114 |
33
Appendix II - Calculation of value including ARO
Following is a summary of the main results of this valuation under a scenario where ARO expenses of $1.4M are incurred in 2029.
Cash flow forecast for the operational life of OREG4 station:
|
Fair Value ($'000)
|
||||||||||||||||||||||||||||||||||||||||||||||||||||||||||||||||||||||||||||
|
CF Projection
|
10-12 2012 | 2012 | 2013 | 2014 | 2015 | 2016 | 2017 | 2018 | 2019 | 2020 | 2021 | 2022 | 2023 | 2024 | 2025 | 2026 | 2027 | 2028 | 2029 | |||||||||||||||||||||||||||||||||||||||||||||||||||||||||
|
Capacity (MW)
|
3.7 | 3.7 | 3.7 | 3.7 | 3.7 | 3.7 | 3.7 | 3.7 | 3.7 | 3.7 | 3.7 | 3.7 | 3.7 | 3.7 | 3.7 | 3.7 | 3.7 | 3.7 | 3.7 | |||||||||||||||||||||||||||||||||||||||||||||||||||||||||
|
Actual Production (MWh)
|
8,103 | 32,412 | 32,412 | 32,412 | 32,412 | 32,412 | 32,412 | 32,412 | 32,412 | 32,412 | 32,412 | 32,412 | 32,412 | 32,412 | 32,412 | 32,412 | 32,412 | 32,412 | 32,412 | |||||||||||||||||||||||||||||||||||||||||||||||||||||||||
|
Utilization
|
36 | % | 37 | % | 39 | % | 48 | % | 48 | % | 48 | % | 48 | % | 48 | % | 48 | % | 48 | % | 48 | % | 48 | % | 48 | % | 48 | % | 48 | % | 48 | % | 48 | % | 48 | % | 48 | % | ||||||||||||||||||||||||||||||||||||||
|
Price per MWh
|
0.049 | 0.049 | 0.050 | 0.052 | 0.053 | 0.055 | 0.056 | 0.058 | 0.059 | 0.060 | 0.061 | 0.062 | 0.064 | 0.065 | 0.066 | 0.067 | 0.069 | 0.070 | 0.072 | |||||||||||||||||||||||||||||||||||||||||||||||||||||||||
|
Total Revenues
|
144 | 582 | 631 | 799 | 821 | 843 | 866 | 889 | 907 | 925 | 944 | 963 | 982 | 1,002 | 1,022 | 1,042 | 1,063 | 1,084 | 1,106 | |||||||||||||||||||||||||||||||||||||||||||||||||||||||||
|
Cost of Sales
|
117 | 468 | 451 | 514 | 462 | 488 | 458 | 511 | 457 | 486 | 456 | 515 | 458 | 491 | 460 | 525 | 464 | 502 | 469 | |||||||||||||||||||||||||||||||||||||||||||||||||||||||||
|
Gross Margin
|
27 | 114 | 180 | 285 | 359 | 356 | 408 | 378 | 451 | 439 | 487 | 447 | 524 | 510 | 561 | 517 | 599 | 582 | 636 | |||||||||||||||||||||||||||||||||||||||||||||||||||||||||
|
% of revenues
|
19 | % | 20 | % | 29 | % | 36 | % | 44 | % | 42 | % | 47 | % | 43 | % | 50 | % | 47 | % | 52 | % | 46 | % | 53 | % | 51 | % | 55 | % | 50 | % | 56 | % | 54 | % | 58 | % | ||||||||||||||||||||||||||||||||||||||
|
G&A
|
10 | 30 | 31 | 31 | 32 | 32 | 33 | 34 | 34 | 35 | 36 | 37 | 37 | 38 | 39 | 40 | 40 | 41 | 42 | |||||||||||||||||||||||||||||||||||||||||||||||||||||||||
|
EBITDA
|
17 | 84 | 149 | 254 | 328 | 323 | 375 | 344 | 416 | 404 | 452 | 411 | 487 | 472 | 523 | 477 | 558 | 541 | (789 | ) | ||||||||||||||||||||||||||||||||||||||||||||||||||||||||
|
% of revenues
|
12 | % | 14 | % | 24 | % | 32 | % | 40 | % | 38 | % | 43 | % | 39 | % | 46 | % | 44 | % | 48 | % | 43 | % | 50 | % | 47 | % | 51 | % | 46 | % | 53 | % | 50 | % | -71 | % | ||||||||||||||||||||||||||||||||||||||
|
Total Depreciation
|
607 | 953 | 715 | 545 | 424 | 424 | 424 | 272 | 121 | 121 | 121 | 121 | 8 | 0 | 0 | 0 | 0 | 0 | ||||||||||||||||||||||||||||||||||||||||||||||||||||||||||
|
Pre-Tax income
|
(589 | ) | (804 | ) | (461 | ) | (218 | ) | (101 | ) | (49 | ) | (80 | ) | 144 | 283 | 331 | 290 | 366 | 464 | 523 | 477 | 558 | 541 | (789 | ) | ||||||||||||||||||||||||||||||||||||||||||||||||||
|
Tax
|
(224 | ) | (306 | ) | (175 | ) | (83 | ) | (38 | ) | (19 | ) | (30 | ) | 55 | 108 | 126 | 110 | 139 | 177 | 199 | 181 | 212 | 206 | (300 | ) | ||||||||||||||||||||||||||||||||||||||||||||||||||
|
Investment in Working Capital
|
1 | 4 | 15 | 2 | 2 | 2 | 2 | 2 | 2 | 2 | 2 | 2 | 2 | 2 | 2 | 2 | 2 | (46 | ) | |||||||||||||||||||||||||||||||||||||||||||||||||||||||||
|
Post Tax Cash Flow
|
241 | 451 | 414 | 408 | 360 | 391 | 373 | 360 | 295 | 324 | 299 | 346 | 294 | 322 | 294 | 344 | 334 | (443 | ) | |||||||||||||||||||||||||||||||||||||||||||||||||||||||||
|
Discounted Cash Flow
|
238 | 425 | 362 | 331 | 269 | 271 | 239 | 214 | 162 | 165 | 141 | 151 | 119 | 121 | 102 | 111 | 99 | (122 | ) | |||||||||||||||||||||||||||||||||||||||||||||||||||||||||
Total un-discounted, pre-tax cash flow of the Station over its expected life amounts, if ARO is included: $5,795 thousand.
Fair value if ARO is Included: $3,400 thousand
Sensitivity analysis of the recoverable value of the Station
|
Discount Rate
|
6%
|
7%
|
8%
|
9%
|
10%
|
|
Recoverable amount ($ in thousands)
|
3,826
|
3,612
|
3,400
|
3,188
|
2,977
|
34