Attached files
| file | filename |
|---|---|
| 8-K - 8-K - Brookfield Property REIT Inc. | a12-26747_18k.htm |
Exhibit 99.1
|
|
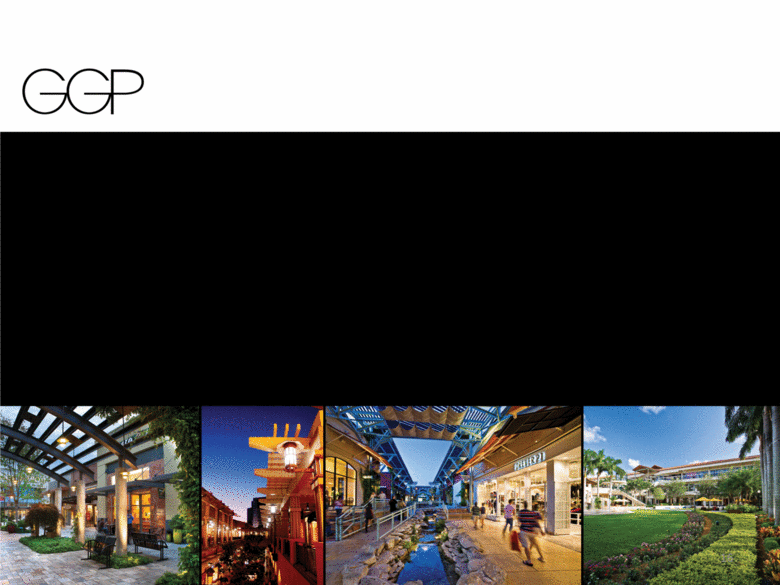
November 2012 |

|
|
Our mission is to own and operate best-in-class malls that provide an outstanding environment and experience for our Communities, Retailers, Employees, Consumers and Shareholders (CRECS). 2 |
|
|
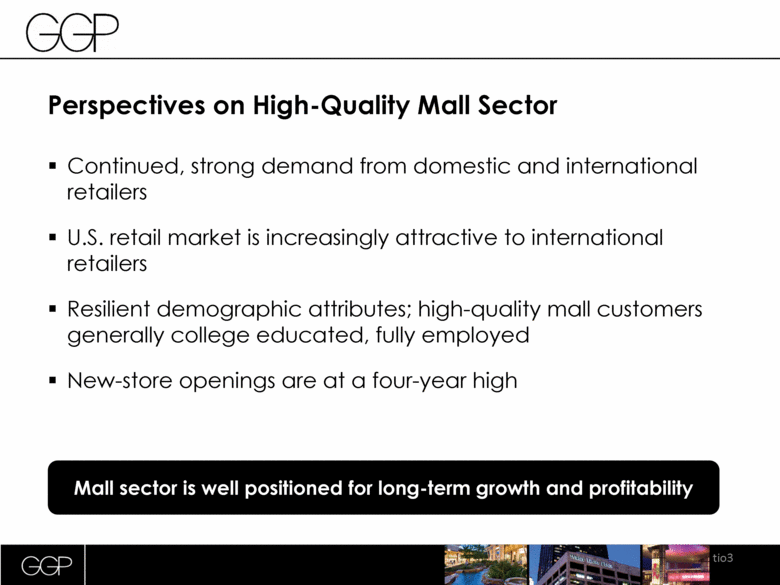
(a) Source: International Council of Shopping Centers (“ICSC”) (b) Green Street Advisors, Inc. tio3 Mall sector is well positioned for long-term growth and profitability Perspectives on High-Quality Mall Sector Continued, strong demand from domestic and international retailers U.S. retail market is increasingly attractive to international retailers Resilient demographic attributes; high-quality mall customers generally college educated, fully employed New-store openings are at a four-year high |
|
|
Leader in High-Quality Regional Malls Geographically diversified throughout the U.S. and amongst retailers 129 regional malls / 55.6 million square feet(a) 95.5% leased / 92.7% occupied(a) $541 tenant sales per square foot(a,b) Portfolio highly concentrated by 69 Class A regional malls(c) Account for ~70% of total net operating income(b,c) Produce over $630 sales per square foot(b,c) 4 (a) Source: GGP Supplemental Information as of September 30, 2012. (b) Tenant sales figures represent comparative rolling 12 month tenant sales for mall stores less than 10,000 square feet. (c) Represents the contribution of GGP’s “Class A” malls to GGP’s Total Company Net Operating Income. Mall classification is based on current quality grades determined by Green Street Advisors. The sales figure represents a trailing 12 months total retail sales for comparable leased spaces within GGP’s Class A malls. |

|
|
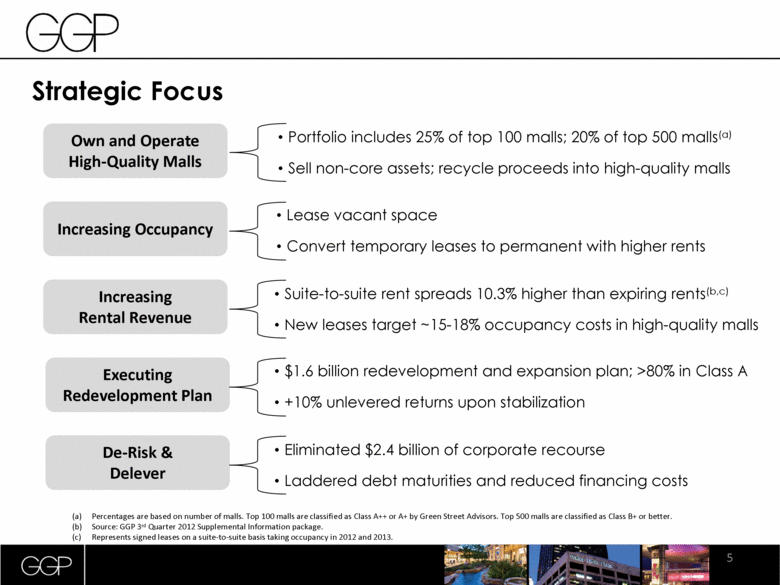
Strategic Focus 5 (a) Percentages are based on number of malls. Top 100 malls are classified as Class A++ or A+ by Green Street Advisors. Top 500 malls are classified as Class B+ or better (b). Source: GGP 3rd Quarter 2012 Supplemental Information package (c). Represents signed leases on a suite-to-suite basis taking occupancy in 2012 and 2013. Own and Operate High-Quality Malls Increasing Occupancy Increasing Rental Revenue Executing Redevelopment Plan De-Risk & Delever Portfolio includes 25% of top 100 malls; 20% of top 500 malls(a) Sell non-core assets; recycle proceeds into high-quality malls Lease vacant space Convert temporary leases to permanent with higher rents Suite-to-suite rent spreads 10.3% higher than expiring rents(b,c) New leases target ~15-18% occupancy costs in high-quality malls $1.6 billion redevelopment and expansion plan; >80% in Class A +10% unlevered returns upon stabilization Eliminated $2.4 billion of corporate recourse Laddered debt maturities and reduced financing costs |
|
|
Increasing Occupancy Over 7.5 million square feet commencing in 2012; ~1.0 million square feet in excess of expirations (a) Source: International Council of Shopping Centers (“ICSC”) (b) Green Street Advisors, Inc. 6 95.5% 96% 97% 97% (a) Figures shown represent management’s current estimate for each figure as of year end. Does not represent average rates. |

|
|
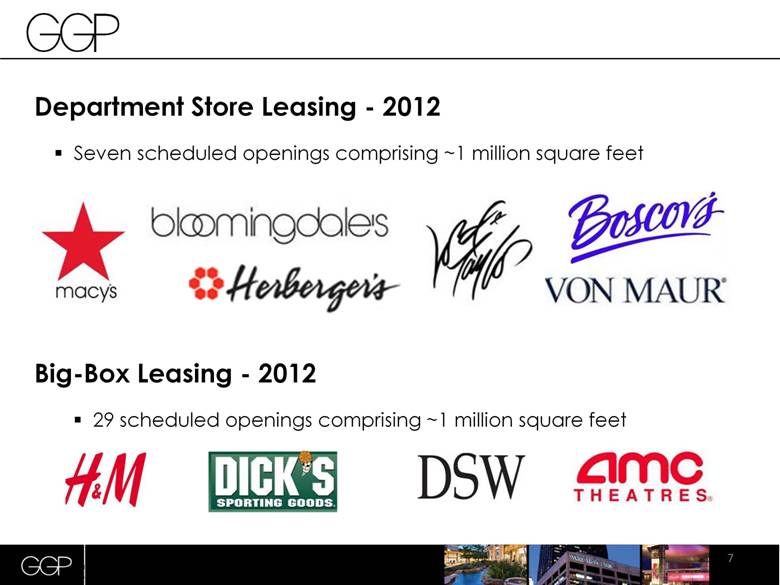
(a) Source: International Council of Shopping Centers (“ICSC”) (b) Green Street Advisors, Inc. 7 Department Store Leasing - 2012 Seven scheduled openings comprising ~1 million square feet Big-Box Leasing - 2012 29 scheduled openings comprising ~1 million square feet |
|
|
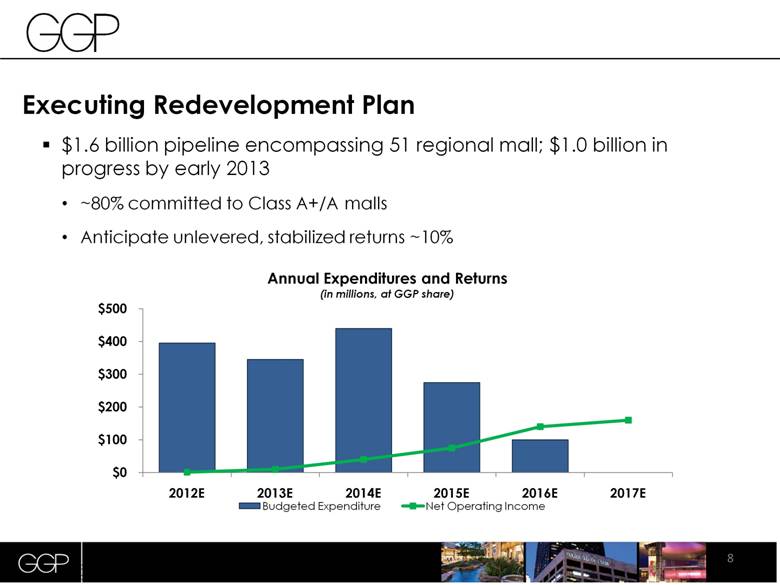
(a) Source: International Council of Shopping Centers (“ICSC”) (b) Green Street Advisors, Inc. 8 Executing Redevelopment Plan $1.6 billion pipeline encompassing 51 regional mall; $1.0 billion in progress by early 2013 ~80% committed to Class A+/A malls Anticipate unlevered, stabilized returns ~10% |
|
|
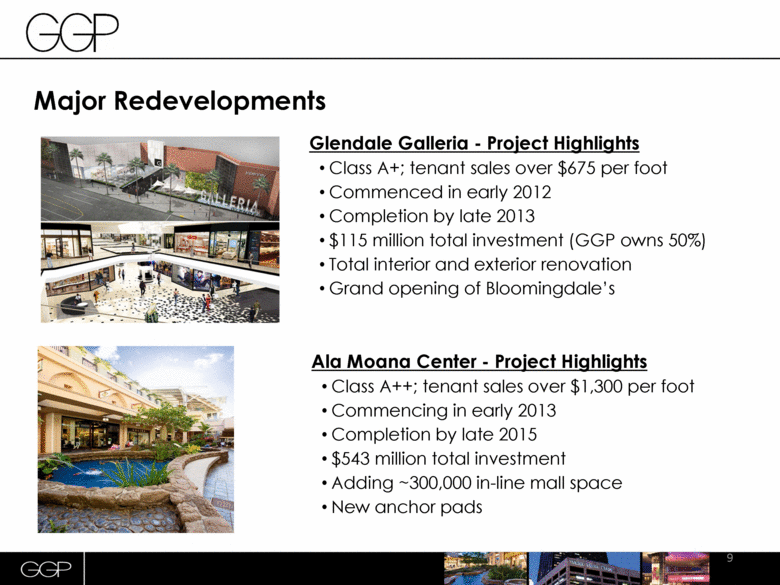
9 Major Redevelopments Glendale Galleria - Project Highlights Class A+; tenant sales over $675 per foot Commenced in early 2012 Completion by late 2013 $115 million total investment (GGP owns 50%) Total interior and exterior renovation Grand opening of Bloomingdale’s Ala Moana Center - Project Highlights Class A++; tenant sales over $1,300 per foot Commencing in early 2013 Completion by late 2015 $543 million total investment Adding ~300,000 in-line mall space New anchor pads |
|
|
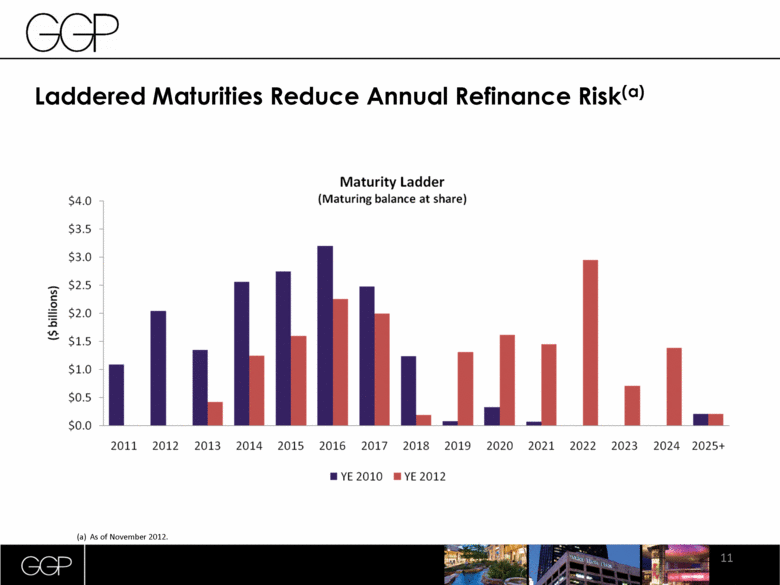
10 Refinancing Activities Reduce Corporate Risk(a) $12.1 billion financed in 2011 and 2012 ($10.2 billion at share) Lowered interest rate from 5.49% to 4.51% Increased term-to-maturity from 2.5 years to 9.6 years Generated ~$2.0 billion of net proceeds Eliminated $2.4 billion of recourse to GGP Repaid $349 million of 7.2% unsecured bonds upon maturity Called for early redemption of $600 million, 6.75% unsecured bonds ~$5.5 billion property-level debt pre-payable at par; interest rates of 4.8% Includes refinancing activities in 2011 and 2012 through November 2012. (a) |
|
|
11 Laddered Maturities Reduce Annual Refinance Risk(a) As of November 2012. (a) |
|
|
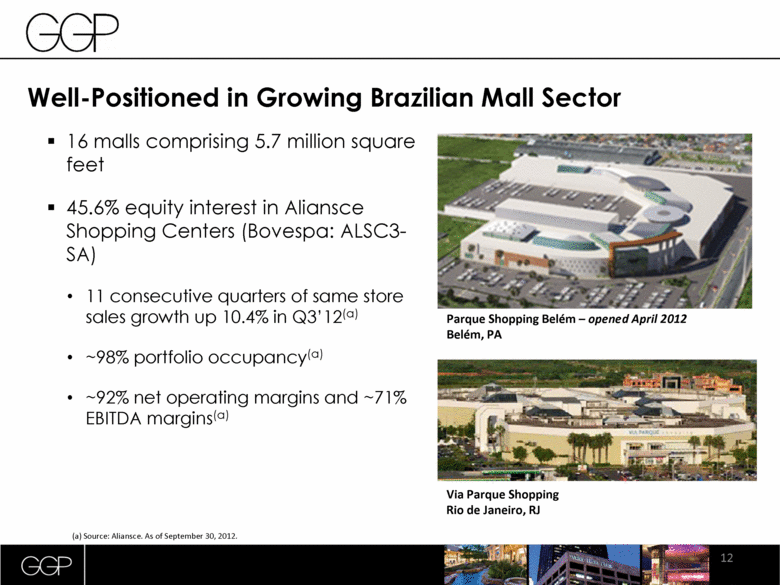
12 Well-Positioned in Growing Brazilian Mall Sector 16 malls comprising 5.7 million square feet 45.6% equity interest in Aliansce Shopping Centers (Bovespa: ALSC3-SA) 11 consecutive quarters of same store sales growth up 10.4% in Q3’12(a) ~98% portfolio occupancy(a) ~92% net operating margins and ~71% EBITDA margins(a) Parque Shopping Belém – opened April 2012 Belém, PA Via Parque Shopping Rio de Janeiro, RJ (a) Source: Aliansce. As of September 30, 2012. |
|
|
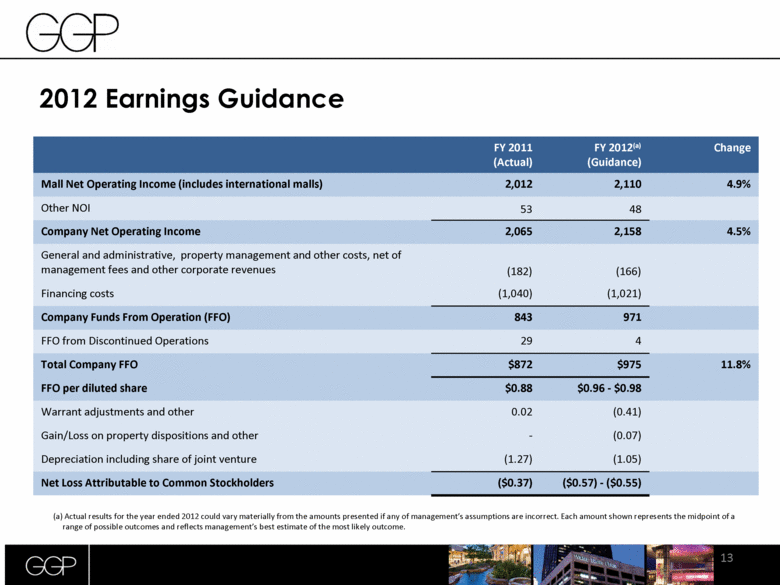
2012 Earnings Guidance 13 FY 2011 (Actual) FY 2012(a) (Guidance) Change Mall Net Operating Income (includes international malls) 2,012 2,110 4.9% Other NOI 53 48 Company Net Operating Income 2,065 2,158 4.5% General and administrative, property management and other costs, net of management fees and other corporate revenues (182) (166) Financing costs (1,040) (1,021) Company Funds From Operation (FFO) 843 971 FFO from Discontinued Operations 29 4 Total Company FFO $872 $975 11.8% FFO per diluted share $0.88 $0.96 - $0.98 Warrant adjustments and other 0.02 (0.41) Gain/Loss on property dispositions and other - (0.07) Depreciation including share of joint venture (1.27) (1.05) Net Loss Attributable to Common Stockholders ($0.37) ($0.57) - ($0.55) (a) Actual results for the year ended 2012 could vary materially from the amounts presented if any of management’s assumptions are incorrect. Each amount shown represents the midpoint of a range of possible outcomes and reflects management’s best estimate of the most likely outcome. |
|
|
FORWARD-LOOKING STATEMENTS AND NON-GAAP MEASURES This presentation contains forward-looking statements. These statements relate to future events or to future financial performance and involve known and unknown risks, uncertainties, and other factors that may cause actual results, levels of activity, or performance to differ from those achievements expressed or implied by these forward-looking statements. The words “possible,” “propose,” “might,” “could,” “would,” “projects,” “plan,” “forecasts,” “anticipates,” “expect,” “intend,” “believe,” “seek,” or “may,” the negative of these terms and other comparable terminology, are intended to identify forward-looking statements, but are not the exclusive means of identifying them. Actual results may differ materially from the results suggested by these forward-looking statements, for a number of reasons, including, but not limited to, our ability to refinance, extend, restructure or repay near and intermediate term debt, our substantial level of indebtedness, our ability to raise capital through equity issuances, asset sales or the incurrence of new debt, retail and credit market conditions, impairments, our liquidity demands and retail and economic conditions. Readers are referred to the documents filed by General Growth Properties, Inc. (GGP) with the Securities and Exchange Commission (SEC), which further identify important risk factors that could cause actual results to differ materially from the forward-looking statements in this presentation. Except as may be required by law, we disclaim any obligation to update any forward-looking statements, whether as a result of new information, future developments or otherwise. This presentation also makes reference to real estate property net operating income (NOI). NOI is defined as income from property operations after operating expenses have been deducted, but prior to deducting financing, administrative and income tax expenses. NOI is presented in this presentation on a proportionate basis, which includes GGP’s share from consolidated and unconsolidated properties. In order to present GGP’s operations in a manner most relevant to its future operations, NOI has been presented to exclude certain non-cash and non-recurring revenue and expenses. A reconciliation of NOI to its most comparable GAAP measure is included in the Supplemental Information for the three months ended September 30, 2012, as furnished with the SEC. NOI is not an alternative to GAAP operating income (loss) or net income (loss) available to common stockholders. 14 |
|
|
Michael Berman Executive Vice President and Chief Financial Officer michael.berman@ggp.com (312) 960-5044 Kevin Berry Vice President of Investor Relations kevin.berry@ggp.com (312) 960-5529 General Growth Properties, Inc. (NYSE: GGP) 110 North Wacker Drive Chicago, IL 60606 www.ggp.com 15 |
|
|
16 |