Attached files
| file | filename |
|---|---|
| 8-K - FORM 8-K - Gramercy Property Trust Inc. | v328241_8k.htm |

Gramercy Capital Corp. Corporate Overview November 2012

GRAMERCY CAPITAL CORP. Gramercy Capital Corp. (NYSE: GKK) 2 Gramercy Capital Corp. is a fully integrated commercial real estate company focused on owning and managing long term net leased office and industrial properties Gramercy Capital Corp. (NYSE: GKK) Total Equity Capitalization: $155 million (Market cap) (November 7, 2012) $112 million (Preferred equity, plus accruals) $267 million GKK REALTY Manage $1.8 billion of commercial real estate nationwide 60 people GKK INVESTMENTS $175 million in unrestricted cash being deployed into acquiring long term, net lease office and industrial real estate properties 10 people GKK FINANCE Manage $1.9 billion of commercial mortgage investments through 3 CDOs 25 people • $400 million of transactions currently under contract and expecting to close in Q4 2012 — Approx. 55% debt — 11 - year average lease term — 129 properties, 5.7 million sq. ft. — 5 tenants, 76% Investment Grade — Portfolio avg. cap rate of 8.8% • Regional offices in: — Jenkintown, PA — Charlotte, NC — St. Louis, MO • In October, Gramercy engaged Wells Fargo to run a process to sell GKK Finance • The management of CDOs requires GKK to consolidate the CDOs on its financial statements which creates very complicated financial statements
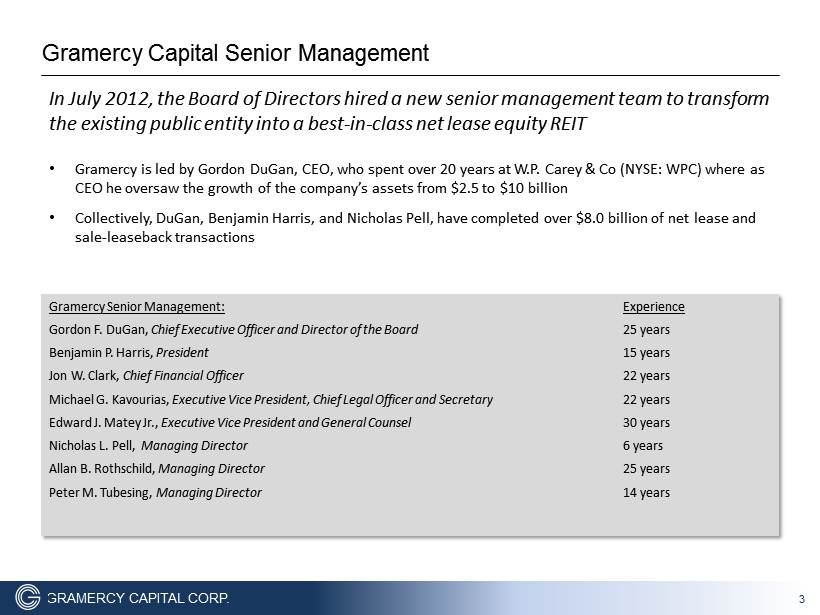
GRAMERCY CAPITAL CORP. In J uly 2012, the Board of Directors hired a new senior management team to transform the existing public entity into a best - in - class net lease equity REIT • Gramercy is led by Gordon DuGan, CEO, who spent over 20 years at W.P. Carey & Co (NYSE: WPC) where as CEO he oversaw the growth of the company’s assets from $2.5 to $10 billion • Collectively, DuGan, Benjamin Harris, and Nicholas Pell, have completed over $8.0 billion of net lease and sale - leaseback transactions Gramercy Capital Senior Management 3 Gramercy Senior Management : Experience Gordon F . DuGan, Chief Executive Officer and Director of the Board 25 years Benjamin P . Harris, President 15 years Jon W . Clark, Chief Financial Officer 22 years Michael G . Kavourias, Executive Vice President, Chief Legal Officer and Secretary 22 years Edward J . Matey Jr . , Executive Vice President and General Counsel 30 years Nicholas L . Pell, Managing Director 6 years Allan B . Rothschild, Managing Director 25 years Peter M . Tubesing, Managing Director 14 years

GRAMERCY CAPITAL CORP. 4 Marc Holiday Mr . Holliday is the Chief Executive Officer and a director of SL Green . Jeffrey E . Kelter Mr . Kelter is a Senior Partner of KTR Capital Partners . He was the former President and Chief Executive Officer and a trustee of Keystone Property Trust, an industrial REIT . William H . Lenehan Former investment professional at Farallon Capital Management, LLC in the real estate group, where he was involved with numerous private equity investments in the real estate sector, including office buildings, residential land, resort communities, mixed - use properties and retail properties . Gregory F . Hughes (Effective 12 / 13 / 12 ) Former Chief Operating Officer of SL Green Realty Corp . from 2007 to 2010 and its Chief Financial Officer from 2004 to 2010 , responsible for finance, capital markets, investor relations and administration . From 2002 to 2003 , prior to joining SL Green, Mr . Hughes was Managing Director and Chief Financial Officer of the private equity real estate group at JP Morgan Partners . From 1999 to 2002 , Mr . Hughes was a Partner and Chief Financial Officer of Fortress Investment Group, an investment and asset management firm . Charles S . Laven Mr . Laven is President of Forsyth Street Advisors LLC, a New York based company specializing in real estate finance and consulting, since July 2003 . Allan J . Baum Former Credit Suisse First Boston Managing Director and head of the structured finance unit for commercial mortgage - backed securities . Gordon F . DuGan Prior to joining Gramercy in July 2012 , Mr . DuGan spent 22 years at W . P . Carey & Co . , where he was promoted to President in 1999 , Co - Chief Executive Officer in 2002 and Chief Executive Officer in 2005 . During his tenure at W . P . Carey, he oversaw the growth of that company’s assets from approximately $ 2 . 5 billion to $ 10 billion . Gramercy Capital Board Of Directors
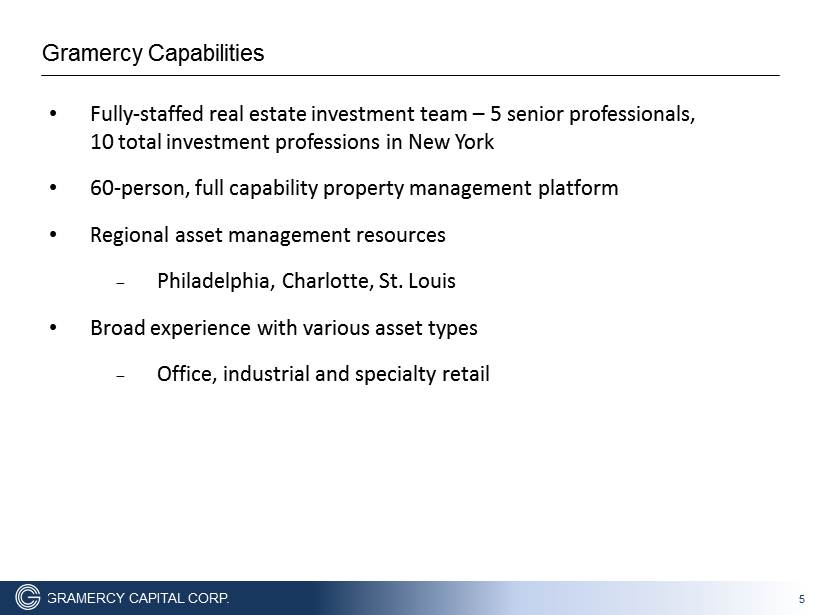
GRAMERCY CAPITAL CORP. • Fully - staffed real estate investment team – 5 senior professionals, 10 total investment professions in New York • 60 - person, full capability property management platform • Regional asset management resources − Philadelphia, Charlotte, St. Louis • Broad experience with various asset types − Office, industrial and specialty retail 5 Gramercy Capabilities
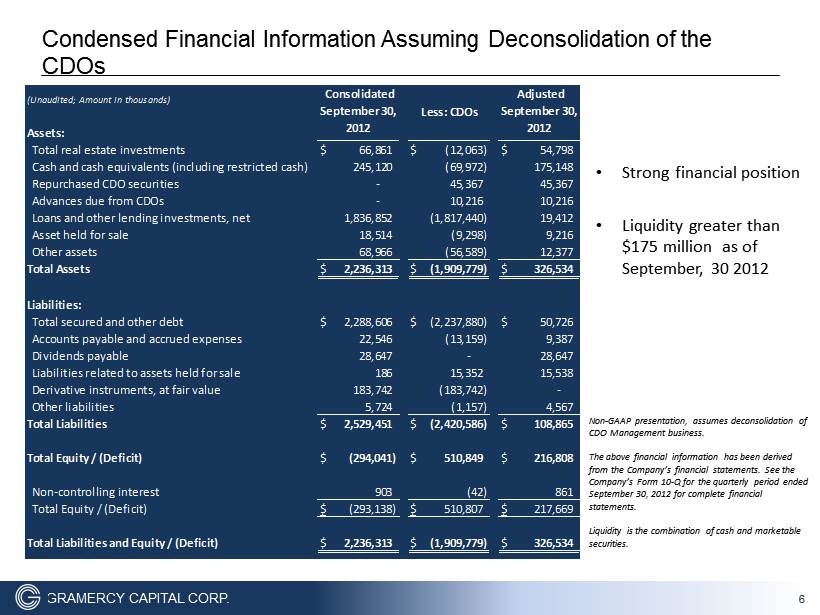
GRAMERCY CAPITAL CORP. • Strong financial position • Liquidity greater than $175 million as of September, 30 2012 Non - GAAP presentation, assumes deconsolidation of CDO Management business. The above financial information has been derived from the Company’s financial statements. See the Company’s Form 10 - Q for the quarterly period ended September 30, 2012 for complete financial statements. Liquidity is the combination of cash and marketable securities. 6 Condensed Financial Information Assuming Deconsolidation of the CDOs Total real estate investments $ 66,861 $ (12,063) $ 54,798 Cash and cash equivalents (including restricted cash) 245,120 (69,972) 175,148 Repurchased CDO securities - 45,367 45,367 Advances due from CDOs - 10,216 10,216 Loans and other lending investments, net 1,836,852 (1,817,440) 19,412 Asset held for sale 18,514 (9,298) 9,216 Other assets 68,966 (56,589) 12,377 Total Assets $ 2,236,313 $ (1,909,779) $ 326,534 Liabilities: Total secured and other debt $ 2,288,606 $ (2,237,880) $ 50,726 Accounts payable and accrued expenses 22,546 (13,159) 9,387 Dividends payable 28,647 - 28,647 Liabilities related to assets held for sale 186 15,352 15,538 Derivative instruments, at fair value 183,742 (183,742) - Other liabilities 5,724 (1,157) 4,567 Total Liabilities $ 2,529,451 $ (2,420,586) $ 108,865 Total Equity / (Deficit) $ (294,041) $ 510,849 $ 216,808 Non-controlling interest 903 (42) 861 Total Equity / (Deficit) $ (293,138) $ 510,807 $ 217,669 Total Liabilities and Equity / (Deficit) $ 2,236,313 $ (1,909,779) $ 326,534 (Unaudited; Amount in thousands) Assets: Consolidated September 30, 2012 Less: CDOs Adjusted September 30, 2012

GRAMERCY CAPITAL CORP. • Top 50 major markets • Primary focus on industrial and office, special retail opportunistically • Average lease term > 10 years • Properties critical to tenant operations • Focus on contract rent versus market rent • Durable credits – companies that are relevant to current/future business environment 7 Investment Focus
GRAMERCY CAPITAL CORP. • Leverage of 50% • Primarily fixed - rate, non - recourse debt • Expected current borrowing rates 3.0% - 4.75% • Potential for bank facility for working capital, transitional properties, etc. • Stagger maturities 8 Financial Strategy – Prudent Use of Leverage
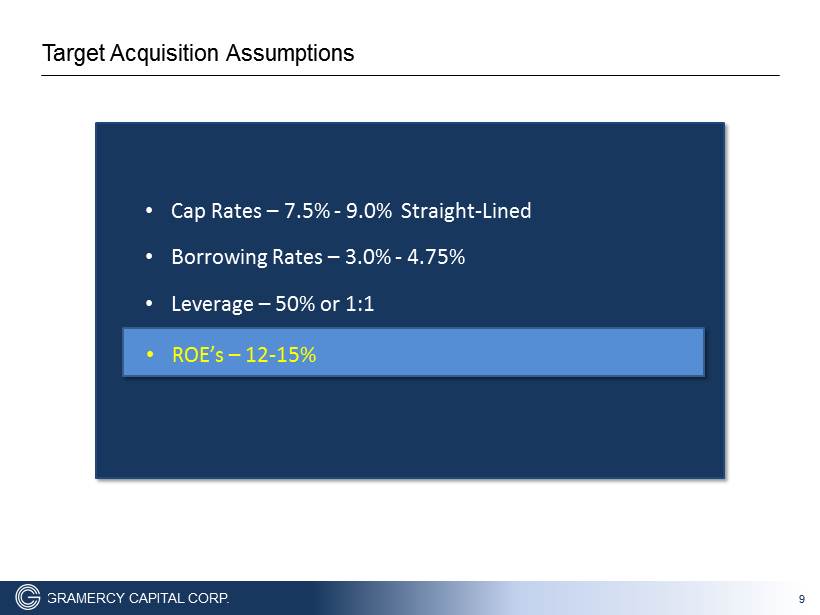
GRAMERCY CAPITAL CORP. 9 Target Acquisition Assumptions • Cap Rates – 7.5% - 9.0% Straight - Lined • Borrowing Rates – 3.0% - 4.75% • Leverage – 50% or 1:1 • a • ROE’s – 12 - 15%
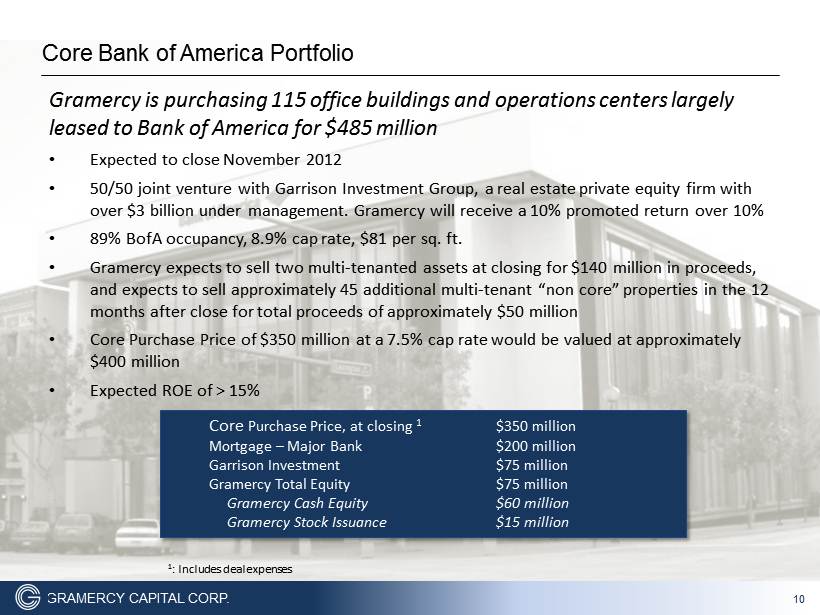
GRAMERCY CAPITAL CORP. • Expected to close November 2012 • 50/50 joint venture with Garrison Investment Group, a real estate private equity firm with over $3 billion under management. Gramercy will receive a 10% promoted return over 10% • 89 % BofA occupancy, 8.9% cap rate, $81 per sq. ft. • Gramercy expects to sell two multi - tenanted assets at closing for $140 million in proceeds, and expects to sell approximately 45 additional multi - tenant “non core” properties in the 12 months after close for total proceeds of approximately $50 million • Core Purchase Price of $350 million at a 7.5% cap rate would be valued at approximately $400 million • Expected ROE of > 15% 10 Gramercy is purchasing 115 office buildings and operations centers largely leased to Bank of America for $485 million Core Purchase Price, at closing 1 $ 350 million Mortgage – Major Bank $ 200 million Garrison Investment $ 75 million Gramercy Total Equity $ 75 million Gramercy Cash Equity $ 60 million Gramercy Stock Issuance $ 15 million Core Bank of America Portfolio 1 : Includes deal expenses

GRAMERCY CAPITAL CORP. • $27.1 million purchase price / $50 per sq. ft. • 540,000 sq. ft. • Three tenants: − Nestle Waters, a subsidiary of Nestle, S.A (S&P:AA) (50%) − Stanley Security Systems, a subsidiary of Black & Decker (S&P:A) (34%) − Privately held medical supply company (16%) • 10.2 - year average lease term • Cap rate of 8.36% (GAAP basis) • 50% leverage • Expected ROE > 13% 11 Gramercy has a contract to purchase two Class A industrial buildings in Indianapolis leased to three tenants for an average weighted lease term of 10+ years Crossroads Indianapolis Industrial
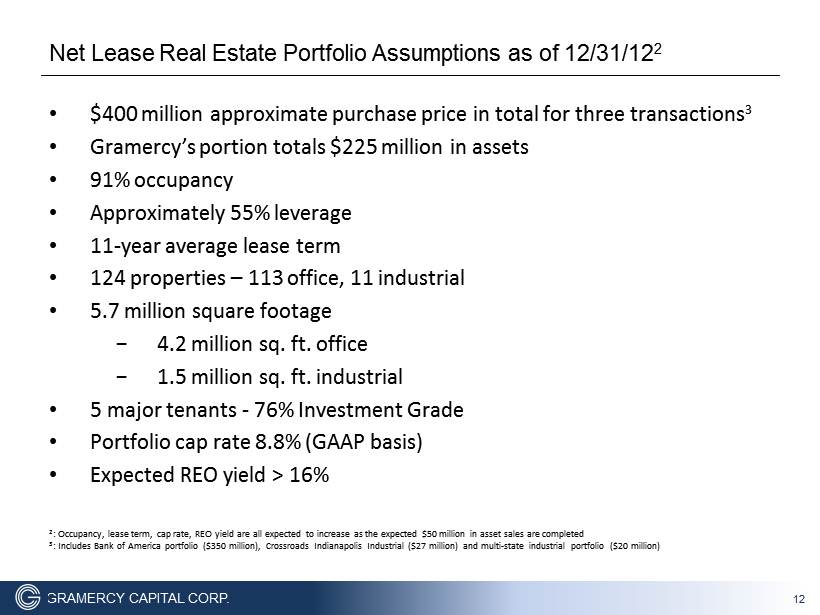
GRAMERCY CAPITAL CORP. • $ 400 million approximate purchase price in total for three transactions 3 • Gramercy’s portion totals $225 million in assets • 91% occupancy • Approximately 55% leverage • 11 - year average lease term • 124 properties – 113 office, 11 industrial • 5.7 million square footage − 4.2 million sq. ft. office − 1.5 million sq. ft. industrial • 5 major tenants - 76% Investment Grade • Portfolio cap rate 8.8 % (GAAP basis) • Expected REO yield > 16 % 12 Net Lease Real Estate Portfolio Assumptions as of 12/31/12 2 2 : Occupancy, lease term, cap rate, REO yield are all expected to increase as the expected $50 million in asset sales are comple ted 3 : Includes Bank of America portfolio ($350 million), Crossroads Indianapolis Industrial ($27 million) and multi - state industrial portfolio ($20 million)

GRAMERCY CAPITAL CORP. • No public REIT has emerged as a leader in the office and industrial net lease segment • Retail net lease overserved − Realty Income − National Retail Properties, Inc. − Cole Real Estate Investments − American Realty Capital • Office and industrial focus provides Gramercy with a larger market opportunity than retail 13 Focus on Underserved Segment of Net Lease Industry
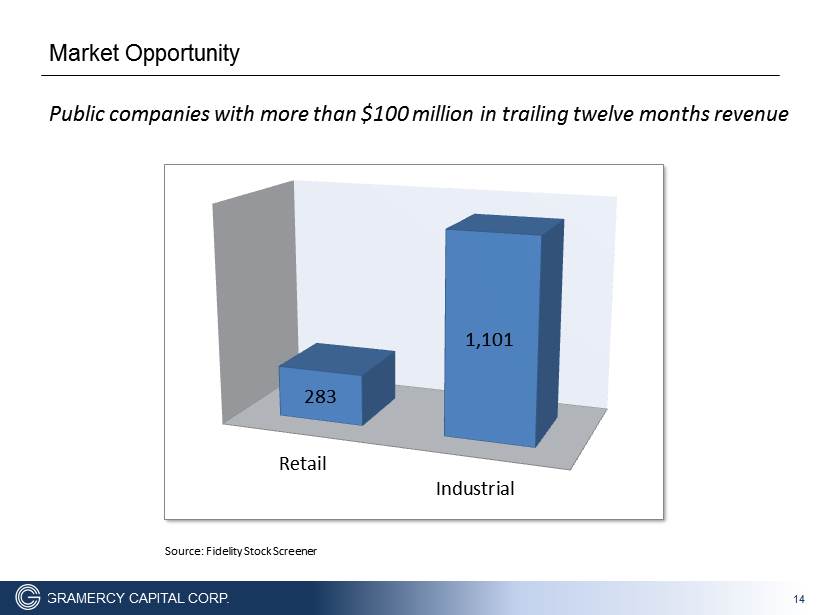
GRAMERCY CAPITAL CORP. Public companies with more than $100 million in trailing twelve months revenue 14 Market Opportunity Retail Industrial 283 1,101 Source: Fidelity Stock Screener
GRAMERCY CAPITAL CORP. 15 Gramercy Capital Corp. • Experienced management • Focus on underserved segment of net lease − Industrial and office • Conservative capital structure • High targeted current and overall returns
GRAMERCY CAPITAL CORP. Forward - Looking Information This investor presentation contains forward - looking information based upon the Company’s current best judgment and expectations. Actual results could vary from those presented herein. The risks and uncertainties associated with forward - looking information in this investor presentation include, but are not limited to, factors that are beyond the Company's control, including: the success or failure of our efforts to implement our current business strategy; the adequacy of our cash reserves, working capital and other forms of liquidity; availability of investment opportunities on real estate assets and real estate - related and other securities; the availability, terms and deployment of short - term and long - term capital; the cost and availability of our financings, which depends in part on our asset quality, the nature of our relationships with our lenders and other capital providers, our business prospects and outlook and general market conditions; the continuity of the Management Agreement for the KBS Portfolio; the timing of cash flows, if any, from our investments; availability of, and ability to retain, qualified personnel and directors; the performance and financial condition of borrowers, tenants, and corporate customers; economic conditions generally and in the real estate markets and commercial finance and the banking industry specifically; unanticipated increases in financing and other costs, including a rise in interest rates; risks of real estate acquisitions; our ability to identify and complete additional property acquisitions; changes to our management and board of directors; reduction in cash flows received from our investments, in particular our CDOs; our ability to maintain our current relationships with financial institutions and to establish new relationships with additional financial institutions; our ability to profitably dispose of non - core assets; legislative and regulatory changes (including changes to laws governing the taxation of REITs or the exemptions from registration as an investment company); our ability to satisfy complex rules in order for us to qualify as a REIT, for U.S. federal income tax purposes and qualify for our exemption under the Investment Company Act, our Operating Partnership’s ability to satisfy the rules in order for it to qualify as a partnership for U.S. federal income tax purposes; and the ability of certain of our subsidiaries to qualify as REITs and certain of our subsidiaries to qualify as TRSs for U.S. federal income tax purposes, and our ability and the ability of our subsidiaries to operate effectively within the limitations imposed by these rules; and other factors including those listed in the Company’s Annual Report on Form 10 - K and in the Company’s Quarterly Reports on Form 10 - Q. For further information, please refer to the Company’s filings with the Securities and Exchange Commission. While forward - looking statements reflect the Company's good faith beliefs, assumptions and expectations, they are not guarantees of future performance. Furthermore, the Company disclaims any obligation to publicly update or revise any forward - looking statement to reflect changes in underlying assumptions or factors, new information, data or methods, future events or other changes. This presentation contains statistics and other data that has been obtained from or compiled from information made available by third - party service providers. T he Company has not independently verified such statistics or data. This information is provided for informational purposes only and is not intended to be indicative of future results. ROE Disclaimer Return on Equity (ROE) is defined as the amount of net income returned as a percentage of shareholders equity and is used to measures a corporation's profitability by revealing how much profit a company generates with the money shareholders have invested. The ROE assumption included on this slide reflects the Company's assumptions and expectations which are not guarantees of its future performance. The Company's actual return on equity may vary materially from the assumptions presented on this slide. The results that an investor in the Company will actually receive will depend, to a significant degree, on the actual performance of the Company's assets, which may be impacted by material economic and market risk factors. 16 Forward - Looking Information / ROE Disclaimer