Attached files
| file | filename |
|---|---|
| 8-K - 8-K - FIRST NIAGARA FINANCIAL GROUP INC | a8-k111312baml.htm |
bamlfinaldeck
First Niagara Financial Group John R. Koelmel President & Chief Executive Officer Gregory W. Norwood Chief Financial Officer Bank of America Merrill Lynch 2012 Banking and Financial Services Conference November 13, 2012
Safe Harbor Statement Any statements contained in this presentation regarding the outlook for FNFG’s business and markets, such as projections of future earnings performance, statements of FNFG’s plans and objectives, forecasts or market trends and other matters, are forward-looking statements based on FNFG’s assumptions and beliefs. Such statements may be identified by such words or phrases as “will likely result,” “are expected to,” “will continue,” “outlook,” “will benefit,” “is anticipated,” “estimate,” “project,” “management believes” or similar expressions. These forward-looking statements are subject to certain risks and uncertainties that could cause actual results to differ materially from those discussed in such statements and no assurance can be given that the results in any forward-looking statement will be achieved. For these statements, FNFG claims the protection of the safe harbor for forward-looking statements contained in the Private Securities Litigation Reform Act of 1995. Any forward-looking statement speaks only as of the date on which it is made, and we disclaim any obligation to subsequently revise any forward-looking statement to reflect events or circumstances after such date or to reflect the occurrence of anticipated or unanticipated events. Certain factors could cause FNFG’s future results to differ materially from those expressed or implied in any forward-looking statements contained in this presentation. These factors include the factors discussed in Part I, Item 1A of FNFG’s 2011 Annual Report on Form 10-K under the heading “Risk Factors” and any other cautionary statements, written or oral, which may be made or referred to in connection with any such forward-looking statements. Since it is not possible to foresee all such factors, these factors should not be considered as complete or exhaustive. 2

Where We Are Today? 3
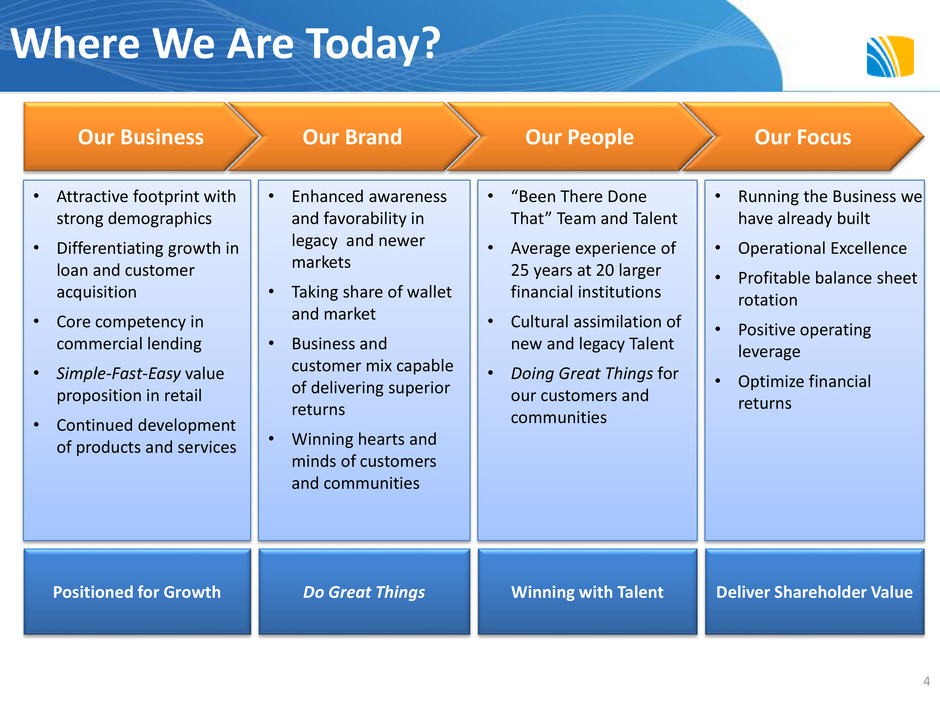
Our Brand Our Focus Our Business Where We Are Today? Our People 4 • Attractive footprint with strong demographics • Differentiating growth in loan and customer acquisition • Core competency in commercial lending • Simple-Fast-Easy value proposition in retail • Continued development of products and services • “Been There Done That” Team and Talent • Average experience of 25 years at 20 larger financial institutions • Cultural assimilation of new and legacy Talent • Doing Great Things for our customers and communities • Enhanced awareness and favorability in legacy and newer markets • Taking share of wallet and market • Business and customer mix capable of delivering superior returns • Winning hearts and minds of customers and communities • Running the Business we have already built • Operational Excellence • Profitable balance sheet rotation • Positive operating leverage • Optimize financial returns Do Great Things Winning with Talent Deliver Shareholder Value Positioned for Growth
Keys To Winning 5
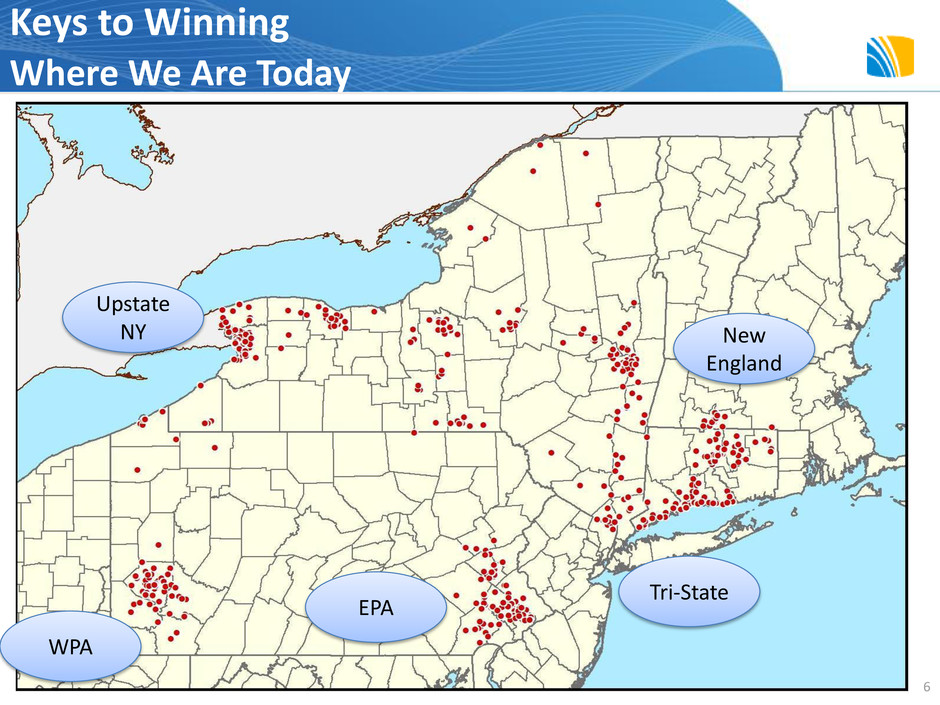
Keys to Winning Where We Are Today 6 WPA Upstate NY New England Tri-State EPA
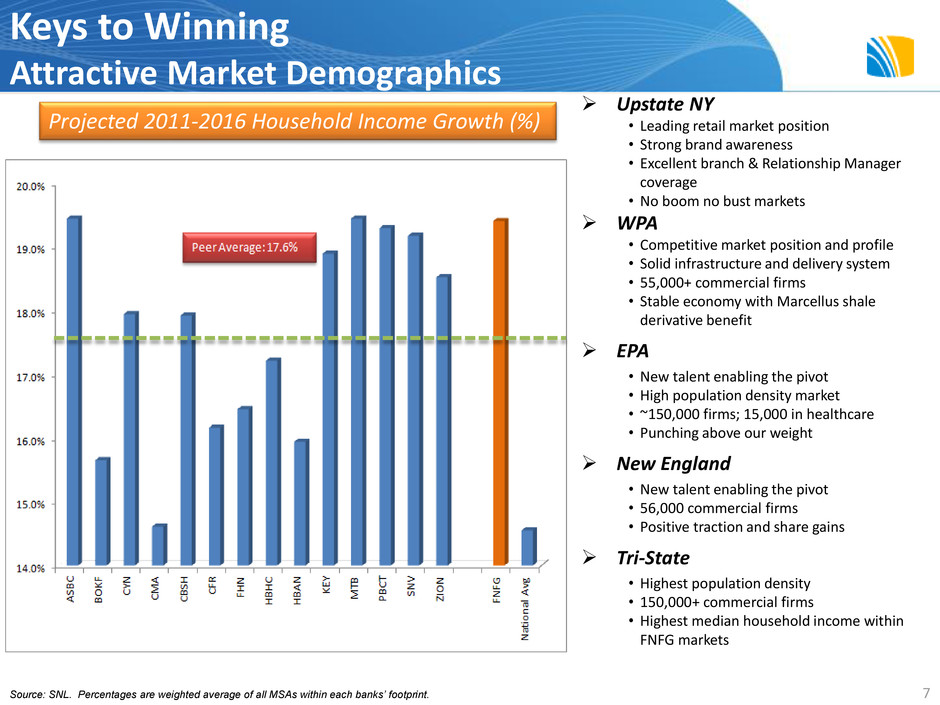
Keys to Winning Attractive Market Demographics Upstate NY • Leading retail market position • Strong brand awareness • Excellent branch & Relationship Manager coverage • No boom no bust markets WPA • Competitive market position and profile • Solid infrastructure and delivery system • 55,000+ commercial firms • Stable economy with Marcellus shale derivative benefit EPA • New talent enabling the pivot • High population density market • ~150,000 firms; 15,000 in healthcare • Punching above our weight New England • New talent enabling the pivot • 56,000 commercial firms • Positive traction and share gains Tri-State • Highest population density • 150,000+ commercial firms • Highest median household income within FNFG markets 7 Projected 2011-2016 Household Income Growth (%) Source: SNL. Percentages are weighted average of all MSAs within each banks’ footprint.
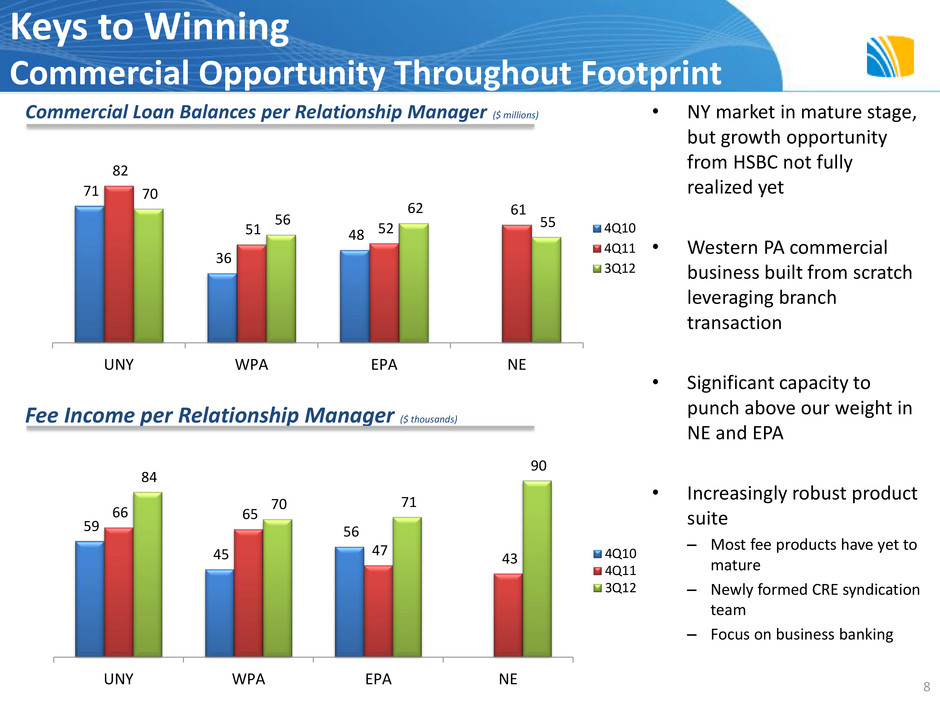
Keys to Winning Commercial Opportunity Throughout Footprint 8 Commercial Loan Balances per Relationship Manager ($ millions) 71 36 48 82 51 52 61 70 56 62 55 UNY WPA EPA NE 4Q10 4Q11 3Q12 59 45 56 66 65 47 43 84 70 71 90 UNY WPA EPA NE 4Q10 4Q11 3Q12 Fee Income per Relationship Manager ($ thousands) • NY market in mature stage, but growth opportunity from HSBC not fully realized yet • Western PA commercial business built from scratch leveraging branch transaction • Significant capacity to punch above our weight in NE and EPA • Increasingly robust product suite – Most fee products have yet to mature – Newly formed CRE syndication team – Focus on business banking
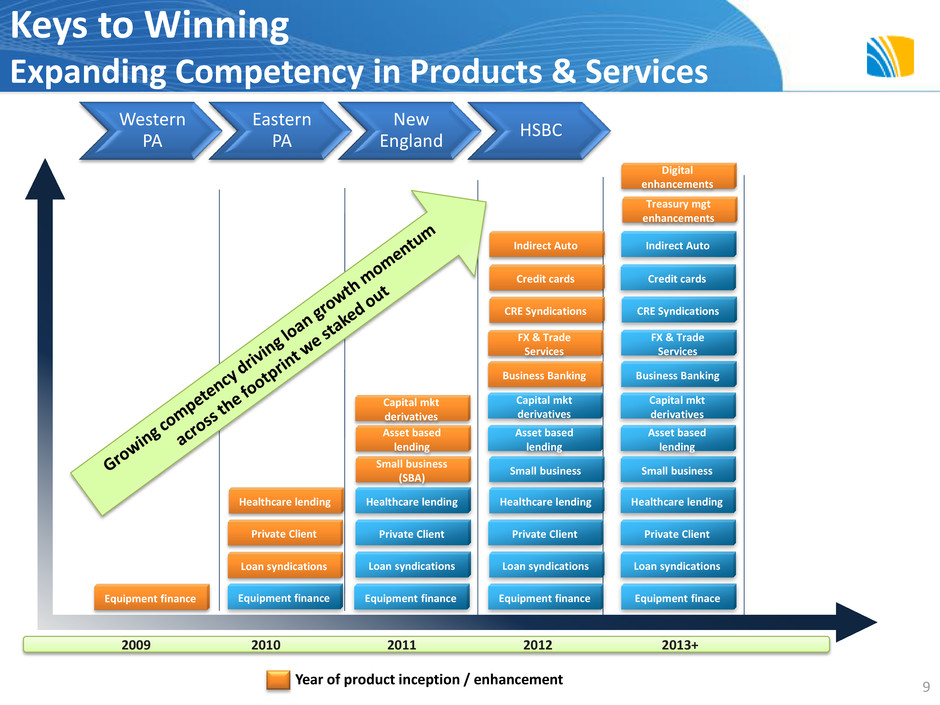
Western PA Eastern PA New England HSBC 2013+ 2012 2011 2010 2009 Equipment finace Loan syndications Private Client Healthcare lending Small business Asset based lending CRE Syndications Credit cards Indirect Auto Equipment finance Loan syndications Private Client Healthcare lending Small business CRE Syndications Credit cards Indirect Auto Equipment finance Loan syndications Private Client Healthcare lending Small business (SBA) Asset based lending Equipment finance Loan syndications Private Client Equipment finance Healthcare lending Asset based lending Keys to Winning Expanding Competency in Products & Services 9 Treasury mgt enhancements Digital enhancements Capital mkt derivatives Capital mkt derivatives Capital mkt derivatives FX & Trade Services FX & Trade Services Business Banking Business Banking Year of product inception / enhancement
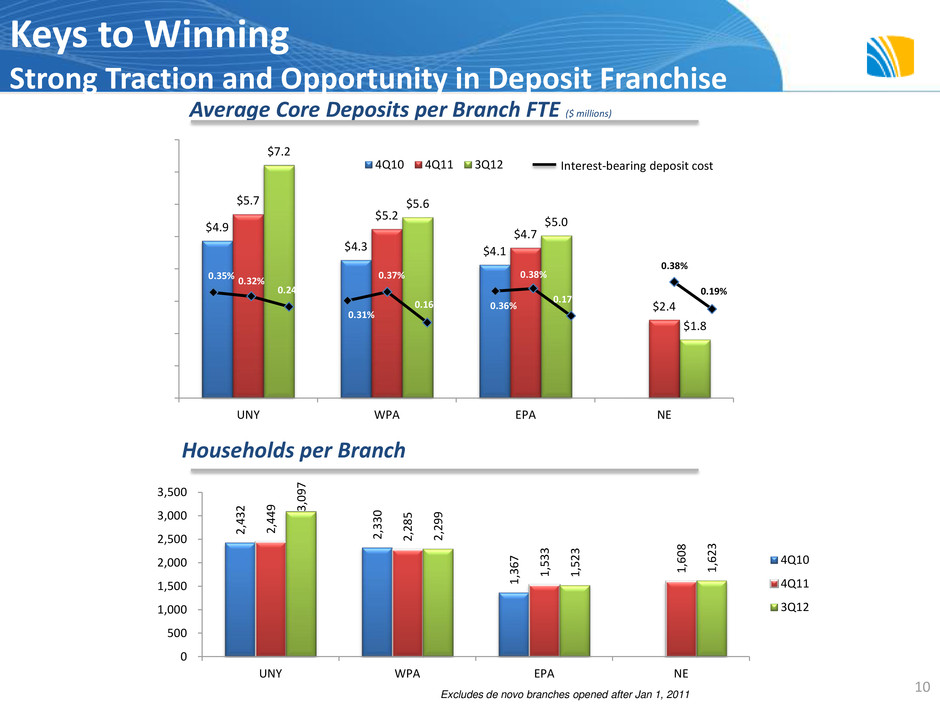
$4.9 $4.3 $4.1 $5.7 $5.2 $4.7 $2.4 $7.2 $5.6 $5.0 $1.8 UNY WPA EPA NE 4Q10 4Q11 3Q12 Keys to Winning Strong Traction and Opportunity in Deposit Franchise 10 Average Core Deposits per Branch FTE ($ millions) Households per Branch 0.31% 0.37% 0.16% 0.35% 0.32% 0.24% 0.36% 0.38% 0.17% 0.38% 0.19% Interest-bearing deposit cost Excludes de novo branches opened after Jan 1, 2011 2,432 2,330 1,367 2,449 2,285 1,533 1,608 3,097 2,299 1,523 1,623 0 500 1,000 1,500 2,000 2,500 3,000 3,500 UNY WPA EPA NE 4Q10 4Q11 3Q12
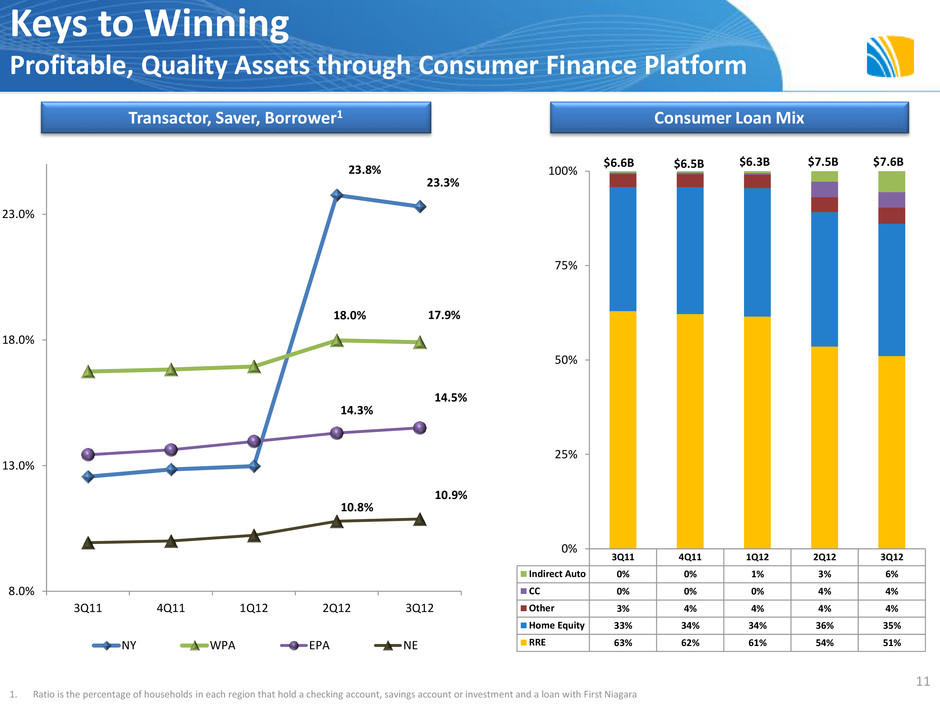
3Q11 4Q11 1Q12 2Q12 3Q12 Indirect Auto 0% 0% 1% 3% 6% CC 0% 0% 0% 4% 4% Other 3% 4% 4% 4% 4% Home Equity 33% 34% 34% 36% 35% RRE 63% 62% 61% 54% 51% 0% 25% 50% 75% 100% Keys to Winning Profitable, Quality Assets through Consumer Finance Platform $7.6B $6.6B $6.5B $6.3B $7.5B 11 Transactor, Saver, Borrower1 1. Ratio is the percentage of households in each region that hold a checking account, savings account or investment and a loan with First Niagara Consumer Loan Mix 23.8% 23.3% 18.0% 17.9% 14.3% 14.5% 10.8% 10.9% 8.0% 13.0% 18.0% 23.0% 3Q11 4Q11 1Q12 2Q12 3Q12 NY WPA EPA NE
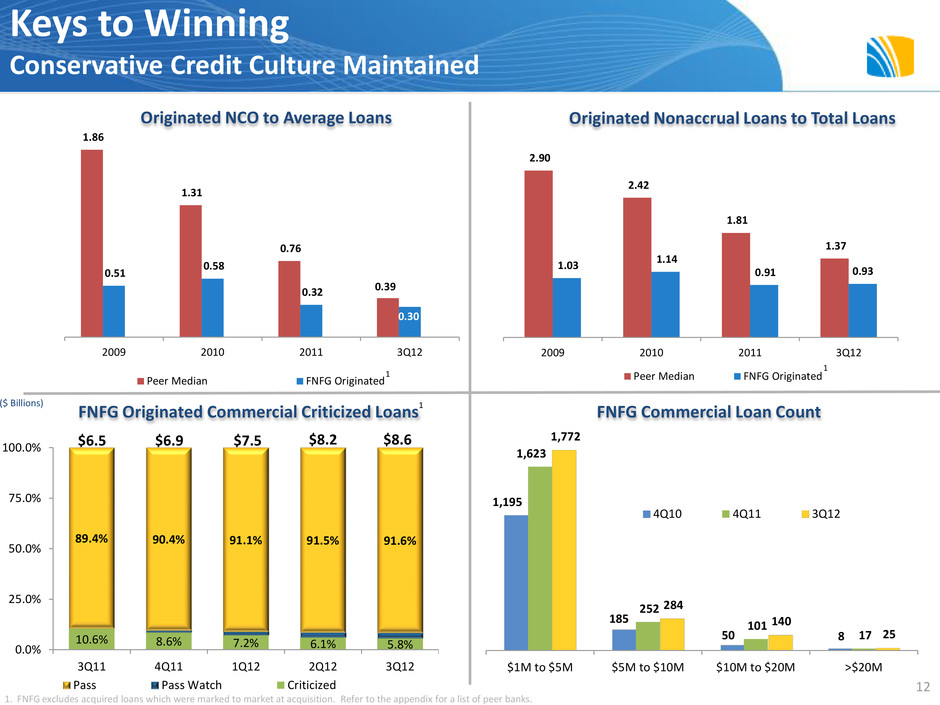
1.86 1.31 0.76 0.39 0.51 0.58 0.32 0.30 2009 2010 2011 3Q12 Peer Median FNFG Originated 12 Originated NCO to Average Loans 1 1. FNFG excludes acquired loans which were marked to market at acquisition. Refer to the appendix for a list of peer banks. 2.90 2.42 1.81 1.37 1.03 1.14 0.91 0.93 2009 2010 2011 3Q12 Peer Median FNFG Originated Originated Nonaccrual Loans to Total Loans 1 $6.5 $6.9 $7.5 $8.2 $8.6 ($ Billions) FNFG Originated Commercial Criticized Loans 1 1,195 185 50 8 1,623 252 101 17 1,772 284 140 25 $1M to $5M $5M to $10M $10M to $20M >$20M 4Q10 4Q11 3Q12 FNFG Commercial Loan Count Keys to Winning Conservative Credit Culture Maintained 10.6% 8.6% 7.2% 6.1% 5.8% 89.4% 90.4% 91.1% 91.5% 91.6% 0.0% 25.0% 50.0% 75.0% 100.0% 3Q11 4Q11 1Q12 2Q12 3Q12 Pass Pass Watch Criticized
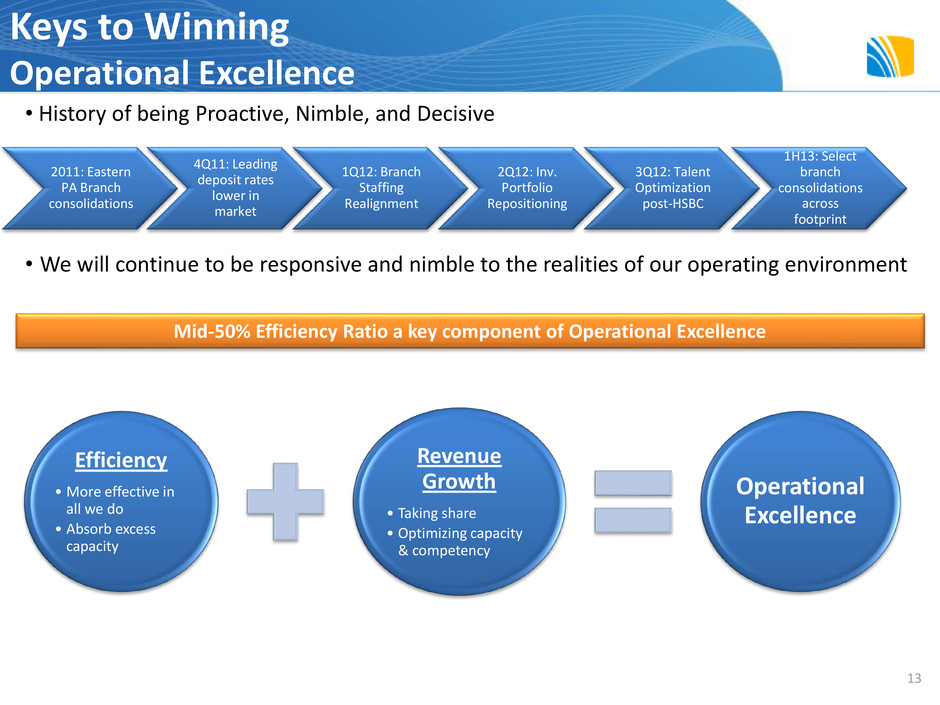
2011: Eastern PA Branch consolidations 4Q11: Leading deposit rates lower in market 1Q12: Branch Staffing Realignment 2Q12: Inv. Portfolio Repositioning 3Q12: Talent Optimization post-HSBC 1H13: Select branch consolidations across footprint 13 Keys to Winning Operational Excellence Mid-50% Efficiency Ratio a key component of Operational Excellence • History of being Proactive, Nimble, and Decisive • We will continue to be responsive and nimble to the realities of our operating environment Efficiency •More effective in all we do • Absorb excess capacity Revenue Growth • Taking share • Optimizing capacity & competency Operational Excellence
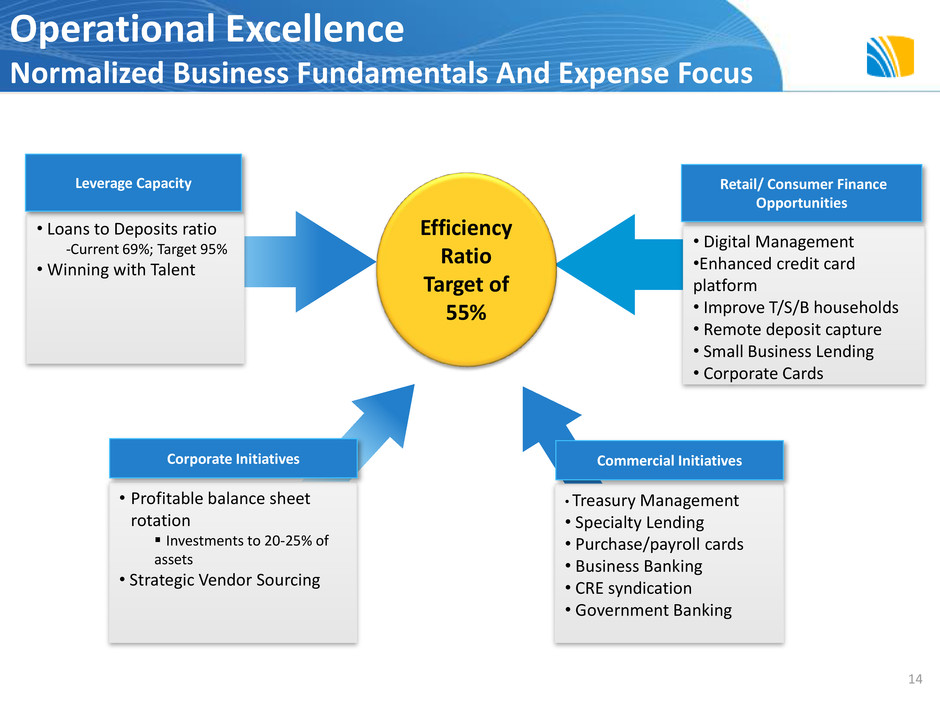
Operational Excellence Normalized Business Fundamentals And Expense Focus 14 Efficiency Ratio Target of 55% • Loans to Deposits ratio -Current 69%; Target 95% • Winning with Talent Leverage Capacity • Digital Management •Enhanced credit card platform • Improve T/S/B households • Remote deposit capture • Small Business Lending • Corporate Cards Retail/ Consumer Finance Opportunities • Treasury Management • Specialty Lending • Purchase/payroll cards • Business Banking • CRE syndication • Government Banking Commercial Initiatives • Profitable balance sheet rotation Investments to 20-25% of assets • Strategic Vendor Sourcing Corporate Initiatives
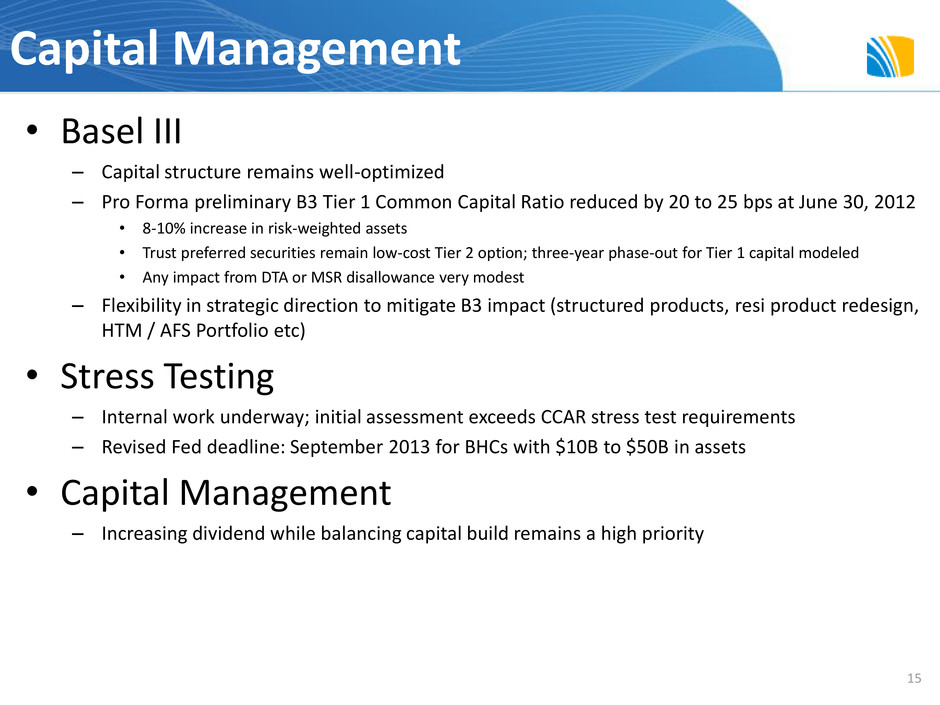
Capital Management • Basel III – Capital structure remains well-optimized – Pro Forma preliminary B3 Tier 1 Common Capital Ratio reduced by 20 to 25 bps at June 30, 2012 • 8-10% increase in risk-weighted assets • Trust preferred securities remain low-cost Tier 2 option; three-year phase-out for Tier 1 capital modeled • Any impact from DTA or MSR disallowance very modest – Flexibility in strategic direction to mitigate B3 impact (structured products, resi product redesign, HTM / AFS Portfolio etc) • Stress Testing – Internal work underway; initial assessment exceeds CCAR stress test requirements – Revised Fed deadline: September 2013 for BHCs with $10B to $50B in assets • Capital Management – Increasing dividend while balancing capital build remains a high priority 15
Performance Expectations 16
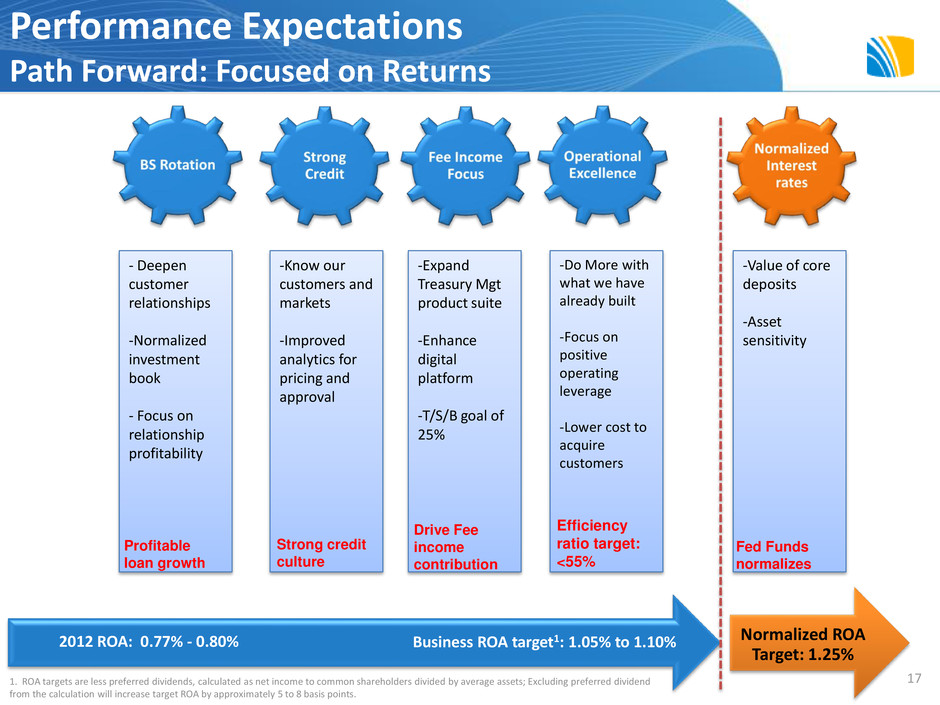
-Value of core deposits -Asset sensitivity -Expand Treasury Mgt product suite -Enhance digital platform -T/S/B goal of 25% -Do More with what we have already built -Focus on positive operating leverage -Lower cost to acquire customers -Know our customers and markets -Improved analytics for pricing and approval - Deepen customer relationships -Normalized investment book - Focus on relationship profitability Performance Expectations Path Forward: Focused on Returns Business ROA target1: 1.05% to 1.10% 2012 ROA: 0.77% - 0.80% Normalized ROA Target: 1.25% Efficiency ratio target: <55% Drive Fee income contribution Strong credit culture Profitable loan growth Fed Funds normalizes 1. ROA targets are less preferred dividends, calculated as net income to common shareholders divided by average assets; Excluding preferred dividend from the calculation will increase target ROA by approximately 5 to 8 basis points. 17
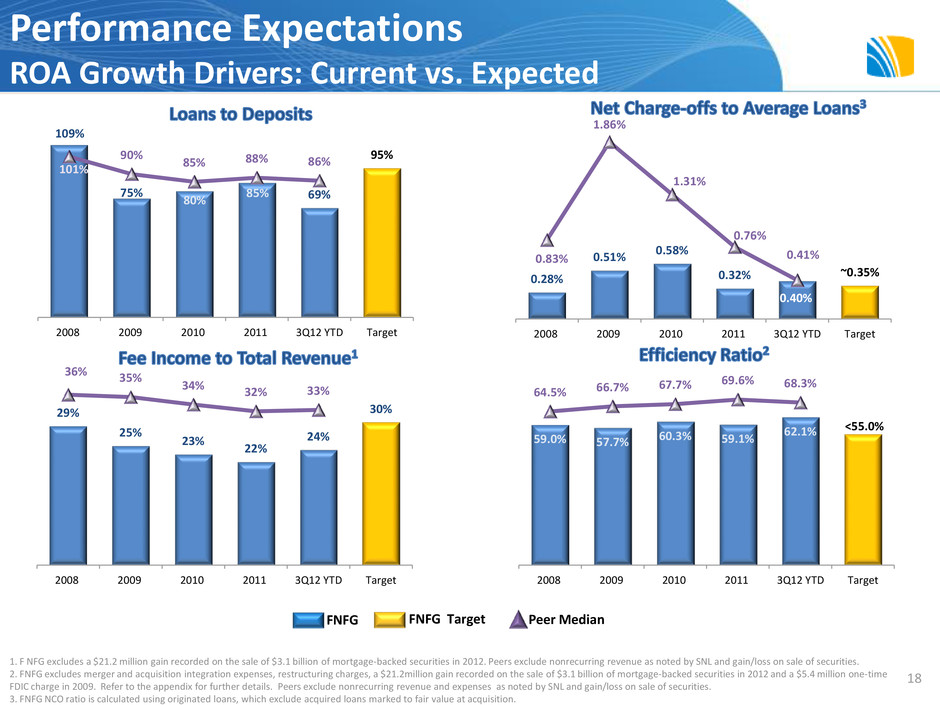
Performance Expectations ROA Growth Drivers: Current vs. Expected 1. F NFG excludes a $21.2 million gain recorded on the sale of $3.1 billion of mortgage-backed securities in 2012. Peers exclude nonrecurring revenue as noted by SNL and gain/loss on sale of securities. 2. FNFG excludes merger and acquisition integration expenses, restructuring charges, a $21.2million gain recorded on the sale of $3.1 billion of mortgage-backed securities in 2012 and a $5.4 million one-time FDIC charge in 2009. Refer to the appendix for further details. Peers exclude nonrecurring revenue and expenses as noted by SNL and gain/loss on sale of securities. 3. FNFG NCO ratio is calculated using originated loans, which exclude acquired loans marked to fair value at acquisition. 0.28% 0.51% 0.58% 0.32% 0.40% ~0.35% 0.83% 1.86% 1.31% 0.76% 0.41% 2008 2009 2010 2011 3Q12 YTD Target FNFG FNFG Target Peer Median 109% 75% 80% 85% 69% 95% 101% 90% 85% 88% 86% 2008 2009 2010 2011 3Q12 YTD Target 29% 25% 23% 22% 24% 30% 36% 35% 34% 32% 33% 2008 2009 2010 2011 3Q12 YTD Target 59.0% 57.7% 60.3% 59.1% 62.1% <55.0% 64.5% 66.7% 67.7% 69.6% 68.3% 2008 2009 2010 2011 3Q12 YTD Target 18

Performance Expectations Return Metrics: Current vs Expected FNFG FNFG Base Case Benefit from normalized rates Peer Median 1 FNFG excludes merger and acquisition integration expenses, restructuring charges, $21.2million gain recorded on the sale of $3.1 billion of mortgage-backed securities in 2012 and a $5.4 million one-time FDIC charge in 2009. Refer to the appendix for further details. ROA targets are less preferred dividends, calculated as net income to common shareholders divided by average assets; Excluding preferred dividend from the calculation will increase target ROA by approximately 5 to 8 basis points. Peers exclude nonrecurring revenue and expenses as noted by SNL and gain/loss on sale of securities. 1.25% 1.00% 0.92% 0.92% 0.94% 0.80% 1.10% 0.67% 0.12% 0.57% 0.88% 0.94% 2008 2009 2010 2011 3Q12 YTD Target 2.35% 1.76% 1.80% 1.65% 1.63% 1.47% 2.10% 1.88% 1.75% 1.46% 1.43% 1.52% 2008 2009 2010 2011 3Q12 YTD Target 19
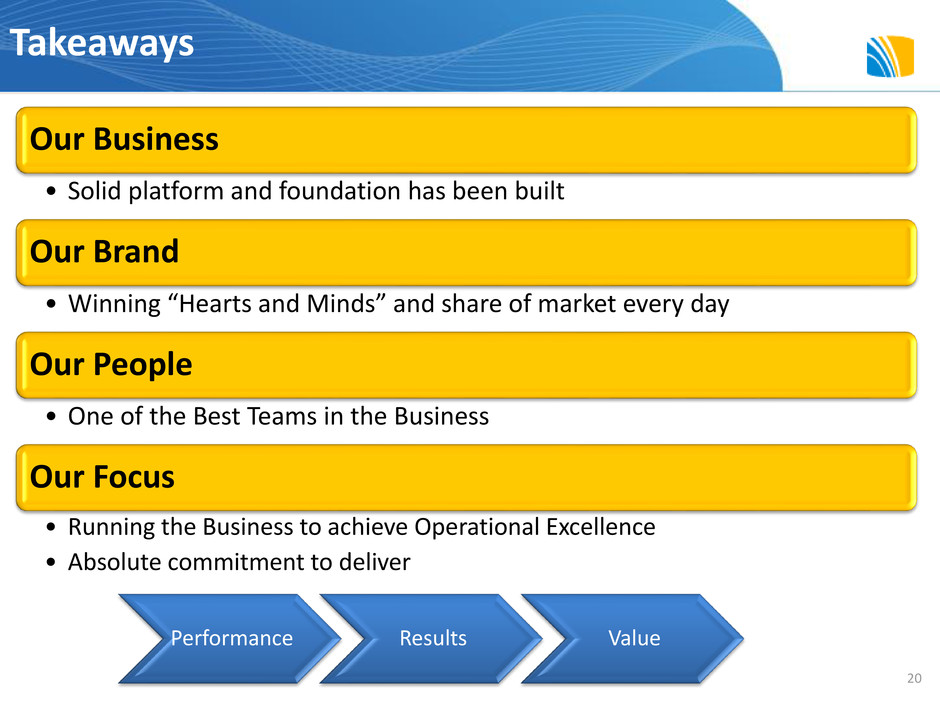
Our Business • Solid platform and foundation has been built Our Brand • Winning “Hearts and Minds” and share of market every day Our People • One of the Best Teams in the Business Our Focus • Running the Business to achieve Operational Excellence • Absolute commitment to deliver Takeaways 20 Performance Results Value
First Niagara Financial Group John R. Koelmel President & Chief Executive Officer Bank of America Merrill Lynch 2012 Banking and Financial Services Conference November 13, 2012

Appendix
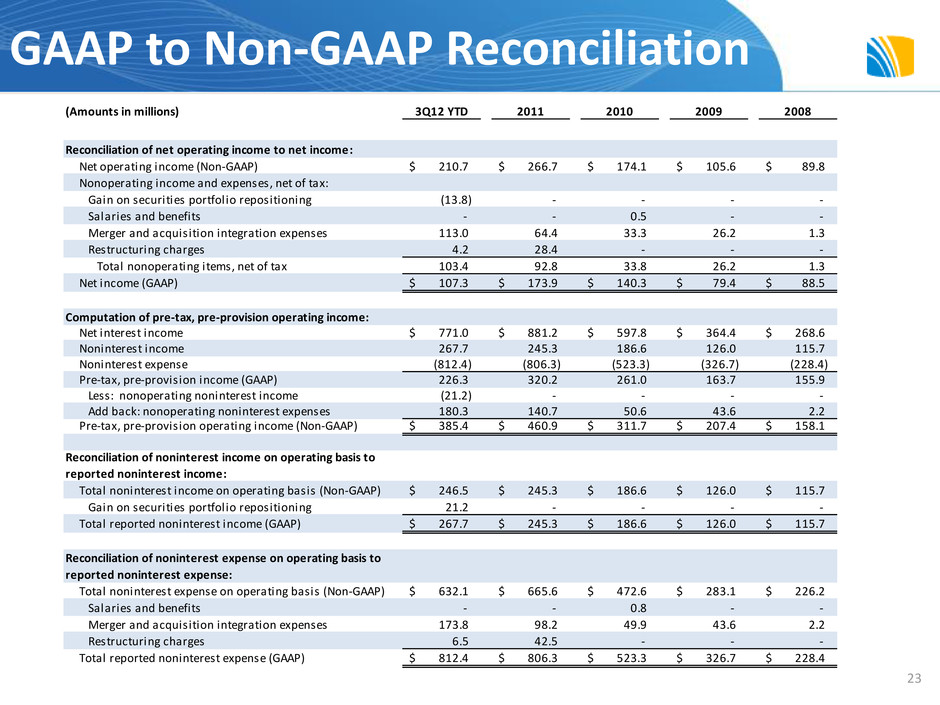
GAAP to Non-GAAP Reconciliation 23 (Amounts in millions) 3Q12 YTD 2011 2010 2009 2008 Reconciliation of net operating income to net income: Net operating income (Non-GAAP) 210.7$ 266.7$ 174.1$ 105.6$ 89.8$ Nonoperating income and expenses, net of tax: Gain on securities portfolio repositioning (13.8) - - - - Salaries and benefits - - 0.5 - - Merger and acquisition integration expenses 113.0 64.4 33.3 26.2 1.3 Restructuring charges 4.2 28.4 - - - Total nonoperating items, net of tax 103.4 92.8 33.8 26.2 1.3 Net income (GAAP) 107.3$ 173.9$ 140.3$ 79.4$ 88.5$ Computation of pre-tax, pre-provision operating income: Net interest income 771.0$ 881.2$ 597.8$ 364.4$ 268.6$ Noninterest income 267.7 245.3 186.6 126.0 115.7 Noninterest expense (812.4) (806.3) (523.3) (326.7) (228.4) Pre-tax, pre-provision income (GAAP) 226.3 320.2 261.0 163.7 155.9 Less: nonoperating noninterest income (21.2) - - - - Add back: nonoperating noninterest expenses 180.3 140.7 50.6 43.6 2.2 Pre-tax, pre-provision operating income (Non-GAAP) 385.4$ 460.9$ 311.7$ 207.4$ 158.1$ Total noninterest income on operating basis (Non-GAAP) 246.5$ 245.3$ 186.6$ 126.0$ 115.7$ Gain on securities portfolio repositioning 21.2 - - - - Total reported noninterest income (GAAP) 267.7$ 245.3$ 186.6$ 126.0$ 115.7$ Total noninterest expense on operating basis (Non-GAAP) 632.1$ 665.6$ 472.6$ 283.1$ 226.2$ Salaries and benefits - - 0.8 - - Merger and acquisition integration expenses 173.8 98.2 49.9 43.6 2.2 Restructuring charges 6.5 42.5 - - - Total reported noninterest expense (GAAP) 812.4$ 806.3$ 523.3$ 326.7$ 228.4$ Reconciliation of noninterest income on operating basis to reported noninterest income: Reconciliation of noninterest expense on operating basis to reported noninterest expense:
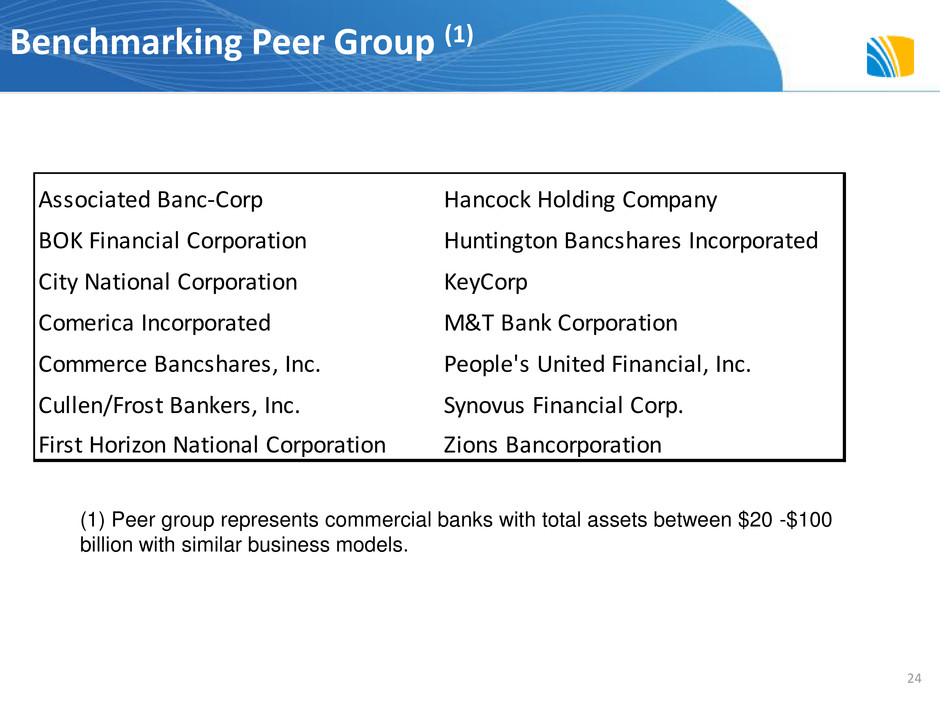
Associated Banc-Corp Hancock Holding Company BOK Financial Corporation Huntington Bancshares Incorporated City National Corporation KeyCorp Comerica Incorporated M&T Bank Corporation Commerce Bancshares, Inc. People's United Financial, Inc. Cullen/Frost Bankers, Inc. Synovus Financial Corp. First Horizon National Corporation Zions Bancorporation (1) Peer group represents commercial banks with total assets between $20 -$100 billion with similar business models. Benchmarking Peer Group (1) 24
