Attached files
| file | filename |
|---|---|
| EX-3.3 - EX-3.3 - AutoTrader Group, Inc. | d357935dex33.htm |
| EX-3.2 - EX-3.2 - AutoTrader Group, Inc. | d357935dex32.htm |
| EX-23.2 - EX-23.2 - AutoTrader Group, Inc. | d357935dex232.htm |
| EX-23.3 - EX-23.3 - AutoTrader Group, Inc. | d357935dex233.htm |
| EX-23.1 - EX-23.1 - AutoTrader Group, Inc. | d357935dex231.htm |
Table of Contents
As filed with the Securities and Exchange Commission on November 13, 2012
Registration No. 333-182173
UNITED STATES
SECURITIES AND EXCHANGE COMMISSION
Washington, D.C. 20549
AMENDMENT NO. 3
TO
FORM S-1
REGISTRATION STATEMENT UNDER THE
SECURITIES ACT OF 1933
AutoTrader Group, Inc.
(Exact name of registrant as specified in its charter)
| Delaware | 7389 | 45-5376147 | ||
| (State or Other Jurisdiction of Incorporation or Organization) |
(Primary Standard Industrial Classification Code Number) |
(IRS Employer Identification No.) |
3003 Summit Boulevard
Atlanta, Georgia 30319
(404) 568-8000
(Address, including zip code, and telephone number, including area code, of registrant’s principal executive offices)
Dallas S. Clement
Executive Vice President and Chief Financial Officer
3003 Summit Boulevard
Atlanta, Georgia 30319
(404) 568-8000
(Name, address, including zip code, and telephone number, including area code, of agent for service)
Copies to:
| Alexander D. Lynch, Esq. Weil, Gotshal & Manges LLP 767 Fifth Avenue New York, New York 10153 Telephone: (212) 310-8000 Facsimile: (212) 310-8007 |
Thomas D. Twedt, Esq. Dow Lohnes PLLC 1200 New Hampshire Avenue, N.W. Washington, D.C. 20036 Telephone: (202) 776-2000 Facsimile: (202) 776-2222 |
Peter C. Cassat, Esq. AutoTrader Group, Inc. 3003 Summit Boulevard Atlanta, Georgia 30319 Telephone: (404) 568-8000 Facsimile: (404) 568-7412 |
Richard D. Truesdell, Jr., Esq. Davis Polk & Wardwell LLP 450 Lexington Avenue New York, New York 10017 Telephone: (212) 450-4000 Facsimile: (212) 701-5674 |
Approximate date of commencement of proposed sale to the public: As soon as practicable after the effective date of this Registration Statement.
If any of the securities being registered on this Form are to be offered on a delayed or continuous basis pursuant to Rule 415 under the Securities Act of 1933, as amended, or the Securities Act, check the following box. ¨
If this Form is filed to register additional securities for an offering pursuant to Rule 462(b) under the Securities Act, please check the following box and list the Securities Act registration statement number of the earlier effective registration statement for the same offering. ¨
If this Form is a post-effective amendment filed pursuant to Rule 462(c) under the Securities Act, check the following box and list the Securities Act registration statement number of the earlier effective registration statement for the same offering. ¨
If this Form is a post-effective amendment filed pursuant to Rule 462(d) under the Securities Act, check the following box and list the Securities Act registration statement number of the earlier effective registration statement for the same offering. ¨
Indicate by check mark whether the registrant is a large accelerated filer, an accelerated filer, a non-accelerated filer or a smaller reporting company. See the definitions of “accelerated filer,” “large accelerated filer” and “smaller reporting company” in Rule 12b-2 of the Exchange Act.
| Large accelerated filer ¨ | Accelerated filer ¨ | Non-accelerated filer x | Smaller reporting company ¨ | |||
| (Do not check if a smaller reporting company) |
The Registrant hereby amends this Registration Statement on such date or dates as may be necessary to delay its effective date until the Registrant shall file a further amendment which specifically states that this Registration Statement shall thereafter become effective in accordance with Section 8(a) of the Securities Act or until the Registration Statement shall become effective on such date as the Commission acting pursuant to said Section 8(a), may determine.
Table of Contents
The information in this preliminary prospectus is not complete and may be changed. These securities may not be sold until the registration statement filed with the Securities and Exchange Commission is effective. This preliminary prospectus is not an offer to sell nor does it seek an offer to buy these securities in any jurisdiction where the offer or sale is not permitted.
Preliminary Prospectus
Subject to Completion. Dated November 13, 2012.
Shares

Class A Common Stock
This is an initial public offering of shares of Class A common stock of AutoTrader Group, Inc.
We are offering shares of our Class A common stock. This is our initial public offering and no public market currently exists for our Class A common stock. We expect our initial public offering price will be between $ and $ per share. After pricing the offering, we expect our Class A common stock will be listed on the New York Stock Exchange under the symbol “ATG.”
We have two classes of authorized common stock, Class A common stock and Class B common stock. The rights of the holders of Class A common stock and Class B common stock are identical, except with respect to voting and conversion. Each share of Class A common stock is entitled to one vote per share. Each share of Class B common stock is entitled to 10 votes per share and is convertible at any time into one share of Class A common stock. Outstanding shares of Class B common stock will represent approximately % of the voting power of our outstanding capital stock immediately following this offering.
Investing in our Class A common stock involves a high degree of risk. See “Risk Factors” beginning on page 19.
Neither the Securities and Exchange Commission nor any other regulatory body has approved or disapproved of these securities or passed on the adequacy or accuracy of this prospectus. Any representation to the contrary is a criminal offense.
| Per share | Total | |||||||
| Initial public offering price |
$ | $ | ||||||
| Underwriting discounts and commissions |
$ | $ | ||||||
| Proceeds, before expenses, to us |
$ | $ | ||||||
To the extent that the underwriters sell more than shares of our Class A common stock, the underwriters have the option to purchase up to an additional shares from us at the initial public offering price less the underwriting discount.
The underwriters expect to deliver the shares against payment in New York, New York on , 2012.
| Goldman, Sachs & Co. |
Morgan Stanley | |||
| Allen & Company LLC |
Barclays | Citigroup | ||
| Deutsche Bank Securities |
SunTrust Robinson Humphrey |
Wells Fargo Securities | ||
| RBC Capital Markets Raymond James | ||||
| Evercore Partners |
Guggenheim Securities | Mizuho Securities | ||
| Needham & Company |
SMBC Nikko | The Williams Capital Group, L.P. | ||||
Prospectus dated , 2012
Table of Contents
| Page | ||||
| ii | ||||
| 1 | ||||
| 11 | ||||
| 14 | ||||
| 19 | ||||
| 48 | ||||
| 49 | ||||
| 50 | ||||
| 51 | ||||
| 53 | ||||
| Management’s Discussion and Analysis of Financial Condition and Results of Operations |
55 | |||
| 94 | ||||
| 125 | ||||
| 126 | ||||
| 133 | ||||
| 157 | ||||
| 163 | ||||
| 166 | ||||
| 169 | ||||
| 174 | ||||
| Material United States Federal Income and Estate Tax Considerations for Non-U.S. Holders |
176 | |||
| Underwriting (Conflicts of Interest) |
180 | |||
| 185 | ||||
| 185 | ||||
| 186 | ||||
| F-1 | ||||
Neither we nor the underwriters (or any of our or their respective affiliates) have authorized anyone to provide any information other than that contained in this prospectus or in any free writing prospectus prepared by or on behalf of us or to which we have referred you. Neither we nor the underwriters (or any of our or their respective affiliates) take any responsibility for, and can provide no assurance as to the reliability of, any other information that others may give you. We and the underwriters (or any of our or their respective affiliates) are not making an offer to sell these securities in any jurisdiction where the offer or sale is not permitted. You should assume that the information appearing in this prospectus is only accurate as of the date on the front cover of this prospectus. Our business, financial condition, results of operations and prospects may have changed since that date.
We own or have the rights to use various trademarks, service marks and trade names referred to in this prospectus, including, among others, AutoTrader, AutoTrader.com, Kelley Blue Book, KBB.com, vAuto, VinSolutions, CDMdata and HomeNet, and their respective logos. Solely for convenience, we refer to trademarks, service marks and trade names in this prospectus without the TM, SM and ® symbols. Such references are not intended to indicate, in any way, that we will not assert, to the fullest extent permitted by law, our rights to our trademarks, service marks and trade names. Other trademarks, trade names or service marks appearing in this prospectus are the property of their respective owners. As indicated in this prospectus, we have included market data and industry forecasts that were obtained from industry publications and other sources.
i
Table of Contents
This prospectus contains forward-looking statements that are subject to risks and uncertainties. All statements other than statements of historical fact or relating to present facts or current conditions included in this prospectus are forward-looking statements. Forward-looking statements give our current expectations and projections relating to our financial condition, results of operations, plans, objectives, future performance and business. You can identify forward-looking statements by the fact that they do not relate strictly to historical or current facts. These statements may include words such as “anticipate,” “estimate,” “expect,” “project,” “plan,” “intend,” “believe,” “may,” “should,” “can have,” “likely” and other words and terms of similar meaning in connection with any discussion of the timing or nature of future operating or financial performance or other events.
The forward-looking statements contained in this prospectus are based on assumptions that we have made in light of our industry experience and our perceptions of historical trends, current conditions, expected future developments and other factors we believe are appropriate under the circumstances. As you read and consider this prospectus, you should understand that these statements are not guarantees of performance or results. They involve risks, uncertainties (many of which are beyond our control) and assumptions. Although we believe that these forward-looking statements are based on reasonable assumptions, you should be aware that many factors could affect our actual operating and financial performance and cause our performance to differ materially from the performance anticipated in the forward-looking statements. We believe these factors include, but are not limited to, those described under “Risk Factors” and “Management’s Discussion and Analysis of Financial Condition and Results of Operations.” Should one or more of these risks or uncertainties materialize, or should any of these assumptions prove incorrect, our actual operating and financial performance may vary in material respects from the performance projected in these forward-looking statements.
Any forward-looking statement made by us in this prospectus speaks only as of the date on which we make it. Factors or events that could cause our actual operating and financial performance to differ may emerge from time to time, and it is not possible for us to predict all of them. We undertake no obligation to publicly update any forward-looking statement, whether as a result of new information, future developments or otherwise, except as may be required by law.
ii
Table of Contents
This summary provides an overview of selected information contained elsewhere in this prospectus and is qualified in its entirety by the more detailed information and consolidated financial statements included elsewhere in this prospectus. You should carefully review the entire prospectus, including the risk factors, the consolidated financial statements and the notes thereto, and the other documents to which this prospectus refers before making an investment decision. Unless the context requires otherwise, references to “ATG,” “our company,” “we,” “us” and “our” refer to AutoTrader Group, Inc. and its direct and indirect subsidiaries. References to “ATC” refer to AutoTrader.com, Inc., our direct wholly-owned subsidiary, and references to “Kelley Blue Book” refer to Kelley Blue Book Co., Inc., a direct wholly-owned subsidiary of ATC. References to “CEI” refer to Cox Enterprises, Inc. and its direct and indirect subsidiaries, excluding us. All share and per share data presented in this prospectus, including in our financial statements and related notes thereto included elsewhere in this prospectus, do not reflect the adjustment to stock options and stock appreciation rights for the impact of the April 2012 dividend. For more information see “Management’s Discussion and Analysis of Financial Condition and Results of Operations—Critical Accounting Policies and Estimates— Long-Term Incentive Compensation—Adjustment of Stock Options and Stock Appreciation Rights.”
Overview
We operate the largest digital automotive marketplace and are a leading provider of marketing and software solutions to automotive dealers in the United States. Through our well-known AutoTrader.com and Kelley Blue Book brands, we offer consumers tools, content and information that increase their confidence in the car buying process. In the six months ended June 30, 2012, we provided over 28 million average monthly unique visitors with free, convenient access to over 3.6 million easily searchable daily car listings, descriptive content, proprietary pricing and valuation data and innovative vehicle comparison tools. Our digital media solutions provide car dealers, automobile original equipment manufacturers, or OEMs, and others the opportunity to target tailored advertising solutions to our uniquely scaled audience of in-market car shoppers. Our innovative software solutions allow car dealers to source, appraise, manage, price and market their inventory, and help them manage their consumer relationships. We have cultivated our dealer relationships by building what we believe is the largest dealer sales force in the U.S. retail automotive industry, with over 1,400 highly trained, consultative sales and support professionals.
Since our founding in 1997, our mission has been to dramatically improve the way people buy and sell new and used cars. We believe our two businesses—Digital Media and Software Solutions—have enhanced the retail automotive industry, reducing friction between dealers and consumers and allowing them to transact with greater ease, confidence and efficiency. The large scale of our monthly unique visitors, dealer customers and advertisers, in combination with the information and transaction data provided by their interactions on our platform, create significant value for all of these network participants. Our market position is further bolstered by our large sales force, significant and recurring investment in our brands and on-going product innovation.
In our Digital Media business, we reach approximately 60% of online in-market car shoppers in the United States, based on a 2011 KS&R Vehicle Shopper Study we conducted in collaboration with KS&R, Inc., or the 2011 KS&R Study. We also offer what we believe is the largest selection of unique online car listings that consumers can access from a single source and content tailored to meet consumer needs at all stages of the car buying process. According to the 2011 KS&R Study, we operate two of the leading online brands among car buyers in the United States—AutoTrader.com and Kelley Blue Book—and through our AutoTrader.com and KBB.com websites, we provide car shoppers
1
Table of Contents
with solutions for the car buying and selling process. On AutoTrader.com, consumers could search over 3.6 million daily unique new and used car listings, as of June 30, 2012, which we aggregate from our network of over 25,000 dealer relationships. In order to more effectively reach our broad audience of in-market car shoppers, over 21,000 of these dealers pay us monthly fees to subscribe to our services to enhance their new and used car listings on our websites. On KBB.com, consumers can read in-depth vehicle reviews, configure and compare new and used vehicles and obtain proprietary valuation estimates to inform their purchase or sale of a vehicle. On both AutoTrader.com and KBB.com, we offer OEMs and other advertisers the opportunity to tailor advertising solutions to what is, based on the 2011 KS&R Study, the largest targeted audience of in-market car shoppers in the United States, based on their location and preference of make, model, body style and price point.
Through our Software Solutions business, we provide dealer customers with subscription-based software tools and related data analytics to help them operate their businesses with greater efficiency and profitability. Our inventory management software solutions provide dealers with analytical tools that enable them to better manage their used car procurement and sales processes. Our integrated customer relationship management, or CRM, software solutions help dealers track their consumer prospects and relationships, develop a web presence, create direct marketing campaigns and instantly advertise inventory across their own and third-party websites. We believe our Software Solutions business benefits from significant contributions from our Digital Media business. Specifically, our AutoTrader.com and KBB.com websites provide us with proprietary historical and current market data that we use to help develop new software solutions.
Since our inception in 1997, as a result of the organic growth of AutoTrader.com, our recent acquisitions and the initial support of CEI, we have increased our revenues from $1.0 million in 1998 to over $1.0 billion in 2011. In 2011, our Adjusted EBITDA and net income were $334.6 million and $68.1 million, respectively. During this period, we generated 89% of our revenues from our Digital Media business and 11% of our revenues from our Software Solutions business. In the six months ended June 30, 2012, we generated 86% of our revenues from our Digital Media business and 14% of our revenues from our Software Solutions business.
By offering dealers free listings at our launch, we were immediately able to attract consumers with a large selection of cars and demonstrate to a critical mass of dealers the compelling value proposition that we offer. We believe our scale in car shoppers and dealers provides a significant advantage in both our Digital Media business as well as in our Software Solutions business. We still provide dealers with the ability to list their cars for free on AutoTrader.com, but we require them to pay monthly subscription fees for better listing placement and enhanced features. Today, we have over 25,000 dealers listing cars on our site, of which over 20,000 pay us to subscribe to our featured or premium listing solutions.
We believe that we are well-positioned to benefit as consumer behavior and advertising budgets continue to shift toward digital and mobile platforms and as dealers increasingly require more automation and analytical tools. By providing leading car content, research and access to what we believe is the largest selection of unique, high quality car listings, we streamline the consumer’s choice of which car to buy and what price to pay. As a result, we attract a large audience of in-market car shoppers which generates broad appeal to dealers, and thus more listings for consumers as well as a growing base of dealer customers. We can cross-sell our digital media and software solutions to this growing base of dealer customers.
2
Table of Contents
Our History
CEI formed our company in 1997. We launched our digital media platform in 1998 and licensed the AutoTrader brand in 1999. Until ceasing operations in 2009, CEI operated the AutoTrader print publication as a business separate from us.
In June 2010, affiliates of Providence Equity Partners L.L.C., or Providence Equity Partners, acquired a 25% stake in us. We refer to such affiliates of Providence Equity Partners as the Providence Funds. Since then, we have executed a series of acquisitions, including vAuto (October 2010), Kelley Blue Book (December 2010), HomeNet (December 2010) and VinSolutions (June 2011), that have broadened our audience reach and expanded our offerings to dealers. These acquisitions have helped us strengthen our tools and content for consumers, provide additional listing and advertising opportunities for dealers, OEMs and other advertisers, and offer software solutions to dealers, which have bolstered our overall market position.
Our Industry
Automotive advertising is among the largest advertising markets in the United States, with more than $22 billion expected to be spent on automotive advertising in 2012, according to Forrester Research. As consumers shift their search for cars online, automotive advertisers are increasingly moving their advertising budgets to the internet and away from traditional media, such as television, radio and print. According to Forrester Research, automotive advertisers increased spending on internet advertising from 5% of their advertising budgets in 2008 to 15% of their forecasted advertising budgets in 2011. However, the automotive industry’s allocation of advertising spending to digital media continues to lag consumer shopping behavior and preference. Excluding non-marketing sources of influence (such as word of mouth referrals), online car shoppers reported that the internet primarily drove their decision about where to purchase a vehicle 78% of the time, according to a 2011 Polk Automotive Influence Study we conducted in collaboration with R. L. Polk & Co. We expect the share of online automotive advertising spending to shift towards the internet’s share of consumer influence over time, representing significant future growth potential in digital automotive advertising.
In addition, the internet has brought greater complexity, pricing transparency and competition to dealers’ businesses, increasing the need for dealers to operate more efficiently. We believe dealers will increasingly require software solutions to make their operations more efficient and effective. As more dealers recognize that the use of technology is necessary to maintain and improve their competitiveness, we believe the market for inventory management and CRM software solutions will continue to grow significantly.
Our Solution
Our digital automotive marketplace has enhanced the car buying and selling process by connecting the largest targeted audience of in-market car shoppers in the United States, based on the 2011 KS&R Study, with what we believe is the largest base of dealers and other sellers. Our software solutions are changing the way dealers use the power of market data, analytics and the internet to improve inventory management, achieve greater price clarity, advertise vehicles to in-market car shoppers, manage consumer relationships throughout their lifecycle and establish and maintain their own websites.
We provide the following key benefits to consumers:
Access to the Largest Selection of Unique, High-Quality Car Listings. Based on market surveys conducted by us, we believe we provide access to the largest selection of unique, high-quality car
3
Table of Contents
listings. By aggregating over 3.6 million daily car listings as of June 30, 2012, we help streamline the consumer’s process of deciding which car to buy and what price to pay. We believe this is the largest number of unique listings for new and used cars that consumers can access from a single source. We offer in-market car shoppers available inventory throughout the United States, which is updated multiple times daily, from our network of over 25,000 dealer relationships and from private sellers. As such, we believe consumers are able to find information on the make, model, body style and price point of cars in a specified geography more easily and quickly on our websites than through any other source.
Customized and Curated Search Capabilities. Our advanced search functionality enables consumers to find the car listings that meet their specific needs and to physically locate the vehicle from a nearby dealer or private seller. Dealers with higher quality online content typically receive the best results in terms of interest in their listings, resulting in valuable and proprietary marketplace input for our search results. Our search tools effectively curate automotive inventory for consumers because subscribing dealers and private sellers must compete to reach our audience by paying higher fees to have their listings displayed in more prominent search result tiers.
Leading Car Content, Research and Advice. We provide consumers two complementary websites, KBB.com and AutoTrader.com, that help meet the entire spectrum of consumer needs throughout the car buying process. KBB.com targets early stage car shoppers by offering in-depth reviews, comprehensive guidance on car valuation and total cost of ownership based on a proprietary database of car transactions. AutoTrader.com targets later stage car shoppers by providing enhanced listings, including high-quality photos, videos and 360-degree spin views. These tools are designed to empower consumers to make more informed car buying decisions and to lessen the perception of information asymmetry between consumers and dealers. For the six months ended June 30, 2012, the overlap of unique visitors on AutoTrader.com and KBB.com was only 2.4 million, excluding mobile visitors, or 9% of the combined average monthly unique visitors on the two websites.
Opportunity to Increase Resale Value. Through our private seller service, individuals may list used cars for sale on our websites, giving them access to the largest targeted audience of in-market car shoppers in the United States, based on the 2011 KS&R Study, and providing them with the opportunity to increase their sale price. Our Trade-In Marketplace (TIM) service allows consumers throughout the United States to receive instant trade-in offers redeemable at a participating local dealership, subject to verification of the vehicle’s characteristics and condition. These tools have improved the price transparency and convenience of monetizing used vehicles for consumers.
We also provide the following key benefits to dealers, OEMs and other advertisers:
Access to a Large, Targeted Audience of In-Market Car Shoppers. Through a variety of our digital media services, dealers, OEMs and other advertisers can reach a targeted audience of approximately 60% of online in-market car shoppers in the United States, according to the 2011 KS&R Study, more efficiently than through any other online or offline media channel. Our digital media solutions help dealers reach in-market car shoppers and target those within and beyond their local area that are interested in the makes and models that they stock. We believe that our broad in-market car shopper reach also makes our digital media platform a compelling value proposition for OEMs, most of which advertised on our websites in 2011.
Superior Automotive Advertising ROI. We offer dealers, OEMs and other advertisers more efficient marketing solutions compared to traditional media. For example, our consumer search function identifies consumer interest by location and preference of make, model, body style and price point. Consequently, we are able to match in-market car shoppers with advertising and listings on a
4
Table of Contents
highly specific basis and increase the overall likelihood that an advertisement or listing will influence a consumer’s purchasing decision. As a result, we believe dealers, OEMs and other advertisers can invest their marketing budgets more efficiently and effectively with us. We also believe our dealer customers’ perception of the value of our digital media solutions is reflected in our low dealer churn.
Critical Software Solutions that Increase Dealer Efficiency. We believe our solutions are integral to many aspects of a dealer’s retail operations. Under our vAuto and VinSolutions brands, we offer dealers pricing, sourcing, appraising, inventory management, CRM and website management solutions. These software solutions allow dealers to optimize their used vehicle inventory management and sales processes and more efficiently manage their businesses, thereby enhancing overall profitability.
Consultative Performance Management. Our dealer sales force lives by the motto, “We Work For You.” We believe our dealer sales force of over 1,400 sales and support professionals is the largest in the U.S. retail automotive industry. Our dealer sales force helps dealers implement our solutions and continue to adapt their usage according to their evolving needs. We offer our dealer customers on-going consultation to assist them in effectively utilizing and maximizing the value of our digital media and software solutions. Through our tools, analytics and highly trained, consultative sales and customer service professionals, we assist dealers in analyzing their businesses on a granular level, charting inventory turnover and pricing relative to other dealers in their region.
Our Strengths
Strong, Recognizable Brands. Our unique portfolio of brands includes AutoTrader.com, Kelley Blue Book and vAuto, among others. The brand strength of AutoTrader.com and Kelley Blue Book is evidenced by the fact that approximately 70% of our traffic to both websites was sourced through direct navigation and search, as of November 2011. Individually, ATC and KBB each achieve 76% total awareness among new and used car shoppers, with ATC and KBB claiming a distinct advantage over their closest direct competitors, according to the 2011 KS&R Study. Since our inception, we have spent over $840 million on marketing initiatives to establish and secure our brand leadership. The majority of this spending has been focused on building the AutoTrader.com brand over the past 14 years, but we have begun to invest more in our marketing initiatives for our newly acquired brands, including having recently launched a broad campaign to enhance the Kelley Blue Book brand.
The Largest Targeted Audience. Our AutoTrader.com and Kelley Blue Book websites draw the largest targeted audience of in-market car shoppers in the United States, based on the 2011 KS&R Study. As of June 30, 2012, we had over 3.6 million daily car listings and, for the six months ended June 30, 2012, over 28 million average monthly unique visitors that were unduplicated between AutoTrader.com and KBB.com.
Large Consultative Dealer Sales Force. We believe our dealer sales force of over 1,400 sales and support professionals is the largest in the U.S. retail automotive industry and provides us with a strong competitive advantage. We have built our sales force over the past 14 years both organically and through our acquisitions and have deeply ingrained our culture of client dedication into each professional. We believe our track record of helping dealers understand and utilize our new services has built dealer loyalty to our solutions and driven the growth of our business.
Innovative Analytics Capabilities. We provide our subscribing dealers with an end-to-end view of the consumer car shopping experience through our proprietary market data on our branded AutoTrader.com and KBB.com websites, as well as on the dealer websites and CRM software managed through our Software Solutions business. In leading the shift from contextual advertising to
5
Table of Contents
behaviorally-targeted marketing, we enable advertisers to deliver the right message to the right buyer at the right moment, which we believe results in greater advertising efficiency and effectiveness.
Broad Platform with Significant Network Effects. Our industry position has created a platform that allows us to serve a broad range of the retail automotive industry’s needs, from classified listings to national brand marketing to a comprehensive suite of digital marketing and software solutions for dealers. Our ability to drive advertising and software product adoption across our dealer customer base has delivered consistent increases in customer spending with monthly run rate, or MRR, in our Digital Media business growing to $3,001 in 2011, representing 15% growth from 2010. We benefit from network effects as each additional listing and each additional consumer increases the utility of our solutions for dealers, advertisers and consumers. The scale of our consumer base, the number of dealers and advertisers that use our solutions, and the deep and accurate information generated by our consumers, dealers and other automotive-related advertisers create significant value for all participants.
Recurring, Diversified Revenue Model. Our recurring subscription revenue model provides high visibility into our on-going revenue streams. Although the terms of our digital media and software solutions subscription agreements are generally 30 days, as a result of our high renewal rates, we have a high level of recurring revenues. In 2011 and the six months ended June 30, 2012, approximately 76% and 79%, respectively, of our revenues were recurring revenues. We believe our value proposition to dealers along with our increasingly diversified sources of revenue support long-term sustainability and resiliency, even during economic downturns.
Rapid Revenue Growth with Significant Operating Leverage. As a digital pioneer and market leader, we have experienced rapid organic revenue growth as dealers and other advertisers have steadily migrated their advertising spending to digital media platforms. In addition, we have also increased revenues through our recent acquisitions. Our operating expenses have grown at a lower rate than our revenues as we are able to leverage our operations, sales and marketing and technology over a broader revenue base. This operating leverage has helped drive growth in Adjusted EBITDA margins as revenues have scaled. Our revenues, Adjusted EBITDA and net income grew from $629.5 million, $155.5 million and $9.9 million, respectively, in 2009, to $1.0 billion, $334.6 million and $68.1 million, respectively, in 2011. At the same time, our Adjusted EBITDA margin and net income margin (net income divided by revenues) in 2011 were 33% and 7%, respectively, up from 25% and 2%, respectively, in 2009.
Visionary Management Team. We are led by a talented, experienced and deep management team that grew us from the start-up stage into our current position as the largest digital automotive marketplace and a leading provider of marketing and software solutions to automotive dealers in the United States. The members of our management team have an average of nearly 20 years of experience in the media and automotive industries.
Growth Strategy
We intend to grow our platform and business by focusing on our mission and executing on the following key growth strategies:
Increase Share of Existing Dealer Customer Marketing Spending. We intend to increase the share of marketing spending we receive from our existing base of over 25,000 dealer relationships by helping them adopt additional marketing solutions. Through our consultative sales approach and on-going development of new solutions, we strive to help our dealer customers realize the value of our premium listing packages and increase adoption of our add-on and recently launched services, such as Alpha, Spotlight and TIM.
6
Table of Contents
Cross-Sell Our Software Solutions to Our Customer Base of Subscribing Dealers. As of June 30, 2012, only approximately 5,500 of our over 21,000 subscribing dealers subscribed to our recently acquired vAuto, VinSolutions and HomeNet software solutions or to more than one of our software solutions. We intend to utilize our existing dealer sales force, long-standing customer relationships and consultative sales approach to help our dealers recognize the value of our software solutions in order to expand the percentage of subscribing dealers using our software solutions, and to increase our Software Solutions MRR.
Develop New Services for Consumers, Dealers and Advertisers. We intimately understand the car sales process and dealer operations and have continuously leveraged this expertise to develop and launch new services. Our proprietary data, analytic tools and market insights allow us to develop new digital media services that create refined personalization tools for consumers, and help our dealer and advertiser customers maximize the impact of their digital and mobile advertising spending. We expect to continue to develop core services for these brands, including home page displays, behavioral targeting opportunities, new car services and mobile applications, to attract offline advertising to our digital automotive marketplace. We also intend to enhance the features and functionality of our software solutions to better address the evolving inventory, CRM and marketing management needs of dealers.
Increase Mobile Solutions. We believe mobile devices broaden the access to our dealers’ listings while providing in-market car shoppers with current, location-specific information that facilitates their decision-making process. Our mobile applications provide in-market car shoppers with the information and resources of AutoTrader.com and KBB.com at any location while enhancing the value proposition for our subscribing dealers by enabling them to reach a highly-targeted “on the lot” audience. We provide our mobile applications as part of our digital media services to dealers. We do not currently charge for these applications separately but provide them to enhance our digital media solutions. We are also continuing to develop mobile websites and mobile applications for our inventory management and CRM software solutions, which we may provide to dealers for an additional charge in the future.
Increase Brand Advertising and Grow Our Traffic. Increasing the awareness among consumers, dealers and brand advertisers of our AutoTrader.com and Kelley Blue Book brands is critical to expanding in-market consumer traffic to AutoTrader.com and KBB.com and our mobile applications. We intend to continue to invest in our AutoTrader.com and Kelley Blue Book brands to grow our internet traffic.
Increase Penetration of the Dealer Market. In 2011, over 20,000 dealers, out of our target market of approximately 45,000 dealers in the United States, subscribed to one or more of our solutions. We believe that there is a substantial opportunity to further penetrate the U.S. dealer market, which will provide opportunities to expand both our Digital Media and Software Solutions businesses. We continue to add new dealer customers across our businesses and believe that the continued expansion of our dealer customer base will contribute to our overall growth.
Expand Into New Markets. We believe that there are significant opportunities to expand into adjacent markets in the automotive industry, offer our existing services in select new geographic markets and potentially enter into new industry verticals. We believe our expertise in dealer operations and the retail automotive industry, and our ability to manage data and develop technological solutions, can be leveraged to address other aspects of the automotive industry. Our expansion strategy includes exploring acquisitions, partnerships, strategic investments and joint ventures. We believe that our leadership position enhances our ability to evaluate such opportunities on an on-going basis.
7
Table of Contents
Risks Affecting Our Business
Investing in our Class A common stock involves substantial risk. Before participating in this offering, you should carefully consider all of the information in this prospectus, including risks discussed in “Risk Factors” beginning on page 19 of this prospectus. In addition, while we have summarized the benefits from our solutions, our strengths and our growth strategy above, there are numerous risks and uncertainties that may prevent us from providing these benefits, capitalizing on these strengths or successfully executing our growth strategy. Some of our most significant risks are risks associated with:
| Ÿ | our ability to generate, maintain and expand sufficient unique, high-quality new and used car listings and consumer traffic on our websites; |
| Ÿ | our ability to maintain or increase our base of subscribing dealers who purchase listings on our websites or to increase our revenue from subscribing dealers; |
| Ÿ | our ability to compete effectively; |
| Ÿ | our ability to maintain or grow our base of advertising customers or increase revenue from existing advertisers; |
| Ÿ | conditions in the retail automotive industry; |
| Ÿ | our ability to maintain, protect and enhance our AutoTrader.com and Kelley Blue Book brands; |
| Ÿ | our marketing campaigns to promote AutoTrader.com and Kelley Blue Book; |
| Ÿ | our ability to successfully execute our growth strategy; |
| Ÿ | our limited ability to use the “AutoTrader.com” and “Trader” brand names, which we do not own and are licensed to us for limited uses, which may impact our ability to successfully expand into new or adjacent markets; |
| Ÿ | our ability to expand effectively into new markets; |
| Ÿ | restrictions in agreements with Manheim, Inc., or Manheim, which restrict our ability to expand into new or adjacent markets; |
| Ÿ | our election to take advantage of the controlled company exemption; |
| Ÿ | our relationship with CEI, including CEI’s majority ownership of our common stock, its concentrated ownership and voting rights following the offering and its right to nominate a majority of our directors until it owns less than 10% of our common stock outstanding as of the effective date, or the Charter Effective Date, of our second amended and restated certificate of incorporation, as amended, or our second amended and restated certificate of incorporation; and |
| Ÿ | conflicts of interest that may arise because some of our directors are principals of our principal stockholders. |
Principal Stockholders
CEI is a leading communications, media and automotive services company. With revenues of nearly $14.7 billion in 2011 and more than 50,000 employees, CEI’s major operating subsidiaries include Cox Communications, Inc., or CCI (cable television distribution, telephone, high-speed internet access, commercial telecommunications and advertising solutions); Manheim (vehicle auctions, repair and certification services and web-based technology products); and Cox Media Group, Inc. (television and radio stations, digital media, newspapers, advertising sales rep firms, Valpak and Cox Digital Solutions). Additionally, CEI operates Kudzu.com, a resource for consumers seeking services for their home and family.
8
Table of Contents
The Providence Funds acquired a 25% interest in us in 2010 and such investment is referred to as the Providence Investment. Providence Equity Partners is the world’s leading private equity firm focused on media, communications, education and information investments. The principals of Providence Equity Partners manage funds with $27 billion in commitments and have invested in more than 130 companies globally since the firm’s inception in 1989. Providence Equity Partners is headquartered in Providence, Rhode Island and has offices in New York, London, Beijing, Hong Kong and New Delhi.
April 2012 Dividend
On April 30, 2012, we amended our senior secured credit facilities, which we refer to as our credit facilities, to, among other things, provide for $400.0 million of additional borrowing capacity. On the same date, we drew down the additional capacity in connection with the payment of a special cash dividend to the then-existing common stock holders of AutoTrader.com, Inc. in an aggregate amount of $400.0 million, or $2.07 per share, to provide our stockholders with a return of invested capital and a return on their investment. We intend to use the net proceeds from this offering to repay existing indebtedness under our credit facilities and for other general corporate purposes. See “Use of Proceeds.”
Recent Developments
Amendment to Certificate of Incorporation and Stock Split
Effective September 30, 2012, our second amended and restated certificate of incorporation was amended to increase the number of authorized shares of our (i) Class A common stock from 250 million to 500 million and (ii) Class B common stock from 100 million to 200 million, and to effect a four-for-one stock split of our Class A common stock and our Class B common stock. Each holder of record of Class A common stock and Class B common stock on the close of business on the effective date received three additional shares for each share held. Except as otherwise indicated, all share and per share data presented in this prospectus, including in our financial statements and related notes thereto included elsewhere in this prospectus, reflect the impact of the increase in authorized shares and the stock split.
Investment in Bitauto
In November 2012, we agreed to acquire a 21.8% interest in Bitauto Holdings Limited, or Bitauto, for $58.5 million, subject to specified closing conditions. Bitauto is a provider of internet content and marketing services for China’s automotive industry. In connection with this investment, we entered into an agreement with certain members of Bitauto’s senior management team whereby we agreed to finance their purchase of $6.5 million of Bitauto shares. In exchange, they agreed to issue to us an aggregate principal amount of $6.5 million in senior secured guaranteed exchangeable bonds. See “Management’s Discussion and Analysis of Financial Condition and Results of Operations—Bitauto Investment.”
Relationship with CEI
We have an extensive, long-standing relationship with CEI. CEI owns all of our Class B common stock representing % of the voting power of our common stock after this offering (or % if the underwriters’ option to purchase additional shares is exercised in full). After this offering, CEI will have the right to nominate seven directors to our Board of Directors, or Board. CEI also provides various corporate and cash management services. We have also entered into a Related Party Agreement
9
Table of Contents
whereby we have agreed (i) not to pursue specified opportunities to the extent such opportunities are in the businesses actively pursued by Manheim or Cox Digital Exchange, LLC, or CDX, which consists primarily of wholesale vehicle auctions and related businesses, and (ii) not to pursue specified acquisitions without the consent of CEI. For more information about our relationship with CEI, see “Management—Board of Directors” and “Certain Relationships and Related Person Transactions—Agreements Related to CEI.”
Corporate Information
We are a Delaware corporation and were incorporated in 2012. ATC was originally formed in 1997 under the name AutoConnect, L.L.C., which we later changed to AutoTrader.com, LLC in 1999 and to AutoTrader.com, Inc. in 2006.
In May 2012, CEI and the Providence Funds formed AutoTrader Group, Inc. Pursuant to an Agreement and Plan of Merger, ATG’s wholly-owned subsidiary merged with and into ATC, with ATC as the surviving corporation, and resulting in ATC becoming a wholly-owned subsidiary of ATG. In the merger, the previous stockholders of ATC received stock of ATG as consideration for the merger. See “Certain Relationships and Related Person Transactions—Transactions of Securities.”
Our principal executive office is located at 3003 Summit Boulevard, Atlanta, Georgia 30319. Our telephone number at our principal executive office is (404) 568-8000. Our corporate website is www.AutoTraderGroup.com. The information on our corporate website or any of our other websites is not part of, and is not incorporated by reference into, this prospectus.
10
Table of Contents
| Class A common stock offered by us |
shares ( shares if the underwriters’ option to purchase additional shares is exercised in full). |
| Class A common stock to be outstanding after this offering |
shares ( shares if the underwriters’ option to purchase additional shares is exercised in full). |
| Class B common stock to be outstanding after this offering |
shares. |
| Total Class A common stock and Class B common stock to be outstanding after this offering |
shares ( shares if the underwriters’ option to purchase additional shares is exercised in full). |
| Option to purchase additional shares of Class A common stock |
The underwriters may also purchase up to a maximum of additional shares of Class A common stock from us. The underwriters can exercise this option at any time within 30 days from the date of this prospectus. |
| Use of proceeds |
We estimate that the net proceeds to us from our sale of shares of Class A common stock in this offering will be approximately $ million, after deducting underwriting discounts and commissions and estimated expenses payable by us in connection with this offering. This assumes a public offering price of $ , which is the midpoint of the price range set forth on the cover of this prospectus. We intend to use these net proceeds to repay existing indebtedness under our credit facilities and for other general corporate purposes. See “Use of Proceeds.” |
| Dividend policy |
We do not anticipate paying any dividends on our Class A common stock in the foreseeable future; however, we may change this policy in the future. See “Dividend Policy.” |
| Voting rights |
We have two classes of authorized common stock: Class A common stock and Class B common stock. The rights of the holders of Class A common stock and Class B common stock are identical, except with respect to voting and conversion. The holders of Class A common stock are entitled to one vote per share, and the holders of Class B common stock are entitled to 10 votes per share, on all matters that are subject to a stockholder vote. The Class B common stock is convertible at any time, or from time to time, at the option of the holder of the Class B common stock, into Class A common stock on a share-for-share basis. In addition, the shares of our Class B |
11
Table of Contents
| common stock will automatically convert into Class A common stock on a share-for-share basis (1) upon the sale or other transfer to a person that is not a CEI Related Party (as defined in the Related Party Agreement), and (2) on the first date on which the beneficial owners of our Class B common stock as of the Charter Effective Date have sold or otherwise transferred shares such that the beneficial owners of our Class B common stock hold, directly or indirectly, or are the beneficial owners of, 10% or less of the aggregate number of shares of common stock outstanding as of the Charter Effective Date. Immediately following this offering, our public stockholders will have % of the voting power, or % if the underwriters exercise in full their option to purchase additional shares. See “Description of Capital Stock” for additional information. |
| Conflicts of interest |
We expect to use more than 5% of the net proceeds from the sale of the Class A common stock to repay indebtedness under our credit facilities owed by us to certain affiliates of the underwriters. See “Use of Proceeds.” Accordingly, the offering is being made in compliance with the requirements of Rule 5121 of the Financial Industry Regulatory Authority’s conduct rules, or Rule 5121. This rule provides generally that if more than 5% of the net proceeds from the sale of securities, not including underwriting compensation, is paid to the underwriters or their affiliates, a “qualified independent underwriter,” as defined in Rule 5121, must participate in the preparation of the registration statement of which this prospectus forms a part and perform its usual standard of due diligence with respect thereto. is assuming the responsibilities of acting as the qualified independent underwriter in conducting due diligence. See “Underwriting—Conflicts of Interest.” |
| Risk factors |
Investing in our Class A common stock involves a high degree of risk. See “Risk Factors” beginning on page 19 of this prospectus for a discussion of factors you should carefully consider before investing in our Class A common stock. |
| Proposed New York Stock Exchange, or NYSE, symbol |
“ATG.” |
Unless otherwise indicated, the number of shares of our Class A common stock and our Class B common stock to be outstanding after this offering:
| Ÿ | gives effect to the four-for-one split of our common stock effective September 30, 2012; |
| Ÿ | gives effect to the exchange of common stock of ATC for common stock of ATG in connection with the formation of ATG; |
| Ÿ | gives effect to our third amended and restated certificate of incorporation, which will be in effect prior to the consummation of this offering; |
12
Table of Contents
| Ÿ | excludes shares of Class A common stock reserved for issuance under our 2012 Long-Term Incentive Plan; |
| Ÿ | excludes shares of Class A common stock reserved for issuance under our Director Restricted Stock Plan; |
| Ÿ | does not give effect to any conversion of Class B common stock into Class A common stock; and |
| Ÿ | assumes no exercise of the underwriters’ option to purchase up to additional shares from us. |
Also see “Description of Capital Stock” and “Certain Relationships and Related Person Transactions—Transactions of Securities.”
Unless otherwise indicated, this prospectus assumes an initial public offering price of $ per share, the midpoint of the price range set forth on the cover of this prospectus.
13
Table of Contents
SUMMARY HISTORICAL CONSOLIDATED FINANCIAL AND OTHER DATA
The following tables set forth our summary historical consolidated financial and other data for the periods and as of the dates indicated. We derived the consolidated statements of income data for the years ended December 31, 2009, 2010 and 2011 from our audited consolidated financial statements and related notes thereto included elsewhere in this prospectus. The consolidated statements of income data for the six months ended June 30, 2011 and 2012 and consolidated balance sheet data as of June 30, 2012 have been derived from our unaudited consolidated financial statements included elsewhere in this prospectus.
The summary unaudited as adjusted balance sheet data as of June 30, 2012 has been prepared to give effect to the sale of our Class A common stock in this offering and the application of the net proceeds from this offering as described in “Use of Proceeds.”
Our historical results are not necessarily indicative of future operating results. You should read the information set forth below together with “Selected Consolidated Financial Data,” “Management’s Discussion and Analysis of Financial Condition and Results of Operations,” “Capitalization” and our financial statements and the related notes thereto included elsewhere in this prospectus.
| Year ended December 31, |
Six Months ended June 30, |
|||||||||||||||||||
| 2009 | 2010 | 2011 | 2011 | 2012 | ||||||||||||||||
| (in thousands) | ||||||||||||||||||||
| Consolidated statement of income data: |
||||||||||||||||||||
| Revenues |
||||||||||||||||||||
| Digital Media |
$ | 629,450 | $ | 725,890 | $ | 917,041 | $ | 446,753 | $ | 486,103 | ||||||||||
| Software Solutions |
— | 11,937 | 108,136 | 43,212 | 76,988 | |||||||||||||||
|
|
|
|
|
|
|
|
|
|
|
|||||||||||
| Total revenues |
$ | 629,450 | $ | 737,827 | $ | 1,025,177 | $ | 489,965 | $ | 563,091 | ||||||||||
|
|
|
|
|
|
|
|
|
|
|
|||||||||||
| Operating Expenses |
||||||||||||||||||||
| Operations(1) |
106,190 | 117,471 | 197,187 | 91,225 | 111,620 | |||||||||||||||
| Sales and marketing(1) |
331,285 | 371,060 | 402,054 | 202,455 | 218,549 | |||||||||||||||
| General and administrative(1) |
55,605 | 68,293 | 117,381 | 57,149 | 64,758 | |||||||||||||||
| Depreciation and amortization |
120,471 | 65,325 | 122,951 | 61,224 | 63,919 | |||||||||||||||
| Impairment of goodwill |
— | — | 36,216 | — | 11,112 | |||||||||||||||
| Impairment of intangible assets |
— | — | — | — | 4,544 | |||||||||||||||
| Other |
1,374 | 1,131 | 9,634 | 6,043 | 873 | |||||||||||||||
|
|
|
|
|
|
|
|
|
|
|
|||||||||||
| Total operating expenses |
614,925 | 623,280 | 885,423 | 418,096 | 475,375 | |||||||||||||||
|
|
|
|
|
|
|
|
|
|
|
|||||||||||
| Income from operations |
14,525 | 114,547 | 139,754 | 71,869 | 87,716 | |||||||||||||||
| Total other income (expense) |
379 | (40,066 | ) | (33,011 | ) | (17,321 | ) | (15,969 | ) | |||||||||||
|
|
|
|
|
|
|
|
|
|
|
|||||||||||
| Income before income taxes |
14,904 | 74,481 | 106,743 | 54,548 | 71,747 | |||||||||||||||
| Income tax expense |
5,045 | 25,357 | 38,692 | 22,403 | 30,135 | |||||||||||||||
|
|
|
|
|
|
|
|
|
|
|
|||||||||||
| Net income |
$ | 9,859 | $ | 49,124 | $ | 68,051 | $ | 32,145 | $ | 41,612 | ||||||||||
|
|
|
|
|
|
|
|
|
|
|
|||||||||||
14
Table of Contents
| Year ended December 31, |
Six Months ended June 30, |
|||||||||||||||||||
| 2009 | 2010 | 2011 | 2011 | 2012 | ||||||||||||||||
| (in thousands) | ||||||||||||||||||||
| Other data: |
||||||||||||||||||||
| Adjusted EBITDA(2) |
$ | 155,469 | $ | 212,026 | $ | 334,554 | $ | 152,132 | $ | 176,318 | ||||||||||
| Monthly Unique Visitors(3) |
||||||||||||||||||||
| AutoTrader.com |
13,488 | 13,977 | 15,016 | 15,415 | 16,661 | |||||||||||||||
| KBB.com |
10,800 | 11,392 | 12,517 | 12,918 | 14,386 | |||||||||||||||
| As of December 31, |
As of June 30, |
|||||||||||||||||||
| 2009 | 2010 | 2011 | 2011 | 2012 | ||||||||||||||||
| (listings in thousands) | ||||||||||||||||||||
| Digital Media |
||||||||||||||||||||
| Subscribing Dealers(4) |
19,517 | 19,839 | 20,307 | 20,116 | 20,218 | |||||||||||||||
| MRR(5) |
$ | 2,267 | $ | 2,612 | $ | 3,001 | $ | 2,729 | $ | 3,183 | ||||||||||
| Software Solutions(6) |
||||||||||||||||||||
| Subscribing Dealers(7) |
— | — | 4,889 | — | 5,534 | |||||||||||||||
| MRR(8) |
$ | — | $ | — | $ | 1,750 | $ | — | $ | 1,892 | ||||||||||
| Number of Listings(9) |
2,774 | 3,300 | 3,409 | 3,076 | 3,666 | |||||||||||||||
| As of June 30, 2012 |
||||||||
| Actual | As adjusted(10) |
|||||||
| (in thousands) | ||||||||
| Consolidated balance sheet data: |
||||||||
| Amounts due from (to) CEI(11) |
$ | (2,102 | ) | $ | ||||
| Total assets |
1,485,748 | |||||||
| Total long-term debt and capital leases, including current portion |
1,284,790 | |||||||
| Total stockholders’ equity (deficit) |
(89,501 | ) | ||||||
| (1) | Long-term incentive compensation included in above line items: |
| Year ended December 31, |
Six Months ended June 30, |
|||||||||||||||||||
| 2009 | 2010 | 2011 | 2011 | 2012 | ||||||||||||||||
| (in thousands) | ||||||||||||||||||||
| Operations |
$ | 2,170 | $ | 4,514 | $ | 2,873 | $ | 1,279 | $ | 728 | ||||||||||
| Sales and marketing |
6,172 | 12,835 | 9,118 | 4,060 | 3,312 | |||||||||||||||
| General and administrative |
3,218 | 6,691 | 7,145 | 3,182 | 3,199 | |||||||||||||||
|
|
|
|
|
|
|
|
|
|
|
|||||||||||
| Total |
$ | 11,560 | $ | 24,040 | $ | 19,136 | $ | 8,521 | $ | 7,239 | ||||||||||
|
|
|
|
|
|
|
|
|
|
|
|||||||||||
| (2) | Adjusted EBITDA is calculated as net income before income tax expense, other (income) expense, other operating expense and depreciation and amortization, adjusted for: |
| Ÿ | long-term incentive compensation; |
| Ÿ | impairment of goodwill and intangible assets; |
| Ÿ | acquisition transaction costs; and |
| Ÿ | severance costs. |
15
Table of Contents
Adjusted EBITDA eliminates the effects of items that we do not consider indicative of our core operating performance. Adjusted EBITDA is a supplemental measure of operating performance that does not represent and should not be considered as an alternative to net income, as determined by U.S. generally accepted accounting principles, or GAAP, and our calculation of Adjusted EBITDA may not be comparable to that reported by other companies.
Management uses Adjusted EBITDA or comparable metrics:
| Ÿ | as a measurement used in comparing our operating performance on a consistent basis; |
| Ÿ | for planning purposes, including the preparation of our internal annual operating budget; |
| Ÿ | to evaluate the performance and effectiveness of our operational strategies; and |
| Ÿ | to assess compliance with various metrics associated with our debt agreements. |
Management believes the inclusion of Adjusted EBITDA is appropriate to provide additional information to investors about certain material non-cash items and about unusual items that we do not expect to continue at the same level in the future. By providing this non-GAAP financial measure, together with a reconciliation to GAAP results, we believe we are enhancing investors’ understanding of our business and our results of operations, as well as assisting investors in evaluating how well we are executing strategic initiatives. We believe Adjusted EBITDA is used by investors as a supplemental measure to evaluate the overall operating performance of companies in our industry.
Adjusted EBITDA has limitations as an analytical tool, and you should not consider it in isolation, or as a substitute for analysis of our results as reported under GAAP. Some of the limitations are:
| Ÿ | Adjusted EBITDA does not reflect the interest expense, or the cash requirements necessary for interest and principal payments, on our debt; |
| Ÿ | although depreciation and amortization are non-cash charges, the assets being depreciated and amortized may have to be replaced in the future, and Adjusted EBITDA does not reflect the cash requirements for such replacements; |
| Ÿ | Adjusted EBITDA does not reflect our tax expense or the cash requirements to pay our taxes; and |
| Ÿ | Adjusted EBITDA does not reflect the non-cash component of employee compensation. |
To address these limitations, we reconcile Adjusted EBITDA to the most directly comparable GAAP measure, net income. Further, we also review GAAP measures and evaluate individual measures that are not included in Adjusted EBITDA.
In calculating Adjusted EBITDA, we exclude long-term incentive compensation expense from Adjusted EBITDA because incentive awards made at a certain price and point in time do not necessarily reflect how our business is performing at any particular time, and the related long-term incentive compensation expense includes non-cash expense and is not a key measure of our core operating performance. We exclude acquisition transaction and severance costs as they are transaction or event-specific and are not indicative of our core operations. We exclude impairment of goodwill and impairment of intangible assets as they are non-cash charges and not indicative of our core operations.
16
Table of Contents
The following table provides a reconciliation of our net income to Adjusted EBITDA for the periods presented:
| Year ended December 31, |
Six Months ended June 30, |
|||||||||||||||||||
| 2009 | 2010 | 2011 | 2011 | 2012 | ||||||||||||||||
| (in thousands) | ||||||||||||||||||||
| Net income |
$ | 9,859 | $ | 49,124 | $ | 68,051 | $ | 32,145 | $ | 41,612 | ||||||||||
| Income tax expense |
5,045 | 25,357 | 38,692 | 22,403 | 30,135 | |||||||||||||||
| Other (income) expense |
(379 | ) | 40,066 | 33,011 | 17,321 | 15,969 | ||||||||||||||
| Other operating expense(a) |
1,374 | 1,131 | 9,634 | 6,043 | 873 | |||||||||||||||
| Depreciation and amortization |
120,471 | 65,325 | 122,951 | 61,224 | 63,919 | |||||||||||||||
|
|
|
|
|
|
|
|
|
|
|
|||||||||||
| Subtotal |
136,370 | 181,003 | 272,339 | 139,136 | 152,508 | |||||||||||||||
|
|
|
|
|
|
|
|
|
|
|
|||||||||||
| Long-term incentive compensation(b) |
11,560 | 24,040 | 19,136 | 8,521 | 7,239 | |||||||||||||||
| Impairment of goodwill(c) |
— | — | 36,216 | — | 11,112 | |||||||||||||||
| Impairment of intangible assets(d) |
— | — | — | — | 4,544 | |||||||||||||||
| Acquisition transaction costs(e) |
— | 5,249 | 880 | 880 | — | |||||||||||||||
| Severance costs(f) |
7,539 | 1,734 | 5,983 | 3,595 | 915 | |||||||||||||||
|
|
|
|
|
|
|
|
|
|
|
|||||||||||
| Adjusted EBITDA |
$ | 155,469 | $ | 212,026 | $ | 334,554 | $ | 152,132 | $ | 176,318 | ||||||||||
|
|
|
|
|
|
|
|
|
|
|
|||||||||||
| (a) | Other operating expense primarily consists of the post-acquisition increases in the fair value of the earn-outs associated with the vAuto and VinSolutions acquisitions as well as gains and losses on the sale or disposal of assets. |
| (b) | Long-term incentive compensation includes non-cash compensation expense recorded related to stock options, restricted stock awards, stock appreciation rights and cash-based awards issued to our employees. See Note 14, “Long-Term Incentive Compensation,” to our audited financial statements included elsewhere in this prospectus. |
| (c) | Impairment of goodwill consists of goodwill impairment charges attributable to HomeNet, which we recognized as a result of reduced future cash flow projections for HomeNet from lower revenues and incremental expenses attributable to our new data licensing agreement with CEI. |
| (d) | Impairment of intangible assets consists of an intangible asset impairment charge attributable to HomeNet, which we recognized as a result of reduced future cash flow projections for HomeNet. |
| (e) | Acquisition transaction costs include legal and professional fees and related financing costs. |
| (f) | Severance costs include costs associated with our personnel reductions, including reductions associated with ceasing the AutoTrader Classics and AutoTrader Latino print publications in 2011 and departmental restructurings. |
| (3) | Represents the average number of monthly unique visitors who have visited AutoTrader.com or KBB.com, as applicable, at least once in a given month for each month in the period presented, adding them together and then dividing the sum by the number of months in the period. For the six months ended June 30, 2012, the overlap of unique visitors on AutoTrader.com and KBB.com was 2.4 million, excluding mobile visitors, or 9% of the combined average monthly unique visitors |
| on the two websites. KBB.com unique visitor data includes data for periods prior to our acquisition |
17
Table of Contents
| of Kelley Blue Book in December 2010. See “Management’s Discussion and Analysis of Financial Condition and Results of Operations—Key Metrics—Monthly Unique Visitors.” |
| (4) | Represents the number of dealers subscribing to one or more of our Digital Media monthly listing packages on the last day of the period. As of December 31, 2009 and 2010, and June 30, 2011, the number of subscribing dealers includes subscribing dealers for AutoTrader.com only. See “Management’s Discussion and Analysis of Financial Condition and Results of Operations—Key Metrics—Number of Subscribing Dealers and Monthly Run Rate (MRR).” |
| (5) | We define Digital Media MRR as the monthly run rate of subscription-related revenues for our featured and premium listings and our TIM service as well as on-going purchases of à la carte enhancement services as of the last day of the period, divided by the number of Digital Media subscribing dealers at period end. As of December 31, 2009 and 2010, and June 30, 2011, Digital Media MRR is based on revenues and subscribing dealers for AutoTrader.com only. See “Management’s Discussion and Analysis of Financial Condition and Results of Operations—Key Metrics—Number of Subscribing Dealers and Monthly Run Rate (MRR).” |
| (6) | Since we recently acquired the businesses that make up our Software Solutions segment, we did not track Software Solutions Subscribing Dealers or Software Solutions MRR prior to the fourth quarter of 2011. See “Management’s Discussion and Analysis of Financial Condition and Results of Operations—Key Metrics—Number of Subscribing Dealers and Monthly Run Rate (MRR).” |
| (7) | Represents the number of dealers subscribing to one or more of our software solutions on the last day of the period. We did not track Software Solutions subscribing dealers prior to the fourth quarter of 2011. See “Management’s Discussion and Analysis of Financial Condition and Results of Operations—Key Metrics—Number of Subscribing Dealers and Monthly Run Rate (MRR).” |
| (8) | We define Software Solutions MRR as the monthly run rate of subscription-related revenue from our Software Solutions business as of the last day of the period, divided by the number of Software Solutions subscribing dealers at period end. We did not track Software Solutions MRR prior to the fourth quarter of 2011. See “Management’s Discussion and Analysis of Financial Condition and Results of Operations—Key Metrics—Number of Subscribing Dealers and Monthly Run Rate (MRR).” |
| (9) | Represents the total number of car listings on AutoTrader.com on the last day of the period. See “Management’s Discussion and Analysis of Financial Condition and Results of Operations—Key Metrics—Number of Listings.” |
| (10) | Gives effect to the sale by us of shares of Class A common stock in this offering at an initial public offering price of $ per share (the midpoint of the price range set forth on the cover of this prospectus) and the application of the net proceeds to be received by us from this offering, as more fully described in “Use of Proceeds,” as if each had occurred as of June 30, 2012. |
| (11) | CEI provides cash management services to us. This amount represents the net outstanding balance of our cash balances held by CEI offset by the amounts due to CEI for the provision of certain specified services. See “Certain Relationships and Related Person Transactions—Agreements Related to CEI—Cash Management Agreement.” |
18
Table of Contents
Investing in our Class A common stock involves a high degree of risk. You should carefully consider the following risks, as well as the other information contained in this prospectus, before making an investment in our Class A common stock. If any of the following risks actually occur, our business, results of operations and financial condition may be materially adversely affected. In such an event, the trading price of our Class A common stock could decline and you could lose part or all of your investment.
Risks Related to Our Business and Industry
If we fail to generate, maintain and expand sufficient unique, high-quality new and used car listings on our websites, our traffic and revenue could be materially and adversely affected.
Our Digital Media business depends in part on our ability to generate, maintain and expand unique, high-quality car listings, particularly used car listings. We receive a substantial portion of our Digital Media revenue from our subscribing dealers, who pay us monthly subscription fees in order to enhance the visibility of their used car listings. In addition, our future growth is dependent in part on our ability to increase the number of unique, high-quality new car listings on AutoTrader.com and KBB.com that are paid for by subscribing dealers. If subscribing dealers do not provide and pay for listings, or if we are unable to provide consumers with the types of listings they seek or if they can find comparable listings through other websites or services, they may stop or reduce their use of AutoTrader.com and KBB.com, and traffic to AutoTrader.com or KBB.com will decline. If our user traffic declines, our dealers and advertisers may stop listing cars or advertising on our websites, or reduce the number of paid listings, or the amount they are willing to pay for listings or advertising on our websites. In the event of any of the foregoing, our business, results of operations and financial condition would be materially and adversely affected.
If we fail to maintain or increase our base of subscribing dealers who purchase listings on our websites or increase our revenue from subscribing dealers, our business, results of operations and financial condition would be materially and adversely affected.
In 2010, 2011 and the six months ended June 30, 2012, 68%, 60% and 62%, respectively, of our revenue in our Digital Media business was generated by the sale of paid listings to dealers on AutoTrader.com. In June 2012, we began providing dealers with the option of listing new and used cars on KBB.com. We employ a “pay for placement” model that allows subscribing dealers to achieve higher placement of their listings on our search results page. There are several tiers of listings for subscribing dealers, including standard, featured and premium. Our higher-priced listing packages offer more prominent placements and more features than our standard listing packages, which are offered to private sellers for a minimal price and to non-subscribing dealers free of charge. Our ability to grow our business depends, in part, on the ability of our sales force to demonstrate to our subscribing dealers the value of our premium classified listings packages and the benefits of additional features and to persuade them to purchase our higher-priced listing packages.
Expanding our base of Digital Media subscribing dealers may not significantly increase revenues in our Digital Media business. Many of the dealers that do not currently list their cars on our websites are smaller franchise and independent dealers, which generally sell fewer cars and have smaller advertising budgets. Even if these dealers were to become Digital Media subscribing dealers, their size limits the amount they will be able to spend for our listing packages.
Subscribing dealers do not have long-term obligations to purchase listings on our websites or to remain at a specified tier. If subscribing dealers do not continue to list their vehicles at the same
19
Table of Contents
monthly subscription price level or at an increased price level, if we experience significant attrition or downgrading of tiers by subscribing dealers, if we are unable to attract new dealers in numbers greater than the number of subscribing dealers that we lose, or if we are unable to increase the share of listing revenue from our subscribing dealers, our revenue will decrease and our business, results of operations and financial condition would be materially and adversely affected.
Our Digital Media and Software Solutions businesses face intense competition, and if we are unable to compete effectively, our business, results of operations and financial condition would be materially and adversely affected.
The markets in which we operate are intensely competitive, highly fragmented and rapidly changing. With the emergence of new technologies and new market entrants, competition is likely to intensify in the future.
In our Digital Media business, our primary competitors include offline media companies, including newspaper publishers and television and radio broadcasters. We also compete directly with automobile-specific online service providers such as Cars.com, TRUECar.com, Edmunds.com, classified ad websites such as eBay Motors, Craigslist and newspaper websites and search engines such as Google, Bing and Yahoo!, social media networks such as Facebook and the websites of dealers who are not our customers. Some of our competitors may be more successful than us in developing and marketing online advertising solutions directly to dealers and brand advertisers. In addition, many of our existing dealers and advertisers and potential dealers and advertisers may choose to purchase or use online advertising services from these or other competitors and may therefore reduce their purchases of our services. We also compete with these companies for the attention of consumers, and may experience decreases in both advertising and consumer traffic if our competitors offer more compelling environments to research or shop for automobiles.
The dealer software industry is highly fragmented and is served by a variety of inventory management, dealer management, valuation and pricing, lead and CRM and finance and insurance solutions providers. These providers include DealerSocket, Reynolds & Reynolds, Automatic Data Processing, Inc., or ADP, DealerTrack and Dealer.com, which offer several of these software solutions. These or other competitors may be more successful than us in marketing their software solutions to dealers, or offering a more comprehensive suite of services, which may reduce our Software Solutions business revenue.
Some of our competitors enjoy competitive advantages, such as greater name recognition, longer operating histories, substantially greater market share, larger existing customer bases and substantially greater financial, technical and other resources. These companies may use these advantages to offer services similar to ours at a lower price, develop competitive services and respond more quickly and effectively than we do to new or changing opportunities, technologies, standards or consumer, dealer or advertiser requirements. As the online advertising and dealer software markets develop, new competitors, business models and solutions are likely to emerge. In addition, many of our current and potential competitors have established longstanding relationships with—and access to—dealer and advertiser customer bases. For all of these reasons, we may be unable to maintain or grow the number of consumers who use our websites, the number of dealers that use our digital media and software solutions or the number of dealers and brand advertisers that advertise on our websites, and we may face pressure to reduce the price of our solutions, in which case our business, results of operations and financial condition would be materially and adversely affected.
20
Table of Contents
We may be unable to maintain or grow our base of advertising customers or increase our revenue from our existing advertisers, in which case our business, results of operations and financial condition will be harmed.
In 2010, 2011 and the six months ended June 30, 2012, 12%, 18% and 17%, respectively, of our revenue in our Digital Media business was generated by the sale of advertising. Many dealers and brand advertisers spend more of their advertising budgets on traditional advertising methods, such as newspapers, television and radio. In 2010, franchise dealers spent 24% of their advertising dollars on the internet, according to National Automobile Dealers Association, or NADA. Our ability to grow our advertising revenue depends on our effectiveness in convincing our advertising customers, including dealers and brand advertisers, to expand their advertising on our websites and to continue to shift their automotive advertising budgets to the internet and away from traditional media. To do so, we must demonstrate to these customers the benefits of our advertising solutions. Failure to maintain and expand our advertiser base could have a material adverse effect on our business, results of operations and financial condition.
Our advertising customers do not have long-term obligations to purchase advertising from us. We rely heavily on advertising spending by automobile dealers, which often have limited advertising budgets. As a result, we have experienced, and will in the future experience, spending fluctuations from these customers in the ordinary course of business resulting from several factors, including advertisers seeking to spend more of their advertising budget on competitors’ websites or offline media, perceptions that our advertising solutions are unnecessary or ineffective, declining advertising budgets, dealer closures and bankruptcies or poor economic conditions. Additionally, there are a limited number of OEMs, most of which already advertise on our websites. In order to grow our advertising revenue from these OEMs, we need to increase the portion of their advertising budgets that we receive from them.
If the rates of renewal for our advertising customers decrease, if we experience a significant decrease in advertising spending, if we are unable to attract new advertisers in numbers greater than the number of advertisers that we lose, if we are unable to raise rates or rates decline, if we are unable to increase the share of advertising revenue from dealers and other advertisers or if the number of advertising impressions on our websites declines for any reason, our revenue will decrease and our business, results of operations and financial condition would be materially and adversely affected.
Dealer closures or consolidation could reduce demand for, and the pricing of, our solutions, thereby leading to decreased earnings.
The number of automotive dealers declined in 2009 and 2010 due to closures and consolidation as a result of such factors as the global economic downturn in 2008 and 2009. Excluding fleet sales, U.S. vehicle sales declined by 6% in 2009, according to LMC Automotive. In addition, many dealers closed or consolidated, and the overall automotive advertising market declined by 29%, according to Forrester Research. In 2009, these poor economic conditions adversely impacted our results of operations in our Digital Media business. When dealers consolidate, the services they previously purchased separately are often purchased by the combined entity in a lesser quantity than before, leading to volume compression and loss of revenue. Further consolidation or closures of automobile dealers could reduce the aggregate demand for our services in the future and could limit the amounts we earn for our solutions. If dealer closures and consolidations continue to occur in the future, our business, financial position and results of operations could be materially and adversely affected.
21
Table of Contents
Our business depends on strong AutoTrader.com and Kelley Blue Book brands, and any failure to maintain, protect and enhance our AutoTrader.com and Kelley Blue Book brands could hurt our ability to retain or expand our base of consumers, dealers and advertisers, and our ability to increase the frequency with which they use our solutions.
We believe maintaining and increasing the strong recognition of our AutoTrader.com and Kelley Blue Book brands is critical to our future success. AutoTrader.com is known for attracting a large base of in-market car shoppers and having what we believe is the largest collection of unique new and used car listings for consumers to view. In addition, consumers, dealers and the automotive finance and insurance industry, including banks, insurance companies and the government, rely on the credibility of automobile valuations made by Kelley Blue Book, which is a critical component of that brand. In order to grow our business, we must maintain, protect and enhance the AutoTrader.com and Kelley Blue Book brands. Otherwise, we will be unable to expand our base of consumers, dealers and advertisers, or increase the frequency with which they use or purchase our solutions. Expanding our business will depend largely on our ability to maintain the trust consumers, dealers and advertisers, as well as the automotive finance and insurance industry, place in our solutions and the quality and integrity of the listings and other content found on AutoTrader.com and KBB.com, including the valuations calculated by Kelley Blue Book. In addition, any negative publicity about us, including about our solutions, technologies, sales practices, personnel or customer service, could diminish confidence in and the use of our solutions. If negative publicity about us persists, or if consumers otherwise perceive that content on our websites is not reliable, our reputation, the value of our brands and traffic to our websites could decline, and our business, results of operations and financial condition could be materially and adversely affected.
Our marketing campaigns to promote AutoTrader.com and Kelley Blue Book may not be successful.
We currently advertise through high-profile television and radio marketing campaigns and sponsorship programs, the goal of which is to increase the strength, recognition and trust in our brands and drive greater consumer traffic to our websites and mobile applications. In 2009, 2010, 2011 and the six months ended June 30, 2012, we spent approximately $87 million, $96 million, $111 million and $62 million, respectively, on such campaigns and programs. We cannot guarantee that our marketing efforts in traditional media will allow us to reach our targeted audience of in-market car shoppers or if continued marketing investments will result in new or additional consumers visiting our websites or using our mobile applications, or recover such costs by attaining corresponding revenue growth. If we are unable to recover our marketing costs through an increase in the number of consumers, dealers or advertisers using or purchasing our digital media solutions, or if we discontinue our broad marketing campaigns, it could have a material adverse effect on our business, results of operations and financial condition.
We have made strategic acquisitions in the past and may do so in the future. If we are unable to find suitable acquisitions or partners or to achieve expected benefits from future acquisitions, partnerships or other strategic investments, there could be a material adverse effect on our business, results of operations and financial condition.
Acquisitions, partnerships, joint ventures and strategic investments are a part of our growth strategy. Since 2009, we acquired Kelley Blue Book, vAuto, VinSolutions and HomeNet, as well as several smaller companies, and in November 2012, we agreed to acquire a 21.8% interest in Bitauto. As part of our on-going business strategy to expand the number and capabilities of our solutions and acquire new technologies, we frequently engage in discussions with third parties regarding, and enter into agreements relating to, possible acquisitions, strategic alliances and joint ventures. There may be significant competition for acquisition, partnership, strategic investments and joint venture targets in our industry, or we may not be able to identify suitable candidates or negotiate attractive terms for
22
Table of Contents
acquisitions, partnerships, strategic investments and joint ventures. In addition, we have to obtain the consent of the holders of a majority of our outstanding Class B common stock (which currently is held by affiliates of CEI) in order to enter into specified acquisitions, loans to third parties or equity investments. If we are unable to identify future acquisition, partnership, strategic investment or joint venture opportunities, reach agreement with such third parties, obtain the financing necessary to enter into such transactions or obtain any required consents, we could lose market share to competitors who are able to make such acquisitions, partnerships, strategic investments and joint ventures, which could have a material adverse effect on our business, results of operations and financial condition.
Even if we are able to complete acquisitions or enter into partnerships, strategic investments and joint ventures that we believe will be successful, such transactions are inherently risky. Significant risks for these transactions include:
| Ÿ | integration and restructuring costs, both one-time and on-going; |
| Ÿ | developing and maintaining sufficient controls, policies and procedures; |
| Ÿ | diversion of management’s attention from on-going business operations; |
| Ÿ | establishing new informational, operational and financial systems to meet the needs of our business; |
| Ÿ | losing key employees, customers and vendors; |
| Ÿ | failing to achieve anticipated synergies, including with respect to complementary services; |
| Ÿ | exposure to litigation or other potential liabilities, including but not limited to, environmental liabilities related to entities that we acquire, or that were previously acquired or divested by such acquired entities; |
| Ÿ | exposure to laws and regulations, including but not limited to the Foreign Corrupt Practices Act or other anti-bribery laws and limitations on foreign investments in foreign jurisdictions, including the People’s Republic of China; |
| Ÿ | difficulty enforcing our legal rights in foreign jurisdictions, including the People’s Republic of China; |
| Ÿ | failing to achieve an adequate return on our partnerships, strategic investments and joint ventures; and |
| Ÿ | unanticipated and unknown liabilities. |
If we are not successful in completing transactions in the future, we may be required to reevaluate our strategy. We also may incur substantial expenses and devote significant management time and resources in seeking to complete such transactions. In addition, we could use substantial portions of our available cash or debt capacity to pay all or a portion of the purchase price of future acquisitions. If we do not achieve the anticipated benefits of our transactions as rapidly or to the extent anticipated by our management, our business, results of operations and financial condition may be materially and adversely affected.
We do not own the “AutoTrader.com” trademark. The AutoTrader.com and Trader brand names are licensed to us by TPI Holdings, Inc. only for specific goods and services, which may limit our ability to control the strength of such brand names and expand our business into adjacent and new markets under the “AutoTrader.com” and “Trader” trademarks.
Our trademarks are an important element of our business. The AutoTrader.com brand has been key to our marketing strategy for consumers, dealers and advertisers. TPI Holdings, Inc. owns the
23
Table of Contents
“Trader” and “AutoTrader.com” trademarks. Under our trademark license agreement for these trademarks, we are prohibited from using the term “Trader” in combination with words that relate to (i) motorcycles, RVs, ATVs, dune buggies, go-carts, golf carts, snow mobiles, boats, yachts, personal watercrafts, commercial light trucks, big trucks, construction and heavy equipment, trailers and aircrafts, and parts and accessories for these products and (ii) apartments, condominiums, homes, employment, travel and multiple categories of general merchandise, which are all exclusively licensed by TPI Holdings, Inc. to Trader Publishing Company, or Trader Publishing. For example, under the license agreement, we are prohibited from launching a website branded with the trademark AutoTrader.com Motorcycles. In addition, we are prohibited from using any Trader trademark for a print publication or website (other than AutoTrader.com) if (i) 50% or more of the advertisements in such publication or website are for products that fall within the categories exclusive to Trader Publishing or (ii) products within the Trader Publishing categories are advertised on the home page of such website. Although the trademark license agreement for the AutoTrader.com and Trader trademarks does not limit our ability to include advertisements in adjacent and new markets on AutoTrader.com or on a non-Trader branded website, it does limit our right to expand use of the Trader trademark into adjacent and new markets, which could have a materially adverse effect on our business, results of operations and financial condition.
If we expand into new markets, we may not have the right to use the AutoTrader.com and Kelley Blue Book brands in such markets.
If we expand our business into new geographic markets, adjacent markets in the automotive industry or new industry verticals, we may not have the ability to adopt trademarks or domain names that are identical or similar to trademarks and domain names that we use in the United States. We have faced in the past, and may face in the future, oppositions from third parties to our use of trademarks and applications to register key trademarks in domestic and foreign jurisdictions in which we expect to develop or expand our presence. Third parties may have already adopted identical or similar trademarks to the ones that we use for our services. If we are unsuccessful in defending against these oppositions, our trademark applications may be denied. We could be forced to pay significant settlement costs or cease the use of these trademarks and associated elements of our brands in those or other jurisdictions. For example, we agreed pursuant to a settlement agreement not to use the AutoTrader.com logo on automotive classified websites in the European Union. International expansion may require us to adopt and promote new trademarks, which may be expensive and place us at a competitive disadvantage.
If we obtain the rights to any trademark that incorporates the Trader or AutoTrader.com brand, or any domain name that uses the term “Trader,” we will need to contribute these assets to TPI Holdings.
In the event we acquire any trademarks that incorporate the term “Trader,” or any domain name comprised solely of the term “Trader” with a top-level domain, we must contribute these trademarks or domain names as capital to TPI Holdings. To the extent that trademarks or domain names must be contributed, Trader Publishing would have the exclusive right to use the contributed trademarks or domain names in connection with (i) motorcycles, RVs, ATVs, dune buggies, go-carts, golf carts, snow mobiles, boats, yachts, personal watercrafts, commercial light trucks, big trucks, construction and heavy equipment, trailers and aircrafts, and parts and accessories for these products and (ii) apartments, condominiums, homes, employment, travel and multiple categories of general merchandise. These obligations and limitations may materially restrict our ability to expand our business internationally, could harm our brands or brand recognition and may have a material adverse effect on our business, results of operations and financial condition.
24
Table of Contents
We may be unable to continue to use the domain names that we use in our business, or prevent third parties from acquiring and using domain names that infringe on, are similar to, or otherwise decrease the value of our brands and trademarks.
We registered domain names for our websites that we use in our business, such as AutoTrader.com, kelleybluebook.com and KBB.com. If we lose the ability to use a domain name, whether due to trademark claims, failure to renew the applicable registration or any other cause, we may be forced to market our services under a new domain name, which could cause substantial harm to our business, or cause us to incur significant expense in order to purchase rights to such domain name. In addition, our competitors and others could attempt to utilize our brand recognition by using domain names confusingly similar to ours. Furthermore, the relationship between regulations governing domain names and laws protecting trademarks and similar proprietary rights varies from jurisdiction to jurisdiction and is unclear in some jurisdictions. If we are unable to prevent third parties from acquiring and using domain names that infringe on, or are similar to, our domain names and trademarks, the value of our brands or trademarks could be materially and adversely affected. Protecting and enforcing our rights in our domain names may require litigation, which could result in substantial costs and diversion of management’s attention. Any of the foregoing could materially and adversely affect our business, results of operations and financial condition.
If we fail to manage our growth effectively, our brands, results of operations and business could be harmed.
Since 2009, as a result of organic growth and acquisitions, we have experienced rapid growth in our headcount and operations, which places substantial demands on management and our operational infrastructure. Many of our employees have been with us for fewer than two years and have joined us as a result of our recent acquisitions. As we continue to grow, we must effectively integrate, develop and motivate a large number of new employees, while maintaining the beneficial aspects of our company culture. We continue to invest in our technologies, sales and marketing organizations. Since our recent acquisitions of Kelley Blue Book, vAuto, VinSolutions and HomeNet, we have worked to integrate these acquisitions into our business and, in particular, utilize the strong Kelley Blue Book brand. However, we cannot guarantee that we will be able to do so effectively. If we do not manage the growth of our business and operations effectively and manage the integration of our acquisitions efficiently, the quality of our solutions and efficiency of our operations could suffer, which could have a material adverse effect on our business, results of operations and financial condition.
We rely on traffic to AutoTrader.com and KBB.com from search engines like Google, Yahoo! and Bing, some of which offer services that compete directly with our solutions. If AutoTrader.com and our other websites fail to rank prominently in unpaid search results, traffic to our website could decline and our business, results of operations and financial condition would be adversely affected.
The success of our Digital Media business depends, in part, on our ability to attract consumers to AutoTrader.com and KBB.com through paid and unpaid internet search results on search engines such as Google, Bing and Yahoo! The number of consumers we attract to AutoTrader.com and KBB.com from search engines is due in part to how and where our websites rank in search results. These rankings can be affected by a number of factors, some of which are not in our direct control, and may change frequently. For example, a search engine may change its ranking algorithms, methodologies or design layouts. As a result, links to AutoTrader.com and KBB.com may not be prominent enough to drive traffic to our websites, and we may not be able to influence the results. In some instances, search engines may change our rankings in order to promote their own competing products or services or the products or services of one or more of our competitors. Our websites have experienced fluctuations in search results rankings in the past, and we anticipate such fluctuations in the future.
25
Table of Contents
Our success depends, in part, on our ability to maintain a prominent presence in search results for queries on Google. Google is the most significant source of traffic to AutoTrader.com and KBB.com, accounting for more than 28% and 35% of total visits to AutoTrader.com, and more than 31% and 37% of total visits to KBB.com from internet searches, respectively, during the year ended December 31, 2011 and six months ended June 30, 2012. Google has removed links to our website from portions of its search product or has promoted its own competing products, including local shopping products, in its search results. Given the large volume of traffic to AutoTrader.com and the importance of the placement and display of results of a user’s search, similar actions in the future could have a material adverse effect on our business, results of operations and financial condition.
Any reduction in the number of consumers directed to our websites or increase in the number of consumers directed to competing websites could materially adversely impact our business, results of operations and financial condition.
The traffic to our websites and mobile applications may decline and our brands and business may be adversely affected if other companies copy information from our websites and publish or aggregate it with other information for their own benefit.
From time to time, other companies copy information from our websites through website scraping, robots or other means, and publish or aggregate it with other information for their own benefit. When third parties copy, publish or aggregate content from our websites, it makes them more competitive, and decreases the likelihood that consumers will visit our websites or use our mobile applications to find the information they seek. While we try to prevent or limit these activities, we have experienced them in the past, and we cannot guarantee that we will be successful in preventing or properly detecting such activities in the future. We may not be able to detect such third-party conduct in a timely manner and, even if we could, we may not be able to prevent it. In some cases, particularly in the case of third parties operating outside of the United States, our available remedies may be inadequate to protect us against such activities. In addition, we may be required to expend significant financial or other resources to successfully enforce our rights. If any of these activities were to occur, it could adversely affect our business, results of operations and financial condition.
Some vendors of software used by automotive dealers, including certain of our competitors, are designing their software and using financial or other incentives or penalties to make it more difficult for our customers to use our solutions.
Some software vendors, including some of our competitors, have designed their software in order to make it difficult to integrate with services such as ours, and others have announced their intention to do so. Some software vendors also use financial or other incentives or penalties to encourage their customers to purchase their products and services, disincentivizing dealers from using our software solutions. These obstacles make it more difficult for us to compete with these vendors and expand our dealer customer base. While we have agreements in place with various third-party software providers to facilitate integration between their existing software and our software solutions, we cannot assure you that each of these agreements will remain in place, or that during the terms of such agreements these third parties will not increase the cost or level of difficulty in maintaining integration with their software. Any of the foregoing could complicate or prevent our ability to integrate our solutions and services in the same manner, or at all, and could have a material adverse effect on our business, results of operations and financial condition.
We utilize certain key technologies and data from, and integrate our network with, third parties, and may be unable to replace those technologies if they become obsolete, unavailable or incompatible with our solutions.
Our proprietary software is designed to work in conjunction with certain hardware, software and data from third parties, including Microsoft, IBM and Oracle. Any significant interruption in the supply or
26
Table of Contents
maintenance of such third-party hardware, software and data could have a material adverse effect on our ability to offer our solutions unless and until we can replace the functionality provided by these products and services. In addition, we are dependent upon these third parties’ ability to enhance their current products, develop new products on a timely and cost-effective basis and respond to emerging industry standards and other technological changes. There can be no assurance that we would be able to replace the functionality or data provided by such third-party vendors currently incorporated into our solutions in the event that such technologies or data becomes obsolete or incompatible with our solutions, or is otherwise not adequately maintained or updated. Any delay in or inability to replace such functionality or delays in the release of new and upgraded versions of third-party software products could have a material adverse effect on our business, results of operations and financial condition.
Additionally, as new mobile devices and platforms are released, it is difficult for us to predict the problems we may encounter in developing solutions for these alternative devices and platforms, and we may need to devote significant resources to the creation, support and maintenance of such solutions. In addition, if we experience difficulties in the future in integrating our mobile applications or advertising into mobile devices or if problems arise with our relationships with providers of mobile operating systems or mobile application download stores, such as those of Apple or Google; if our applications receive unfavorable treatment compared to the promotion and placement of competing applications, such as the order of our solutions in the Apple AppStore; or if we face increased costs to distribute our mobile applications, our future growth and our business, results of operations and financial condition could be materially and adversely affected.
We may require additional capital to support business growth, and this capital might not be available on acceptable terms, or at all. Any acquisitions that we complete with equity financings may dilute your ownership interest in us, and any acquisition that we complete with debt financing may make it difficult for us to obtain additional capital and pursue potential acquisitions.
We intend to continue to make investments and acquisitions to support our business growth and may require additional funds to respond to business challenges, including the need to develop new features and solutions or enhance our existing solutions, improve our operating infrastructure or acquire complementary businesses and technologies. Accordingly, we may need to engage in equity or debt financings to secure additional funds or as payment, in part or in full, for the business or assets acquired. If we raise additional funds through future issuances of equity or convertible debt securities, our existing stockholders could suffer significant dilution, and any new equity securities we issue could have rights, preferences and privileges superior to those of holders of our Class A common stock. Future equity financings will also decrease our earnings per share and the benefits derived by us from such acquisition might not outweigh or might not exceed its dilutive effect. Any additional debt financing we secure in the future to finance acquisitions could involve restrictive covenants relating to our capital raising activities and other financial and operational matters, which may make it more difficult for us to obtain additional capital and to pursue business opportunities, including potential acquisitions. We may also have future impairment of assets, or suffer adverse tax and accounting consequences in connection with, any future acquisitions. We may not be able to obtain additional financing on terms favorable to us, or at all. If we are unable to obtain adequate financing or financing on terms satisfactory to us when we require it, our ability to continue to support our business growth and to respond to business challenges could be significantly impaired, and our business, results of operations and financial condition may be materially and adversely affected.
27
Table of Contents
Our failure or inability to execute any element of our business strategy could adversely affect our business, results of operations and financial condition.
Our business, results of operations and financial condition depend on our ability to execute our business strategy, which includes the following key elements:
| Ÿ | increasing the share of existing dealer customer spending; |
| Ÿ | cross-selling our software solutions to our customer base of subscribing dealers; |
| Ÿ | developing new services for consumers, dealers and advertisers; |
| Ÿ | increasing brand awareness and growing our traffic; |
| Ÿ | increasing penetration of the dealer market; and |
| Ÿ | expanding into new markets. |
We may not succeed in implementing a portion or all of our business strategy and, even if we do succeed, our strategy may not have the favorable impact on operations that we anticipate. Our success depends on our ability to leverage our sales force and customer base; offer a broad and expanding array of solutions; provide convenient, high-quality solutions to consumers; maintain and expand our market position with dealers and brand advertisers; enter new markets; and implement other elements of our business strategy.
We may not be able to effectively manage any expansion of our business or operations as a result of the execution of our strategy or achieve the rapid execution necessary to fully avail ourselves of the market opportunity for our solutions. If we are unable to successfully implement our business strategy, our business, results of operations and financial condition could be materially and adversely affected.
We may not timely and effectively scale and adapt our existing technologies and network infrastructure to ensure that our platform is accessible.
It is important to our success that consumers and customers be able to access our digital media and software solutions at all times. We have previously experienced, and may experience in the future, service disruptions, outages and other performance problems due to a variety of factors, including infrastructure changes, human or software errors, capacity constraints due to an overwhelming number of consumers accessing our platform simultaneously and denial-of-service or fraud or security attacks. In some instances, we may not be able to identify the causes of these performance problems within an acceptable period of time. It may become increasingly difficult to maintain and improve the availability of our solutions, especially during peak usage times and as our solutions become more complex and our consumer traffic increases. For example, in December 2011, we experienced an approximately three-hour outage of our AutoTrader.com website. If our solutions are unavailable when consumers or customers attempt to access them or if they do not load as quickly as they expect, consumers or customers may seek other services to obtain the information for which they are looking, and may not return to our solutions as often in the future, or at all. Dealers may also be less willing to pay for listings or our software solutions and advertisers may be less willing to advertise on our websites and mobile applications if our solutions are unavailable when they try to access them. This would negatively impact our ability to attract consumers and customers, and would impact our ability to increase the frequency with which they use our solutions.
Additionally, although AutoTrader.com and KBB.com are designed to be fully redundant, and are each located in two geographically distinct data centers, the AutoTrader.com data centers are located within 30 miles of one another. Our software solutions systems are redundant within their respective data centers, but are not redundant across data centers. Our core human resources and finance
28
Table of Contents
systems are supported through third-party hosts, but several functions are not fully redundant and would require a restore from backup in the event of a system or site failure. Although our disaster recovery program contemplates transitioning our solutions and data to a backup center in the event of such a failure, we have not yet tested the procedure in full, and the transition procedure may take several days or more to complete.
We may experience service disruptions to the extent that we do not effectively address capacity constraints, upgrade our systems and disaster recovery plan as needed and continually develop our technologies and network architecture to accommodate actual and anticipated changes in technology. Although we have business interruption insurance, it may not fully cover all loses we may incur and coverage may not be available in certain situations. Any such disruptions resulting from our inability to effectively scale and adapt our technology could have a material adverse effect on our business, results of operations and financial condition.
If our security measures are compromised, or if our solutions are subject to attacks that degrade or deny the ability of consumers to access our websites or software solutions, consumers may curtail or stop using our platform.
Our solutions are vulnerable to computer viruses, break-ins, phishing attacks, attempts to overload our servers with denial-of-service or other attacks and similar disruptions from unauthorized use of our computer systems, any of which could lead to interruptions, delays or website or software shutdowns, causing loss of critical data or the unauthorized disclosure or use of confidential information. If we experience compromises to our security that result in performance or availability problems, the complete shutdown of AutoTrader.com or KBB.com or mobile applications or the loss or unauthorized disclosure of confidential information, consumers, dealers or advertisers may lose trust and confidence in us, decrease their use of our solutions or stop using our solutions entirely. Because the techniques used to obtain unauthorized access, disable or degrade service or sabotage systems change frequently, often are not recognized until launched against a target and may originate from less regulated and remote areas around the world, we may be unable to proactively address these techniques or to implement adequate preventative measures. In addition, dealer and advertiser accounts and content could be hacked, hijacked, altered or otherwise claimed or controlled by unauthorized persons. Although we have controls that proactively identify phishing websites, verify the identity of any individual dealers attempting to change their account passwords and controls to prevent password guessing attacks, there is no guarantee that our controls will work effectively. Such issues could negatively impact our ability to attract new consumers, dealers or advertisers and could deter current consumers, dealers or advertisers from using our solutions, or subject us to lawsuits, regulatory fines or other action or liability, thereby having a material adverse effect on our business, results of operations and financial condition.
We use open source software, which may pose particular risks to our proprietary software and solutions.
We use open source software in our solutions and expect to continue to do so in the future. Open source terms may be ambiguous, and many of the risks associated with open source software cannot be eliminated. Use of certain open source software can lead to greater risks than use of third-party commercial software, as open source licensors generally do not provide warranties or controls on the origin of their software. Although we do not intend to modify open source software or package it for distribution within our services, we could potentially face claims from third parties claiming ownership of, or demanding release of, the open source software or derivative works that we developed using such software (which could include our proprietary source code), or otherwise seeking to enforce the terms of the applicable open source license. These claims could result in litigation and could require us to enter into or purchase a costly license or stop offering the implicated solutions unless and until we
29
Table of Contents
can re-engineer them to avoid infringement. This re-engineering process could require significant additional research and development resources. Any of these risks could be difficult to eliminate or manage, and, if not addressed successfully, could have a material adverse effect on our business, results of operations and financial condition.
The software underlying our services may be subject to undetected errors, defects or bugs which could adversely effect our business.
The software underlying our services is complex and may contain undetected errors, defects or bugs, such as missing advertisements, reporting errors or other user interface anomalies. For example, in 2011, we rolled out a new version of one of our software solutions and experienced outages and other performance problems, which we are continuing to monitor and fix. We may discover significant errors, defects or bugs in the future that we may not be able to correct in a timely manner. Our solutions are integrated with products and systems developed by third parties. Third-party software programs may contain undetected errors, defects or bugs when they are first introduced or as new versions are released. It is possible that errors, defects or bugs will be found in our existing or future services or third-party products upon which our solutions are dependent, with the possible results of delays in, or loss of market acceptance of, our services, diversion of our resources, injury to our reputation, increased service and warranty expenses and payment of damages, any of which could have a material adverse effect upon our business, results of operations and financial condition.
Our business operations may be disrupted if our enterprise resource planning, or ERP, system implementation is not successful.
We are in the process of converting our various business information systems to a single Oracle ERP. We have committed significant resources to this conversion and are currently phasing it in over multiple years. The conversion process is extremely complex because of the multiple processes and legacy systems that must be integrated following our recent acquisitions. We are using a controlled project plan that we believe will provide an adequate allocation of resources. However, such a plan, or a divergence from it, may result in cost overruns, project delays or business interruptions. Additionally, during the conversion process, we may be limited in our ability to convert any business that we acquire to the ERP. Failure to adequately address these issues could result in significant costs or impact our ability to perform necessary business operations which could have a material adverse effect on our business, results of operations and financial condition.
We depend upon CEI and its affiliates to provide us with various services. If the agreements governing these services are terminated, we may not be able to timely replace such services on terms favorable to us.
Under our agreements with CEI, CEI agreed to provide us directly or through its subsidiaries, with various services, which include assistance with bandwidth and server custody, cash management services, legal and administrative services, tax services, treasury services, insurance and employee benefits administration. Pursuant to these agreements, we paid CEI certain fees and reimbursed CEI for certain expenses, which totaled $3.8 million, $2.4 million, and $1.0 million for the years ended December 31, 2010 and 2011 and the six months ended June 30, 2012. We rely on CEI to provide these services, and we currently have limited in-house capability to handle these services independent of CEI. If these agreements are terminated, we will have to obtain such services from third parties or hire employees to perform them. We may not be able to renew these agreements or replace these services or hire such employees in a timely manner or on terms, including cost and level of expertise, that are as favorable as those we receive from CEI. This would result in an increase in our operating expenses and increased time and attention from management, and could have a material adverse effect on our business, results of operations and financial condition.
30
Table of Contents
We rely on third-party service providers for many aspects of our business, including automobile pricing and other data, and any failure to maintain these relationships could harm our business.
We rely on information about automobiles and pricing from third parties, including OEMs, dealers and others, with respect to valuations made by Kelley Blue Book and instant trade-in offer pricing made through our TIM service. We also rely on third parties for other aspects of our business, such as server custody, site hosting and administrative software solutions. If these third parties experience difficulty meeting our requirements or standards, or our licenses are revoked or not renewed, it could make it difficult for us to operate some aspects of our business, which could damage our business and reputation. In addition, if such third-party service providers were to cease operations, temporarily or permanently, face financial distress or other business disruption, increase their fees or if our relationships with these providers deteriorate, we could suffer increased costs and delays in our ability to provide consumers and customers with our solutions or provide similar solutions until an equivalent provider could be found or we develop replacement technology or operations. If any of the foregoing occurs or if we are unsuccessful in choosing or finding high-quality partners, if we fail to negotiate cost-effective relationships with them or if we ineffectively manage these relationships, it could have a material adverse effect on our business, results of operations and financial condition.
Our sales cycle may be long and unpredictable, and our sales efforts require considerable time and expense. As a result, our results of operations are difficult to predict and may vary substantially from quarter to quarter, which may cause our results of operations to fluctuate.
We sell our solutions primarily to the management, advertising, sales and IT departments of automobile dealers that are managing a growing set of consumer, marketing, sales and compliance demands, which has increased the complexity of dealer requirements to be met and confirmed in the sales cycle. Additionally, we have found that security, legal and compliance functions within dealers’ business operations are increasingly involved in the testing, evaluation and approval of purchases, which has made the sales cycle longer and less predictable.
A dealer’s decision to use our solutions may be an enterprise-wide decision, particularly in our Software Solutions business and for larger dealer groups. In these circumstances, such sales may require us to provide greater levels of education regarding the use and benefits of our solutions. In addition, larger dealer groups may demand more customization, integration services and features. Consequently, we may be required to devote greater resources to individual customers, increasing costs and time required to complete sales and diverting our resources to a smaller number of larger transactions.
As a result of the foregoing or otherwise, we may not be able to accurately predict or forecast the timing of sales, which makes our future revenue difficult to predict and could cause our results to vary significantly. In addition, we might devote substantial time and effort to a particular unsuccessful sales effort, and as a result we could lose other sales opportunities or incur expenses that are not offset by an increase in revenue, any of which could have a material adverse effect on our business, results of operations and financial condition.
We have not materially monetized our mobile advertising solutions to date and we may not be able to generate meaningful revenue from this platform for the foreseeable future.
We believe the number of people who access our digital media solutions through mobile devices, including smartphones, tablets and handheld computers, will increase over the next few years. We have not materially monetized our mobile advertising solutions to date and we may not be able to generate meaningful revenue from this platform for the foreseeable future. If consumers use our mobile solutions at the expense of our websites, our advertisers may reduce or stop advertising on our
31
Table of Contents
websites and may be unwilling to advertise on our mobile solutions unless we develop effective services that are compelling to them. Similarly, we may be unable to attract new advertisers unless we develop effective mobile solutions. At the same time, it is important that any mobile solutions that we develop do not adversely affect the consumer experience, even if that might result in decreased short-term monetization. If we fail to develop effective mobile advertising solutions, if our solutions alienate our dealer or advertiser customer base, or if our solutions are not widely adopted or are insufficiently profitable, our business, results of operations and financial condition may be materially and adversely affected.
We expect a number of factors to cause our results of operations to fluctuate on a quarterly and annual basis, which may make it difficult to predict our future performance.
Our results of operations could vary significantly from quarter-to-quarter and year-to-year because of a variety of factors, many of which are outside of our control. As a result, our results of operations from period to period may not be comparable. Factors that may contribute to the variability of our quarterly and annual results include:
| Ÿ | our ability to develop new services that are relevant to dealers, advertisers and consumers; |
| Ÿ | our ability to maintain an adequate rate of growth and effectively manage that growth; |
| Ÿ | our ability to evolve our business model as consumers interact on mobile and social platforms; |
| Ÿ | the success of our sales and marketing efforts; |
| Ÿ | our ability to successfully manage any acquisitions of businesses, solutions or technologies; |
| Ÿ | the attraction and retention of qualified employees and key personnel; |
| Ÿ | our ability to successfully expand in existing markets, enter new markets and manage our expansion, domestically and, in the future, internationally; |
| Ÿ | our ability to attract new dealers and advertisers and retain existing dealers and advertisers; |
| Ÿ | our ability to accurately forecast revenue and appropriately plan our expenses; |
| Ÿ | the impact of worldwide economic conditions, including the resulting effect on automobile purchases and the level of advertising spending by dealers and advertisers; |
| Ÿ | the effects of increased competition in our business; |
| Ÿ | our ability to protect our intellectual property; |
| Ÿ | our ability to maintain and increase traffic to AutoTrader.com and KBB.com and our mobile applications; |
| Ÿ | our ability to keep pace with changes in technology; |
| Ÿ | interruptions in service and any related impact on our reputation; |
| Ÿ | our ability to choose and effectively manage third-party service providers; |
| Ÿ | the effects of changes in search engine placement and prominence; |
| Ÿ | costs associated with defending intellectual property infringement and other claims and related judgments or settlements; |
| Ÿ | changes in government regulation affecting our business; |
| Ÿ | the effectiveness of our internal controls; |
| Ÿ | the effects of natural or man-made catastrophic events; |
| Ÿ | changes in consumer behavior with respect to local businesses; and |
| Ÿ | changes in our tax rates or exposure to additional tax liabilities. |
32
Table of Contents
We rely on the performance of our executives and highly skilled personnel, and if we are unable to attract, retain and motivate well-qualified employees, our business could be materially and adversely affected.
We believe our success has depended, and continues to depend, on the efforts and talents of our executives and employees, including Chip Perry, our President and Chief Executive Officer, or CEO, and our dealer sales force. Our future success depends on our continuing ability to attract, develop, motivate and retain highly qualified and skilled employees. Qualified individuals are in high demand, and we may incur significant costs to attract and retain them. In addition, the loss of any of our senior management or key employees could materially adversely affect our ability to execute our business plan and strategy, and we may not be able to find adequate replacements on a timely basis, or at all. Most of our executive officers and other employees are at-will employees, which means they may terminate their employment relationship with us at any time, and their knowledge of our business and industry would be extremely difficult to replace. We cannot ensure that we will be able to retain the services of any members of our senior management or other key employees. If we do not succeed in attracting well-qualified employees or retaining and motivating existing employees, our business could be materially and adversely affected.
The impact of worldwide economic conditions, including the resulting effect on consumer spending, as well as marketing spending by dealers and advertisers targeting automobile consumers, may materially and adversely affect our business, results of operations and financial condition.
Our performance is subject, in part, to worldwide economic conditions and their impact on the levels of paid listings by automobile dealers, advertising expenditures by advertisers targeting in-market car shoppers as well as the rate in which dealers adopt or maintain the use of our software solutions, any of which may be disproportionately affected by economic downturns. To the extent that the current poor economic condition continues, or worldwide economic conditions materially deteriorate, our existing and potential customers may no longer consider investment in our digital media or software solutions as a necessity, or may elect to reduce their spending on listings, advertising or software solutions. Historically, economic downturns have resulted in overall reductions in advertising spending in general and automobile related advertising in particular. For example, in the difficult economic environment in 2009, the overall automotive advertising market declined by 29% as a result of the decline in car sales in 2009, according to Forrester Research, which we believe slowed the growth rate of revenue in our Digital Media business. In addition, online advertising solutions may be viewed by some of our customers as a lower priority which could cause them to reduce the amounts they spend on advertising, terminate their use of our digital media solutions or default on their payment obligations to us.
In addition, economic conditions may adversely impact levels of consumer spending, which could adversely impact the numbers of consumers visiting AutoTrader.com and KBB.com. Consumer purchases of new and used automobiles generally decline during recessionary periods and other periods in which disposable income is adversely affected. Purchases of new and used automobiles are typically discretionary for consumers and have been, and may continue to be, affected by negative trends in the economy, including the cost of energy and gasoline, the availability and cost of credit, the declining residential and commercial real estate markets, reductions in business and consumer confidence, stock market volatility and increased unemployment. A reduction in the number of new and used automobiles purchased by consumers could continue to adversely affect dealers and OEMs and lead to a reduction in spending by our dealer and advertising customers on our digital media and software solutions. The foregoing could have a material adverse effect on our business, results of operations and financial condition.
33
Table of Contents
If we fail to expand effectively into new markets, our revenue growth could be limited.
We continue to expand into new markets and we may fail to do so successfully or incur losses. For example, as a result of recent acquisitions, we entered the market for software solutions. Such expansion places us in competitive environments with which we may be unfamiliar and involves various risks, including the need to invest significant resources and the possibility that returns on such investments will not be achieved for several years, or at all. In attempting to establish a presence in new markets, we expect, as we have in the past, to incur significant expenses and face various other challenges, such as expanding our dealer sales force and technical personnel to cover those new markets. Our current and any future expansion plans will require significant resources and management attention. Furthermore, we have already developed a significant market position in the automobile listings and advertising market in the United States and further expansion may not yield similar results or sustain our growth.
If growth in the online automotive advertising market becomes stagnant or does not continue to increase, our business, results of operations and financial condition could be materially and adversely affected.
We believe future growth in the online automotive advertising market will be driven, in part, by dealers and brand advertisers increasingly shifting their advertising spending away from traditional media towards online advertising. To the extent that overall automotive related advertising does not continue to shift online, our business, results of operations and financial condition could be materially and adversely affected.
We are, and may in the future be, subject to disputes and assertions by third parties that we violate their rights. These disputes may be costly to defend and could materially adversely affect our business, results of operations and financial condition.
We have faced, and we expect to face from time to time in the future, allegations that we have violated the rights of third parties, including patent, trademark, copyright and other intellectual property rights. For example, third parties have sued us for allegedly violating their patent rights, and actions have been filed against us on behalf of current and former employees claiming that we violated labor and other employment laws.
Other claims against us can be expected to be made in the future. Even if the claims are without merit, the costs associated with defending these types of claims may be substantial, including in terms of time, money and management distraction. In particular, patent and other intellectual property litigation may be protracted and expensive, and the results are difficult to predict and may require us to stop offering certain features, purchase licenses or modify our services and features while we develop non-infringing substitutes or may result in significant settlement costs. We may be unable to deter competitors or others from pursuing patent or other intellectual property infringement claims against us.
The results of litigation and claims to which we may be subject cannot be predicted with certainty. Even if these matters do not result in litigation or are resolved in our favor or without significant cash settlements, these matters, and the time and resources necessary to litigate or resolve them, including management time and attention, could materially and adversely affect our business, results of operations and financial condition.
Failure to protect or enforce our intellectual property rights could have a material adverse effect on our business, results of operations and financial condition.
As of November 8, 2012, we had approximately 200 registrations or applications for registration of trademarks in 25 jurisdictions, over 550 copyright registrations and approximately 1,600 domain name
34
Table of Contents
registrations. We regard the protection of our trade secrets, trademarks, copyrights and domain names as critical to our success. In particular, we must maintain, protect and enhance the AutoTrader.com and Kelley Blue Book brands. We pursue the registration of our domain names and trademarks in the United States and in certain jurisdictions abroad. We strive to protect our intellectual property rights by relying on federal, state and common law rights, as well as contractual restrictions. In order to limit access to, and disclosure and use of, our proprietary information, we may enter into confidentiality or invention assignment agreements with employees, contractors and parties with whom we conduct business. However, these contractual arrangements and the other steps we have taken to protect our intellectual property may not prevent the misappropriation or disclosure of our proprietary information, deter independent development of similar technologies by others or otherwise protect our intellectual property rights from being challenged, invalidated or circumvented.
Effective copyright, trademark and domain name protection is expensive to develop and maintain, both in terms of initial and on-going registration requirements and expenses and the costs of defending our rights. We seek to protect our trademarks and domain names in an increasing number of jurisdictions, a process that is expensive and may not be successful or which we may not pursue in every location. Litigation may be necessary to enforce our intellectual property rights, protect our respective trade secrets or determine the validity and scope of proprietary rights claimed by others. Any litigation of this nature, regardless of outcome or merit, could result in substantial costs and diversion of management and technical resources, any of which could materially and adversely affect our business, results of operations and financial condition. We may incur significant costs in enforcing our trademarks against those who attempt to imitate the AutoTrader.com or Kelley Blue Book brands.
As of November 8, 2012, we had 18 pending U.S. patent applications and one issued patent. Our issued patent and any future patents issued to us may be challenged, invalidated or circumvented, may not provide sufficiently broad protection or may not prove to be enforceable in actions against alleged infringers. Furthermore, there can be no assurance that our pending patent and trademark applications will be accepted in the United States or elsewhere or that effective patent, trademark, copyright and trade secret protection will be available in every country in which our digital automotive marketplace is available over the internet. In addition, the legal standards relating to the validity, enforceability and scope of protection of intellectual property rights regularly evolve.
If we fail to maintain, protect and enhance our intellectual property rights, our business, results of operations and financial condition could be materially and adversely affected.
We process, store and use personal information and other consumer data, which subjects us to governmental regulation and other legal obligations related to privacy and the security of consumer information.
We process, store and use personal information and other consumer data, including credit card information. These activities are governed by numerous evolving, inconsistent and often conflicting laws.
For example, the Federal Trade Commission, or FTC, expects companies like ours to comply with guidelines that govern the collection, use and storage of consumer information, and establish principles relating to notice, consent, access and data integrity and security. Our practices are designed to comply with these guidelines as described in our published privacy policies. These policies disclose that we collect a range of information about consumers, such as their names, email addresses, search histories and activity on our platform. We also use and store such information primarily to personalize the experience on our platform, provide customer support and display relevant advertising.
35
Table of Contents
Additionally, we and third parties use tracking technologies, including “cookies” and related technologies, to help us manage and track consumers’ interactions with our websites and deliver relevant listings and advertising. United States regulatory agencies are increasingly focused on online privacy matters and, in particular, on online advertising activities that utilize cookies and other online tools for tracking purposes. For example, the FTC, Department of Commerce and White House have recently issued several reports emphasizing the importance of the principles of consumer notice and choice, and recommending the adoption of methods of simplified choice, including the implementation of a “Do Not Track” mechanism—likely a persistent setting on consumers’ internet browsers—to enable consumers to choose whether to allow the tracking of their online search and browsing activities. These and similar efforts could significantly restrict our ability to collect, augment, analyze, use and share data, including anonymous data and geolocation information, which could make it more difficult for us to provide effective solutions to our customers.
Further, we participate in the Digital Advertising Alliance and similar industry self-regulatory organizations. These and other organizations issue guidelines addressing privacy protection on internet or mobile platforms, and in many cases, government regulators expect us to abide by these guidelines, even if we are not a member of the issuing organization.
While we do not sell personal information to third parties for any purpose, we do have relationships with third parties that may allow them access to user information for other purposes. For example, when we outsource functions such as technical and customer support, quality assurance and payment processing to other companies, we make user information available to those companies to the extent necessary for them to provide the outsourced services.
Any failure or perceived failure by us to comply with our privacy policies or similar legal obligations, including any security compromise resulting in the unauthorized release of personal information or other user data, by us or a third party, may result in government enforcement action, litigation or negative publicity. Any of the foregoing could cause our consumers, dealers and advertisers to lose trust in us, result in substantial costs and diversion of management’s attention and have a material adverse effect on our business, results of operations and financial condition.
We are subject to complex and evolving laws and regulations that involve matters central to our business.
We are directly and indirectly subject to numerous laws and regulations in the United States and abroad that involve matters central to our business, including advertising, content and automobile valuation. These laws and regulations are constantly evolving and can be subject to significant change. In addition, the application and interpretation of these laws and regulations are often uncertain, particularly in the new and rapidly evolving industry in which we operate.
For example, automotive sales, leasing and financing, as well as advertising generally, is highly regulated, and such regulation could be interpreted to obligate us to ensure that our listings and advertising comply with applicable laws and regulations. Consequently, we may face liability for, and may be subject to claims related to, inaccurate or improper advertising content provided to us, which even if unfounded or decided in our favor, may be extremely costly to defend, could require us to pay significant damages and could limit our ability to operate.
Additionally, laws relating to the liability of providers of online services for actions by users and third parties are currently being tested by a number of claims, including actions based on invasion of privacy and other torts, unfair competition, copyright and trademark infringement and other theories. If legislation is passed that limits the immunities afforded to websites that publish content generated by third parties, we may be compelled to remove such content from our platform.
36
Table of Contents
Further, instant trade-in offer pricing through our TIM service could subject us to liability under state “Bird Dog” laws, which prohibit dealers from making payments to third-parties in connection with the sale of motor vehicles through persons other than their licensed salespeople. If we become subject to these laws or regulations, we may be forced to implement new measures to reduce our exposure to this liability, including discontinuing certain services or features.
A number of jurisdictions are considering legislative and regulatory proposals concerning these or other aspects of our business, including anti-internet neutrality, taxation and access charges. We do not know such regulations will be applied to the internet, or whether they could result in a decrease in internet use, which could in turn decrease demand for our solutions. Such regulation could also require us to modify or discontinue providing all or a portion of our solutions. Any of the foregoing may require us to expend substantial resources or to discontinue certain services or features, which could harm our reputation and brands, undermine our value proposition to consumers, dealers or advertisers, divert management time and attention, result in substantial costs and impact the growth of our business, which could materially and adversely affect our business, results of operations and financial condition.
We face potential liability and expense for legal claims based on the content on our websites.
We face potential liability and expense for legal claims relating to the information that we publish on AutoTrader.com and KBB.com and our mobile applications, including claims for defamation, libel, negligence and copyright or trademark infringement, among others. For example, to the extent that descriptions of vehicles included in listings on our websites are inaccurate, or instant trade-in offers made pursuant to our TIM service are not honored, we may be subject to false advertising claims or product liability claims. We may also be subject to claims based on our advertising of our own business. Any such claims could divert management time and attention away from our business and result in significant costs to investigate and defend, regardless of the merits of the claims. In some instances, we may elect or be compelled to remove content or may be forced to pay substantial damages if we are unsuccessful in our efforts to defend against these claims. If we elect or are compelled to remove valuable content from our websites or mobile applications, our platform may become less useful to consumers and our traffic may decline, which could have a material adverse effect on our business, results of operations and financial condition.
We could be sued for contract or product liability claims, and such lawsuits may disrupt our business, divert management’s attention or have a material adverse effect on our business, results of operations and financial condition.
General errors, defects or other performance problems in our software solutions could result in financial or other damages to our consumers, dealers or advertisers. Although our contracts include terms meant to limit our liability for any defects or performance problems, there can be no assurance that any limitations of liability set forth in our contracts would be enforceable or would otherwise protect us from liability for damages. We maintain general liability insurance coverage, including coverage for errors and omissions in excess of the applicable deductible amount. There can be no assurance that this coverage will continue to be available on acceptable terms or in sufficient amounts to cover one or more large claims, or that the insurer will not deny coverage for any future claim. The successful assertion of one or more large claims against us that exceeds available insurance coverage, or the occurrence of changes in our insurance policies, including premium increases or the imposition of large deductible or co-insurance requirements, could have a material adverse effect on our business, results of operations and financial condition. Furthermore, litigation, regardless of its outcome, could result in substantial cost to us and divert management’s attention from our operations. Any of the foregoing could have a material adverse effect on our business, results of operations and financial condition.
37
Table of Contents
If our intangible assets and goodwill become impaired we may be required to record a significant non-cash charge to earnings which would materially and adversely affect our results of operations.
Under accounting principles generally accepted in the United States, we review our intangible assets and goodwill for impairment annually in the fourth quarter of each fiscal year, or more frequently if events or changes in circumstances indicate the carrying value of our intangible assets may not be fully recoverable. In 2011 and the six months ended June 30, 2012, we recognized $36.2 million and $11.1 million, respectively, of goodwill impairment charges attributable to HomeNet, which we acquired in 2010. In addition, in the six months ended June 30, 2012, we recognized a $4.5 million intangible asset impairment charge attributable to HomeNet. We may recognize additional impairment charges associated with our acquisitions in future periods. The carrying value of our intangible assets may not be recoverable due to factors such as a decline in our stock price and market capitalization, reduced estimates of future revenues or cash flows or slower growth rates in our industry. Estimates of future revenues and cash flows are based on a long-term financial outlook of our operations. Actual performance in the near-term or long-term could be materially different from these forecasts, which could impact future estimates and the recorded value of the intangibles. For example, a significant, sustained decline in our stock price and market capitalization may result in impairment of certain of our intangible assets, including goodwill, and a significant charge to earnings in our consolidated financial statements during the period in which an impairment is determined to exist. We will continue to monitor and evaluate the carrying value of our goodwill. In the event we had to reduce the carrying value of our goodwill, any such impairment charge could materially and adversely affect our results of operations.
Under certain circumstances we could be liable for payments related to income taxes owed by CEI’s consolidated group.
Prior to 2010, we were an indirect subsidiary of CEI and a member of CEI’s consolidated group for United States federal income tax purposes. In 2010, the Providence Funds acquired a 25% interest in us, which resulted in our deconsolidation from the CEI consolidated group. United States federal tax law provides that each member of a consolidated group is jointly and severally liable for the consolidated group’s entire federal income tax obligation. Thus, to the extent CEI or other members of the CEI consolidated group fail to make any United States federal income tax payments required by law for any tax year in which we were, at any time during such tax year, a member of the CEI consolidated group, we could be liable for the shortfall. Similar principles may apply for foreign, state or local income tax purposes where we have previously filed combined, consolidated or unitary returns with CEI or its subsidiaries for foreign, state or local income tax purposes.
Our business is subject to the risks of tornadoes, earthquakes, fires, floods and other natural catastrophic events and to interruption by man-made problems such as computer viruses or terrorism.
Our systems and operations are vulnerable to damage or interruption from earthquakes, fires, floods, power losses, telecommunications failures, terrorist attacks, acts of war, human errors, break-ins and similar events. For example, a significant natural disaster, such as a tornado, earthquake, fire or flood, could have a material adverse effect on our business, results of operations and financial condition, and our insurance coverage may be insufficient to compensate us for losses that may occur. Our corporate offices and one of the facilities we lease to house our computer and telecommunications equipment are located in the Atlanta, Georgia metropolitan area, a region known for hurricane and tornado activity. In addition, acts of terrorism, which may be targeted at metropolitan areas that have higher population density than rural areas, could cause disruptions in our or our local business advertisers’ businesses or the economy as a whole. Our servers may also be vulnerable to computer viruses, break-ins, denial-of-service attacks and similar disruptions from unauthorized
38
Table of Contents
tampering with our computer systems, which could lead to interruptions, delays, loss of critical data or the unauthorized disclosure of confidential client data. We may not have sufficient protection or recovery plans in certain circumstances, such as natural disasters affecting the Atlanta, Georgia metropolitan area. As we rely heavily on our servers, computer and communications systems and the internet to conduct our business and provide high-quality customer service, such disruptions could negatively impact our ability to run our business and either directly or indirectly disrupt our dealers and other advertisers’ businesses, which could have a material adverse affect on our business, results of operations and financial condition.
Risks Related to Our Indebtedness
Our indebtedness could adversely affect our financial health, harm our ability to react to changes to our business and prevent us from fulfilling our obligations under our indebtedness.
We have a significant amount of indebtedness. As of June 30, 2012, we had total indebtedness of approximately $1,284.4 million. Based on interest rates applicable at June 30, 2012, our annual interest expense was $34.4 million. Although we believe that our current cash flows will be sufficient to cover our annual interest expense, any increase in the amount of our indebtedness or any decline in the amount of cash available to make interest payments could require us to divert funds identified for other purposes for debt service and impair our liquidity.
Our indebtedness could also have other significant consequences. For example, it could:
| Ÿ | increase our vulnerability to general economic downturns and adverse competitive and market conditions; |
| Ÿ | require us to dedicate a substantial portion, if not all, of our cash flow from operations to payments on our indebtedness, thereby reducing the availability of our cash flow to fund working capital, capital expenditures and other general corporate expenditures, including expenditures associated with future business opportunities; |
| Ÿ | limit our flexibility in planning for, or reacting to, changes in our Digital Media and Software Solutions businesses; |
| Ÿ | place us at a competitive disadvantage compared to competitors that have less debt; |
| Ÿ | restrict us from making strategic acquisitions or causing us to make non-strategic divestitures; |
| Ÿ | limit our ability to obtain additional financing on satisfactory terms or at all; and |
| Ÿ | adversely impact our ability to comply with the financial and other restrictive covenants in the agreement governing our credit facilities, which could result in an event of default under such agreement. |
Increases in interest rates could increase interest payable under our variable rate indebtedness.
We are subject to interest rate risk in connection with our variable rate indebtedness outstanding under our credit facilities. Interest rate changes could increase the amount of our interest payments and thus negatively impact our future earnings and cash flows. We estimate that our annual interest expense on our variable rate indebtedness would increase by approximately $12.9 million for the first increase in interest rates of 1% and $12.9 million for each subsequent increase in interest rates of 1% on our outstanding indebtedness as of June 30, 2012. If we do not have sufficient earnings, we may be required to refinance all or part of our existing debt, sell assets, borrow more money or sell more securities, none of which we can guarantee we will be able to complete on commercially reasonable terms acceptable to us or at all.
39
Table of Contents
Despite current indebtedness levels, we and our subsidiaries may still be able to incur substantially more debt.
We and our subsidiaries may be able to incur substantial additional indebtedness in the future. Although the agreement governing our credit facilities contains restrictions on the incurrence of additional indebtedness, these restrictions are subject to a number of qualifications and exceptions, and the indebtedness incurred in compliance with these restrictions could be substantial. For example, we had $130.0 million available under our revolving credit facility as of June 30, 2012. If we incur additional debt above the levels currently in effect, the risks associated with our substantial leverage would increase.
To service our indebtedness, we will require a significant amount of cash. Our ability to generate cash depends on many factors beyond our control.
Our ability to make payments on and to refinance our indebtedness and to fund our operations will depend on our ability to generate cash in the future, which, to a certain extent, is subject to general economic, financial, competitive, legislative, regulatory and other factors that are beyond our control. Specific events that might adversely affect our cash flow include decreased use of our services. Accordingly, we may not be able to generate cash to service our indebtedness, which could lead to a default under our credit agreement and adversely affect our business, results of operations and financial condition.
We are a holding company with no business operations of our own and depend on our subsidiaries for cash.
We are a holding company with no significant business operations of our own. Our operations are conducted through our subsidiaries. Dividends from, and cash generated by, our subsidiaries are our principal sources of cash to pay dividends, if any, which such payment is restricted under the agreement governing our credit facilities. Accordingly, our ability to pay any dividends to our stockholders is dependent on the earnings and the distributions of funds from our subsidiaries. The agreement governing our credit facilities significantly restricts our subsidiaries from paying dividends and otherwise transferring cash or other assets to us. In addition, our subsidiaries are permitted under the agreement governing our credit facilities to incur additional indebtedness that may severely restrict or prohibit the transferring of cash or other assets, the payment of dividends or the making of loans by our subsidiaries to us.
Restrictive covenants in the agreement governing our credit facilities may restrict our ability to pursue our business strategies.
The agreement governing our credit facilities contains a number of restrictive covenants that impose significant operating and financial restrictions on us and may limit our ability to pursue our business strategies or undertake actions that may be in our best interests. The agreement governing our credit facilities require us to maintain compliance with certain financial ratios, including a maximum total leverage ratio and a minimum debt service coverage ratio. In addition, the agreement governing our credit facilities include covenants restricting, among other things, our ability to:
| Ÿ | incur or guarantee additional debt; |
| Ÿ | incur liens; |
| Ÿ | make loans and investments and complete acquisitions; |
| Ÿ | declare or pay dividends, redeem or repurchase capital stock or make certain other restricted payments; |
| Ÿ | complete mergers, consolidations and dissolutions; |
40
Table of Contents
| Ÿ | modify or prepay other material indebtedness; |
| Ÿ | issue redeemable, convertible or exchangeable equity securities; |
| Ÿ | sell assets and engage in sale-leaseback transactions; |
| Ÿ | enter into transactions with affiliates; |
| Ÿ | amend, restate, supplement or otherwise modify our organizational documents and certain other material agreements; and |
| Ÿ | alter the nature of our business. |
Our ability to comply with these restrictions and covenants in the future is uncertain and will be affected by the levels of cash flow from our operations and events or circumstances beyond our control. Our failure to comply with any of the restrictions and covenants under the agreement governing our credit facilities could result in a default under the credit agreement, which could cause all of our existing indebtedness to be immediately due and payable. If our indebtedness is accelerated, we may not be able to repay our indebtedness or borrow sufficient funds to refinance it. In addition, in the event of an acceleration lenders under our credit facilities could proceed against the collateral securing the obligations under the credit facilities which includes nearly all of our assets. Even if we are able to obtain new financing, it may not be on commercially reasonable terms or on terms that are acceptable to us. If our indebtedness is in default for any reason, our business, results of operations and financial condition could be materially and adversely affected. In addition, complying with these restrictions and covenants may also cause us to take actions that are not favorable to our stockholders and may make it more difficult for us to successfully execute our business plan and compete against companies that are not subject to such restrictions and covenants. See “Description of Material Indebtedness.”
Risks Related to Our Class A Common Stock and this Offering
After this offering, CEI will continue to have substantial control over us, including the ability to influence the outcome of matters requiring stockholder approval.
Following the consummation of this offering, CEI will beneficially own 100% of our outstanding Class B common stock. The rights of the holders of our Class A common stock and our Class B common stock are identical, except with respect to voting and conversion. Each share of Class A common stock will be entitled to one vote per share. The holders of our Class B common stock are entitled to ten votes per share, and our Class B common stock is convertible into shares of our Class A common stock on a share-for-share basis. Accordingly, after the consummation of this offering, CEI will beneficially own approximately % (or % if the underwriters’ option to purchase additional shares is exercised in full) of the combined voting power of our outstanding common stock. In addition, until CEI beneficially owns less than 10% of our outstanding common stock as of the Charter Effective Date, CEI, through Manheim, has the right to nominate a majority of the directors to our Board.
As a consequence, CEI will be able to exert a significant degree of influence or actual control over our management and affairs and will control matters requiring stockholder approval, including:
| Ÿ | the composition of our Board and, through our Board, decision-making with respect to our business direction and policies, including the appointment and removal of our officers; |
| Ÿ | amendments to our certificate of incorporation; |
| Ÿ | any determinations with respect to acquisitions of businesses, mergers, or other business combinations and significant transactions; |
| Ÿ | appointment, compensation, transfer and removal of our management team; |
| Ÿ | our acquisition or disposition of our assets; |
41
Table of Contents
| Ÿ | our capital structure; |
| Ÿ | our payment or non-payment of dividends on our common stock; and |
| Ÿ | determinations with respect to our tax returns. |
The interests of CEI may not always coincide with our interests or the interests of our other stockholders. For instance, this concentration of ownership may have the effect of delaying or preventing a change in control of us otherwise favored by our other stockholders and could adversely affect our Class A common stock price.
We have elected to take advantage of the “controlled company” exemption to the NYSE corporate governance rules for publicly listed companies.
Because CEI controls more than 50% of the voting power of our common stock, we are a “controlled company” within the meaning of NYSE corporate governance standards. Under NYSE rules, a controlled company may elect not to comply with certain corporate governance requirements, including requirements that: (1) a majority of the Board consist of independent directors; (2) compensation of officers be determined or recommended to the Board by a majority of its independent directors or by a compensation committee that is composed entirely of independent directors; and (3) director nominees be selected or recommended by a majority of the independent directors or by a nominating committee composed solely of independent directors. Because we have elected to take advantage of the controlled company exemption, our stockholders do not have the same protections afforded to stockholders of companies that are subject to all of the NYSE corporate governance requirements. Accordingly, should the interests of our controlling stockholders differ from those of our other stockholders, our other stockholders may not have the same protections afforded to stockholders of companies that are subject to all of the corporate governance rules for NYSE-listed companies. Our status as a controlled company may make our Class A common stock less attractive to some investors or otherwise adversely affect our Class A common stock price.
Provisions in our Related Party Agreement with CEI, CDX and Manheim may limit our ability to expand into certain new businesses or consummate certain acquisitions.
We have entered into a Related Party Agreement with CEI, CDX, and Manheim, pursuant to which we have agreed, for a period ending on the earliest of (i) June 14, 2017, (ii) the date on which CEI and its affiliates no longer, directly or indirectly, have voting control of us or Manheim and (iii) the date on which CEI is no longer controlled by the CEI Related Parties (as defined), not to actively pursue specified business opportunities in the United States, including business, commercial and investment opportunities as well as the development, production or sale of new products or services to the extent that the subject matter of any of the foregoing is in the businesses actively conducted by Manheim and CDX as of June 14, 2012, which consist primarily of wholesale vehicle auctions and related businesses. CEI has agreed to similar limitations for itself and its controlled affiliates, including CDX and Manheim, with respect to business opportunities in our businesses. In addition, we have agreed that as long as CEI and its controlled subsidiaries have voting control of us, we must notify the executive committee of our Board of all acquisitions being actively pursued by us or any of our controlled subsidiaries and Manheim will cause CEI to notify CEI’s chief executive officer or chief financial officer of any acquisitions being actively pursued by CEI and its controlled subsidiaries. If CEI’s chief executive officer and chief financial officer have actual knowledge that Manheim or we are actively pursuing the same acquisition, then CEI’s designees on our Board must recuse themselves from the consideration and approval of such acquisition as long as a Manheim entity is actively pursuing such acquisition. In addition, we have agreed not to enter into acquisitions, loans to third parties or equity investments, without first obtaining the consent of the holders of a majority of our outstanding Class B common stock (which currently is held by affiliates of CEI and which consents
42
Table of Contents
may be subject to such conditions and limitations as such affiliates of CEI specify in their sole discretion). If the holders of such Class B common stock do not consent, CEI and its controlled subsidiaries may not consummate such acquisition, loan or investment without our written consent, which consent must be authorized by the related party committee of our Board. The foregoing limitations may impact our ability to expand into new businesses or consummate acquisitions. If we are unable to enter into new businesses or make acquisitions, loans or equity investments, we could lose market share to competitors who are able to do so, which could have a material adverse effect on our business, results of operations and financial condition.
Conflicts of interest may arise because some of our directors are principals of our principal stockholders.
Upon the completion of this offering, representatives of CEI and Providence Equity Partners will occupy a majority of the seats on our Board. CEI may compete with us directly or invest in entities that directly or indirectly compete with us. In addition, Providence Equity Partners could invest in entities that directly or indirectly compete with us, and entities in which Providence Equity Partners is invested may compete with us in the future. As a result, when conflicts arise between the interests of CEI or Providence Equity Partners and the interests of our other stockholders, these directors may not be disinterested. The representatives of CEI or Providence Equity Partners on our Board, by the terms of our second amended and restated certificate of incorporation, are not required to offer us any corporate opportunity of which they become aware and could take any such opportunity for themselves or offer it to other companies in which they have an investment, unless such opportunity is expressly offered to them solely in their capacity as our directors.
As a public company, we will become subject to additional financial and other reporting and corporate governance requirements that may be difficult and costly for us to satisfy.
We have historically operated our business as a private company. After this offering, we will be required to file with the SEC annual and quarterly information and other reports that are specified in Section 13 of the Securities Exchange Act of 1934, as amended, or the Exchange Act. We will also be required to ensure that we have the ability to prepare financial statements that are fully compliant with all SEC reporting requirements on a timely basis. We will also become subject to other reporting and corporate governance requirements, including the requirements of the NYSE, and certain provisions of the Sarbanes-Oxley Act and the regulations promulgated thereunder, which will impose significant compliance obligations upon us. As a public company, we will be required to, among other things:
| Ÿ | prepare and distribute periodic public reports and other stockholder communications in compliance with our obligations under the federal securities laws and applicable NYSE rules; |
| Ÿ | create or expand the roles and duties of our Board and committees of the Board; |
| Ÿ | institute more comprehensive financial reporting and disclosure compliance functions; |
| Ÿ | supplement our internal accounting, auditing and reporting function, including hiring additional staff with expertise in accounting and financial reporting for a public company; |
| Ÿ | enhance and formalize closing procedures at the end of our accounting periods; |
| Ÿ | enhance our internal audit and tax functions; |
| Ÿ | enhance our investor relations function; |
| Ÿ | establish new internal policies, including those relating to disclosure controls and procedures; and |
| Ÿ | involve and retain to a greater degree outside counsel and accountants in the activities listed above. |
43
Table of Contents
These changes will require a significant commitment of additional resources and management oversight and some of our competitors already comply with these obligations. We may not be successful in implementing these requirements and the significant commitment of resources required for implementing them could materially and adversely affect our business, results of operations and financial condition. If we fail to implement the requirements with respect to our internal accounting and audit functions, our ability to report our results of operations on a timely and accurate basis could be impaired and we could suffer adverse regulatory consequences or violate NYSE continued listing standards. These changes have increased and will continue to increase our costs and might place a strain on our systems and resources. As a result, our management’s attention might be diverted from other business concerns. In addition, if we fail to maintain an effective internal control environment or to comply with the numerous legal and regulatory requirements imposed on public companies, we could make material errors in, and be required to restate, our financial statements. Any such restatement could result in a loss of public confidence in the reliability of our financial statements and sanctions imposed on us by the SEC. Any of these events, should they occur, could have a material adverse effect on the market price of our Class A common stock.
Our internal control over financial reporting does not currently meet the standards required by Section 404 of the Sarbanes-Oxley Act and a material weakness in our internal control over financial reporting has been identified. If we fail to achieve and maintain effective internal control over financial reporting in accordance with Section 404 of the Sarbanes-Oxley Act, such failure could have a material adverse effect on our business and the trading price of our Class A common stock.
Prior to this offering, we were a private company with limited accounting personnel and other resources with which to address our internal control over financial reporting. Our internal control over financial reporting does not currently meet the standards required by Section 404 of the Sarbanes-Oxley Act, standards that we will be required to meet in the course of preparing future financial statements. We do not currently document or test our compliance with these controls on a periodic basis in accordance with Section 404. Furthermore, we have not tested our internal controls in accordance with Section 404 and, due to our lack of documentation, such a test would not be possible to perform at this time.
In the audit of our consolidated financial statements for the year ended December 31, 2011, a material weakness in our internal control over financial reporting, as defined in the standards established by U.S. Public Accounting Oversight Board, was identified. The material weakness identified resulted from our lack of accounting and financial reporting personnel with sufficient experience in applying GAAP to certain significant, complex, non-routine and/or infrequent transactions, specifically accounting for business combinations and related impairment determinations as well as stock-based compensation. As a result, misstatements were identified in the audit process and were corrected prior to the issuance of audited financial statements for the year ended December 31, 2011.
To remedy this material weakness, we are in the process of implementing several measures to improve our internal control over financial reporting, including (i) hiring additional financial and accounting personnel with SEC reporting and public company accounting experience, including an SEC reporting director, (ii) adjusting our policies and procedures for accounting for complex transactions, and (iii) improving the capabilities of our existing financial and accounting personnel through training and education in the accounting for complex transactions and public reporting requirements. We plan to complete these efforts prior to this offering. Our remediation efforts may not be successful in preventing future determinations that we have a material weakness or significant deficiency in our internal control over financial reporting.
44
Table of Contents
In addition to the remediation efforts noted above, we are in the early stages of addressing our internal control procedures to satisfy the requirements of Section 404, which requires an annual management assessment of the effectiveness of our internal control over financial reporting. If, as a public company, we are not able to implement the requirements of Section 404 in a timely manner or with adequate compliance, our independent registered public accounting firm may not be able to attest to the effectiveness of our internal control over financial reporting. If we are unable to maintain adequate internal control over financial reporting, we may be unable to report our financial information on a timely basis, may suffer adverse regulatory consequences or violations of applicable stock exchange listing rules and may breach the covenants under the agreement governing our credit facilities. There could also be a negative reaction in the financial markets due to a loss of investor confidence in us and the reliability of our financial statements.
In addition, we will incur additional costs in order to improve our internal control over financial reporting and comply with Section 404, including increased auditing and legal fees and costs associated with hiring additional accounting and administrative staff.
We expect that our stock price will fluctuate significantly, which could cause the value of your investment in our Class A common stock to decline, and you may not be able to resell your shares at or above the initial public offering price.
Securities markets worldwide have experienced, and are likely to continue to experience, significant price and volume fluctuations. This market volatility, as well as general economic, market or political conditions, could reduce the market price of our Class A common stock regardless of the performance of our business or our results of operations. The trading price of our Class A common stock is likely to be volatile and subject to price fluctuations in response to various factors, including:
| Ÿ | conditions in the broader stock market; |
| Ÿ | actual or anticipated fluctuations in our quarterly financial and operating results; |
| Ÿ | introduction of new services by us, our competitors or our customers; |
| Ÿ | issuance of new or changed securities analysts’ reports or recommendations; |
| Ÿ | investor perceptions of us, the advertising market in general and, in particular, the internet advertising market, the market for our software solutions or the automotive industry; |
| Ÿ | sales, or anticipated sales, of large blocks of our stock, including those by our existing investors; |
| Ÿ | additions or departures of key personnel; |
| Ÿ | regulatory or political developments; |
| Ÿ | litigation and governmental investigations; and |
| Ÿ | prevailing economic conditions. |
These and other factors may cause the market price and demand for shares of our Class A common stock to fluctuate substantially, which may limit or prevent investors from readily selling their shares of Class A common stock and may otherwise negatively affect the liquidity of our Class A common stock. In addition, in the past, when the market price of a stock has been volatile, holders of that stock have sometimes instituted securities class action litigation against the company that issued the stock. If any of our stockholders brought a lawsuit against us, we could incur substantial costs defending the lawsuit. Such a lawsuit could also divert the time and attention of our management from our business, which could significantly harm our reputation and have a material adverse effect on our business, results of operations and financial condition.
45
Table of Contents
Anti-takeover provisions in our second amended and restated certificate of incorporation and our second amended and restated bylaws could prohibit a change of control that our stockholders may favor and could negatively affect the price of our Class A common stock.
Provisions in our second amended and restated certificate of incorporation and our second amended and restated bylaws may make it more difficult and expensive for a third party to acquire control of us even if a change of control would be beneficial to the interests of the holders of our Class A common stock. These provisions may also prevent or frustrate attempts by our stockholders to replace or remove our directors or management. For example, our second amended and restated certificate of incorporation and our second amended and restated bylaws:
| Ÿ | permit our Board to issue preferred stock with such terms as they determine, without stockholder approval; |
| Ÿ | require advance notice for stockholder proposals; |
| Ÿ | provide we will have a staggered Board composed of three classes with only one-third of the members elected at each annual stockholders meeting, after CEI and its affiliates cease to own common stock of ours representing a majority of the outstanding voting power; |
| Ÿ | provide we will not be governed by Section 203 of the Delaware General Corporation Law, which prohibits large stockholders, in particular a stockholder owning 15% or more of the outstanding voting stock, from consummating a merger or combination with a corporation unless this stockholder receives board approval for the transaction or 66 2/3% of the shares of voting stock not owned by the stockholder approve the merger or transaction, until CEI and its affiliates cease to own common stock of ours representing a majority of the outstanding voting power; |
| Ÿ | prohibit actions which may be taken at any annual or special meeting of our stockholders to be taken by written consent of the stockholders after CEI and its affiliates cease to own more than 50% of our outstanding voting stock; and |
| Ÿ | contain limitations on convening stockholder meetings after CEI and its affiliates cease to own common stock of ours representing a majority of the outstanding voting power. |
These provisions make it more difficult for stockholders or potential acquirers to acquire us and could discourage potential takeover attempts and could adversely affect the market price of our Class A common stock.
There may not be an active, liquid trading market for our Class A common stock, or securities or industry analysts may not publish research reports or may publish research reports containing negative information about our business.
Prior to this offering, there has been no public market for shares of our Class A common stock. We cannot predict the extent to which investor interest in our company will lead to the development of a trading market for our Class A common stock on the NYSE or how liquid that market may become. If an active trading market does not develop, you may have difficulty selling any of our Class A common stock that you hold due to the limited public float. The initial public offering price of shares of our Class A common stock will be determined by negotiation between us and the underwriters and may not be indicative of market prices of our Class A common stock that will prevail following the completion of this offering. The trading market for our Class A common stock will be influenced by the research and reports that industry or securities analysts publish about us or our business. If one or more of these analysts cease coverage of us or fail to publish reports on us regularly, we could lose visibility in the financial markets, which in turn could cause our stock price or trading volume to decline. The market price of shares of our Class A common stock may decline below the initial public offering price, and you may not be able to resell your shares of our Class A common stock at or above the initial offering price.
46
Table of Contents
If a substantial number of shares become available for sale and are sold in a short period of time, the market price of our Class A common stock could decline.
If our existing stockholders sell substantial amounts of our Class A common stock in the public market following this offering, the market price of our Class A common stock could decrease significantly. The perception in the public market that our existing stockholders might sell shares of Class A common stock could also depress the market price of our Class A common stock. Upon the consummation of this offering, we will have shares of Class A common stock (including shares of Class A common stock issuable upon conversion of our Class B common stock) outstanding. Our directors, executive officers, and certain of our other stockholders will be subject to the lock-up agreements described in “Underwriting” and may be subject to the Rule 144 holding period requirements described in “Shares Eligible for Future Sale.” After these lock-up agreements have expired and holding periods have elapsed, additional shares of our Class A common stock (including shares of Class A common stock issuable upon conversion of our Class B common stock) will be eligible for sale in the public market. See “Description of Capital Stock.” Our existing stockholders (and certain permitted transferees thereof) will have registration rights with respect to the Class A common stock they hold or have the right to receive. See “Shares Eligible for Future Sale.” The market price of shares of our Class A common stock may drop significantly when the restrictions on resale by our existing stockholders lapse as a result of sales by our stockholders in the market or the perception that such sales could or will occur. In addition, any decline in the price of shares of our Class A common stock could impede our ability to raise capital through the issuance of additional shares of our Class A common stock or other equity securities.
We do not anticipate paying any cash dividends on our Class A common stock for the foreseeable future.
We intend to retain any future earnings to repay indebtedness and to fund our operations and any acquisitions that we may make. We do not intend to pay any dividends to holders of our Class A common stock for the foreseeable future. Our debt agreements limit the amounts available to us to pay cash dividends, and, to the extent that we require additional funding, the sources of such funding may prohibit the payment of a dividend. As a result, capital appreciation in the price of our Class A common stock, if any, will be your only source of gain on an investment in our Class A common stock. See “Dividend Policy.”
New investors in our Class A common stock will experience immediate and substantial book value dilution after this offering.
The initial public offering price of our Class A common stock will be substantially higher than the pro forma net tangible book value per share of the outstanding Class A common stock immediately after the offering. Based on our pro forma net tangible book value as of June 30, 2012, if you purchase our Class A common stock in this offering, you will suffer immediate dilution in net tangible book value per share of approximately $ per share. See “Dilution.”
47
Table of Contents
We estimate that the net proceeds to us from our sale of shares of Class A common stock in this offering will be approximately $ million, after deducting underwriting discounts and commissions and estimated expenses payable by us in connection with this offering. This assumes a public offering price of $ per share, which is the midpoint of the price range set forth on the cover of this prospectus.
We intend to use net proceeds from this offering for the following purposes:
| Ÿ | to repay an aggregate of $ million of indebtedness under our term B loan facility and our revolving credit facility; and |
| Ÿ | other general corporate purposes. |
On April 30, 2012, we amended our credit facilities to, among other things, provide for $400.0 million of additional borrowing capacity, and we drew down the additional capacity to pay a $400.0 million special dividend to the then-existing common stockholders of ATC. For more information regarding our credit facilities, see “Management’s Discussion and Analysis of Financial Condition and Results of Operations—Liquidity and Capital Resources—Credit Facilities.”
Our credit facilities consist of two tranches of term A loans, a term B loan facility and a revolving credit facility. One term A loan tranche and our revolver mature in 2015, the other term A loan tranche matures (subject to certain conditions) in 2017 and the term B loan facility matures in 2016. As of June 30, 2012, the weighted average interest rate under our credit facilities was 2.68%.
We may also use a portion of the net proceeds for acquisitions of technologies, products or companies that complement our business, although we have no current understandings, commitments or agreements to do so.
Certain affiliates of the underwriters are lenders under our credit facilities and are expected to receive a portion of the net proceeds from this offering in connection with our repayment of indebtedness under our credit facilities. See “Underwriting—Conflicts of Interest.”
Assuming no exercise of the underwriters’ option to purchase additional shares, a $1.00 increase (decrease) in the assumed initial public offering price of $ per share (the midpoint of the price range set forth on the cover page of this prospectus) would increase (decrease) the net proceeds to us from this offering by $ million, assuming the number of shares offered by us, as set forth on the cover page of this prospectus, remains the same and after deducting underwriting discounts and commissions and estimated expenses payable by us.
48
Table of Contents
We do not intend to pay cash dividends on our Class A common stock in the foreseeable future. However, in the future, subject to the factors described below and our future liquidity and capitalization, we may change this policy and choose to pay dividends. On April 30, 2012, ATC declared and paid a cash dividend to holders of its Class A, Class B and Class C common stock in an aggregate amount of $400.0 million, or $2.07 per share.
The amounts available to us to pay cash dividends are restricted by the agreement governing our credit facilities. Our business is conducted through our subsidiaries. Dividends from and cash generated by our subsidiaries will be our principal source of cash to pay dividends. Accordingly, our ability to pay dividends is dependent on the earnings and distributions of funds from our subsidiaries. In addition, under Delaware law, our Board may declare dividends only to the extent of our surplus (which is defined as total assets at fair market value minus total liabilities, minus statutory capital) or, if there is no surplus, out of our net profits for the then-current and/or immediately preceding fiscal year.
Any future determination to pay dividends will be at the discretion of our Board and will take into account:
| Ÿ | restrictions in our debt instruments, including our credit facilities; |
| Ÿ | general economic business conditions; |
| Ÿ | our net income, financial condition and results of operations; |
| Ÿ | our capital requirements; |
| Ÿ | our prospects; |
| Ÿ | the ability of our operating subsidiaries to pay dividends and make distributions to us; |
| Ÿ | legal restrictions; and |
| Ÿ | such other factors as our Board may deem relevant. |
49
Table of Contents
The following table sets forth our capitalization, as of June 30, 2012:
| Ÿ | on an actual basis (giving effect to the amendment to our second amended and restated certificate of incorporation effective September 30, 2012 to increase the number of authorized shares of our common stock and to effect a four-for-one stock split of our common stock); and |
| Ÿ | on an as adjusted basis to give effect to the sale of shares of our Class A common stock in this offering, assuming no exercise of the underwriters’ option to purchase additional shares, at an assumed initial offering price of $ per share (the midpoint of the price range set forth on the cover page of this prospectus) after deducting underwriting discounts and commissions and estimated offering expenses payable by us, and the application of the net proceeds received by us from this offering as described under “Use of Proceeds.” |
This table should be read in conjunction with “Use of Proceeds,” “Selected Consolidated Financial Data,” “Management’s Discussion and Analysis of Financial Condition and Results of Operations” and our financial statements and notes thereto included elsewhere in this prospectus.
| As of June 30, 2012, |
||||||||
| Actual | As adjusted | |||||||
| (in thousands) | ||||||||
| Debt: |
||||||||
| Total long-term debt, including current portion |
$ | 1,284,394 | $ | |||||
|
|
|
|
|
|||||
| Redeemable common stock |
62,279 | |||||||
|
|
|
|
|
|||||
| Stockholders’ equity: |
||||||||
| Class A common stock, $0.001 par value—500,000 shares authorized; 72,125 shares issued and outstanding actual (3,759 of which are redeemable); shares issued and outstanding, as adjusted |
68 | |||||||
| Class B common stock, $0.001 par value—200,000 shares authorized; 121,352 shares issued and outstanding, actual and as adjusted |
120 | |||||||
| Additional paid-in capital |
684,912 | |||||||
| Treasury stock |
(539,395 | ) | ||||||
| Retained earnings |
(235,206 | ) | ||||||
|
|
|
|
|
|||||
| Total stockholders’ equity (loss) |
(89,501 | ) | ||||||
|
|
|
|
|
|||||
| Total capitalization(1) |
$ | 1,257,172 | $ | |||||
|
|
|
|
|
|||||
| (1) | Assuming the number of shares sold by us in this offering remains the same, a $1.00 increase or decrease in the initial public offering price would increase or decrease our as adjusted total capitalization by $ million. |
50
Table of Contents
If you invest in our Class A common stock, your ownership interest will be diluted to the extent of the difference between the initial public offering price per share of our Class A common stock and the net tangible book value per share of our Class A common stock upon the consummation of this offering.
Our net tangible book value as of June 30, 2012 was $ , or $ per share of common stock outstanding based on shares of common stock outstanding. The net tangible book value represents the amount of total tangible assets less total liabilities, and net tangible book value per share represents net tangible book value divided by the number of shares of common stock outstanding.
After giving effect to (i) the sale of shares of Class A common stock in this offering at the assumed initial public offering price of $ per share (the midpoint of the price range set forth on the cover of this prospectus) and (ii) the application of the net proceeds from this offering, our as adjusted net tangible book value as of June 30, 2012 would have been $ million, or $ per share. This represents an immediate increase in as adjusted net tangible book value of $ per share to our existing investors and an immediate dilution in as adjusted net tangible book value of $ per share to new investors.
The following table illustrates this dilution on a per share of common stock basis:
| Initial public offering price per share of Class A common stock |
$ | |||||||
| Net tangible book value per share as of June 30, 2012 before this offering |
$ | |||||||
| Increase in net tangible book value per share attributable to new investors |
||||||||
|
|
|
|||||||
| As adjusted net tangible book value per share after this offering |
||||||||
|
|
|
|||||||
| Dilution in net tangible book value per share to new investors |
$ | |||||||
|
|
|
A $1.00 increase (decrease) in the assumed initial public offering price of $ per share would increase (decrease) our as adjusted net tangible book value by $ million, the as adjusted net tangible book value per share after this offering by $ and the dilution per share to new investors by $ assuming the number of shares offered by us, as set forth on the cover page of this prospectus, remains the same, and after deducting the estimated underwriting discounts and commissions and estimated offering expenses payable by us.
The following table summarizes, on an as adjusted basis as of June 30, 2012 after giving effect to this offering, the total number of shares of common stock purchased from us, the total cash consideration paid to us and the average price per share paid by our existing investors and by new investors purchasing shares in this offering:
| Shares Purchased | Total Consideration | Average Price Per Share |
||||||||||||||||
| Number | Percent | Amount | Percent | |||||||||||||||
| Existing stockholders |
% | $ | % | $ | ||||||||||||||
| New investors |
||||||||||||||||||
|
|
|
|
|
|
|
|
|
|
||||||||||
| Total |
% | $ | % | $ | ||||||||||||||
If the underwriters were to fully exercise their option to purchase additional shares of our Class A common stock, the percentage of shares of our common stock held by existing investors would be %, and the percentage of shares of our common stock held by new investors would be %.
51
Table of Contents
The above discussion and tables are based on the number of shares outstanding at June 30, 2012. In addition, we may choose to raise additional capital due to market conditions or strategic considerations even if we believe we have sufficient funds for our current or future operating plans. To the extent that additional capital is raised through the sale of equity or convertible debt securities, the issuance of such securities could result in further dilution to our stockholders.
52
Table of Contents
SELECTED CONSOLIDATED FINANCIAL DATA
The following tables set forth our historical consolidated financial data for the periods and as of the dates indicated. We derived the consolidated statements of income data for the years ended December 31, 2009, 2010 and 2011 and the consolidated balance sheet data as of December 31, 2010 and 2011 from our audited consolidated financial statements and related notes thereto included elsewhere in this prospectus. The consolidated statements of income data for the six months ended June 30, 2011 and 2012 and consolidated balance sheet data as of June 30, 2012 have been derived from our unaudited consolidated financial statements included elsewhere in this prospectus. The consolidated balance sheet data as of December 31, 2007, 2008 and 2009 and the consolidated statements of income data for the years ended December 31, 2007 and 2008 are derived from our audited financial statements that are not included in this prospectus.
Our historical results are not necessarily indicative of future operating results. You should read the information set forth below together with “Management’s Discussion and Analysis of Financial Condition and Results of Operations,” “Capitalization” and our financial statements and the related notes thereto included elsewhere in this prospectus.
| Year ended December 31, |
Six Months ended June 30, |
|||||||||||||||||||||||||||
| 2007 | 2008 | 2009 | 2010 | 2011 | 2011 | 2012 | ||||||||||||||||||||||
| (in thousands, except per share data) | ||||||||||||||||||||||||||||
| Consolidated statement of income data: |
||||||||||||||||||||||||||||
| Revenues |
||||||||||||||||||||||||||||
| Digital Media |
$ | 516,492 | $ | 621,196 | $ | 629,450 | $ | 725,890 | $ | 917,041 | $ | 446,753 | $ | 486,103 | ||||||||||||||
| Software Solutions |
— | — | — | 11,937 | 108,136 | 43,212 | 76,988 | |||||||||||||||||||||
|
|
|
|
|
|
|
|
|
|
|
|
|
|
|
|||||||||||||||
| Total revenues |
$ | 516,492 | $ | 621,196 | $ | 629,450 | $ | 737,827 | $ | 1,025,177 | $ | 489,965 | $ | 563,091 | ||||||||||||||
|
|
|
|
|
|
|
|
|
|
|
|
|
|
|
|||||||||||||||
| Operating Expenses: |
||||||||||||||||||||||||||||
| Operations |
90,241 | 109,353 | 106,190 | 117,471 | 197,187 | 91,225 | 111,620 | |||||||||||||||||||||
| Sales and marketing |
260,061 | 291,857 | 331,285 | 371,060 | 402,054 | 202,455 | 218,549 | |||||||||||||||||||||
| General and administrative |
57,439 | 57,547 | 55,605 | 68,293 | 117,381 | 57,149 | 64,758 | |||||||||||||||||||||
| Depreciation and amortization |
109,546 | 129,366 | 120,471 | 65,325 | 122,951 | 61,224 | 63,919 | |||||||||||||||||||||
| Impairment of goodwill |
— | 5,310 | — | — | 36,216 | — | 11,112 | |||||||||||||||||||||
| Impairment of intangible assets |
— | — | — | — | — | — | 4,544 | |||||||||||||||||||||
| Other |
31 | 175 | 1,374 | 1,131 | 9,634 | 6,043 | 873 | |||||||||||||||||||||
|
|
|
|
|
|
|
|
|
|
|
|
|
|
|
|||||||||||||||
| Total operating expenses |
517,318 | 593,608 | 614,925 | 623,280 | 885,423 | 418,096 | 475,375 | |||||||||||||||||||||
|
|
|
|
|
|
|
|
|
|
|
|
|
|
|
|||||||||||||||
| (Loss) income from operations |
(826 | ) | 27,588 | 14,525 | 114,547 | 139,754 | 71,869 | 87,716 | ||||||||||||||||||||
| Total other (expense) income |
(305 | ) | 1,604 | 379 | (40,066 | ) | (33,011 | ) | (17,321 | ) | (15,969 | ) | ||||||||||||||||
|
|
|
|
|
|
|
|
|
|
|
|
|
|
|
|||||||||||||||
| (Loss) income before income taxes |
(1,131 | ) | 29,192 | 14,904 | 74,481 | 106,743 | 54,548 | 71,747 | ||||||||||||||||||||
| Income tax (benefit) expense |
(61,650 | ) | 14,130 | 5,045 | 25,357 | 38,692 | 22,403 | 30,135 | ||||||||||||||||||||
|
|
|
|
|
|
|
|
|
|
|
|
|
|
|
|||||||||||||||
| Net income |
$ | 60,519 | $ | 15,062 | $ | 9,859 | $ | 49,124 | $ | 68,051 | $ | 32,145 | $ | 41,612 | ||||||||||||||
|
|
|
|
|
|
|
|
|
|
|
|
|
|
|
|||||||||||||||
| Net income per share(1): |
||||||||||||||||||||||||||||
| Basic |
$ | 0.28 | $ | 0.07 | $ | 0.05 | $ | 0.26 | $ | 0.35 | $ | 0.17 | $ | 0.22 | ||||||||||||||
| Diluted |
$ | 0.28 | $ | 0.07 | $ | 0.05 | $ | 0.26 | $ | 0.35 | $ | 0.17 | $ | 0.21 | ||||||||||||||
| Shares used in computing net income per share(1): |
||||||||||||||||||||||||||||
| Basic |
213,208 | 212,988 | 211,928 | 190,024 | 193,168 | 193,136 | 193,356 | |||||||||||||||||||||
| Diluted |
215,120 | 214,296 | 212,612 | 190,236 | 193,484 | 193,212 | 193,732 | |||||||||||||||||||||
53
Table of Contents
| As of December 31, |
As of June 30, |
|||||||||||||||||||||||
| 2007 | 2008 | 2009 | 2010 | 2011 | 2012 | |||||||||||||||||||
| (in thousands) | ||||||||||||||||||||||||
| Consolidated balance sheet data: |
||||||||||||||||||||||||
| Amounts due from (to) CEI(2) |
$ | 52,046 | $ | 47,332 | $ | 80,864 | $ | 4,056 | $ | 2,476 | $ | (2,102 | ) | |||||||||||
| Total assets |
620,940 | 557,922 | 524,978 | 1,421,709 | 1,511,150 | 1,485,748 | ||||||||||||||||||
| Total long-term debt and capital leases, including current portion |
— | — | — | 885,972 | 892,979 | 1,284,790 | ||||||||||||||||||
| Total stockholders’ equity (deficit) |
462,939 | 432,967 | 436,595 | 209,042 | 265,013 | (89,501 | ) | |||||||||||||||||
| (1) | We amended our second amended and restated certificate of incorporation effective as of September 30, 2012 to increase the number of authorized shares of our common stock and to effect a four-for-one stock split of our common stock. See “Prospectus Summary—Recent Developments—Amendment to Certificate of Incorporation and Stock Split.” Accordingly, all share and per share data presented in this table reflect the impact of the increase in authorized shares and the stock split. |
| (2) | CEI provides cash management services to us. This amount represents the net outstanding balance of our cash balances held by CEI offset by the amounts due to CEI for the provision of certain specified services. See “Certain Relationships and Related Person Transactions—Agreements Related to CEI—Cash Management Agreement.” |
54
Table of Contents
MANAGEMENT’S DISCUSSION AND ANALYSIS OF
FINANCIAL CONDITION AND RESULTS OF OPERATIONS
The following discussion and analysis of our financial condition and results of operations should be read together with “Selected Consolidated Financial Data” and the consolidated and unconsolidated financial statements and the related notes included elsewhere in this prospectus. This discussion includes the financial results of ATC prior to the formation of ATG and the merger of a subsidiary of ATG with and into ATC. This discussion contains forward-looking statements, based on current expectations and related to future events and our future financial performance, that involve risks and uncertainties. Our actual results may differ materially from those anticipated in these forward-looking statements as a result of many factors, including those set forth under “Risk Factors,” “Forward-Looking Statements” and elsewhere in this prospectus.
Overview
AutoTrader Group connects in-market car shoppers and sellers through our AutoTrader.com and KBB.com websites, which showcase car listings in local markets in the United States as well as descriptive content relating to cars. We also offer car dealers software solutions to help them source, appraise, manage, price and market their inventory, and help them manage their consumer relationships. We generate revenue through subscriptions for new and used car listings, sales of brand advertising and software solution subscriptions.
Our business targets three main constituent groups: in-market car shoppers, car dealers and brand advertisers. Car shoppers come to our websites in order to search what we believe is the largest collection of unduplicated vehicle listings, read descriptive reviews of cars, compare specific vehicles and use our proprietary valuation and pricing tools. Car dealers advertise their listings on our websites in order to reach what is, based on the 2011 KS&R Study, the largest targeted audience of in-market car shoppers in the United States. Car dealers also purchase or license software solutions from us to enhance their operations. Brand advertisers buy display advertisements to target our audience of in-market car shoppers. Our largest category of brand advertisers is automotive OEMs.
In the six months ended June 30, 2012, we had over 28 million average monthly unique visitors on our websites and, as of June 30, 2012, over 3.6 million daily new and used car listings on our AutoTrader.com website from our network of over 25,000 dealer relationships in our Digital Media business. Over 21,000 of these dealers pay us monthly fees to have their new and used car listings on our websites or for our Software Solutions, and we refer to these dealers as subscribing dealers. Our Digital Media MRR was $3,001 as of December 31, 2011, our Software Solutions MRR was $1,750 as of December 31, 2011 and our Digital Media MRR and Software Solutions MRR were $3,183 and $1,892, respectively, as of June 30, 2012. We sold advertisements on our websites to most major OEMs during the six months ended June 30, 2012. We served 19.0 billion and 10.0 billion advertisement impressions, respectively, on our websites in the year ended December 31, 2011 and in the six months ended June 30, 2012.
In 2011, we generated $1.0 billion of revenues, $334.6 million of Adjusted EBITDA, and $68.1 million of net income. This represented growth of 39%, 58% and 39%, respectively, over the prior year. In the six months ended June 30, 2012, we generated $563.1 million of revenues, $176.3 million of Adjusted EBITDA and $41.6 million of net income, representing a change of 15%, 16% and 29%, respectively, compared to the six month period ended June 30, 2011. We achieved these results through organic growth of AutoTrader.com, strategic acquisitions and our ongoing relationship with CEI.
55
Table of Contents
Strategic Acquisitions
In December 2010, we expanded our Digital Media business through the acquisition of Kelley Blue Book. Kelley Blue Book provides extensive, objective third-party automobile valuations through KBB.com and in print, with over 2.5 billion pricing reports generated over the last ten years. Since the acquisition, we have invested in enhancing the content and functionality of the KBB.com website, increasing awareness of the Kelley Blue Book brand and increasing traffic to KBB.com.
In October 2010, we established our Software Solutions business through the acquisition of vAuto, a provider of advanced software tools for used vehicle management, pricing and inventory optimization. We further expanded our Software Solutions business through our December 2010 acquisition of HomeNet, a provider of online inventory information management and merchandising solutions to car dealers, and our June 2011 acquisition of VinSolutions, a provider of CRM and internet lead management, inventory management software, dealer websites, sales management tools and social media and direct targeted marketing campaign tools to car dealers. In addition, our software solutions also include CDMdata dealer inventory and management solutions, which were acquired with Kelley Blue Book. Since our acquisitions, we have made investments in our Software Solutions business, including recruiting key management and sales and support personnel, investing in additional hardware, new data centers and phone systems and developing mobile solutions.
We refer to the acquisitions we made in 2010 of Kelley Blue Book, CDMdata, vAuto and HomeNet as our 2010 Acquisitions.
Bitauto Investment
In November 2012, we agreed to acquire a 21.8% interest in Bitauto for $58.5 million, subject to specified closing conditions. Bitauto is a provider of internet content and marketing services for China’s automotive industry. In connection with this investment, we entered into an agreement with certain members of Bitauto’s senior management team whereby we agreed to finance their purchase of $6.5 million of Bitauto shares. In exchange, they agreed to issue to us an aggregate principal amount of $6.5 million in senior secured guaranteed exchangeable bonds. The exchangeable bonds will bear interest at 10% per annum and have a four-year term. We will account for the investment in Bitauto using the equity method of accounting and have recorded a $6.5 million note receivable for the exchangeable bonds.
Our Business Segments
Our business is comprised of two distinct business segments: Digital Media and Software Solutions. In 2011, we generated 89% of our revenues from our Digital Media segment and 11% of our revenues from our Software Solutions segment. In the six months ended June 30, 2012, we generated 86% of our revenues from our Digital Media segment and 14% of our revenues from our Software Solutions segment. Prior to 2011, substantially all of our revenues were generated through our AutoTrader.com website. In 2011, our Digital Media business expanded as a result of the Kelley Blue Book acquisition, which accounted for $125.7 million of the $191.2 million increase in Digital Media revenue in 2011.
Digital Media
We sell digital media subscriptions to dealers on a pay-for-placement basis through tiered listing packages. Listings that are placed in our premium and featured tiers are displayed more prominently on a consumer’s search results page on our websites and, therefore, are viewed more frequently by consumers. We charge more for subscriptions to our premium tiers than we do for our featured tiers. In addition, we provide basic, limited used car listings to dealers for free. We also sell to dealers additional advertising services, which we refer to as à la carte enhancement services, on an episodic or on-going basis and on a bundled basis with our premium and featured listing subscriptions. These
56
Table of Contents
services include additional features within the listings (such as more photos and videos) and our Alpha, Spotlight, and Tower advertising services. Dealers can also subscribe to our TIM service, which was launched in 2009. We also generate revenue in our Digital Media segment by selling display advertising on our websites to OEMs and other advertisers, which purchase display advertisements based on a cost per thousand impressions, or CPM.
We offer our listings and display advertising to dealers through a team of over 1,400 highly-trained, consultative sales and support professionals. Our dealer sales force regularly meets with dealers to review their performance and to optimize their presence on our websites. Through our consultative sales force, we seek to increase the amount that each of our subscribing dealers spends on our digital media solutions by helping them see the value of our premium listings packages and additional features that are designed to increase the performance of the dealer’s listings. We also seek to increase our penetration among dealers by specifically targeting our marketing efforts to increase traffic to, and brand recognition of, our websites. We also continue to develop listing solutions and sales channels to fit the evolving needs of dealers.
Software Solutions
In our Software Solutions segment, we generate revenue by selling subscriptions to our portfolio of software solutions, which help our dealer customers manage their operations more efficiently. Our portfolio includes solutions that address dealer inventory, sourcing and management, CRM, marketing, prospect tracking and value appraising. We provide dealers with analytical tools which allow them to target selected used vehicles to purchase for their inventory and provide them with an analytical framework for determining optimal list prices. We believe this enables dealers to increase the velocity of their turnover in used car inventory, resulting in increased profit opportunities for them. We also provide dealers with integrated CRM software solutions that enhance the ability of dealers to track their inventory, consumer prospects and relationships, as well as to develop a web presence, create direct marketing campaigns and instantly advertise inventory across their own and third-party websites, including AutoTrader.com and KBB.com.
Our sales force and software solutions marketing efforts are focused on penetrating our existing base of Digital Media subscribing dealers as a large number of these dealers do not subscribe to our software solutions. In addition, we are seeking to expand the number of our software solutions used by each dealer. We are also focused on developing and launching new software solutions for dealers. For example, we launched our Provision used vehicle stocking solution in 2011. As we grow our Software Solutions business, we are also investing in increasing the market awareness of vAuto, VinSolutions and our other brands.
Key Metrics
Number of Subscribing Dealers and Monthly Run Rate (MRR)
We track the number of subscribing dealers in our Digital Media and Software Solutions segments. For purposes of our calculation of subscribing dealers, we consider all of the franchises at a single address to be one dealer. Subscribing dealers consists of the number of dealers subscribing to one or more of our listing packages or software solutions at the end of a period. We believe that the number of our subscribing dealers is indicative of the success of our sales and marketing efforts, including our ability to further penetrate the dealer market, cross-sell our software solutions to our Digital Media customers and maintain our existing and develop new dealer relationships.
We also track MRR for both of our business segments and for each of our subscribing dealers.
57
Table of Contents
We define Digital Media MRR as the monthly run rate of subscription-related revenues for our featured and premium listings and our TIM service as of the last day of a period, as well as on-going à la carte enhancement service purchases, such as purchases of our Alpha, Spotlight or Tower services, divided by the number of Digital Media subscribing dealers at period end. Digital Media MRR does not include short-term or episodic à la carte enhancement product or other short-term placements and does not give effect to set-up fees, credits or promotional arrangements. We define Software Solutions MRR as the monthly run rate of subscription-related revenues from our Software Solutions business, as of the last day of a period, divided by the number of Software Solutions subscribing dealers at period end. In calculating Software Solutions MRR, we do not include installation or set-up fees, vAuto revenue-sharing arrangements or marketing campaign revenues. In addition, we do not take into account credits to customers, bad debt expenses or other collection-related adjustments or promotional arrangements. We view MRR as a key indicator of our growth and the success of our sales and marketing efforts and strategy to create new digital media and software solutions that are valuable to our dealer customers. We believe that advances in data analytics are accelerating our sales force’s ability to quantitatively educate dealers about the cost-effective impact and influence of our services. This, in turn, is leading to increased dealer budget allocations to our premium digital media services and increased penetration of our software solutions. We did not track Software Solutions subscribing dealers prior to the fourth quarter of 2011.
Digital Media MRR is primarily a function of our listing subscription fees which typically range from $660 to $7,068 per month and can be as high as $42,975 per month per dealer. Our Digital Media MRR has grown from $2,267 as of December 31, 2009 to $3,001 as of December 31, 2011 and $3,183 as of June 30, 2012. For 2009, 2010 and as of June 30, 2011, Digital Media MRR reflected monthly subscription-related revenues solely on our AutoTrader.com website, as we did not generate subscription-related revenues on our KBB.com website. In our Digital Media business, we aim to capture a larger share of each subscribing dealer’s marketing expenditures as we demonstrate the value of our premium classifieds listings packages, increase penetration of our enhancement advertising services (including Alpha, Spotlight and Tower), increase market acceptance of our recently launched services, including TIM, and introduce additional innovative services over time.
Since we recently acquired the businesses that make up our Software Solutions segment, we did not track Software Solutions MRR prior to the fourth quarter of 2011. Our Software Solutions MRR as of December 31, 2011 and June 30, 2012 was $1,750 and $1,892, respectively. In our Software Solutions business, we aim to convert our existing Digital Media subscribing dealers into subscribers to our software solutions, increase the number of software solutions utilized by existing software solution customers, and increase market acceptance of new software solutions that we introduce in the future.
We believe these key metrics enable us to evaluate our performance on a rate and volume basis.
The following table sets forth MRR and subscribing dealer data for our Digital Media and Software Solutions businesses as of the dates indicated:
| As of December 31, | As of June 30, | |||||||||||||||||||
| 2009 | 2010 | 2011 | 2011 | 2012 | ||||||||||||||||
| Digital Media |
||||||||||||||||||||
| Subscribing Dealers |
19,517 | 19,839 | 20,307 | 20,116 | 20,218 | |||||||||||||||
| MRR |
$ | 2,267 | $ | 2,612 | $ | 3,001 | $ | 2,729 | $ | 3,183 | ||||||||||
| Software Solutions(1) |
||||||||||||||||||||
| Subscribing Dealers |
— | — | 4,889 | — | 5,534 | |||||||||||||||
| MRR |
$ | — | $ | — | $ | 1,750 | $ | — | $ | 1,892 | ||||||||||
| (1) | MRR and Subscribing Dealers were not tracked for our Software Solutions business prior to the fourth quarter of 2011. |
58
Table of Contents
Dealer Churn
We review dealer churn, which we define as the total number of subscribing dealers that are no longer customers at the end of a given month divided by the number of subscribing dealers at the beginning of that month. We believe dealer churn is a good indicator of dealer satisfaction with our solutions and the success of our sales and marketing efforts. In 2011 and for the six months ended June 30, 2012, our average monthly dealer churn was 1.6% and 1.8%, respectively. Prior to the fourth quarter of 2011, we tracked dealer churn for only AutoTrader.com subscribing dealers. We do not track dealer churn in our Software Solutions business.
Monthly Unique Visitors
We track the monthly unique visitors to AutoTrader.com and KBB.com. Monthly unique visitors is the number of visitors with unique cookies who have visited our websites using either a computer or mobile browser at least once in a given month. An individual who accesses one of our websites from multiple devices with different cookies will be counted as multiple unique visitors, and multiple individuals who access our websites from a shared device with a single cookie will be counted as a single unique visitor. We use proprietary and third-party tools to track unique visitors. Our methodology is compliant with the Interactive Advertising Bureau’s Audience Reach Measurement Guidelines. We calculate monthly unique visitors on an average basis by calculating the unique visitors for each month in the period, adding them together and then dividing the sum by the number of months in the period. The number of monthly unique visitors is indicative of the traffic on our websites, which is important to our Digital Media subscribing dealers as well as to our advertisers. This metric is also an important indicator of the success of our marketing campaigns.
We separately track monthly unique visitors to each of AutoTrader.com and KBB.com, and there is overlap among unique visitors on the two websites. For the six months ended June 30, 2012, the overlap of unique visitors on AutoTrader.com and KBB.com was 2.4 million, excluding mobile visitors, or 9% of the combined average monthly unique visitors on the two websites. The following table sets forth the number of average monthly unique visitors to each of AutoTrader.com and KBB.com for the each of the periods presented (in thousands):
| Year ended December 31, |
Six Months ended June 30, |
|||||||||||||||||||
| 2009 | 2010 | 2011 | 2011 | 2012 | ||||||||||||||||
| AutoTrader.com |
13,488 | 13,977 | 15,016 | 15,415 | 16,661 | |||||||||||||||
| KBB.com(1) |
10,800 | 11,392 | 12,517 | 12,918 | 14,386 | |||||||||||||||
| (1) | Includes data from periods prior to our acquisition of Kelley Blue Book in December 2010. |
Number of Listings
We track the number of listings on our AutoTrader.com website as an indicator of business activity. The number of listings as of a specified date is the total number of car listings on the AutoTrader.com website on that date. We had over 3.4 million and 3.6 million monthly unique car listings, respectively, on AutoTrader.com and KBB.com as of December 31, 2011 and as of June 30, 2012. Prior to June 2012, listings on KBB.com were being provided by a third party. In June 2012, we began providing dealers with the option of listing new and used cars on KBB.com, which are offered to our subscribing dealers on AutoTrader.com as an upgrade to our listing subscriptions.
Brand Advertising Revenues
In 2011 and the six months ended June 30, 2012, brand advertising revenues made up approximately 18% and 17%, respectively, of the revenues in our Digital Media business. We sell
59
Table of Contents
brand advertising to OEMs and dealer associations. We served 10.4 billion and 5.4 billion brand advertising impressions, respectively, on our websites in the year ended December 31, 2011 and the six months ended June 30, 2012. Brand advertising revenues are a function of the CPM that we charge and the number of impressions that we served.
Adjusted EBITDA
Adjusted EBITDA is a non-GAAP financial measure of our operating performance that we calculate as net income adjusted to exclude acquisition transactions costs and severance costs, long-term incentive compensation, depreciation and amortization, impairment of goodwill and intangible assets, other operating expense, other (income) expense and income tax expense. We believe that Adjusted EBITDA enhances investors’ understanding of our business and our results of operations and assists investors in evaluating our performance in the same manner as management. We also believe Adjusted EBITDA is used by investors as a supplemental measure to evaluate the overall operating performance of companies in our industry. This non-GAAP information is not necessarily comparable to non-GAAP information provided by other companies. Adjusted EBITDA has limitations as an analytical tool, and you should not consider it in isolation, or as a substitute for analysis of our results as reported under GAAP. For more information about Adjusted EBITDA and a reconciliation of Adjusted EBITDA to net income, see “Summary Historical Consolidated Financial and Other Data” and “Selected Consolidated Financial Data.”
Segment Profit
Segment Profit is a non-GAAP financial measure of the operating performance of our business segments that we calculate as segment revenues less segment operating expenses. See Note 16, “Segment Information,” to our audited financial statements included elsewhere in this prospectus.
Factors Affecting Our Performance
Dealer Spending on Online Marketing
Our Digital Media revenues and Digital Media MRR are dependent on the amount dealers spend on paid listings and on advertising on our websites. In order to increase our revenues, dealers will have to increase the amount they spend on online marketing in absolute dollars or as a percentage of their total marketing expenditures.
Existing Subscribing Dealer Penetration
Our future growth will depend in part on our ability to successfully increase the amount that each of our dealer customers spends on our digital media solutions. We have made a substantial investment in our sales organization, and we are dependent on the success of that organization in helping our subscribing dealers see the value and the return on investment of our premium listings and our enhancement services.
Launch of New Services
Historically, we have had success in increasing the revenues in our Digital Media business through the launch of new value-added services, including featured listings, premium listings, our Alpha, Spotlight and Tower advertisement enhancement services and our TIM service. We also intend to launch new software solutions in order to increase revenues in our Software Solutions business. Our revenue growth in the future will be dependent, in part, on our ability to successfully innovate, develop, launch and gain market acceptance of new services that we can sell to dealers for an additional
60
Table of Contents
monthly subscription fee. Also, our future results of operations will be affected by the timing of the launch of new services.
Development of Our Software Solutions Business
We aim to grow our recently acquired Software Solutions business and our success will depend on our ability to cross-sell our software solutions to our dealer customer base and otherwise increase the overall number of dealers using our software solutions. Our ability to increase our MRR in our Software Solutions business will also depend on our success in increasing the number of software solutions subscribed to by our customers.
Ability to Attract In-Market Car Shoppers
We believe the number of in-market car shoppers that utilize our websites is a key differentiator and directly impacts the value of our websites to dealers and advertisers and the amount subscribing dealers and advertisers are willing to spend on our digital media solutions. Our ability to increase MRR in our Digital Media business and our advertising sales is dependent on our ability to continue to attract in-market car shoppers to our AutoTrader.com and KBB.com websites. In addition, the data we derive about the behavior of in-market car shoppers on our websites enables us to provide useful market insights to dealers and brand advertisers, which supports the development of new services and increases the utility of our software solutions.
Marketing and Sponsorship Activities
We have invested aggressively in building the recognition of our AutoTrader.com brand and we are increasing our investment in our Kelley Blue Book brand. We spent over $111 million and $62 million on marketing initiatives in the year ended December 31, 2011 and the six months ended June 30, 2012, respectively, and have spent over $840 million on marketing initiatives since our inception in 1997. We have sponsorship relationships with many well-known brands, including the National Football League, National Basketball Association, the National Hockey League and Major League Baseball, and we also have long-term relationships with A&E, CBS, ESPN, Fox, Lifetime and TNT. We intend to continue to purchase significant online and traditional advertising as well as sports programming sponsorships and marketing positions at major consumer automotive shows to increase traffic on our websites and enhance the market perception of our company, brands and solutions. The timing and magnitude of our marketing and sponsorship activities will impact our sales and marketing expense in a given period and the relative effectiveness of such activities could have a significant impact on our revenues in future periods.
Conditions in the Retail Automotive Industry
We operate in the retail automotive industry in the United States and our principal customers are car dealers. Accordingly, our results can be impacted by prevailing economic and market conditions that impact the retail automotive industry in general and car dealers, in particular. Improving economic conditions in 2010 and 2011 have improved new and used car sales, which we believe has had a positive impact on dealer revenues and, in turn, has had a positive impact on our revenues. In contrast, adverse market conditions such as those that prevailed in 2008 and 2009 reduced the number of dealers that were in business and adversely impacted surviving dealers. We believe these conditions adversely affected the amount dealers, OEMs and other advertisers were willing to spend on advertising in general, including digital media advertising, which impacted our revenues and our rate of growth during that period. In addition, general economic conditions can impact the number of in-market car shoppers on our websites and the availability of used car inventory, which makes up the vast majority of the paid listings on our websites.
61
Table of Contents
Components of Revenues and Expenses
Components of Revenues
We generate revenues from two business segments: Digital Media and Software Solutions. The following table provides a breakdown of our revenues by segment:
| Year ended December 31, |
Six Months ended June 30, |
|||||||||||||||||||
| 2009 | 2010 | 2011 | 2011 | 2012 | ||||||||||||||||
| (dollars in thousands) | ||||||||||||||||||||
| Revenues by Segment |
||||||||||||||||||||
| Digital Media(1) |
$ | 629,450 | $ | 725,890 | $ | 917,041 | $ | 446,753 | $ | 486,103 | ||||||||||
| Software Solutions |
— | 11,937 | 108,136 | 43,212 | 76,988 | |||||||||||||||
|
|
|
|
|
|
|
|
|
|
|
|||||||||||
| Total |
$ | 629,450 | $ | 737,827 | $ | 1,025,177 | $ | 489,965 | $ | 563,091 | ||||||||||
| Percentage of Total Revenues |
||||||||||||||||||||
| Digital Media |
100 | % | 98 | % | 89 | % | 91 | % | 86 | % | ||||||||||
| Software Solutions |
— | % | 2 | % | 11 | % | 9 | % | 14 | % | ||||||||||
|
|
|
|
|
|
|
|
|
|
|
|||||||||||
| Total |
100 | % | 100 | % | 100 | % | 100 | % | 100 | % | ||||||||||
| (1) | Includes revenues from AutoTrader Classics and AutoTrader Latino. We ceased operating these as print businesses in May 2011 and October 2011, respectively, in order to focus on our Digital Media business. We continue to serve classic car enthusiasts, dealers and advertisers through our autotraderclassics.com and dealsonwheels.com websites. We direct visitors of the autotraderlatino.com website to a Spanish-translated version of the Find Your Car page on autotrader.com. As a result of these changes, we no longer generate revenues associated with the print versions of these publications which accounted for a substantial portion of the revenues associated with AutoTrader Classics and AutoTrader Latino. However, we continue to generate revenues from the related digital media businesses. The following table sets forth revenues for AutoTrader Classics and AutoTrader Latino for the periods indicated: |
| Year ended December 31, |
Six Months ended June 30, |
|||||||||||||||||||
| 2009 | 2010 | 2011 | 2011 | 2012 | ||||||||||||||||
| (in thousands) | ||||||||||||||||||||
| AutoTrader Classics |
$ | 19,805 | $ | 17,407 | $ | 7,243 | $ | 4,878 | $ | 2,188 | ||||||||||
| AutoTrader Latino |
$ | 6,889 | $ | 10,433 | $ | 6,950 | $ | 4,819 | — | |||||||||||
In our Digital Media business, we primarily generate revenues through listings services and enhancement services. Listing services, which include dealer tiered listing subscriptions and private seller listings services, generated approximately 74%, 70%, 63% and 65%, respectively, of our Digital Media revenues in 2009, 2010, 2011 and the six months ended June 30, 2012. Enhancement services include à la carte enhancement advertising, trade-in-marketplace, brand advertising and other services, which generated the remainder of our Digital Media revenues.
Tiered Listing Subscriptions. We generate revenues by selling car dealers recurring, monthly subscriptions to advertise their new and used car listings on our AutoTrader.com and KBB.com websites and mobile platforms. Subscription pricing varies depending on the listings features, including vehicle photos, video capability, bundled enhanced advertising services and the placement of the listing on our search results page. On AutoTrader.com, these subscriptions are tiered into premium and featured categories.
À la Carte Enhancement Advertising Services. In addition to our tiered listing subscriptions, we generate revenues by selling dealers add-on advertising services on our websites that can be purchased à la carte on an on-going or episodic basis, including our Alpha, Spotlight and Tower highlighted
62
Table of Contents
placements. Our Alpha and Spotlight placements are the prominently visible interactive advertising positions across the top of a search results page, which allow consumers to view multiple cars in the advertising dealer’s inventory. Our Tower placements are along the side of a search results page. We sell these placements by zip code so that consumers only see relevant advertisers in their vicinity.
Trade-in-Marketplace. We generate revenues by selling dealers monthly, recurring subscriptions to our TIM service, which was launched in 2009. This solution offers consumers the ability to trade-in or sell their car to a dealer through an instant trade-in offer. By filling out a form on our websites with details about their car, a consumer can receive an offer to purchase the car which is redeemable at a participating local dealer, subject to an inspection report, and then trade in the car for cash or use the offer to offset the cost of a new or used car purchase.
Brand Advertising. We generate revenues from the sale of display advertising to OEMs and dealer associations on our website pages. We sell this advertising on a CPM basis. We typically guarantee for a fixed fee a minimum number of impressions, or times that an advertisement appears in pages viewed by users. As a result, our advertising revenues are impacted by the number of impressions served in a given period and our prevailing CPM during that period.
Private Seller Listings. We generate revenues from the sale of listing packages to individual sellers seeking to list their used car for sale on our websites. An individual can purchase several tiers of listing services on AutoTrader.com with different lengths of run, photo and video options and page placement.
Other. We generate other revenues from a variety of sources. We generate revenues by selling display advertising to other advertisers, including finance, insurance and warranty companies, and aftermarket retailers who market their services to consumers on or through our websites. Revenues from such advertising are typically derived from transaction-based fees determined by contractually defined metrics, such as total website visits, specific traffic referrals or transaction leads generated by the advertising. We also sell vehicle valuations and other data to finance and insurance companies and other interested parties, as well as print versions of Kelley Blue Book. From 2009 to 2011, we operated AutoTrader Classics and AutoTrader Latino as print and digital media businesses. We ceased operating these as print businesses in May 2011 and October 2011, respectively, in order to focus on our Digital Media business. We continue to serve classic car enthusiasts, dealers and advertisers through our autotraderclassics.com and dealsonwheels.com websites. We direct visitors of the autotraderlatino.com website to a Spanish-translated version of the Find Your Car page on autotrader.com. As a result of these changes, we no longer generate revenues associated with the print versions of these publications which accounted for a substantial portion of the revenues associated with AutoTrader Classics and AutoTrader Latino. However, we continue to generate revenues from the related digital media businesses. Other generated approximately 6%, 7% and 5%, respectively, of our Digital Media revenue in 2010, 2011 and the six months ended June 30, 2012.
In our Software Solutions segment, we generate revenues through the following services:
Inventory Management Subscriptions. We generate revenues by selling to dealers monthly, recurring subscriptions to our premium desktop inventory management software. Through these services, dealers can evaluate what vehicle to purchase at what price and search sources for inventory procurement. Dealers pay an initial set-up fee for installation and can also purchase add-on software services or modules. Inventory management subscriptions generated approximately 93%, 56% and 48%, respectively, of our Software Solutions revenues in 2010, 2011, and the six months ended June 30, 2012.
Integrated CRM Subscriptions. We generate revenues by selling to dealers monthly, recurring subscriptions to our web-based integrated platform for dealer websites, CRM, lead generation and
63
Table of Contents
tracking, and marketing. Dealers pay an initial set-up fee for installation and can also purchase add-on software services or modules. Integrated CRM subscriptions generated approximately 21% and 35%, respectively, of our Software Solutions revenues in 2011 and the six months ended June 30, 2012. We did not generate any of our Software Solutions revenue from integrated CRM subscriptions before our acquisition of VinSolutions in June 2011.
Other Solutions. We generate revenues by offering other add-on services to dealers, which include online inventory management, merchandising and syndication solutions through HomeNet and other software solutions provided through our CDMdata business. Other solutions generated approximately 7%, 23% and 17%, respectively, of our Software Solutions revenues in 2010, 2011 and the six months ended June 30, 2012.
Components of Expenses
Operations. Our operations expenses primarily consist of salaries, benefits and long-term incentive compensation for our engineers, product management, information technology program management and analytics personnel, internet services costs, website content costs, hardware and software annual license and maintenance costs and salaries, benefits and long-term incentive compensation for our information technology infrastructure teams related to operating our websites and mobile applications. In addition, operations expenses include outside services and consulting fees. As a result of our recent acquisitions, we expanded our Digital Media business and acquired and expanded our Software Solutions business. The addition of the acquired businesses resulted in a $75.1 million increase in our operations expense in 2011. We believe that continued investment in content, features and functionality of our websites, software development tools, mobile applications and code modification is important to attaining our strategic objectives, and, as a result, we expect product development expense to increase for the foreseeable future.
Sales and Marketing. Our sales and marketing expenses primarily consist of salaries, benefits, long-term incentive compensation, rent for sales offices, travel expenses, bad debt expenses and commission-based compensation for our sales, field support and marketing employees. Sales and marketing expenses also include revenue sharing fees, primarily to our TIM service partner, which generates and ultimately financially supports the instant trade-in offer, as well as for our participation in a digital behavioral targeting brand advertising network. Further, sales and marketing expenses include content or service fees paid to advertising partners and product providers, brand advertisement serving costs, outside services and consulting fees and costs to print the Kelley Blue Book print publication. Historically, sales and marketing expenses also included costs to print the AutoTrader Classics and AutoTrader Latino print publications. In addition, sales and marketing expenses include consumer and dealer acquisition marketing, branding and advertising costs. In 2009, in response to adverse conditions in the retail automotive industry and the United States economy in general, we decreased our sales and marketing headcount. As conditions improved, we modestly increased our sales and marketing personnel in 2010 and 2011. We also added sales and marketing personnel in those periods as a result of our acquisitions. The increase in personnel attributable to the acquisitions, as well as the sales and marketing activities of the acquired businesses, resulted in a $39.3 million increase in our sales and marketing expense in 2011. We expect our dealer acquisition sales and marketing costs to increase as we continue to expand to new dealers and cross-sell our digital media and software solutions to our existing dealers. We expect our sales and marketing expenses to increase as we continue to build our brands, generate additional revenues and increase our sales and marketing activities for our software solutions. We also plan to augment our existing sales team and develop a specialized in-house sales force to specifically target smaller independent dealers. While sales and marketing expense is expected to continue to increase in absolute dollars, it is expected to decrease as a percentage of revenues as a result of the increase in revenues from our acquisitions and improved operating leverage.
64
Table of Contents
General and Administrative. Our general and administrative expenses primarily consist of salaries, benefits and long-term incentive compensation for our executive, finance, legal, human resources and other administrative employees. In addition, general and administrative expenses include outside consulting, legal and accounting services and dealer credit card processing fees and facilities and other supporting overhead costs not allocated to other expense categories. General and administrative expenses also include amounts payable to CEI for various services, including tax administration, benefits administration and cash management, that they provide to us pursuant to agreements with them described under “Certain Relationships and Related Person Transactions—Agreements Related to CEI.” These services are provided to us for our convenience and we believe that costs of these services are competitive with third-party providers. We do not anticipate that in the event we have to obtain these services from third-party providers or manage these functions internally, it would have a material impact on our general and administrative expense. The increase in general and administrative personnel and the general and administrative activities of the acquired businesses resulted in a $45.4 million increase in general and administrative costs in 2011. We expect our general and administrative expenses to increase for the foreseeable future as we continue to expand our business. We also believe that we will incur additional costs in becoming a public company, given the expected increase in audit fees, legal fees, regulatory compliance (including documentation of our internal control over financial reporting), listing fees, director compensation and director and officer insurance premiums, among other costs.
Long-term Incentive Compensation. We grant a variety of cash and stock-based incentive awards to employees as long-term incentive compensation. See “—Critical Accounting Policies and Estimates—Long-term Incentive Compensation” for a discussion of the methodology used for determining the amount of long-term compensation expense recognized in a given period. All stock-based incentive awards that vest after completion of this offering will be settled through the issuance of our Class A common stock instead of cash. The expense associated with our long-term incentive compensation is allocated to operations, sales and marketing and general and administrative expenses. In connection with this offering, we intend to grant an aggregate of shares of Class A common stock to our employees. We will record an expense in the amount of $ in the quarterly period in which our Class A common stock commences trading. The expense will be allocated as described above.
The following table shows the allocation of long-term incentive compensation expense among our expense line items for the periods presented:
| Year ended December 31, |
Six Months ended June 30, |
|||||||||||||||||||
| 2009 | 2010 | 2011 | 2011 | 2012 | ||||||||||||||||
| (in thousands) | ||||||||||||||||||||
| Operations |
$ | 2,170 | $ | 4,514 | $ | 2,873 | $ | 1,279 | $ | 728 | ||||||||||
| Sales and marketing |
6,172 | 12,835 | 9,118 | 4,060 | 3,312 | |||||||||||||||
| General and administrative |
3,218 | 6,691 | 7,145 | 3,182 | 3,199 | |||||||||||||||
|
|
|
|
|
|
|
|
|
|
|
|||||||||||
| Total |
$ | 11,560 | $ | 24,040 | $ | 19,136 | $ | 8,521 | $ | 7,239 | ||||||||||
|
|
|
|
|
|
|
|
|
|
|
|||||||||||
Pension Expense. Certain of our full-time employees are eligible to participate in CEI’s funded, qualified, defined-benefit pension plan. Certain key employees also participate in CEI’s unfunded, nonqualified, supplemental pension plan. These plans call for benefits to be paid to eligible employees at retirement based primarily upon years of service with CEI and its affiliates and compensation rates near retirement. Under the CEI pension plans, CEI allocates pension expense to us generally based on actuarial determinations of the effects of our employees’ participation in the plan. In addition to pension benefits, we provide certain postretirement healthcare and life insurance benefits to certain employees through participation in the CEI postretirement plan. Under the CEI postretirement healthcare plan, CEI
65
Table of Contents
allocates postretirement healthcare expense to us generally based on actuarial determinations of the effects of our employees’ participation in the plan. Annual pension and postretirement expenses may change, largely as a result of economic factors, including volatility in discount rates and investment returns, as well as changes in laws, regulations and assumptions used to calculate pension expense. If our or CEI’s interest or ability in providing pension and postretirement benefits changes, we have the right to evolve our pension and postretirement benefits to alternative arrangements that meet the needs of our employees and the company. The following table provides a breakdown of our pension expense included in the indicated line items:
| Year ended December 31, |
Six Months ended June 30, |
|||||||||||||||||||
| 2009 | 2010 | 2011 | 2011 | 2012 | ||||||||||||||||
| (in thousands) | ||||||||||||||||||||
| Operations |
$ | 2,781 | $ | 4,343 | $ | 5,377 | $ | 2,317 | $ | 2,785 | ||||||||||
| Sales and marketing |
5,430 | 8,761 | 9,723 | 4,191 | 4,870 | |||||||||||||||
| General and administrative |
698 | 944 | 1,414 | 609 | 693 | |||||||||||||||
|
|
|
|
|
|
|
|
|
|
|
|||||||||||
| Total |
$ | 8,909 | $ | 14,048 | $ | 16,514 | $ | 7,117 | $ | 8,348 | ||||||||||
|
|
|
|
|
|
|
|
|
|
|
|||||||||||
Depreciation and Amortization. Depreciation and amortization expenses primarily consist of depreciation on computer equipment, software, leasehold improvements, capitalized website and internal software development costs and amortization of purchased intangibles. Our recent acquisitions increased our depreciation and amortization expenses by $57.6 million in 2011. We expect depreciation and amortization expenses to increase for the foreseeable future as we continue to expand our technology infrastructure.
Impairment of Goodwill and Intangible Assets. Under accounting principles generally accepted in the United States, we review our goodwill and intangible assets for impairment annually in the fourth quarter of each fiscal year, or more frequently if events or changes in circumstances indicate the carrying value of our intangible assets may not be fully recoverable. Impairment of goodwill consists of non-cash goodwill impairment charges attributable to HomeNet (Software Solutions segment), which we recognized in 2011 and the six months ended June 30, 2012 as a result of lower than expected future cash flows attributable to HomeNet. Impairment of intangible assets consists of non-cash intangible asset impairment charges attributable to HomeNet, which we recognized in the six months ended June 30, 2012 as a result of the related goodwill impairment charge. The primary purpose of the HomeNet acquisition was to enhance our internal technology development capabilities rather than to provide significant incremental revenue. We may also recognize additional impairment charges associated with our other acquisitions in future periods.
Other. Other primarily consists of the post-acquisition increases in the fair value of the earn-outs associated with the vAuto and VinSolutions acquisitions as well as gains and losses on the sale or disposal of assets. The earn-outs associated with the vAuto and VinSolutions acquisitions have been paid.
Total Other (Income) Expense. Total other (income) expense consists primarily of interest on borrowings under our credit facilities, interest incurred on amounts owed to CEI, net of interest earned on cash and cash equivalents held on our behalf by CEI and loss on early retirement of debt. Loss on early retirement of debt consists of a $23.4 million loss comprised of a prepayment penalty and the write-off of deferred debt issuance costs and original issue discount for the year ended December 31, 2010. The loss was associated with the early retirement of an existing credit facility in December 2010 resulting from the entering into of our new credit facilities to pay for a portion of the acquisition costs for Kelley Blue Book and HomeNet.
66
Table of Contents
Income Tax (Benefit) Expense. Income tax expense consists of federal and state income taxes in the United States, deferred income taxes reflecting the net tax effects of temporary differences between the carrying amounts of assets and liabilities for financial reporting purposes and the amounts used for income tax purposes and the realization of net operating loss carryforwards in certain states.
Other Considerations
Providence Investment
The Providence Funds acquired a 25% interest in us in 2010 and such investment is referred to as the Providence Investment. Providence Equity Partners is the world’s leading private equity firm focused on media, communications, education and information investments. CEI retained majority ownership and voting control of us, and Providence Equity Partners obtained two seats on our Board.
Equity Investment
In the fourth quarter of 2010, we sold shares of our common stock to our existing stockholders for aggregate proceeds of $316.5 million to fund a portion of our vAuto, Kelley Blue Book and HomeNet acquisitions.
Acquisitions
vAuto. In October 2010, we acquired 100% of the outstanding stock of vAuto, a provider of advanced software tools for used vehicle management, pricing and inventory optimization, for $192.8 million in cash. In addition, the purchase agreement provided for maximum additional consideration of up to $34.5 million in the form of an earn-out payable in 2012 and was based upon the achievement of certain cumulative financial targets for 2010 and 2011. In June 2011, the acquisition of VinSolutions triggered certain provisions of the vAuto purchase agreement that accelerated the vesting of the earn-out, resulting in a full payment of $34.5 million in July 2011.
HomeNet. In December 2010, we acquired certain assets of HomeNet in a business combination for cash consideration of $61.6 million. The $2.2 million remaining unamortized option value as of the acquisition date was accounted for as additional purchase price of the acquired assets.
Kelley Blue Book. In December 2010, we acquired 100% of the outstanding stock of Kelley Blue Book, a provider of new and used car pricing information to the automotive industry, as well as its affiliate, CDMdata, for $532.4 million in cash.
VinSolutions. In June 2011, we acquired 100% of the assets of VinSolutions, a provider of an end-to-end solution platform for automobile dealers including CRM and internet lead management, inventory management tools, dealer websites, sales management and desking tools, and social media and direct targeted marketing campaign tools, for $133.4 million in cash (after considering the receipt of a $1.2 million working capital settlement in April 2012). In addition, the purchase agreement provided for additional consideration of up to $15.0 million in the form of an earn-out payable in 2012 and based upon the achievement of certain financial targets for 2011. In 2012, we paid $13.0 million in two installments in settlement of the earn-out, of which $10.6 million was considered additional purchase price, resulting in a total purchase price of $144.1 million.
April 2012 Dividend
On April 30, 2012, we amended our credit facilities to, among other things, provide for $400.0 million of additional borrowing capacity, and we drew down the additional capacity in connection with
67
Table of Contents
the payment of a $400.0 million special dividend to the then-existing common stock holders of AutoTrader.com, Inc. For more information regarding our credit facilities, see “—Liquidity and Capital Resources—Credit Facilities.”
Consolidated Results of Operations
The following tables set forth our results of operations for the periods presented and as a percentage of total revenues for those periods. The period-to-period comparison of financial results is not necessarily indicative of future results.
| Year ended December 31, |
Six Months ended June 30, |
|||||||||||||||||||
| 2009 | 2010 | 2011 | 2011 | 2012 | ||||||||||||||||
| (in thousands) | ||||||||||||||||||||
| Revenues: |
||||||||||||||||||||
| Digital Media |
$ | 629,450 | $ | 725,890 | $ | 917,041 | $ | 446,753 | $ | 486,103 | ||||||||||
| Software Solutions |
— | 11,937 | 108,136 | 43,212 | 76,988 | |||||||||||||||
|
|
|
|
|
|
|
|
|
|
|
|||||||||||
| Total revenues |
$ | 629,450 | $ | 737,827 | $ | 1,025,177 | $ | 489,965 | $ | 563,091 | ||||||||||
|
|
|
|
|
|
|
|
|
|
|
|||||||||||
| Operating expenses: |
||||||||||||||||||||
| Operations(1) |
106,190 | 117,471 | 197,187 | 91,225 | 111,620 | |||||||||||||||
| Sales and marketing(1) |
331,285 | 371,060 | 402,054 | 202,455 | 218,549 | |||||||||||||||
| General and administrative(1) |
55,605 | 68,293 | 117,381 | 57,149 | 64,758 | |||||||||||||||
| Depreciation and amortization |
120,471 | 65,325 | 122,951 | 61,224 | 63,919 | |||||||||||||||
| Impairment of goodwill |
— | — | 36,216 | — | 11,112 | |||||||||||||||
| Impairment of intangible assets |
— | — | — | — | 4,544 | |||||||||||||||
| Other |
1,374 | 1,131 | 9,634 | 6,043 | 873 | |||||||||||||||
|
|
|
|
|
|
|
|
|
|
|
|||||||||||
| Total operating expenses |
614,925 | 623,280 | 885,423 | 418,096 | 475,375 | |||||||||||||||
|
|
|
|
|
|
|
|
|
|
|
|||||||||||
| Income from operations |
14,525 | 114,547 | 139,754 | 71,869 | 87,716 | |||||||||||||||
| Total other income (expense) |
379 | (40,066 | ) | (33,011 | ) | (17,321 | ) | (15,969 | ) | |||||||||||
|
|
|
|
|
|
|
|
|
|
|
|||||||||||
| Income before income taxes |
14,904 | 74,481 | 106,743 | 54,548 | 71,747 | |||||||||||||||
| Income tax expense |
5,045 | 25,357 | 38,692 | 22,403 | 30,135 | |||||||||||||||
|
|
|
|
|
|
|
|
|
|
|
|||||||||||
| Net income |
$ | 9,859 | $ | 49,124 | $ | 68,051 | $ | 32,145 | $ | 41,612 | ||||||||||
|
|
|
|
|
|
|
|
|
|
|
|||||||||||
| (1) | Long-term incentive compensation included in above line items: |
| Year ended December 31, |
Six Months ended June 30, |
|||||||||||||||||||
| 2009 | 2010 | 2011 | 2011 | 2012 | ||||||||||||||||
| (in thousands) | ||||||||||||||||||||
| Operations |
$ | 2,170 | $ | 4,514 | $ | 2,873 | $ | 1,279 | $ | 728 | ||||||||||
| Sales and marketing |
6,172 | 12,835 | 9,118 | 4,060 | 3,312 | |||||||||||||||
| General and administrative |
3,218 | 6,691 | 7,145 | 3,182 | 3,199 | |||||||||||||||
|
|
|
|
|
|
|
|
|
|
|
|||||||||||
| Total |
$ | 11,560 | $ | 24,040 | $ | 19,136 | $ | 8,521 | $ | 7,239 | ||||||||||
|
|
|
|
|
|
|
|
|
|
|
|||||||||||
68
Table of Contents
| Year ended December 31, |
Six Months ended June 30, |
|||||||||||||||||||
| 2009 | 2010 | 2011 | 2011 | 2012 | ||||||||||||||||
| (as a percentage of total revenues) | ||||||||||||||||||||
| Revenues: |
||||||||||||||||||||
| Digital Media |
100 | % | 98 | % | 89 | % | 91 | % | 86 | % | ||||||||||
| Software Solutions |
— | 2 | 11 | 9 | 14 | |||||||||||||||
|
|
|
|
|
|
|
|
|
|
|
|||||||||||
| Total revenues |
100 | 100 | 100 | 100 | 100 | |||||||||||||||
|
|
|
|
|
|
|
|
|
|
|
|||||||||||
| Operating expenses: |
||||||||||||||||||||
| Operations |
17 | 16 | 19 | 19 | 20 | |||||||||||||||
| Sales and marketing |
53 | 50 | 39 | 41 | 39 | |||||||||||||||
| General and administrative |
9 | 9 | 11 | 12 | 12 | |||||||||||||||
| Depreciation and amortization |
19 | 9 | 12 | 12 | 11 | |||||||||||||||
| Impairment of goodwill |
— | — | 4 | — | 2 | |||||||||||||||
| Impairment of intangible assets |
— | — | — | — | 1 | |||||||||||||||
| Other |
0 | 0 | 1 | 1 | 0 | |||||||||||||||
|
|
|
|
|
|
|
|
|
|
|
|||||||||||
| Total operating expenses |
98 | 84 | 86 | 85 | 84 | |||||||||||||||
|
|
|
|
|
|
|
|
|
|
|
|||||||||||
| Income from operations |
2 | 16 | 14 | 15 | 16 | |||||||||||||||
| Total other income (expense) |
0 | (5 | ) | (3 | ) | (4 | ) | (3 | ) | |||||||||||
|
|
|
|
|
|
|
|
|
|
|
|||||||||||
| Income before income taxes |
2 | 10 | 10 | 11 | 13 | |||||||||||||||
| Income tax expense |
1 | 3 | 4 | 5 | 5 | |||||||||||||||
|
|
|
|
|
|
|
|
|
|
|
|||||||||||
| Net income |
2 | % | 7 | % | 7 | % | 7 | % | 7 | % | ||||||||||
|
|
|
|
|
|
|
|
|
|
|
|||||||||||
Six Months Ended June 30, 2011 and 2012
Revenues
| Six Months ended June 30, |
||||||||||||||||
| 2011 | 2012 | $ Change | % Change | |||||||||||||
| (dollars in thousands) | ||||||||||||||||
| Revenues: |
||||||||||||||||
| Digital Media |
$ | 446,753 | $ | 486,103 | $ | 39,350 | 9 | % | ||||||||
| Software Solutions |
43,212 | 76,988 | 33,776 | 78 | ||||||||||||
|
|
|
|
|
|
|
|||||||||||
| Total revenues |
$ | 489,965 | $ | 563,091 | $ | 73,126 | 15 | % | ||||||||
|
|
|
|
|
|
|
|||||||||||
| Percentage of Revenues: |
||||||||||||||||
| Digital Media |
91 | % | 86 | % | ||||||||||||
| Software Solutions |
9 | 14 | ||||||||||||||
|
|
|
|
|
|||||||||||||
| Total revenues |
100 | % | 100 | % | ||||||||||||
|
|
|
|
|
|||||||||||||
Digital Media revenues. Digital Media revenues increased by $39.4 million, or 9%, for the six months ended June 30, 2012 as compared to the six months ended June 30, 2011. Revenues from dealers increased $39.9 million, or 12%, reflecting increased penetration of and upgrades within premium tiered listings and increased penetration of our TIM and new car subscriptions among our subscribing dealer base. In addition, revenues from our brand advertising customers increased $6.3 million, or 8%, due to strong performance by AutoTrader.com. Partially offsetting these increases were decreases resulting from ceasing print publication of AutoTrader Classics and AutoTrader Latino magazines in 2011. Revenues related to AutoTrader Classics and AutoTrader Latino decreased by $7.5 million for the six months ended June 30, 2012 compared to the six months ended June 30, 2011.
69
Table of Contents
Software Solutions revenues. Software Solutions revenues increased $33.8 million, or 78%, for the six months ended June 30, 2012 as compared to the six months ended June 30, 2011. The increase is driven primarily by the absence of revenues for most of the first half of 2011 from VinSolutions, which was acquired in June 2011. VinSolutions’ revenues were $27.2 million for the six months ended June 30, 2012 compared to $1.4 million in June 2011. The rest of the increase in Software Solutions revenues was due mainly to an increase in the number of dealers subscribing to our inventory management software solutions and an increase in the amount of subscription fees per subscribing dealer.
Operations
| Six Months ended June 30, |
||||||||||||||||
| 2011 | 2012 | $ Change | % Change | |||||||||||||
| (dollars in thousands) | ||||||||||||||||
| Operations |
$ | 91,225 | $ | 111,620 | $ | 20,395 | 22 | % | ||||||||
| Percentage of revenues |
19 | % | 20 | % | ||||||||||||
Operations expense increased by $20.4 million, or 22%, for the six months ended June 30, 2012 as compared to the six months ended June 30, 2011. This increase was primarily due to $8.7 million of incremental VinSolutions’ expenses and $8.8 million in personnel costs attributable to increased headcount resulting from our increased investment in information technology and customer support resources. These increases were partially offset by $1.9 million of higher capitalized labor costs related to internally developed software and website development activities in the six months ended June 30, 2012. Other increases were due to operating expenses associated with our enterprise resource planning, or ERP, system implementation and a $1.1 million increase in consulting fees relating to various initiatives.
Sales and Marketing
| Six Months ended June 30, |
||||||||||||||||
| 2011 | 2012 | $ Change | % Change | |||||||||||||
| (dollars in thousands) | ||||||||||||||||
| Sales and marketing |
$ | 202,455 | $ | 218,549 | $ | 16,094 | 8 | % | ||||||||
| Percentage of revenues |
41 | % | 39 | % | ||||||||||||
Sales and marketing expense increased by $16.1 million, or 8%, for the six months ended June 30, 2012 as compared to the six months ended June 30, 2011. The increase was primarily due to $5.0 million of incremental VinSolutions’ expenses, $6.7 million of personnel expense related to higher sales headcount and commissions, $5.7 million in higher consulting fees primarily related to the development of a comprehensive dealer selling and services strategy, $4.8 million in increased travel and entertainment expense primarily related to our annual sales conference and $3.8 million of increased branding and consumer acquisition marketing expenses. These increases more than offset the $7.0 million decrease in certain non-personnel related sales and marketing expense as a result of ceasing print publication of AutoTrader Classics and AutoTrader Latino magazines.
70
Table of Contents
General and Administrative
| Six Months ended June 30, |
||||||||||||||||
| 2011 | 2012 | $ Change | % Change | |||||||||||||
| (dollars in thousands) | ||||||||||||||||
| General and administrative |
$ | 57,149 | $ | 64,758 | $ | 7,609 | 13 | % | ||||||||
| Percentage of revenues |
12 | % | 12 | % | ||||||||||||
General and administrative expense increased by $7.6 million, or 13%, for the six months ended June 30, 2012 as compared to the six months ended June 30, 2011. The increase was primarily due to $5.6 million of incremental VinSolutions’ expenses and increased personnel expenses associated with increased headcount and employer taxes related to higher bonus and incentive compensation payments in 2012, which were partially offset by the absence of $2.9 million of overlapping rent, operating and restoration expenses associated with our new and expiring Atlanta headquarters office leases.
Depreciation and Amortization
| Six Months ended June 30, |
||||||||||||||||
| 2011 | 2012 | $ Change | % Change | |||||||||||||
| (dollars in thousands) | ||||||||||||||||
| Depreciation and amortization |
$ | 61,224 | $ | 63,919 | $ | 2,695 | 4 | % | ||||||||
| Percentage of revenues |
12 | % | 11 | % | ||||||||||||
Depreciation and amortization expense increased by $2.7 million, or 4%, for the six months ended June 30, 2012 as compared to the six months ended June 30, 2011. This increase was primarily the result of a $2.3 million increase in depreciation in the six months ended June 30, 2012 as compared to the six months ended June 30, 2011, due to our continued investment in internally developed software and website development activities.
Impairment of Goodwill
| Six Months ended June 30, |
||||||||||||||||
| 2011 | 2012 | $ Change | % Change | |||||||||||||
| (dollars in thousands) | ||||||||||||||||
| Impairment of goodwill |
$ | — | $ | 11,112 | $ | 11,112 | * | |||||||||
| Percentage of revenues |
— | 2 | % | |||||||||||||
| * | Not meaningful |
As a result of reduced projected future cash flow expectations for HomeNet, we recognized an impairment of goodwill during the six months ended June 30, 2012 of $11.1 million based on lower than expected revenue growth resulting from recent project launch issues, a change in outlook of the outcome expected for certain business development opportunities, and incremental expenses expected from our new data licensing agreement. We did not recognize any impairment charges in the six months ended June 30, 2011.
71
Table of Contents
Impairment of Intangible Assets
| Six Months ended June 30, |
||||||||||||||||
| 2011 | 2012 | $ Change | % Change | |||||||||||||
| (dollars in thousands) | ||||||||||||||||
| Impairment of intangible assets |
$ | — | $ | 4,544 | $ | 4,544 | * | |||||||||
| Percentage of revenues |
— | 1 | % | |||||||||||||
| * | Not meaningful. |
As a result of events occurring in late April 2012 that resulted in reduced future cash flow projections for HomeNet, we determined that certain of HomeNet’s long-lived assets were not recoverable and recorded an impairment charge of $4.5 million during the six months ended June 30, 2012. We did not recognize any impairment of intangible assets in the six months ended June 30, 2011.
Other
| Six Months ended June 30, |
||||||||||||||||
| 2011 | 2012 | $ Change | % Change | |||||||||||||
| (dollars in thousands) | ||||||||||||||||
| Other |
$ | 6,043 | $ | 873 | $ | (5,170 | ) | (86 | )% | |||||||
| Percentage of revenues |
1 | % | 0 | % | ||||||||||||
Other decreased by $5.2 million, or 86%, for the six months ended June 30, 2012 as compared to the six months ended June 30, 2011. This decrease was primarily a result of the second quarter 2011 increase in the fair value of the vAuto earnout, the payout of which was accelerated by the VinSolutions acquisition in that quarter.
Total Other Expense
| Six Months ended June 30, |
||||||||||||||||
| 2011 | 2012 | $ Change | % Change | |||||||||||||
| (dollars in thousands) | ||||||||||||||||
| Total other expense |
$ | (17,321 | ) | $ | (15,969 | ) | $ | 1,352 | 8 | % | ||||||
| Percentage of revenues |
(4 | )% | (3 | )% | ||||||||||||
Total other expense decreased by $1.4 million, or 8%, for the six months ended June 30, 2012 as compared to the six months ended June 30, 2011 due to lower interest rates on our indebtedness.
Income Tax Expense
| Six Months ended June 30, |
||||||||||||||||
| 2011 | 2012 | $ Change | % Change | |||||||||||||
| (dollars in thousands) | ||||||||||||||||
| Income tax expense |
$ | 22,403 | $ | 30,135 | $ | 7,732 | 35 | % | ||||||||
| Percentage of revenues |
5 | % | 5 | % | ||||||||||||
Income tax expense increased by $7.7 million, or 35%, for the six months ended June 30, 2012 as compared to the six months ended June 30, 2011 due to an increase in pre-tax book income partially offset by the difference in book and tax treatment of the vAuto earn-out and changes in effective state rates.
72
Table of Contents
Net Income
| Six Months ended June 30, |
||||||||||||||||
| 2011 | 2012 | $ Change | % Change | |||||||||||||
| (dollars in thousands) | ||||||||||||||||
| Net income |
$ | 32,145 | $ | 41,612 | $ | 9,467 | 29 | % | ||||||||
| Percentage of revenues |
7 | % | 7 | % | ||||||||||||
Net income increased by $9.5 million, or 29%, for the six months ended June 30, 2012 as compared to the six months ended June 30, 2011. This increase was primarily due to increases in segment profit for both Digital Media and Software Solutions, including $6.5 million relating to VinSolutions, which was acquired in June 2011. These increases were partially offset by $15.7 million of pre-tax expense related to the impairment of HomeNet’s goodwill and intangible assets.
Segment Results
We measure the performance of our Digital Media and Software Solutions segments based on revenues and segment profit. The discussion that follows is a summary analysis of revenues and the primary changes in segment profit by segment.
Digital Media
| Six Months ended June 30, |
||||||||||||||||
| 2011 | 2012 | $ Change | % Change | |||||||||||||
| (dollars in thousands) | ||||||||||||||||
| Revenues |
$ | 446,753 | $ | 486,103 | $ | 39,350 | 9 | % | ||||||||
| Segment profit |
125,369 | 144,357 | 18,988 | 15 | % | |||||||||||
| Segment profit as a percentage of revenues |
28 | % | 30 | % | ||||||||||||
Digital Media revenues increased by $39.4 million, or 9%, for the six months ended June 30, 2012 compared to the six months ended June 30, 2011. Digital Media segment profit increased by $19.0 million, or 15%, for the six months ended June 30, 2012 compared to the six months ended June 30, 2011 due to the $39.4 million increase in segment revenues, which were partially offset by a $20.4 million increase in segment expenses.
Software Solutions
| Six Months ended June 30, |
||||||||||||||||
| 2011 | 2012 | $ Change | % Change | |||||||||||||
| (dollars in thousands) | ||||||||||||||||
| Revenues |
$ | 43,212 | $ | 76,988 | $ | 33,776 | 78 | % | ||||||||
| Segment profit |
13,767 | 23,807 | 10,040 | 73 | % | |||||||||||
| Segment profit as a percentage of revenues |
32 | % | 31 | % | ||||||||||||
Software Solutions revenues increased $33.8 million, or 78%, for the six months ended June 30, 2012 as compared to the six months ended June 30, 2011. The increase was primarily due to $25.8 million of incremental revenues relating to VinSolutions. Software Solutions segment profit increased $10.0 million, or 73%, for the six months ended June 30, 2012 compared to the six months ended June 30, 2011 due to the $33.8 million increase in segment revenues, which were partially offset by a $23.7 million increase in segment expenses, of which $19.3 million related to VinSolutions.
73
Table of Contents
Years Ended December 31, 2009, 2010 and 2011
Revenues
| Year ended December 31, |
2009 to 2010 | 2010 to 2011 | ||||||||||||||||||||||||||
| 2009 | 2010 | 2011 | $ Change |
% Change |
$ Change |
% Change |
||||||||||||||||||||||
| (dollars in thousands) | ||||||||||||||||||||||||||||
| Revenues by Segment: |
||||||||||||||||||||||||||||
| Digital Media |
$ | 629,450 | $ | 725,890 | $ | 917,041 | $ | 96,440 | 15 | % | $ | 191,151 | 26 | % | ||||||||||||||
| Software Solutions |
— | 11,937 | 108,136 | 11,937 | — | 96,199 | * | |||||||||||||||||||||
|
|
|
|
|
|
|
|||||||||||||||||||||||
| Total revenues |
$ | 629,450 | $ | 737,827 | $ | 1,025,177 | $ | 108,377 | 17 | % | $ | 287,350 | 39 | % | ||||||||||||||
|
|
|
|
|
|
|
|||||||||||||||||||||||
| Percentage of revenues by segment: |
||||||||||||||||||||||||||||
| Digital Media |
100 | % | 98 | % | 89 | % | ||||||||||||||||||||||
| Software Solutions |
— | 2 | % | 11 | % | |||||||||||||||||||||||
|
|
|
|
|
|
|
|||||||||||||||||||||||
| Total revenues |
100 | % | 100 | % | 100 | % | ||||||||||||||||||||||
|
|
|
|
|
|
|
|||||||||||||||||||||||
| * | Not meaningful. |
2010 Compared to 2011. Total revenues increased by $287.4 million, or 39%, for the year ended December 31, 2011 as compared to the year ended December 31, 2010. This increase was primarily due to the $221.9 million increase in revenues resulting from the full year impact of the 2010 Acquisitions and the partial year impact of the VinSolutions acquisition in 2011.
Digital Media revenues increased by $191.2 million, or 26%, for the year ended December 31, 2011 as compared to the year ended December 31, 2010, due primarily to a $125.7 million increase resulting from the full year impact of the Kelley Blue Book acquisition. Digital Media revenues from AutoTrader.com dealers increased $73.8 million, or 13%, of which $14.2 million of the increase resulted from a 2% increase in the number of subscribing dealers, while $59.6 million of the increase was attributed to a 15% increase in Digital Media MRR resulting from increased penetration of premium tiered listings and TIM subscriptions. In addition, revenues from AutoTrader.com’s brand advertising customers increased $2.3 million, or 3%, as an increase in average CPM in 2011 more than offset a decrease in overall advertising impressions delivered as a result of changing dealer association advertising strategies by certain OEMs. Partially offsetting these increases were decreases resulting from ceasing print publication of AutoTrader Classics and AutoTrader Latino magazines in May and October 2011, respectively. Revenues for AutoTrader Classics and AutoTrader Latino decreased by $13.6 million for the year ended December 31, 2011 as compared to the year ended December 31, 2010.
Software Solutions revenues increased by $96.2 million for the year ended December 31, 2011 as compared to the year ended December 31, 2010, due to the full year impact of the 2010 Acquisitions and the partial year impact of the VinSolutions acquisition in 2011.
2009 Compared to 2010. Total revenues increased by $108.4 million, or 17%, for the year ended December 31, 2010 as compared to the year ended December 31, 2009. This increase was due in part to $18.1 million of post-acquisition date revenues associated with the 2010 Acquisitions.
74
Table of Contents
Digital Media revenues increased by $96.4 million, or 15% as revenues from AutoTrader.com dealers increased $79.8 million, or 16%, of which $7.8 million of the increase resulted from a 2% increase in the number of subscribing dealers from 19,517 as of December 31, 2009 to 19,839 as of December 31, 2010, while $72.0 million of the increase was attributed to a 15% increase in Digital Media MRR from $2,267 as of December 31, 2009 to $2,612 as of December 31, 2010, resulting from increased premium tiered listings and TIM subscriptions in 2010. In addition, revenues from AutoTrader.com’s brand advertising customers increased $7.5 million, or 10%, due mainly to an increase in overall advertising impressions delivered in 2010, partially offset by a decrease in average CPM. Increased revenues in 2010 were partially offset by a 12% decline in AutoTrader Classics revenues, as magazine circulation was adversely impacted by the termination of a distributor relationship and the corresponding loss of retail outlets in certain markets.
Software Solutions revenues were $11.9 million for the year ended December 31, 2010. We did not have Software Solutions revenues for the year ended December 31, 2009.
Operations
| Year ended December 31, |
2009 to 2010 | 2010 to 2011 | ||||||||||||||||||||||||||
| 2009 | 2010 | 2011 | $ Change |
% Change |
$ Change |
% Change |
||||||||||||||||||||||
| (dollars in thousands) | ||||||||||||||||||||||||||||
| Operations |
$ | 106,190 | $ | 117,471 | $ | 197,187 | $ | 11,281 | 11 | % | $ | 79,716 | 68 | % | ||||||||||||||
| Percentage of revenues |
17 | % | 16 | % | 19 | % | ||||||||||||||||||||||
2010 Compared to 2011. Operations expense increased by $79.7 million, or 68%, for the year ended December 31, 2011 as compared to the year ended December 31, 2010. This increase was primarily due to the full year impact of our 2010 Acquisitions as well as the partial year impact of our VinSolutions acquisition, which resulted in $75.1 million of incremental operations expense. The remaining increase in operations expense was due to $8.4 million in higher personnel costs from increased full-time and contractor headcount. These expenses were partially offset by $2.2 million in higher capitalized labor costs related to internally developed software and website development activities and a $0.9 million decrease in outside consulting fees.
2009 Compared to 2010. Operations expense increased by $11.3 million, or 11%, for the year ended December 31, 2010 as compared to the year ended December 31, 2009. A decrease in personnel expense in 2009 resulting from reduced headcount was more than offset by the $4.4 million decrease in capitalized labor costs related to internally developed software and website development activities in 2010 and a $5.5 million increase in professional fees in 2010.
Sales and Marketing
| Year ended December 31, |
2009 to 2010 | 2010 to 2011 | ||||||||||||||||||||||||||
| 2009 | 2010 | 2011 | $ Change |
% Change |
$ Change |
% Change |
||||||||||||||||||||||
| (dollars in thousands) | ||||||||||||||||||||||||||||
| Sales and marketing |
$ | 331,285 | $ | 371,060 | $ | 402,054 | $ | 39,775 | 12 | % | $ | 30,994 | 8 | % | ||||||||||||||
| Percentage of revenues |
53 | % | 50 | % | 39 | % | ||||||||||||||||||||||
2010 Compared to 2011. Sales and marketing expense increased by $31.0 million, or 8%, for the year ended December 2011 as compared to the year ended December 31, 2010. This increase was primarily due to the full year impact of our 2010 Acquisitions and the partial year impact of our
75
Table of Contents
VinSolutions acquisition, which resulted in $39.3 million of incremental sales and marketing expense. Other sales and marketing expense decreased $8.0 million compared to the prior year, as a $5.9 million decrease in lower non-personnel-related sales and marketing costs resulting from ceasing print publication of AutoTrader Classics and AutoTrader Latino magazines, a $3.5 million decrease in commissions and a $3.7 million decline in long-term incentive compensation expense were partially offset by a $2.5 million increase in revenue sharing fees to advertising partners, primarily for TIM, and a $1.8 million increase in outside consulting fees.
2009 Compared to 2010. Sales and marketing expense increased by $39.8 million, or 12%, for the year ended December 31, 2010 as compared to the year ended December 31, 2009. This increase was primarily the result of $9.9 million in increased sales and marketing expenses associated with our 2010 Acquisitions, $9.6 million in incremental local advertising expense, primarily to support the national roll-out of our TIM program, $8.4 million in increased revenue sharing fees to advertising partners, primarily for TIM, $6.6 million in increased long-term incentive compensation expense and $3.8 million in increased travel and entertainment expense.
General and Administrative
| Year ended December 31, |
2009 to 2010 | 2010 to 2011 | ||||||||||||||||||||||||||
| 2009 | 2010 | 2011 | $ Change |
% Change |
$ Change |
% Change |
||||||||||||||||||||||
| (dollars in thousands) | ||||||||||||||||||||||||||||
| General and administrative |
$ | 55,605 | $ | 68,293 | $ | 117,381 | $ | 12,688 | 23 | % | $ | 49,088 | 72 | % | ||||||||||||||
| Percentage of revenues |
9 | % | 9 | % | 11 | % | ||||||||||||||||||||||
2010 Compared to 2011. General and administrative expense increased by $49.1 million, or 72%, for the year ended December 31, 2011 as compared to the year ended December 31, 2010. This increase was primarily due to the full year impact of our 2010 Acquisitions and the partial year impact of our VinSolutions acquisition, which resulted in $45.4 million of incremental general and administrative expense. Other general and administrative expense increased $3.7 million, or 5%, compared to the prior year due primarily to $7.3 million in higher personnel costs in 2011 due to increased headcount and severance expense for certain AutoTrader Classics and AutoTrader Latino personnel, $0.9 million in increased long-term incentive plan and pension expense, $0.9 million of increased outside consulting and professional service fees, $0.7 million in incremental expense for overlapping rent, operating and restoration costs associated with our new and expiring Atlanta headquarters office leases and $0.7 million in higher credit card processing fees relating to payments from our dealer customers. These increases were partially offset by $4.5 million of expense incurred in 2010 associated with the early termination of a vendor contract and $3.0 million in decreased legal fees due to reduced acquisition activity in 2011.
2009 Compared to 2010. General and administrative expense increased by $12.7 million, or 23%, for the year ended December 31, 2010 as compared to the year ended December 31, 2009. This increase was primarily due to $5.7 million in legal and other professional service fees, mainly resulting from our 2010 acquisition activity, $4.5 million in costs associated with the early termination of a vendor contract, $3.5 million in increased long-term incentive compensation expense, $1.7 million in overlapping rent associated with our new and expiring Atlanta headquarters office leases plus $0.7 million in higher credit card processing fees relating to payments from our dealer customers. These increases were partially offset by $4.1 million in decreased personnel costs from the absence of severance and lower employee contract expenses in 2010.
76
Table of Contents
Depreciation and Amortization
| Year ended December 31, |
2009 to 2010 | 2010 to 2011 | ||||||||||||||||||||||||||
| 2009 | 2010 | 2011 | $ Change |
% Change |
$ Change |
% Change |
||||||||||||||||||||||
| (dollars in thousands) | ||||||||||||||||||||||||||||
| Depreciation and amortization |
$ | 120,471 | $ | 65,325 | $ | 122,951 | $ | (55,146 | ) | (46 | )% | $ | 57,626 | 88 | % | |||||||||||||
| Percentage of revenues |
19 | % | 9 | % | 12 | % | ||||||||||||||||||||||
2010 Compared to 2011. Depreciation and amortization expense increased by $57.6 million, or 88%, for the year ended December 31, 2011 as compared to the year ended December 31, 2010. This increase was due to the full year impact of depreciation and amortization costs associated with our 2010 Acquisitions and the partial year impact of our 2011 VinSolutions acquisition.
2009 Compared to 2010. Depreciation and amortization expense decreased by $55.1 million, or 46%, for the year ended December 31, 2010 as compared to the year ended December 31, 2009. This decrease reflected the impact of the amortization in 2009 of definite-lived intangible assets assigned in connection with CEI’s 2006 purchase and transfer of certain ownership interests in us. These assigned assets were fully amortized as of December 31, 2009.
Impairment of Goodwill
As a result of our annual impairment test of goodwill, we recognized an impairment of goodwill in 2011 due to lower than expected revenue growth for HomeNet relative to assumptions made in the year of acquisition. We did not recognize any impairment charges in 2010 or 2009.
Other
| Year ended December 31, |
2009 to 2010 | 2010 to 2011 | ||||||||||||||||||||||||||
| 2009 | 2010 | 2011 | $ Change |
% Change |
$ Change |
% Change |
||||||||||||||||||||||
| (dollars in thousands) | ||||||||||||||||||||||||||||
| Other |
$ | 1,374 | $ | 1,131 | $ | 9,634 | $ | (243 | ) | (18 | )% | $ | 8,503 | * | ||||||||||||||
| Percentage of revenues |
0 | % | 0 | % | 1 | % | ||||||||||||||||||||||
| * | Not meaningful |
2010 Compared to 2011. Other operating expenses increased by $8.5 million for the year ended December 31, 2011 as compared to the year ended December 31, 2010. This increase was primarily due to the increase in the fair value of the earn-outs associated with the vAuto and VinSolutions acquisitions. Our other operating expenses were relatively flat for the years ended December 31, 2010 and 2009.
Total Other Income (Expense)
| Year ended December 31, |
2009 to 2010 | 2010 to 2011 | ||||||||||||||||||||||||||
| 2009 | 2010 | 2011 | $ Change |
% Change |
$ Change |
% Change |
||||||||||||||||||||||
| (dollars in thousands) | ||||||||||||||||||||||||||||
| Total other income |
$ | 379 | $ | (40,066 | ) | $ | (33,011 | ) | $ | (40,445 | ) | * | $ | (7,055 | ) | 18 | % | |||||||||||
| Percentage of revenues |
0 | % | (5 | )% | (3 | )% | ||||||||||||||||||||||
| * | Not meaningful |
77
Table of Contents
2010 Compared to 2011. Total other expense decreased by $7.1 million, or 18%, for the year ended December 31, 2011 as compared to the year ended December 31, 2010. This decrease was primarily due to a $23.4 million loss from the early retirement of our then-existing credit facility in December 2010 resulting from the entering into of our new credit facilities to pay a portion of the acquisition costs for the Kelley Blue Book and HomeNet acquisitions. The loss consisted of a $2.7 million prepayment penalty and the write-off of deferred debt issuance costs and original issue discount related to our then-existing credit facility. This decrease was partially offset by increased interest expense in 2011 attributable to the full year impact of the higher principal amount outstanding under our new credit facilities, which were increased by $200.0 million in aggregate principal amount in June 2011 to pay the acquisition costs for the VinSolutions acquisition and to prepay a portion of the term B loan facility.
2009 Compared to 2010. Total other expense was $40.1 million for the year ended December 31, 2010 compared to other income of $0.4 million for the year ended December 31, 2009. This change was due to interest expense on our credit facility established in June 2010 to help finance a share repurchase prior to the Providence Investment. This credit facility was retired in December 2010 when we entered into new credit facilities, resulting in the recognition of a $23.4 million loss on the early retirement of debt.
Income Tax Expense
| Year ended December 31, |
2009 to 2010 | 2010 to 2011 | ||||||||||||||||||||||||||
| 2009 | 2010 | 2011 | $ Change |
% Change |
$ Change |
% Change |
||||||||||||||||||||||
| (dollars in thousands) | ||||||||||||||||||||||||||||
| Income tax expense |
$ | 5,045 | $ | 25,357 | $ | 38,692 | $ | 20,312 | * | $ | 13,335 | 53 | % | |||||||||||||||
| Percentage of revenues |
1 | % | 3 | % | 4 | % | ||||||||||||||||||||||
| * | Not meaningful |
2010 Compared to 2011. Income tax expense increased by $13.3 million, or 53%, for the year ended December 31, 2011 as compared to the year ended December 31, 2010. This increase was primarily due to an increase in pre-tax book income, changes in certain state effective tax rates in 2010 and the difference in book and tax treatment of the vAuto earn-out.
2009 Compared to 2010. Income tax expense increased by $20.3 million for the year ended December 31, 2010 as compared to the year ended December 31, 2009. This increase was primarily due to an increase in pre-tax book income, partially offset by changes in certain state effective tax rates in 2010.
Net Income
| Year ended December 31, |
2009 to 2010 | 2010 to 2011 | ||||||||||||||||||||||||||
| 2009 | 2010 | 2011 | $ Change |
% Change |
$ Change |
% Change |
||||||||||||||||||||||
| (dollars in thousands) | ||||||||||||||||||||||||||||
| Net income |
$ | 9,859 | $ | 49,124 | $ | 68,051 | $ | 39,265 | * | $ | 18,927 | 39 | % | |||||||||||||||
| Percentage of revenues |
2 | % | 7 | % | 7 | % | ||||||||||||||||||||||
| * | Not meaningful |
78
Table of Contents
2010 Compared to 2011. Net income increased by $18.9 million, or 39%, for the year ended December 31, 2011 as compared to the year ended December 31, 2010. This increase was primarily the result of increased revenues resulting from the full year impact of the 2010 Acquisitions and the partial year impact of the acquisition of VinSolutions. The increase in revenues more than offset increased operating expense and income tax expense.
2009 Compared to 2010. Net income increased by $39.3 million for the year ended December 31, 2010 as compared to the year ended December 31, 2009. This increase was primarily due to the impact of our 2010 Acquisitions and increases in Digital Media subscribing dealers and Digital Media MRR, which more than offset increased operating expense and income tax expense.
Segment Results
2011 is the only year in which we operated our Software Solutions business for the entire year and we do not believe a year-to-year comparison is meaningful.
79
Table of Contents
Quarterly Results of Operations Data
The following tables set forth our quarterly consolidated statements of income data in dollars and as a percentage of total revenues for each of the ten quarters listed below. We have prepared the quarterly consolidated statements of income data on a basis consistent with the audited consolidated financial statements included elsewhere in this prospectus. In the opinion of management, the financial information reflects all adjustments, consisting of normal recurring adjustments, which we consider necessary for a fair presentation of this data. This information should be read in conjunction with the audited consolidated financial statements and related notes included elsewhere in this prospectus. The results of historical periods are not necessarily indicative of the results for any future period.
| Three Months ended | ||||||||||||||||||||||||||||||||||||||||
| Mar 31, 2010 |
Jun 30, 2010 |
Sep 30, 2010 |
Dec 31, 2010 |
Mar 31, 2011 |
Jun 30, 2011 |
Sep 30, 2011 |
Dec 31, 2011 |
Mar 31, 2012 |
Jun 30, 2012 |
|||||||||||||||||||||||||||||||
| (in thousands) | ||||||||||||||||||||||||||||||||||||||||
| Revenues: |
||||||||||||||||||||||||||||||||||||||||
| Digital Media |
$ | 165,720 | $ | 176,525 | $ | 186,491 | $ | 197,154 | $ | 221,804 | $ | 224,949 | $ | 231,117 | $ | 239,171 | $ | 236,500 | $ | 249,603 | ||||||||||||||||||||
| Software Solutions. |
— | — | — | 11,937 | 20,871 | 22,341 | 30,515 | 34,409 | 37,005 | 39,983 | ||||||||||||||||||||||||||||||
|
|
|
|
|
|
|
|
|
|
|
|
|
|
|
|
|
|
|
|
|
|||||||||||||||||||||
| Total revenues |
165,720 | 176,525 | 186,491 | 209,091 | 242,675 | 247,290 | 261,632 | 273,580 | 273,505 | 289,586 | ||||||||||||||||||||||||||||||
|
|
|
|
|
|
|
|
|
|
|
|
|
|
|
|
|
|
|
|
|
|||||||||||||||||||||
| Operating expenses: |
||||||||||||||||||||||||||||||||||||||||
| Operations(1) |
28,767 | 27,813 | 29,542 | 31,349 | 45,522 | 45,703 | 48,685 | 57,277 | 53,307 | 58,313 | ||||||||||||||||||||||||||||||
| Sales and marketing(1) |
81,250 | 95,375 | 87,969 | 106,466 | 102,881 | 99,574 | 101,635 | 97,964 | 105,694 | 112,855 | ||||||||||||||||||||||||||||||
| General and administrative(1) |
13,617 | 18,813 | 15,955 | 19,908 | 26,347 | 30,802 | 30,879 | 29,353 | 34,934 | 29,824 | ||||||||||||||||||||||||||||||
| Depreciation and amortization |
15,593 | 15,327 | 15,578 | 18,827 | 31,274 | 29,950 | 29,734 | 31,993 | 33,995 | 29,924 | ||||||||||||||||||||||||||||||
| Impairment of goodwill. |
— | — | — | — | — | — | — | 36,216 | 11,112 | — | ||||||||||||||||||||||||||||||
| Impairment of intangible assets |
— | — | — | — | — | — | — | — | 4,544 | — | ||||||||||||||||||||||||||||||
| Other. |
26 | 244 | — | 861 | 1,108 | 4,935 | (267 | ) | 3,858 | 1,420 | (547 | ) | ||||||||||||||||||||||||||||
|
|
|
|
|
|
|
|
|
|
|
|
|
|
|
|
|
|
|
|
|
|||||||||||||||||||||
| Total operating expenses. |
139,253 | 157,572 | 149,044 | 177,411 | 207,132 | 210,964 | 210,666 | 256,661 | 245,006 | 230,369 | ||||||||||||||||||||||||||||||
|
|
|
|
|
|
|
|
|
|
|
|
|
|
|
|
|
|
|
|
|
|||||||||||||||||||||
| Income from operations. |
26,467 | 18,953 | 37,447 | 31,680 | 35,543 | 36,326 | 50,966 | 16,919 | 28,499 | 59,217 | ||||||||||||||||||||||||||||||
| Total other income (expense) |
309 | (1,268 | ) | (7,107 | ) | (32,000 | ) | (9,036 | ) | (8,285 | ) | (7,954 | ) | (7,736 | ) | (6,891 | ) | (9,078 | ) | |||||||||||||||||||||
|
|
|
|
|
|
|
|
|
|
|
|
|
|
|
|
|
|
|
|
|
|||||||||||||||||||||
| Income (loss) before income taxes |
26,776 | 17,685 | 30,340 | (320 | ) | 26,507 | 28,041 | 43,012 | 9,183 | 21,608 | 50,139 | |||||||||||||||||||||||||||||
| Income tax expense (benefit). |
9,908 | 6,490 | 10,780 | (1,821 | ) | 10,141 | 12,262 | 16,033 | 256 | 11,340 | 18,795 | |||||||||||||||||||||||||||||
|
|
|
|
|
|
|
|
|
|
|
|
|
|
|
|
|
|
|
|
|
|||||||||||||||||||||
| Net income |
$ | 16,868 | $ | 11,195 | $ | 19,560 | $ | 1,501 | $ | 16,366 | $ | 15,779 | $ | 26,979 | $ | 8,927 | $ | 10,268 | $ | 31,344 | ||||||||||||||||||||
|
|
|
|
|
|
|
|
|
|
|
|
|
|
|
|
|
|
|
|
|
|||||||||||||||||||||
|
(1) Long-term incentive compensation included in above line items: |
|
|||||||||||||||||||||||||||||||||||||||
| Operations. |
$ | 1,147 | $ | 1,133 | $ | 1,144 | $ | 1,089 | $ | 580 | $ | 700 | $ | 776 | $ | 818 | $ | 536 | $ | 192 | ||||||||||||||||||||
| Sales and marketing. |
3,262 | 3,221 | 3,255 | 3,097 | 1,839 | 2,221 | 2,463 | 2,595 | 1,469 | 1,843 | ||||||||||||||||||||||||||||||
| General and administrative |
1,701 | 1,679 | 1,697 | 1,615 | 1,441 | 1,740 | 1,930 | 2,033 | 2,072 | 1,127 | ||||||||||||||||||||||||||||||
|
|
|
|
|
|
|
|
|
|
|
|
|
|
|
|
|
|
|
|
|
|||||||||||||||||||||
| Total. |
$ | 6,110 | $ | 6,033 | $ | 6,096 | $ | 5,801 | $ | 3,860 | $ | 4,661 | $ | 5,169 | $ | 5,446 | $ | 4,077 | $ | 3,162 | ||||||||||||||||||||
|
|
|
|
|
|
|
|
|
|
|
|
|
|
|
|
|
|
|
|
|
|||||||||||||||||||||
80
Table of Contents
| Three Months ended | ||||||||||||||||||||||||||||||||||||||||
| Mar 31, 2010 |
Jun 30, 2010 |
Sep 30, 2010 |
Dec 31, 2010 |
Mar 31, 2011 |
Jun 30, 2011 |
Sep 30, 2011 |
Dec 31, 2011 |
Mar 31, 2012 |
Jun 30, 2012 |
|||||||||||||||||||||||||||||||
| (as a percentage of total revenues) | ||||||||||||||||||||||||||||||||||||||||
| Revenues: |
||||||||||||||||||||||||||||||||||||||||
| Digital Media |
100 | % | 100 | % | 100 | % | 94 | % | 91 | % | 91 | % | 88 | % | 87 | % | 86 | % | 86 | % | ||||||||||||||||||||
| Software Solutions. |
— | — | — | 6 | % | 9 | % | 9 | % | 12 | % | 13 | % | 14 | % | 14 | % | |||||||||||||||||||||||
|
|
|
|
|
|
|
|
|
|
|
|
|
|
|
|
|
|
|
|
|
|||||||||||||||||||||
| Total revenues |
100 | % | 100 | % | 100 | % | 100 | % | 100 | % | 100 | % | 100 | % | 100 | % | 100 | % | 100 | % | ||||||||||||||||||||
|
|
|
|
|
|
|
|
|
|
|
|
|
|
|
|
|
|
|
|
|
|||||||||||||||||||||
| Operating expenses: |
||||||||||||||||||||||||||||||||||||||||
| Operations |
17 | % | 16 | % | 16 | % | 15 | % | 19 | % | 18 | % | 19 | % | 21 | % | 19 | % | 20 | % | ||||||||||||||||||||
| Sales and marketing |
49 | % | 54 | % | 47 | % | 51 | % | 42 | % | 40 | % | 39 | % | 36 | % | 39 | % | 39 | % | ||||||||||||||||||||
| General and administrative |
8 | % | 11 | % | 9 | % | 10 | % | 11 | % | 12 | % | 12 | % | 11 | % | 13 | % | 10 | % | ||||||||||||||||||||
| Depreciation and amortization |
9 | % | 9 | % | 8 | % | 9 | % | 13 | % | 12 | % | 11 | % | 12 | % | 12 | % | 10 | % | ||||||||||||||||||||
| Impairment of goodwill. |
0 | % | 0 | % | 0 | % | 0 | % | 0 | % | 0 | % | 0 | % | 13 | % | 4 | % | 0 | % | ||||||||||||||||||||
| Impairment of intangible assets |
0 | % | 0 | % | 0 | % | 0 | % | 0 | % | 0 | % | 0 | % | 0 | % | 2 | % | 0 | % | ||||||||||||||||||||
| Other. |
0 | % | 0 | % | 0 | % | 0 | % | 0 | % | 2 | % | 0 | % | 1 | % | 1 | % | 0 | % | ||||||||||||||||||||
|
|
|
|
|
|
|
|
|
|
|
|
|
|
|
|
|
|
|
|
|
|||||||||||||||||||||
| Total operating expenses. |
84 | % | 89 | % | 80 | % | 85 | % | 85 | % | 85 | % | 81 | % | 94 | % | 90 | % | 80 | % | ||||||||||||||||||||
|
|
|
|
|
|
|
|
|
|
|
|
|
|
|
|
|
|
|
|
|
|||||||||||||||||||||
| Income from operations. |
16 | % | 11 | % | 20 | % | 15 | % | 15 | % | 15 | % | 19 | % | 6 | % | 10 | % | 20 | % | ||||||||||||||||||||
| Total other income (expense) |
0 | % | -1 | % | -4 | % | -15 | % | -4 | % | -3 | % | -3 | % | -3 | % | -3 | % | -3 | % | ||||||||||||||||||||
|
|
|
|
|
|
|
|
|
|
|
|
|
|
|
|
|
|
|
|
|
|||||||||||||||||||||
| Income (loss) before income taxes |
16 | % | 10 | % | 16 | % | 0 | % | 11 | % | 11 | % | 16 | % | 3 | % | 8 | % | 17 | % | ||||||||||||||||||||
| Income tax expense (benefit). |
6 | % | 4 | % | 6 | % | -1 | % | 4 | % | 5 | % | 6 | % | 0 | % | 4 | % | 6 | % | ||||||||||||||||||||
|
|
|
|
|
|
|
|
|
|
|
|
|
|
|
|
|
|
|
|
|
|||||||||||||||||||||
| Net income |
10 | % | 6 | % | 10 | % | 1 | % | 7 | % | 6 | % | 10 | % | 3 | % | 4 | % | 11 | % | ||||||||||||||||||||
|
|
|
|
|
|
|
|
|
|
|
|
|
|
|
|
|
|
|
|
|
|||||||||||||||||||||
Liquidity and Capital Resources
Our liquidity is funded primarily through cash provided by operations, our credit facilities (described below) and the sale of equity securities, which has been generally sufficient to fund our operations, planned capital expenditures, debt service, dividends, stock repurchases, acquisitions and public company expenses. As of June 30, 2012, our principal sources of liquidity consisted of cash provided by operations and $130.0 million of availability under the $400.0 million revolving portion of our credit facilities. Our total indebtedness was $1,284.4 million as of June 30, 2012. In April 2012, we amended our credit facilities and borrowed an additional $400.0 million in connection with the payment of a $400.0 million cash dividend to our then-existing common stockholders.
Our principal needs for liquidity have been, and for the foreseeable future will continue to be, debt service, capital expenditures, working capital and acquisitions. Additionally, our strategy includes the development of additional services and the expansion into new markets. We anticipate that the execution of these components of our strategy will not require a significant amount of resources and will be funded primarily through cash provided by operating activities.
The main portion of our capital expenditures has been related to enhancing our technology infrastructure. Our capital expenditures for the six months ended June 30, 2011 and 2012 and the years ended December 31, 2009, 2010 and 2011 were $38.7 million, $42.5 million, $62.6 million, $51.4 million and $90.4 million, respectively. We believe that our cash flow from operations and available borrowings under the revolving portion of our credit facilities will be sufficient to meet our liquidity needs for the next 12 months. We anticipate that to the extent that we require additional liquidity, it will be funded through the incurrence of additional indebtedness, equity financings or a combination thereof. We cannot assure you that we will be able to obtain additional liquidity through financings on reasonable terms, or at all. Additionally, our liquidity and our ability to meet our obligations and fund our capital requirements are also dependent on our future financial performance, which is subject to general economic, financial and other factors that are beyond our control. Accordingly, we cannot assure you that our business will generate sufficient cash flow from operations or that future borrowings will be available under our credit facilities or otherwise to meet our liquidity needs in the
81
Table of Contents
future. Although we have no specific current plans to do so, if we decide to pursue one or more significant acquisitions, we may incur additional debt or sell additional equity to finance such acquisitions.
Cash Flows
The following table presents a summary of cash flows from operating, investing and financing activities for the six months ended June 30, 2011 and 2012 and the years ended December 31, 2009, 2010 and 2011.
| Years ended December 31, |
Six Months ended June 30, |
|||||||||||||||||||
| 2009 | 2010 | 2011 | 2011 | 2012 | ||||||||||||||||
| (in thousands) | ||||||||||||||||||||
| Net cash provided by operating activities |
$ | 110,817 | $ | 148,393 | $ | 247,009 | $ | 119,602 | $ | 62,015 | ||||||||||
| Net cash used in investing activities |
(103,256 | ) | (762,565 | ) | (222,404 | ) | (168,175 | ) | (38,836 | ) | ||||||||||
| Net cash (used in) provided by financing activities |
(7,561 | ) | 614,172 | (24,605 | ) | 48,573 | (23,179 | ) | ||||||||||||
Cash Flow from Operating Activities
Net cash provided by operating activities was $119.6 million for the six months ended June 30, 2011 as compared to $62.0 million in the six months ended June 30, 2012. The decrease was due primarily to $54.5 million in net working capital needs primarily due to timing, an $18.0 million increase in taxes paid and a $24.8 million increase in long-term incentive compensation payments. These decreases were partially offset by an increase in cash from operations and a $3.0 million decrease in interest paid in the six months ended June 30, 2011.
Net cash provided by operating activities was $148.4 million for the year ended December 31, 2010 as compared to $247.0 million for the year ended December 31, 2011. The increase was primarily due to an increase in cash from operations, including an increase resulting from the impact of the vAuto, VinSolutions and Kelley Blue Book acquisitions, a $7.6 million increase in working capital and a $3.2 million decrease in long-term incentive compensation payments, which were partially offset by $20.8 million and $9.8 million in higher interest and taxes paid, respectively, in 2011.
Net cash provided by operating activities was $110.8 million for the year ended December 31, 2009 compared to $148.4 million for the year ended December 31, 2010. The increase was primarily due to an increase in cash from operations during the year ended December 31, 2010, including an increase resulting from the impact of the vAuto and Kelley Blue Book acquisitions, a $21.0 million decrease in long-term incentive compensation payments and a $2.8 million increase in working capital, which were partially offset by $28.7 million and $14.0 million in higher taxes and interest paid, respectively, in 2011.
Cash Flow from Investing Activities
Net cash used in investing activities was $168.2 million for the six months ended June 30, 2011 as compared to $38.8 million for the six months ended June 30, 2012. The decrease was primarily due to $134.6 million paid in June 2011 for the VinSolutions acquisition, which was partially offset by a $3.9 million increase in capital expenditures in the six months ended June 30, 2012.
Net cash used in investing activities was $762.6 million for the year ended December 31, 2010 as compared to $222.4 million for the year ended December 31, 2011. The decrease reflected $786.8 in cash used for the 2010 Acquisitions, which was slightly offset by $134.6 million in cash used for the
82
Table of Contents
acquisition of VinSolutions in 2011 and $39.0 million of increased capital expenditures in 2011. Further, 2010 investing activities included a $75.6 million decrease in our cash balances held by CEI, which cash balances were used to help finance a share repurchase in June 2010 prior to the Providence Investment.
Net cash used in investing activities was $103.3 million for the year ended December 31, 2009 as compared to $762.6 million for the year ended December 31, 2010. The increase reflected $786.8 million in cash used for the 2010 Acquisitions, which was slightly offset by a $11.3 million decrease in capital expenditures in 2010 as compared to 2009. Further, 2010 investing activities included a $75.6 million decrease in our cash balances held by CEI, which cash balances were used to help finance a share repurchase in June 2010 prior to the Providence Investment.
Cash Flow from Financing Activities
Net cash provided by financing activities was $48.6 million for the six months ended June 30, 2011 compared to net cash used in financing activities of $23.2 million for the six months ended June 30, 2012. The change was due to $52.3 million in net borrowings under our credit facilities in the six months ended June 30, 2011, primarily to help finance the VinSolutions acquisition, versus net borrowings of $391.8 million in the six months ended June 30, 2012 primarily to finance a $400.0 million special dividend to the then-existing common stockholders of ATC. In addition, we paid $10.6 million in contingent consideration related to the VinSolutions acquisition in the six months ended June 30, 2012. Further, we paid $6.2 million of debt issuance costs in the six months ended June 30, 2012 versus debt issuance costs of $3.7 million paid during the six months ended June 30, 2011.
Net cash provided by financing activities was $614.2 million for the year ended December 31, 2010 as compared to net cash used in financing activities of $24.6 million for the year ended December 31, 2011. During the year ended December 31, 2010, net cash provided by financing activities was increased by the incremental financing of $470.3 million used to fund the 2010 Acquisitions and $454.2 million used to partially fund the share repurchase from our then-existing shareholders prior to the Providence Investment, as well as $314.8 million in proceeds from equity investments by our then-existing stockholders to fund the 2010 Acquisitions. These increases were offset by the $555.0 million share repurchase from our then-existing stockholders prior to the Providence Investment, $45.0 million in repayments of borrowings under our credit facilities and the payment of $25.1 million of debt issuance costs. During the year ended December 31, 2011, net cash used in financing activities reflected approximately $27.4 million of contingent consideration associated with the payment of an earn-out that was part of the vAuto acquisition in 2010 which was triggered by our VinSolutions acquisition in June 2011.
Net cash used in financing activities was $7.6 million for the year ended December 31, 2009, which reflected the repurchase of shares from then-existing stockholders. Net cash provided by financing activities was $614.2 million for the year ended December 31, 2010 primarily as a result of the incremental financing of $470.3 million used to fund the 2010 Acquisitions and $454.2 million used to partially fund the share repurchase from our then-existing shareholders prior to the Providence Investment, as well as $314.8 million in proceeds from equity investments by our then-existing stockholders to fund the 2010 Acquisitions. These increases were offset by the $555.0 million share repurchase from our then-existing stockholders prior to the Providence Investment, $45.0 million in repayments of borrowings on credit facilities and the payment of $25.1 million of debt issuance costs.
Credit Facilities
On December 15, 2010, ATC entered into our credit facilities with Wells Fargo Bank, National Association, as administrative agent and collateral agent, and other agents and lenders. On June 14,
83
Table of Contents
2011, we amended our credit facilities to, among other things, increase the aggregate term loan commitments by $100.0 million to finance the acquisition of VinSolutions. On April 30, 2012, we amended our credit facilities to, among other things, increase the aggregate term loan commitments by $200.0 million and increase the aggregate revolving credit commitments by $200.0 million in order to finance the payment of a $400.0 million special dividend to our stock holders. As of June 30, 2012, our credit facilities consisted of a revolving credit facility in an aggregate principal amount of $400.0 million and two term loan facilities in an aggregate principal amount of $1,016.3 million.
Our credit facilities consist of:
| Ÿ | a term A loan facility, of which $621.3 million was outstanding as of June 30, 2012, which matures in 2015 (provided that the $200.0 million of the term A loan facility loaned pursuant to the amendment on April 30, 2012 shall mature in 2017 unless we have not repaid or refinanced the earlier maturing portion of the term A loans by 2015 or repaid or refinanced the term B loans by 2016 (or, in either case, we have not demonstrated to the reasonable satisfaction of Wells Fargo that we have committed financing or cash available to repay or refinance such loans), in which case the additional loans made pursuant to the amendment on April 30, 2012 shall mature in 2015 or 2016, as applicable), |
| Ÿ | a term B loan facility, of which $395.0 million was outstanding as of June 30, 2012, which matures in 2016, and |
| Ÿ | a $400.0 million revolving credit facility, of which $270.0 million was outstanding as of June 30, 2012, which matures in 2015. |
The revolving credit facility includes a sublimit of $25.0 million for letters of credit.
In November 2012, we intend to use $65.0 million in proceeds from borrowings under our revolving credit facility to purchase a 21.8% interest in Bitauto and to finance the purchase of $6.5 million of Bitauto shares by certain members of Bitauto’s senior management. In exchange, they agreed to issue to us an aggregate principal amount of $6.5 million in senior secured guaranteed exchangeable bonds. See “—Bitauto Investment” above.
The obligations under our credit facilities are unconditional and are guaranteed by substantially all of our existing and future domestic subsidiaries. Our credit facilities and related guarantees are secured on a first-priority basis by security interests (subject to liens permitted under the credit agreement governing our credit facilities) in substantially all tangible and intangible assets owned by us, the obligors under our credit facilities and each of our other domestic subsidiaries, subject to certain exceptions, including limiting pledges of voting stock of foreign subsidiaries to 65% of such voting stock.
Borrowings under our credit facilities bear interest at a rate equal to (1) in the case of term B loans, at our option (i) the greater of (a) the rate of interest per annum determined by Wells Fargo Bank, from time to time, as its prime rate in effect at its principal office in Charlotte, North Carolina, and (b) the federal funds rate plus 0.50% per annum (the base rate) (provided that such rate as applied to the term B loans shall not be less than 2.0% per annum), in each case plus 2.00% per annum or (ii) LIBOR (adjusted for statutory reserves and provided that such rate as applied to the term B loans shall not be less than 1.0% per annum) plus 3.00% and (2) in the case of term A loans and the revolving loans, at our option (subject to certain exceptions) (i) the base rate plus 1.50% when our leverage ratio (as defined in our credit facilities) is greater than 4.00 to 1.00 (leverage level 1), the base rate plus 1.25% when our leverage ratio is greater than 3.50 to 1.00 but less than or equal to 4.00 to 1.00 (leverage level 2), the base rate plus 1.00% when our leverage ratio is greater than 3.00 to 1.00 but less than or equal to 3.50 to 1.00 (leverage level 3), the base rate plus 0.75% when our leverage ratio is greater than 2.50 to 1.00 but less than or equal to 3.00 to 1.00 (leverage level 4) and the base
84
Table of Contents
rate plus 0.50% when our leverage ratio is less than or equal to 2.50 to 1.00 (leverage level 5) or (ii) LIBOR (adjusted for statutory reserves) plus 2.50% in the case of leverage level 1, 2.25% in the case of leverage level 2, 2.00% in the case of leverage level 3, 1.75% in the case of leverage level 4 and 1.50% in the case of leverage level 5.
If we default on the payment of any principal, interest, or any other amounts due under our credit facilities, we will be obligated to pay default interest on the overdue amounts. The default interest rate on principal payments will equal the interest rate applicable to such loan plus 2.00% per annum, and the default interest rate on all other payments will equal the interest rate applicable to base rate revolving loans plus 2.00% per annum.
As of June 30, 2012, the weighted average interest rate under our credit facilities was 2.68%. We have no interest rate swaps. At the rates in effect on June 30, 2012, and our outstanding balance of $1,284.4 million as of June 30, 2012, and assuming we do not make any voluntary or mandatory prepayments, our debt service obligations for the remainder of 2012 would be $35.5 million, consisting of $17.2 million of interest and $18.3 million of scheduled principal payments. In addition, our regularly scheduled principal payments will increase going forward. Our regularly scheduled principal payments for the year ended December 31, 2013 will be $45.5 million and our regularly scheduled principal payments for the year ended December 31, 2014 will be $61.0 million. In addition, we may be required to make additional prepayments in certain circumstances.
In addition to paying interest on outstanding principal under our credit facilities, we are also required to pay a commitment fee at a rate ranging from 0.25% to 0.45% per annum (based on a leverage ratio) on the daily unused commitments available to be drawn under the revolving credit facility. We are also required to pay letter of credit fees, with respect to each letter of credit issued, at a rate per annum equal to the applicable LIBOR margin for revolving loans on the average daily amount of undrawn letters of credit. Letter of credit disbursements that have not been repaid by us accrue interest at the applicable base rate plus the margin, as described above. We are also required to pay fronting fees, with respect to each letter of credit issued, at a rate specified by the issuer of the letters of credit and to pay Wells Fargo Bank certain administrative fees from time to time, in its role as administrative agent. The term A loans under our credit facilities amortize in quarterly installments in amounts set forth in the credit agreement governing our credit facilities, with the outstanding balance due at maturity. The term B loans under our credit facilities amortize in quarterly installments of 0.25% of the principal amount, with the outstanding balance due at maturity. Under certain circumstances, we may be required to reimburse the lenders under our credit facilities for certain increased fees and expenses caused by a change of law.
We may prepay the loans under our credit facilities from time to time without penalty, subject to certain customary restrictions. We are generally required to prepay term loan borrowings under our credit facilities with (1) 100% of the net cash proceeds we receive from non-ordinary course asset sales or as a result of a casualty or condemnation, subject to certain exceptions including limited rights to reinvest such net cash proceeds, (2) 100% of the net cash proceeds we receive from the issuance of debt obligations other than debt obligations permitted under the credit agreement and (3) 50% (or, if our leverage ratio is less than 3.25 to 1.00, 0%) of excess cash flow (as defined in the credit agreement governing our credit facilities). All mandatory prepayments will be applied to the term loans on a pro rata basis, subject to certain adjustments in the event any term loans are voluntarily prepaid in any period.
Our credit facilities require us to maintain certain financial ratios, including a maximum leverage ratio (based upon the ratio of our total outstanding indebtedness, net of certain unrestricted cash and cash equivalents, to consolidated adjusted EBITDA, as defined in the credit agreement governing our credit facilities) and a minimum debt service coverage ratio (based upon the ratio of consolidated
85
Table of Contents
adjusted EBITDA, less capital expenditures, to consolidated debt service), which are tested quarterly. Based on the formulas set forth in the credit agreement governing our credit facilities, as of June 30, 2012, we were required to maintain a maximum leverage ratio of 4.50 to 1.00 and a minimum debt service coverage ratio of 2.25 to 1.00. The financial ratios required under our credit facilities become more restrictive over time.
The credit agreement also contains a number of affirmative and negative covenants including: limitations on mergers, consolidations and dissolutions; sales of assets; sale-leaseback transactions; investments and acquisitions; indebtedness; liens; negative pledges; affiliate transactions; the conduct of our business; modifications or prepayments of other material indebtedness; issuing certain redeemable, convertible or exchangeable equity securities and the activities of certain subsidiaries holding material intellectual property. The credit agreement also includes a covenant that restricts ATC’s ability to pay dividends or to make any other payments in respect of its common stock. This restriction is subject to customary exceptions including, among others, payments required pursuant to certain contracts, payments to satisfy certain of our tax obligations, payments out of the proceeds of an initial public offering up to 6% per annum of such proceeds and payments subject to its pro forma compliance with certain leverage ratios. The credit agreement contains events of default that are customary for similar facilities and transactions, including a cross-default provision with respect to other material indebtedness, and an event of default that would be triggered by a change of control, as defined in the credit agreement governing our credit facilities, and which is not expected to be triggered by this offering. As of June 30, 2012, we were in compliance with all of our covenants and other obligations under the credit agreement.
Contractual Obligations
As of December 31, 2011, our contractual obligations and other commitments were as follows:
| Payments Due by Period | ||||||||||||||||||||
| Total | Less Than 1 Year |
1 - 3 Years | 3 - 5 Years | More Than 5 Years |
||||||||||||||||
| (in thousands) | ||||||||||||||||||||
| Long-term debt obligations(a) |
$ | 829,500 | $ | 26,500 | $ | 84,500 | $ | 718,500 | $ | — | ||||||||||
| Interest costs(b) |
119,664 | 27,339 | 77,165 | 15,160 | — | |||||||||||||||
| Capital lease obligations |
283 | 189 | 94 | — | — | |||||||||||||||
| Operating lease obligations(c) |
121,025 | 10,392 | 21,062 | 16,992 | 72,579 | |||||||||||||||
| Long-term incentive compensation(d) |
38,182 | 34,011 | 4,171 | — | — | |||||||||||||||
| Other contractual obligations(e) |
62,111 | 35,885 | 26,226 | — | — | |||||||||||||||
|
|
|
|
|
|
|
|
|
|
|
|||||||||||
| Total |
$ | 1,170,765 | $ | 134,316 | $ | 213,218 | $ | 750,652 | $ | 72,579 | ||||||||||
|
|
|
|
|
|
|
|
|
|
|
|||||||||||
| (a) | Represents principal payments due under our term loan credit facilities. Amounts do not include the incremental $200.0 million term loan commitment made pursuant to the April 30, 2012 amendment. See “—Liquidity and Capital Resources—Credit Facilities” above for the terms of our credit facilities. |
| (b) | Represents interest payments on our credit facilities. Variable interest payments were calculated using interest rates and outstanding balances as of December 31, 2011. Amounts do not include interest costs related to the incremental $400.0 million term loan and revolving credit commitments made pursuant to the April 30, 2012 amendment. See “—Liquidity and Capital Resources—Credit Facilities” above for the terms of our credit facilities. |
| (c) | Amounts do not include incremental lease obligations related to the 51-month extension of the Kelley Blue Book leases in Irvine, California from March 31, 2013 to June 30, 2017 that were incurred after December 31, 2011. |
86
Table of Contents
| (d) | Represents amounts payable in cash related to our long-term incentive compensation awards based on the contractual vesting and expected payout of such awards as of December 31, 2011. |
| (e) | Consists primarily of contractual marketing commitments and outstanding purchase orders for hardware and software. |
Critical Accounting Policies and Estimates
Our discussion and analysis of our financial condition and results of operations are based upon our consolidated financial statements, which have been prepared in accordance with GAAP. The preparation of these consolidated financial statements requires us to make estimates and assumptions that affect the reported amounts of assets, liabilities, revenues, expenses and related disclosures. We evaluate our estimates and assumptions on an on-going basis. Our estimates are based on historical experience and various other assumptions that we believe to be reasonable under the circumstances. Our actual results could differ from these estimates under different assumptions or conditions.
The accounting policies that we believe to be the most critical to an understanding of our financial condition and results of operations and that require complex and subjective management judgments are discussed below. The accounting policies of our two business segments are the same, except as referenced below.
Revenue Recognition
We recognize revenues when they are realized (or realizable) and earned, which generally occurs when each of the following criteria is met:
| Ÿ | persuasive evidence of an arrangement exists; |
| Ÿ | services have been rendered and delivered; |
| Ÿ | the price to the buyer from the seller is fixed and determinable; and |
| Ÿ | collectibility is reasonably assured. |
We provide services to our customers in our Digital Media and Software Solutions segments.
In our Digital Media business segment:
| Ÿ | Dealer revenues from our recurring monthly subscription-based advertising services are recognized ratably over the subscription period in which the service is provided. |
| Ÿ | Brand advertising revenues generated primarily from display advertising insertion orders placed by OEMs and related advertising associations, in which we typically guarantee for a fixed fee a minimum number of impressions, are recognized ratably over the term of the agreement, provided that the total amount recognized does not exceed the amount that would be recognized based upon actual impressions delivered. |
| Ÿ | Revenues from other display advertising customers are recognized as the related fees are earned. In addition, revenues generated from the sale of consumer and vehicle data gathered internally from our websites are recognized as the related fees are earned. |
| Ÿ | Private seller advertising revenues are recognized ratably over the average life of the listing. |
We do not customarily enter into barter advertising arrangements, and thus any revenues related to such arrangements is not material.
In our Software Solutions business segment, revenues are recognized ratably over the subscription period in which the services are provided.
87
Table of Contents
Goodwill and Intangible Assets
We evaluate goodwill and indefinite-lived intangible assets for impairment annually as of December 31 or more frequently if an event occurs or circumstances change that would more likely than not reduce the fair value of a reporting unit or indefinite-lived intangible asset below its carrying value. We estimate the fair value of our reporting units and indefinite-lived intangible assets using a combination of the income approach and the market approach. The income approach utilizes a discounted cash flow model incorporating management’s expectations for future revenue, operating expenses, EBITDA, capital expenditures and an anticipated tax rate. The related cash flow forecasts are discounted using management’s estimate of a weighted-average cost of capital for each reporting unit at the date of valuation. The market approach utilizes comparative market multiples in the valuation estimate. Multiples are derived by relating the value of guideline companies based on the market price of publicly traded shares to various measures of their earnings and cash flow. Such multiples are then applied to the historical and projected earnings and cash flow of the reporting unit in developing the valuation estimate. Preparation of forecasts and the selection of the discount rates involve significant judgments about expected future business performance and general market conditions. Significant changes in forecasts, the discount rates selected or the weighting of the income and market approach could affect the estimated fair value of one or more of the reporting units and could result in a goodwill impairment charge in a future period.
Long-Lived Assets
We regularly evaluate whether events and circumstances have occurred that indicate the carrying amount of property and equipment and finite-lived intangible assets may not be recoverable. Conditions that could indicate an impairment assessment is needed include a significant decline in the observable market value of an asset or asset group, a significant change in the extent or manner in which an asset or asset group is used, or a significant adverse change that would indicate that the carrying amount of an asset or asset group is not recoverable. When factors indicate that these long-lived assets or asset groups should be evaluated for possible impairment, we assess the potential impairment by determining whether the carrying value of such long-lived assets or asset groups will be recovered through the future undiscounted cash flows expected from use of the asset or asset group and its eventual disposition. If the carrying amount of the asset or asset group is determined not to be recoverable, an impairment charge is recorded based on the excess, if any, of the carrying amount over fair value. Fair values are determined based on quoted market values or discounted cash flows analyses as applicable. We regularly evaluate whether events and circumstances have occurred that indicate the useful lives of property and equipment and finite-life intangible assets may warrant revision.
Long-Term Incentive Compensation
Our long-term incentive compensation plan provides for the granting of a variety of cash and stock-based incentive awards to employees.
Cash awards and stock-based payment awards to be settled in cash are classified as liabilities in the accompanying consolidated balance sheets. Generally, the amount of compensation expense for such awards is ultimately determined by reference to the amount paid upon the eventual settlement of such awards and is recognized over the corresponding requisite service period. The recognition of compensation expense in periods prior to settlement is based upon interim estimates, and the effects of changes in such estimates are recognized over the corresponding requisite service period, whereby the cumulative effect of such change is recognized in the period in which the change occurs. For cash awards not determined by reference to the fair value of our equity stock, such interim estimates are based upon the amount expected to be paid upon eventual settlement of the award. For stock-based payment awards to be settled in cash, we have elected to determine such interim estimates based
88
Table of Contents
upon the intrinsic value (or the difference between the fair value of the underlying equity instrument and the exercise price) of the award as determined at the end of each reporting period.
Stock-based payment awards to be settled in stock are classified as additional paid-in capital in the accompanying consolidated balance sheets. Such awards are measured at fair value as determined on the date of the grant and recognized as compensation expense over the requisite service period.
For awards with graded vesting, compensation expense is recognized ratably over the requisite service period for each separately vesting tranche of the award as if the award were, in substance, multiple awards. We do not recognize compensation expense for awards that are not expected to vest. Our estimate of pre-vesting forfeitures is periodically adjusted, when necessary, to reflect actual forfeiture experience.
We expense employee stock-based payments under the fair value method. ASC 718, Compensation—Stock Compensation, requires compensation cost for the fair value of stock-based payments at the date they are granted to be recognized over the requisite service period. Further, the fair value of liability awards is required to be re-measured at the reporting date, with changes in fair value recognized as compensation cost over the requisite service period. We estimate the fair value of the stock-based awards at the date they are granted using the Black-Scholes option pricing model.
In March 2011, May 2011 and October 2011, we granted options to purchase 869,200 shares, 2,375,200 shares and 597,472 shares, respectively, of our Class A common stock at an exercise price of $15.00 per share. In April 2012 and May 2012, we granted options to purchase 422,536 shares and 759,648 shares, respectively, of our Class A common Stock at an exercise price of $19.96 per share. Half of the options granted vest over a period of time and the remaining half of the options vest at a similar rate and time based on the achievement of specified performance criteria. After this offering, the options will vest 20% upon completion of this offering and the time-vested portion will vest 20% per year on December 31 thereafter and, once vested, will be exercisable during a ten-year period. The performance-vested portion will have the same schedule for vesting and exercisability, but will only vest if certain performance conditions are met. In connection with the formation of ATG, the award agreements were modified so that the options will be settled in shares of our Class A common stock upon exercise, and may be net settled, or employees may elect to write a check for the option cost and related taxes to receive the total number of options granted. We did not grant any options prior to 2011. For information on 2012 adjustments related to stock option and stock appreciation right grants, see “—Adjustment of Stock Options and Stock Appreciation Rights.”
Because there was no public market for the securities underlying the share-based payments and awards, our compensation committee estimated the fair value of ATC’s common stock primarily by using valuation studies conducted as of December 31 of each year. The value is based on valuations as of December 31 of the year immediately preceding the award. The value used is the arithmetic average of valuation studies conducted by two separate, independent firms. The findings of these studies were based on the performance of our business as well as general economic, market, industry and other conditions that could be reasonably evaluated at that time. The analysis in the valuation studies incorporated certain procedures that included a review of historical and projected financial results, projected working capital requirements, capital structure and other factors. The methodologies in the valuation studies included an analysis of the fair value using two widely accepted valuation approaches: (i) discounted cash flow, or income approach and (ii) market multiples, or the market approach. The valuation methodologies that were utilized were based on a number of assumptions, including expectations of our future performance and industry, general economic, market and other conditions. The income and market approaches were both evaluated in the determination of fair value in order to incorporate consideration of our most recent results as well as our future projections, the impact of market conditions, our acquisitions and stock transactions and recent transactions in the industry.
89
Table of Contents
The market approach considered both the market multiples based on our acquisitions, the investment by the Providence Funds as well as other transactions by comparable companies. Market multiples of EBIT and EBITDA used in the market approach were determined through an analysis of publicly traded companies that were selected on the basis of operational and economic similarities with our business. These multiples were then applied to our financial results to determine a fair value. The discounted cash flow methodology involved estimating the then-present value of the projected cash flows to be generated from the business and theoretically available to the providers of capital based on the then-existing capital structure. A discount rate was applied to the projected future cash flows to reflect the risks of ownership and the associated risks of realizing the stream of projected cash flows. Since the cash flows were projected over a limited number of years, a terminal value was computed as of the end of the last period of the projected cash flows. The terminal value was an estimate of the value of ATC on a going concern basis as of that future point in time. Discounting each of the projected future cash flows and the terminal value back to the present and summing the results yielded an indicative value for ATC.
The primary factors contributing to the increase in the fair value of the Class A common stock from the valuation studies conducted at December 31, 2010 and December 31, 2011 include the following:
| Ÿ | a favorable decline in the discount rates utilized in the income approach for the related valuations driven by a decline in risk to reflect a more mature business and recovery in the automobile industry and the economy in general, as well as a decline in the risk-free component of the discount rate based on U.S. Treasury rates; |
| Ÿ | favorable comparison to peer company public market multiples; and |
| Ÿ | stronger long-range outlook for vAuto and VinSolutions above acquisition model estimates. |
The fair value of each option grant was estimated using the Black-Scholes option pricing model. The weighted average assumptions used and the calculated weighted-average fair values of the options are as follows:
| Expected dividend yield |
— | |||
| Risk-free interest rate |
1.7 | % | ||
| Expected life in years |
4.6 | |||
| Expected volatility |
50.9 | % | ||
| Weighted-average fair value of options granted |
$ | 6.59 |
Expected volatilities were based on the median of our publicly traded peer companies most recent historical volatility commensurate with the expected life. The expected dividend yield is 0% since we do not anticipate paying cash dividends in the future. The risk-free interest rate was based on the yield at the date of grant of a United States treasury security with a maturity period approximating the expected term. The expected life represents an estimate of the period of time that the options are expected to remain outstanding and reflects the vesting schedule of the options. The contractual and expected life of the options will increase as a result of this offering.
In September 2011, we awarded 32,612 shares of restricted Class A common stock with a grant date fair value of $15.00 per share. The shares vest in full on December 31, 2013. In June 2012, we awarded 6,012 shares of restricted Class A common stock with a grant date fair value of $19.96 per share. The shares vest in full on June 14, 2013.
In June 2011, we granted 721,068 stock appreciation rights and, in April 2012, we granted 515,648 stock appreciation rights. Our stock appreciation rights entitle the holder to receive a cash payment based upon the appreciation in the fair value of our common stock. The amounts payable on
90
Table of Contents
the 2011 rights will be based on the appreciation of fair value over $15.00. The amounts payable on the 2012 rights are based on appreciation of fair value over $19.96. After this offering, these rights will vest ratably 20% on each December 31 following the grant date and will be fully vested after five years. In connection with the formation of ATG, in June 2012, the award agreements were modified so that vested awards will be settled in shares of our Class A common stock. For information on 2012 adjustments related to stock option and stock appreciation right grants, see “—Adjustment of Stock Options and Stock Appreciation Rights” below.
In 2009 and 2010, we granted performance awards to certain executive officers and other employees that entitle the recipients to a cash payment based on growth in our cash flows and debt reduction over a three-year period. These awards vest 40% and 100% on December 31 of the second and third year following the grant date, respectively. Certain executives were permitted to purchase shares of Class A common stock with a portion of the proceeds of their payments. As of December 31, 2010 and 2011 and June 30, 2012 amounts accrued for these awards were $35.9 million, $48.1 million and $15.8 million, respectively.
Adjustment of Stock Options and Stock Appreciation Rights
In September 2012, all of our outstanding stock options and stock appreciation rights were adjusted to reflect the April 2012 dividend to ATC’s then-existing stockholders by adjusting the exercise price and multiplying the number of awards granted to each recipient by 111.5567%. In September 2012, all of our outstanding stock options and stock appreciation rights were adjusted to reflect our four-for-one stock split by adjusting the exercise price and multiplying the number of awards granted to each recipient by four. Following these adjustments, the aggregate award to each recipient was rounded up to the nearest whole share. The adjustments, which preserved the intrinsic value of the awards, were made in accordance with and as required by the anti-dilution provisions of our 1999 Long-Term Incentive Plan and as such, will not result in the recognition of incremental compensation expense. All share and per share data presented in this prospectus, including in our financial statements and related notes thereto included elsewhere in this prospectus, do not reflect the adjustment to stock options and stock appreciation rights for the impact of the April 2012 dividend.
Income Taxes
Until June 2010, we joined with CEI in filing a consolidated United States federal income tax return and certain state income tax returns. Current federal and state income tax expenses and benefits were allocated on a separate return basis to us based on the current-year tax effects of the inclusion of its income, expenses and credits in the consolidated income tax returns of CEI or based on separate state income tax returns. After the Providence Investment, we ceased consolidation with CEI’s consolidated United States federal tax return filing group.
We provide for income taxes using the liability method, which requires an asset- and liability-based approach in accounting for income taxes. Deferred income taxes reflect the net tax effect on future years of temporary differences between the carrying amount of assets and liabilities for financial
91
Table of Contents
statement and income tax purposes. Valuation allowances, if any, are established when we determine that it is more likely than not that some portion or the entire deferred tax asset will not be realized. We evaluate our effective tax rates regularly and adjust them when appropriate based on currently available information relative to statutory rates, apportionment factors and the applicable taxable income in the jurisdictions in which we operate, among other factors.
We apply additional tax provisions, where applicable, related to accounting for uncertainty in income taxes, which prescribe a recognition threshold and measurement attribute for the financial statement recognition and measurement of tax positions taken or expected to be taken in a tax return. For those benefits to be recognized, a tax position must be more likely than not to be sustained upon examination by taxing authorities. The amount recognized is measured as the largest benefit that has a greater than 50% likelihood of being realized upon settlement. We adjust our estimates of uncertain tax positions periodically because of on-going examinations by, and settlements with, various taxing authorities, as well as changes in tax laws, regulations and interpretations. We classify interest and penalties associated with our unrecognized tax benefits as a component of income tax expense.
Material Weakness
In the audit of our consolidated financial statements for the year ended December 31, 2011, a material weakness in our internal control over financial reporting, as defined in the standards established by U.S. Public Accounting Oversight Board, was identified. The material weakness identified resulted from our lack of accounting and financial reporting personnel with sufficient experience in applying generally accepted accounting principles to certain significant, complex, non-routine and/or infrequent transactions, specifically accounting for business combinations and related impairment determinations as well as stock-based compensation. As a result, misstatements were identified in the audit process and were corrected prior to the issuance of audited financial statements for the year ended December 31, 2011. To remedy this material weakness, we are in the process of implementing several measures to improve our internal control over financial reporting, including (i) hiring additional financial and accounting personnel with SEC reporting and public company accounting experience, including an SEC reporting director, (ii) adjusting our policies and procedures for accounting for complex transactions, and (iii) improving the capabilities of our existing financial and accounting personnel through training and education in the accounting for complex transactions and public reporting requirements. We plan to complete these efforts prior to this offering. Our remediation efforts may not be successful in preventing future determinations that we have a material weakness or significant deficiency in our internal control over financial reporting.
Off Balance Sheet Arrangements
We do not have any off balance sheet arrangements.
Quantitative and Qualitative Disclosure About Market Risk
We are exposed to market risks in the ordinary course of our business. These include primarily interest rate and inflation risks.
Interest Rate Risk
We are exposed to interest rate risk in connection with borrowings under our credit facilities. Our credit facilities bear interest at floating rates based on LIBOR or the greater of the prime rate or the federal funds rate plus an applicable borrowing margin. For variable rate debt, interest rate changes generally do not affect the fair value of the debt instrument, but do impact future earnings and cash flows, assuming other factors are held constant. Based on the amount outstanding under our credit
92
Table of Contents
facilities as of June 30, 2012, a change in 1% in the applicable interest rates on our credit facilities would cause an increase or decrease in our annual interest expense of approximately $12.9 million.
Inflation Risk
We do not believe that inflation has had a material effect on our business, financial condition or results of operations. If our costs were to become subject to significant inflationary pressures, we may not be able to fully offset such higher costs through price increases. Our inability or failure to do so could harm our business, financial condition and results of operations. In addition, inflation could impact our financing costs.
Recently Issued and Adopted Accounting Pronouncements
In September 2011, the FASB issued ASU 2011-08, “Intangibles—Goodwill and Other (Topic 350) Testing Goodwill for Impairment,” which revised the guidance on testing goodwill for impairment. Under the revised guidance, entities testing goodwill for impairment have the option to first assess qualitative factors to determine whether the existence of events or circumstances leads to a determination that it is more likely than not that the fair value of a reporting unit is less than its carrying amount. If, after assessing the totality of events or circumstances, an entity determines it is more likely than not that the fair value of a reporting unit is less than its carrying amount, then performing the two-step impairment test would be required. Under the amendments in this ASU, an entity has the option to bypass the qualitative assessment for any reporting unit in any period and proceed directly to performing the first step of the two-step goodwill impairment test. An entity may resume performing the qualitative assessment in any subsequent period. This ASU does not change how goodwill is calculated or assigned to reporting units, nor does it revise the requirement to test goodwill annually for impairment. In addition, this ASU does not amend the requirement to test goodwill for impairment between annual tests if events or circumstances warrant; however, it does revise the examples of events and circumstances that an entity should consider. The amendments within this ASU are effective for annual and interim goodwill impairment tests performed for fiscal years beginning after December 15, 2011, with early adoption permitted. The guidance will not have a material effect on our financial position, results of operations or cash flows.
93
Table of Contents
Overview
We operate the largest digital automotive marketplace and are a leading provider of marketing and software solutions to automotive dealers in the United States. In the six months ended June 30, 2012, our well-known AutoTrader.com and Kelley Blue Book brands, provided over 28 million average monthly unique visitors with free, convenient access to easily searchable car listings, descriptive content, proprietary pricing and valuation data and innovative vehicle comparison tools. On AutoTrader.com, we aggregated over 3.6 million daily unique new and used car listings, as of June 30, 2012, from our network of over 25,000 dealer relationships. Over 21,000 of these dealers subscribe to our services and pay us monthly fees to reach our broad audience of in-market car shoppers. We also offer OEMs and other advertisers the opportunity to tailor advertising solutions to what is, according to the 2011 KS&R Study, the largest targeted audience of in-market car shoppers, based on their location and preference of make, model, body style and price point. Our innovative software solutions allow car dealers to source, appraise, manage, price and market their inventory and help them manage their consumer relationships in an increasingly high-tech world. We have cultivated our dealer relationships by building what we believe is the largest dealer sales force in the U.S. retail automotive industry, with over 1,400 highly trained, consultative sales and support professionals. Our sales force regularly meets with our dealer customers to review their performance and to optimize their presence on our websites and their use of our software solutions. We operate a broad digital platform to pursue opportunities in the large automotive vertical. Our success is driven by the combination of our leading sales force, significant and recurring investment in our brands, on-going software product innovation, proprietary data and analytics and our ability to connect over 25,000 dealers with the most in-market car shoppers.
Since our founding in 1997, our mission has been to dramatically improve the way people buy and sell new and used cars. We believe our two businesses—Digital Media and Software Solutions—have enhanced the retail automotive industry, reducing friction between dealers and consumers and allowing them to transact with greater ease, confidence and efficiency.
In our Digital Media business, we reach approximately 60% of online in-market car shoppers in the United States, based on the 2011 KS&R Study. We also offer what we believe is the largest selection of unique online car listings that consumers can access from a single source and content tailored to meet consumer needs at all stages of the car buying process. According to the 2011 KS&R Study, we operate two of the leading online brands among car buyers in the United States—AutoTrader.com and Kelley Blue Book—and through our AutoTrader.com and KBB.com websites, we provide car shoppers with solutions for the car buying and selling process. On AutoTrader.com, we offer consumers what we believe is the largest collection of unduplicated vehicle listings and specialized search functionality that allows them to find the exact new or used vehicle they would like to purchase. On KBB.com, consumers can read in-depth vehicle reviews, configure and compare new and used vehicles, and obtain proprietary valuation estimates to inform their purchase or sale of a vehicle. We provide franchise and independent dealers with the opportunity to reach and influence a broad audience of in-market consumers through various tiered digital media subscriptions that include prominent display advertising placements and classified listings incorporating photos, videos, descriptions, pricing and contact information. We also offer OEMs and other advertisers advertising solutions targeted to in-market car shoppers.
Through our Software Solutions business, we provide dealer customers with subscription-based software tools and related data analytics to help them operate their businesses with greater efficiency and profitability. Our suite of software solutions and our experienced, highly-trained consultative sales force help dealers adapt and operate in an increasingly transparent, data-driven and competitive automotive retail marketplace. Our subscription software solutions help dealers source, appraise, price,
94
Table of Contents
manage and market their inventory of cars, and more effectively manage and cultivate their consumer relationships. Our inventory management software solutions, marketed under the vAuto brand, provide dealers with effective analytical tools that help dealers target and purchase specific used vehicles for their inventory and provide those dealers with an analytical framework for determining optimal list prices, which, in turn, enables dealers to increase the velocity of their turnover in used car inventory, resulting in increased profit opportunities. Our integrated CRM software solutions, marketed under the VinSolutions brand, help dealers track their consumer prospects and relationships, develop a web presence, create direct marketing campaigns and instantly advertise inventory across their own and third-party websites, including AutoTrader.com and KBB.com. Our inventory information management software solutions, marketed under the HomeNet and CDMdata brands, enable dealers to extract their inventory data from other vendors’ systems, and conform and distribute that information to a wide variety of websites and marketing outlets.
We believe that our business benefits from several trends, including:
| Ÿ | the on-going shift by consumers to online search tools for vehicle information, market data and current inventory to facilitate new and used car purchases; |
| Ÿ | the continuing rebound of the retail automotive advertising industry following the challenging economic environment in 2009; |
| Ÿ | the increasing allocation of automotive advertising budgets away from traditional media and toward internet advertising to follow consumer behavior; |
| Ÿ | the growing need of dealers for software solutions to help increase the efficiency and profitability of their businesses; and |
| Ÿ | the increased adoption of mobile internet usage. |
The shift of automotive advertising online is on-going, according to Forrester Research, which forecasted that in 2011 the retail automotive industry spent 85% of its advertising spending on traditional forms of advertising, such as television, radio and print, despite consumers’ indication that the internet is their primary media source for advancing their car search. According to a 2011 Polk Automotive Influence Study we conducted in collaboration with R. L. Polk & Co. of over 2,800 online car shoppers, the internet primarily drove decisions about where to purchase a vehicle 78% of the time. Traditional media primarily drove consumer decisions about where to purchase a vehicle only 22% of the time. These figures from the Polk study exclude non-marketing sources of influence, such as word of mouth referrals. Mobile devices provide an additional platform for consumers to access vehicle information, inventory and analytical tools from any location, including on the dealer premises, which we believe gives them greater confidence in the car buying process. We believe we are well-positioned to benefit as consumer behavior and advertising budgets continue to shift toward digital and mobile platforms and as dealers increasingly require more automation and analytical tools.
Since our inception in 1997, as a result of the organic growth of AutoTrader.com, our recent acquisitions and the initial support of CEI, we have increased our revenues from $1.0 million in 1998 to over $1.0 billion in 2011. In 2011, our Adjusted EBITDA and net income were $334.6 million and $68.1 million, respectively. During this period, we generated 89% of our revenues from our Digital Media business, primarily through the sale to dealers of automobile listings subscriptions on AutoTrader.com, and 11% of our revenues from our Software Solutions business, through the sale to dealers of subscriptions to our inventory management and optimization, CRM and marketing software solutions, in 2011. In the six months ended June 30, 2012, we generated 86% of our revenues from our Digital Media business and 14% of our revenues from our Software Solutions business.
95
Table of Contents
Our History
CEI formed our company in 1997. CEI is a leading communications, media and automobile services company with approximately $14.7 billion in revenue in 2011. Unlike many start-up internet companies, we initially benefited from access to two well-established assets, enabling us to rapidly achieve a leadership position. First, CEI provided us with proprietary access to a database of used car classified listings owned by CEI’s automobile wholesale auction division, which enabled AutoTrader.com to launch in May 1998 with more than 200,000 unpaid used car and truck classified listings. Our development of a dedicated dealer sales force allowed this digital database to grow quickly, rising to over one million listings within a year of launch. Second, in August 1999 we licensed the AutoTrader brand from CEI’s existing used car classified print publication joint venture for use by our website. Using “AutoTrader.com” enabled us to benefit from the established consumer awareness of the brand; however, we were not bound by the strategic limitations and financial costs of having to focus on protecting a declining print business. From 2009 to 2011, we operated AutoTrader Classics and AutoTrader Latino as print and digital media businesses. We ceased operating these as print businesses in May 2011 (AutoTrader Classics) and October 2011 (AutoTrader Latino) in order to focus on our Digital Media business.
The Providence Funds acquired a 25% interest in us in 2010. Since then, we have executed a series of acquisitions that have broadened our audience reach and expanded our offerings to dealers.
In 2010, we acquired Kelley Blue Book, a highly recognized brand in the automotive industry that has been providing consumers, lenders and financial institutions with valuation data and analysis on cars since its founding in 1926. Kelley Blue Book provides extensive, objective third-party automobile valuations through KBB.com and in print, with over 2.5 billion pricing reports generated over the last ten years. The first Blue Book of Motor Car Values was published in 1926 and expanded the list of automobile list prices and cash values that California car dealer Les Kelley had been producing since 1918. The automotive community, as well as banks, requested this list of values for their own use. When a consumer asked a dealer what a used car might be worth, the dealer usually referenced this list. It was not until 1993 that the book became available to consumers, and in 1995, Kelley Blue Book became digital with the launch of KBB.com, the online source of the same Kelley Blue Book valuations, available to dealers, banks, insurance companies, private sellers and consumers.
In 2010, we expanded into the software solutions market through the acquisitions of vAuto and HomeNet, as well as through the acquisition of the CDMdata business that was part of Kelley Blue Book. In 2011, we expanded into CRM software solutions with the acquisition of VinSolutions.
These acquisitions have helped us strengthen our tools and content for consumers, provide additional listing and advertising opportunities for dealers, OEMs and other advertisers, and offer software solutions to dealers, which have bolstered our overall market position.
Many of our earliest employees remain with us today in senior operating roles, including President and CEO, Chip Perry, and Chief Marketing Officer, Clark Wood. Mr. Perry was our first employee and started AutoTrader.com with CEI’s backing and their shared vision of the evolving automotive marketplace.
In June 2012, AutoTrader Group, Inc. became ATC’s holding company to reflect our expansion beyond our original AutoTrader.com business.
96
Table of Contents
Our Industry
The retail automotive industry is one of the largest segments of the U.S. economy, with over $650 billion in estimated annual revenue in 2011, according to industry data from NADA, the National Independent Automobile Dealers Association, or NIADA, and CNW Marketing Research, or CNW. This revenue was generated from the sale of over 49 million used and new cars in 2011, excluding fleet sales, according to LMC Automotive and CNW. Our business is intrinsically linked to the automotive industry and the factors that affect it, including sales of new and used cars.
Used car sale volumes represent the vast majority of U.S. vehicle unit sales, with over 38 million used vehicle unit sales in 2011, according to CNW. The used car market is expected to remain active, with constrained supply and, as of April 30, 2012, used vehicle supply of 45 days in 2012 is well below the multi-year average levels of 63 days from 2003 through 2012, according to CNW. This limited supply makes it more difficult for dealers to locate high-quality used car inventory. This puts a premium on the ability of dealers to efficiently acquire, price and sell their used car inventory. CNW forecasts a 2.5% compound annual growth rate, or CAGR, in used cars sold on average from 2012 to 2015. In the used car market, franchise dealers and independent dealers each accounted for over 35% of vehicles sold in 2011, with the remainder being sold by private parties, according to CNW.
New car sales, excluding fleet sales, increased to 10.3 million units in 2011, an approximately 12% increase over 2010, according to data from the Automotive Sales Forecast of LMC Automotive. Momentum has continued into 2012, with new car sales, excluding fleet sales, projected to increase by 11% on an annual basis over 2011 to 11.5 million units, according to J.D. Power and Associates and LMC Automotive. Data from LMC Automotive projects sales levels will continue to grow at a CAGR of approximately 4.4% per year from 2012 to 2015 as sales rebound towards 2007’s level of 12.8 million new cars sold, excluding fleet sales. As car sales increase, there is typically a corresponding increase in the advertising budgets of dealers and automotive advertisers. The new car market is composed of retail and fleet sales, with retail sales accounting for approximately 81% of new vehicles sold in 2011, according to LMC Automotive. Fleet vehicles are primarily sold directly to the rental car industry and do not materially impact our core business.
The Car Dealer Market
Our principal customers are car dealers. The car dealer market is highly fragmented. There are over 100,000 registered dealers in the United States, according to Polk, of which approximately 17,700 are franchise dealers which sell new and used cars and 28,000 are large and medium-sized independent dealers which sell only used cars, according to the NADA and the NIADA, respectively. Franchise dealers have relationships with one or more OEMs and are the only dealers permitted to sell new cars. As of June 30, 2012, we estimate approximately 70% of franchise dealers and 30% of independent dealers subscribed to our digital media solutions and 30% of franchise dealers and 2% of independent dealers subscribed to our software solutions. As of June 30, 2012, we estimate we have dealer relationships with approximately 80% of franchise dealers and 40% of independent dealers in our digital media business and approximately 30% of franchise dealers and 2% of independent dealers in our software solutions business. The number of automotive dealers declined in 2009 and 2010 due to closures and consolidation as a result of factors such as the global economic downturn in 2008 and 2009. The number of franchise dealers has been relatively stable since the disruptions and closings related to the recession in 2008 and 2009, according to the NADA. The remaining dealers benefit from strong partnerships with major OEMs.
While new cars represented over half of franchise dealer revenue in 2011, they contributed only 16% of gross profit to franchise dealers, according to NADA. Used cars contributed a third of gross profit, with the remainder of franchise dealer profits coming from ancillary services, such as service and
97
Table of Contents
parts sales, according to NADA. Even though new car sales generate a smaller portion of dealer profits than used car sales, they are important to dealers as they enable them to maintain good relationships with OEMs, provide used car inventory through trade-ins and establish relationships with new car buyers that can lead to profitable service and parts sales opportunities.
The Large Automotive Advertising Market is Shifting Online
Automotive advertising is among the largest advertising markets in the United States, with more than $22 billion expected to be spent on automotive advertising in 2012, according to Forrester Research. As consumers shift their search for cars online, automotive advertisers are increasingly moving their advertising budgets to the internet and away from traditional media, such as television, radio and print. According to Forrester Research, automotive advertisers increased spending on internet advertising from 5% of their advertising budgets in 2008 to 15% of their forecasted advertising budgets in 2011. The power of this shift was evident in the difficult economic environment in 2009. In that year, excluding fleet sales, U.S. vehicle sales declined by 6% and the overall automotive advertising market declined by 29%, according to LMC Automotive and Forrester Research, respectively. During this same period, however, we increased total revenues by 1% and increased Digital Media MRR by 7%, as more spending was allocated to internet advertising and away from traditional media, illustrating the value proposition of digital advertising.
The internet now plays an influential role in a consumer’s car research and shopping process. According to a 2011 Polk Automotive Influence study, 7 out of 10 new and used vehicle buyers use the internet before purchasing a vehicle. According to the study, these buyers spend 18-19 hours on average researching their purchase, of which approximately 60% is spent online. Of those online hours, new and used car buyers spend 3.3 and 6.4 hours, respectively, on third-party websites—more than the time spent on any other category of websites, including dealer, OEM and search engine. Additionally, according to the 2011 KS&R Study, two-thirds of car buyers start researching their purchase without a particular make or model in mind. As a result, non-OEM websites such as KBB.com and AutoTrader.com, where consumers can compare cars, read reviews and research pricing, play a pivotal role in the consumer decision-making process.
However, the automotive industry’s allocation of advertising spending to digital media continues to lag consumer shopping behavior and preference. While Forrester Research estimated that automotive advertisers would allocate 85% of their advertising spending to traditional media in 2011, according to a 2011 Polk Automotive Influence Study, traditional media primarily drove online car shoppers’ decisions about where to purchase a vehicle only 22% of the time. Of that 22%, 8% was from newspapers, 4% from direct mail, 4% from television, 3% from outdoor advertisements, 2% from magazines and 1% from radio. In the same study, online car shoppers reported that the internet primarily drove their decision about where to purchase a vehicle 78% of the time. These figures from the Polk study exclude non-marketing sources of influence, such as word of mouth referrals. We expect the share of online automotive advertising spending to shift towards the internet’s share of consumer influence over time, representing significant future growth potential in digital automotive advertising. Given the highly episodic nature of car shopping, we believe a dealer’s ability to inform consumers about specific, frequently changing product offerings on an on-going basis is critical to attracting consumers. By 2016, Forrester Research forecasts that digital automotive advertising spending will reach $8.2 billion, representing a 20% CAGR from 2011 estimates. While consumers increasingly turn to the internet for automotive research and discovery, actual automotive commerce largely remains offline. Commerce that begins online (consumer research and discovery) generally results in an offline transaction (a car purchase at a dealership) because most consumers are unwilling or unable to finalize the purchase decision, price, trade-in value or loan terms without visiting a dealership.
98
Table of Contents
New Software Solutions Needed to Improve Dealer Efficiency
In addition, the internet has brought greater complexity, pricing transparency and competition to the dealers’ businesses, increasing the need for dealers to operate more efficiently. We believe many dealers, which often operate a high cost business model with significant fixed and variable expenses, are struggling to cope with the emergence of new technologies and the resulting changes to their business processes. Many have legacy off-the-shelf inventory management systems ill-suited to the unique nature of the evolving automotive retail industry, which provide limited access to up-to-date transaction data and inflexible tools for marketing their inventory on the internet.
In order to competitively source and price inventory, we believe dealers need current regional pricing, transaction and market supply and demand data. They also need to be able to seamlessly advertise their inventory on the internet, through their own and third-party websites, and track the performance of their advertising as it brings potential buyers into their dealerships. Once a prospect is identified, a dealer needs to manage all of its consumer interactions up to, through, and after the sale. We believe dealers will increasingly require software solutions to make their operations more efficient and effective. As more dealers recognize that the use of technology is necessary to maintain and improve their competitiveness, we believe the market for inventory management and CRM software solutions will continue to grow significantly.
Mobile Usage and Advertising Opportunities Are Increasing
IHS iSuppli estimates that there will be over one billion smartphone shipments worldwide in 2015. Moreover, growth in user downloads of mobile applications has increased dramatically, with total mobile application downloads projected to reach over 33 billion by 2014, according to IHS iSuppli. As a result, advertisers are increasingly focused on mobile applications as an opportunity to engage with consumers and influence their decision-making process in real-time. We believe dealers and other advertisers will increasingly utilize mobile applications to reach in-market car shoppers.
Our Solution
Our digital automotive marketplace has enhanced the car buying and selling process by connecting what is, based on the 2011 KS&R Study, the largest targeted audience of in-market car shoppers in the United States with what we believe is the largest base of dealers and other sellers. In-market car shoppers are those who self-identify as having a clear intention to purchase an automobile. Also, our software solutions are changing the way dealers use the power of market data, analytics and the internet to improve inventory management, achieve greater price clarity, advertise vehicles to in-market car shoppers, manage consumer relationships throughout their lifecycle and establish and maintain their own websites.
Our Freemium Philosophy
We believe our leadership position is a direct result of pioneering an innovative business model in 1998 and 1999, when we implemented what is commonly referred to today as the “freemium” model. Drawing from a large flow of wholesale vehicles from Manheim, CEI’s automobile wholesale auction division, we started AutoTrader.com with 200,000 vehicle classified listings. While dealers did not pay us to advertise these listings, they allowed us to start to attract a large audience of in-market car shoppers. By late 1999, with the help of our organically grown, dedicated, dealer sales force, AutoTrader.com grew to one million free listings. By offering dealers free listings, we were able to provide consumers with a much greater selection of cars—often multiple times greater than newspaper listings—than if we had limited our inventory by charging for listings. With the consumer audience established, we evolved our business model to meet the desire of dealers to differentiate their listings
99
Table of Contents
by offering a “pay for placement” model that delivers incremental value through prominent placement and enhanced features. The result today is a tiered “freemium” service, with over 20,000 subscribing dealers paying for featured and premium listing solutions out of our target market of approximately 45,000 dealers in the United States. In addition, we provide free standard listings to approximately 5,000 dealers, and over 400,000 private sellers paid us a fee per listing for the year ended December 31, 2011.
We have not been burdened by the need to defend a legacy print business, which allowed us to pioneer this freemium model. As a result, we were able to attract more in-market car shoppers, generating broader appeal to dealers, and thus more listings for consumers, as well as a growing base of dealer customers to which we can cross-sell our digital media and software solutions. We believe our approach of offering free listings has been a critical factor in building our value proposition and maintaining our market position.
Our Consumer Approach
Access to the Largest Selection of Unique, High-Quality Car Listings. Based on market surveys conducted by us, we believe we provide access to the largest selection of unique, high-quality car listings. By aggregating over 3.6 million daily car listings as of June 30, 2012, we help streamline the consumer’s process of deciding which car to buy and what price to pay. We believe this is the largest number of unique listings for new and used cars that consumers can access from a single source. We offer in-market car shoppers available inventory throughout the United States from our network of over 25,000 dealer relationships and from private sellers. As such, we believe consumers are able to find information on the make, model, body style and price point of cars in a specified geography more easily and quickly on our websites than through any other source. We believe our solutions reduce the stress and burden of the car shopping process by helping consumers bridge the information asymmetry gap and equipping them with the tools to make more informed decisions. Our comprehensive database provides the consumer with sophisticated research tools, which can be used to access the location and pricing of specific inventory prior to walking through a dealer’s door.
Customized and Curated Search Capabilities. Our advanced search functionality enables consumers to find the car listings that meet their specific needs and to physically locate the vehicle from a nearby dealer or private seller. Our tools increase the ease and efficiency of the consumer’s car shopping process. We also actively strive to limit the threat of fraud in our listings by monitoring and verifying our content on an on-going basis. Dealers with higher quality online content typically receive the best results in terms of interest in their listings, resulting in valuable and proprietary marketplace input for our search results. Our search tools effectively curate automotive inventory for consumers because subscribing dealers and private sellers must compete to reach our audience by paying higher fees to have their listings displayed in more prominent search result tiers.
Leading Car Content, Research and Advice. We provide consumers two complementary websites, KBB.com and AutoTrader.com, that help meet the entire spectrum of consumer needs throughout the car buying process. We believe our KBB.com and AutoTrader.com websites are leading, authoritative resources providing insight and knowledge to consumers throughout the car buying process. Through our websites, consumers can view comprehensive listings, including high-quality photos, videos and 360-degree spin views. KBB.com targets early stage car shoppers by offering in-depth reviews, comprehensive guidance on car valuation and total cost of ownership based on a proprietary database of car transactions. AutoTrader.com targets later stage car shoppers by providing consumer and expert reviews, special offers, comparison tools, extensive pricing data, dealership details and financing tools. We believe our car valuation information and listings search tools give the consumer greater confidence and trust in their interaction with dealers, OEMs and other automotive service providers. We believe this increases the consumer’s willingness to transact and
100
Table of Contents
enhances the overall strength of the retail automotive market. These tools are designed to empower consumers to make more informed car buying decisions and to lessen the perception of information asymmetry between consumers and dealers. For the six months ended June 30, 2012, the overlap of unique visitors on AutoTrader.com and KBB.com was only 2.4 million, excluding mobile visitors, or 9% of the combined average monthly unique visitors on the two websites.
Opportunity to Increase Resale Value. Through our private seller service, individuals may list used cars for sale on our websites, giving them access to what is, based on the 2011 KS&R Study, the largest targeted audience of in-market car shoppers in the United States and providing them with the opportunity to increase their sale price. Our TIM service allows consumers throughout the United States to receive instant trade-in offers redeemable at a participating local dealership, subject to verification of the vehicle’s characteristics and condition. These tools have improved the price transparency and convenience of monetizing used vehicles for consumers.
Our Dealer and Advertiser Approach
Access to a Large, Targeted Audience of In-Market Car Shoppers. Through a variety of our digital media services, dealers, OEMs and other advertisers can reach a targeted audience of approximately 60% of online in-market car shoppers in the United States, according to the 2011 KS&R Study, more efficiently than through any other online or offline media channel. Our digital media solutions help dealers reach in-market car shoppers and target those within and beyond their local area that are interested in the makes and models that they stock. Our KBB.com and AutoTrader.com websites complement each other by providing advertisers with comprehensive access across the full spectrum of in-market car shoppers: KBB.com targets early-stage, “upper-funnel” car purchasers who are conducting preliminary car and pricing research, while AutoTrader.com attracts later-stage, “lower-funnel” car purchasers who are researching specific cars to buy. We believe that our broad in-market car shopper reach also makes our digital media platform a compelling value proposition for OEMs, most of which advertised on our websites in 2011. With over 400,000 advertisers across our properties, including most major OEMs, our subscribers, dealers and private sellers, we believe we have one of the largest collection of paying automotive advertisers online.
Superior Automotive Advertising ROI. We offer dealers, OEMs and other advertisers more efficient marketing solutions compared to traditional media, such as television, radio and print. Traditional media delivers impressions to people who have varying levels of interest in their automobiles, including many people who are not interested in purchasing a car at that time. In contrast, our consumer search function identifies consumer interest by location and preference of make, model, body style and price point. Consequently, we are able to match in-market car shoppers with advertising and listings on a highly specific basis and increase the overall likelihood that an advertisement or listing will influence a consumer’s purchasing decision, allowing dealers, OEMs and other advertisers to aim their spending at consumers they particularly want to influence. As a result, we believe dealers, OEMs and other advertisers can invest their marketing budgets more efficiently and effectively with us. We also believe our dealer customers’ perception of the value of our digital media solutions is reflected in our low dealer churn. We estimate that classifieds and advertising across our digital properties represent an effective CPM when compared to television and newspaper advertisements, because television and newspaper advertisements are aimed toward a mass market.
Critical Software Solutions that Increase Dealer Efficiency. We believe our solutions are integral to many aspects of a dealer’s retail operations. Our software solutions help dealers optimize their inventory and enhance their profitability. Under our vAuto and VinSolutions brands, we offer dealers pricing, sourcing, appraising, inventory management, CRM and digital media solutions that allow them to more efficiently manage their businesses. These solutions provide a broad range of features and data analytic tools and services enabling dealers to effectively select and price inventory, automatically
101
Table of Contents
create online listings from basic inventory data and manage their own websites, as well as their presence on other websites and platforms. We believe our solutions are integral to many aspects of the dealer’s retail operations. For example, we believe that the average used car inventory turnover for the top quartile of vAuto subscribing dealers is 22 days, compared to 45 days for the average dealer, as reported by CNW. This increased turnover can result in a much higher total gross profit for our dealer customers. Dealers can subscribe to our comprehensive software solutions or à la carte solutions targeting only their current needs. We believe our scale, established track record and reputation for operational stability provide critical competitive benefits as dealers select vendors to entrust with these valuable solutions. As of June 30, 2012, of the over 20,000 subscribing dealers in our Digital Media business, 22% also subscribed to our software solutions.
Consultative Performance Management. Our dealer sales force lives by the motto, “We Work For You.” We believe our dealer sales force of over 1,400 sales and support professionals is the largest in the U.S. retail automotive industry. Our dealer sales force helps dealers implement our solutions and continue to adapt their usage according to their evolving needs. We offer our dealer customers on-going consultation to assist them in effectively utilizing and maximizing the value of our digital media and software solutions. Through our tools, analytics and highly trained, consultative sales and customer service professionals, we assist dealers in analyzing their businesses on a granular level, charting inventory turnover and pricing relative to other dealers in their region. We research, analyze, advertise and innovate on behalf of our dealer customers. We believe that the technology and marketing techniques necessary to effectively manage a dealership are rapidly evolving and that many dealerships do not have the scale or infrastructure to develop their own tools to compete effectively. We provide each dealer customer with the technology and consultative resources to better manage its business by maximizing the use of our innovative solutions.
Dealer Customer Case Studies
Capitol Auto Group, Salem, Oregon
Capitol Auto Group first became our customer by subscribing to AutoTrader.com’s Featured tier used car listings. In its first full year as a customer, Capital Auto’s average monthly payment to us was approximately $1,400. In April 2010, Capital Auto Group upgraded to a Premium tier subscription. The dealership quickly saw walk-ins and sales increase dramatically from the prior year. As a result, Capital Auto Group continues to be a Premium tier subscriber and has added on multiple other AutoTrader.com and Kelley Blue Book digital media services, paying $10,495 per month on average in 2011—more than seven times the average monthly payments in its first year as a customer.
“AutoTrader is a dealer’s GPS. It is guiding us for the 21st century, where to go and how to get there. The customers that are going to AutoTrader are looking for a car. When we increased from the Featured to the Premium listing, we saw a vast increase of traffic to our sites. I could take [AutoTrader dealer] reports and see a huge surge in numbers. I could look at our sales from the last six months and say, ‘AutoTrader has increased our sales.’ It all amounts to, ‘Did I sell cars?’ I DID sell cars.”
- Carrie Casebeer, Owner, Capitol Auto Group
Kelly Ford, Melbourne, Florida
Kelly Ford first became our customer by subscribing to the Featured tier used car listings package, and was paying $2,700 per month for this service at the end of 2011. In February 2012, Kelly Ford upgraded from the Featured tier used car listings package to the Premium tier used and new car listings package. Kelly Ford’s monthly payments to us increased to $6,975—over twice their monthly
102
Table of Contents
payments at the end of 2011—and in March 2012 Kelly Ford experienced its best sales month ever with over 200 new and used cars sold. Year to date, Kelly Ford’s net profit is up 27% and retail sales are up over 18%. They continue to be a Premium tier subscriber.
“Our General Manager Glenn said he was surprised how much impact AutoTrader.com made in such a short period of time and has rarely seen any other type of advertising work so well…so fast.”
- Chris Saraceno, Vice President, Kelly Automotive Group
Our Strengths
Strong, Recognizable Brands. Our unique portfolio of brands includes AutoTrader.com (“The Ultimate Automotive Marketplace”), Kelley Blue Book (“The Trusted Resource”) and vAuto, among others. Since our inception, we have spent over $840 million on marketing initiatives to establish and secure our brand leadership. We have also begun to expand our marketing initiatives for our newly acquired brands. For example, we recently launched a broad campaign to enhance the Kelley Blue Book brand. We promote our AutoTrader.com brand across all media platforms, with major campaigns in television, online and print media, paired with a prominent presence at professional sporting events and consumer auto shows in major markets. We believe our long-term strategic investment in our brands has created a strong competitive advantage. The brand strength of AutoTrader.com and Kelley Blue Book is evidenced by the fact that approximately 70% of our traffic to both websites was sourced through direct navigation and search, as of November 2011. Individually, ATC and KBB each achieve 76% total awareness among new and used car shoppers, with ATC and KBB claiming a distinct advantage over their closest direct competitors, according to the 2011 KS&R Study. Further, Kelley Blue Book is the most trusted brand of its nearest competitors based on a Millward Brown Brand study we commissioned in 2011. Dealers also demonstrate an overwhelming loyalty to the AutoTrader.com brand, with high brand bonding results, according to a Millward Brown Brand study conducted in 2011.
The Largest Targeted Audience. Our AutoTrader.com and Kelley Blue Book websites draw the largest targeted audience of in-market car shoppers in the United States, based on the 2011 KS&R Study. As of June 30, 2012, we had over 3.6 million daily car listings and, for the six months ended June 30, 2012, over 28 million average monthly unique visitors that were unduplicated between AutoTrader.com and KBB.com. We reach approximately 60% of online in-market car shoppers in the United States, based on the 2011 KS&R Study, and provide the most comprehensive and accessible collection of automobile listings, content, information and targeted advertisements.
Large Consultative Dealer Sales Force. Our dealer sales force sells our digital media services and software solutions through long standing relationships and in-person consultations. We believe our dealer sales force of over 1,400 sales and support professionals provides us with a strong competitive advantage. We have built our sales force over the past 14 years both organically and through our acquisitions and have deeply ingrained our culture of client dedication into each professional. A structured training program equips each professional with the technical training and skills needed to provide consultative advice and sales service to our clients and includes education on our services, the retail automotive industry, dealer best practices and communication of our value proposition. Our professionals not only provide dealers with assistance installing and learning how to use our services, but also continuously consult with them on industry insights, analytics, performance metrics and advertising campaigns. We believe our track record of helping dealers understand and utilize new services has built dealer loyalty to our solutions and driven the growth of our business.
Innovative Analytics Capabilities. We provide our subscribing dealers with an end-to-end view of the consumer car shopping experience through our proprietary market data on our branded AutoTrader.com
103
Table of Contents
and KBB.com websites, as well as on the dealer websites and CRM software managed through our Software Solutions business. Kelley Blue Book, for example, amasses and analyzes data on a large number of new and used vehicle observations from over 800 distinct industry and proprietary sources, which power its proprietary market pricing algorithms and reports. This proprietary set of consumer demand data enables us to help dealers monitor current trends and forecast demand in order to better inform inventory purchases and pricing. In leading the shift from contextual advertising to behaviorally-targeted marketing, we enable advertisers to deliver the right message to the right buyer at the right moment, which we believe results in greater advertising efficiency and effectiveness.
Broad Platform with Significant Network Effects. Our industry position has created a platform that allows us to serve a broad range of the retail automotive industry’s needs, from classified listings to national brand marketing to a comprehensive suite of digital marketing and software solutions for dealers. We serve both sides of the automotive retail market: in-market car shoppers and dealers, each of which relies on our data and information. We also provide software solutions, as well as an opportunity for dealers to efficiently deploy advertising spending to highly coveted in-market car shoppers with returns that surpass traditional media. Our ability to drive advertising and software product adoption across our dealer customer base has delivered consistent increases in customer spending with Digital Media MRR growing to $3,001 in 2011, representing 15% growth from 2010. Over time, our dealer customers have subscribed to more of our services, either by upgrading to premium listing tiers or purchasing à la carte enhancement services (or both), as they experience the efficacy of our solutions. Additionally, we benefit from network effects as each additional listing and each additional consumer increases the utility of our solutions for dealers, advertisers and consumers. The scale of our consumer base, the number of dealers and advertisers that use our solutions, and the deep and accurate information generated by our consumers, dealers and other automotive-related advertisers create significant value for all participants.
Recurring, Diversified Revenue Model. Our recurring subscription revenue model provides high visibility into our on-going revenue streams. Although the terms of our digital media and software solutions subscription agreements are generally 30 days, as a result of our high renewal rates, we have a high level of recurring revenues. In 2011 and the six months ended June 30, 2012, approximately 76% and 79% respectively, of our revenues were recurring revenues, i.e. revenues from existing subscription billing relationships with our dealer customers. We believe our value proposition to dealers along with our increasingly diversified sources of revenue support long-term sustainability and resiliency, even during economic downturns. For example, in 2009, U.S. vehicle sales declined by 6.4% and the overall automotive advertising market declined by 29%, according to LMC Automotive and Forrester Research, respectively. During the same period, however, our Digital Media MRR grew by 3.2% in 2008 and 7.4% in 2009 as dealers allocated more of their marketing budgets to digital advertising and away from traditional media. We believe this experience illustrates the value our digital media solutions provide to our dealer customers.
Rapid Revenue Growth with Significant Operating Leverage. As a digital pioneer and market leader, we have experienced rapid organic revenue growth as dealers and other advertisers have steadily migrated their advertising spending to digital media platforms. In addition, we have also increased revenues through our recent acquisitions. Our operating expenses have grown at a lower rate than our revenues as we are able to leverage our operations, sales and marketing and technology over a broader revenue base. This operating leverage has helped drive growth in Adjusted EBITDA margins as revenues have scaled. Our revenues, Adjusted EBITDA and net income grew from $629.5 million, $155.5 million and $9.9 million, respectively, in 2009, to $1.0 billion, $334.6 million and $68.1 million, respectively, in 2011. At the same time, our Adjusted EBITDA margin and net income margin in 2011 were 33% and 7%, respectively, up from 25% and 2%, respectively, in 2009.
104
Table of Contents
Visionary Management Team. We are led by a talented, experienced and deep management team that grew us from the start-up stage into our current position as the largest digital automotive marketplace and a leading provider of marketing and software solutions to automotive dealers in the United States. The members of our management team have an average of nearly 20 years of experience in the media and automotive industries. Our executives have demonstrated the ability not only to successfully realize the potential of AutoTrader.com, but also to further enhance our financial performance through the launch, acquisition and integration of brand extensions and new solutions, including our acquisition of Kelley Blue Book. Our management team is committed to continuing to develop innovative digital media and software solutions that can address the many information and technology inefficiencies that still exist in the automobile sales process and create new profit opportunities.
Growth Strategy
We intend to grow our platform and business by focusing on our mission and executing on the following key growth strategies:
Increase Share of Existing Dealer Customer Marketing Spending. We intend to increase the share of marketing spending we receive from our existing base of over 25,000 dealer relationships by helping them adopt additional marketing solutions. Through our consultative sales approach and on-going development of new solutions, we strive to help our dealer customers realize the value of our premium listing packages and increase adoption of our add-on and recently launched services, such as Alpha, Spotlight and TIM. We also believe we have a significant opportunity in the new car advertising market. Of our approximately 12,000 franchise dealer customers in 2011, only 33% subscribed to our paid new car listings services, representing approximately 4,000 subscribers. We estimate spending on AutoTrader.com by franchise dealers represented less than 1% of the total advertising budgets of the 17,700 total franchise dealers estimated to exist by NADA. Due to the large audience of in-market new car shoppers on AutoTrader.com and KBB.com, we believe new car advertising represents a substantial growth opportunity, particularly with our franchise dealer customers. In 2011, our penetration of our subscribing dealers for our TIM and KBB classified services was lower than our penetration of our subscribing dealers for our new car listing services, providing significant opportunity for growth.
Cross-Sell Our Software Solutions to Our Customer Base of Subscribing Dealers. We started our Software Solutions business less than two years ago through a series of acquisitions, and we believe there is a substantial opportunity to provide our software solutions to our subscribing dealer customer base and to develop and market new software solutions. As of June 30, 2012, only approximately 5,500 of our over 21,000 subscribing dealers subscribed to our recently acquired vAuto, VinSolutions and HomeNet software solutions or to more than one of our software solutions. We intend to utilize our existing dealer sales force, long-standing customer relationships and consultative sales approach to help our dealers recognize the value of our software solutions in order to expand the percentage of subscribing dealers using our software solutions, and to increase our Software Solutions MRR.
Develop New Services for Consumers, Dealers and Advertisers. We intimately understand the car sales process and dealer operations and have continuously leveraged this expertise to develop and launch new services. We are also integrating social media capabilities into our digital media solutions to allow us, our dealers and brand advertisers to reach our consumers in new ways. Our proprietary data, analytic tools and market insights allow us to develop new digital media services that create refined personalization tools for consumers, and help our dealer and advertiser customers maximize the impact of their digital and mobile advertising spending, including through enhanced targeting capabilities and the offering of new marketing solutions. We also intend to enhance the features and functionality of our software solutions to better address the evolving inventory, CRM and
105
Table of Contents
marketing management needs of dealers. For example, in 2011, vAuto launched a used car stocking solution that provides dealers with current, local market-specific inventory and pricing information to optimize their used car inventory mix, and VinSolutions recently developed a CRM solution to help dealers effectively service cars after they are sold.
Increase Mobile Solutions. We believe mobile devices broaden the access to our dealers’ listings while providing in-market car shoppers with current, location-specific information that facilitates their decision-making process. Our mobile applications provide in-market car shoppers with mobile access to the information and resources of AutoTrader.com and KBB.com and through our personalization features, consumers can conveniently reference searches and research that they conducted previously on our websites. Our websites and mobile services are highly complementary for our dealers, as their subscriptions ensure that their inventory is searchable by consumers when they research cars online on their computer and when they are on the dealer lot with a mobile device. We believe mobile engagement with this highly-targeted, “on-the-lot” audience enhances the value proposition for our dealer customers. In addition, as dealers increase their use of mobile devices in the management of their business, they are seeking to access their technology and software solutions through those mobile devices. We provide our mobile applications as part of our digital media services to dealers. We do not currently charge for these applications separately but provide them to enhance our digital media solutions. We are also continuing to develop mobile websites and mobile applications for our inventory management and CRM software solutions, which we may provide to dealers for an additional charge in the future.
Increase Brand Advertising and Grow Our Traffic. Increasing the awareness among consumers, dealers and brand advertisers of our AutoTrader.com, Kelley Blue Book, vAuto, VinSolutions and HomeNet brands is critical to expanding in-market consumer traffic to AutoTrader.com and KBB.com and mobile applications and developing our Software Solutions business. Higher traffic increases the attractiveness of our Digital Media properties to dealers and other advertisers seeking to reach our audience. Since our inception, we have made a substantial investment of over $840 million on marketing initiatives, including television and radio advertising, high visibility sports programming sponsorships, print and online and search engine advertising and automotive trade show participation. We initially focused our marketing efforts on the AutoTrader.com brand, but we have begun to expand our newly acquired brands, including a broad campaign to enhance the Kelley Blue Book brand. In addition, we are increasing the brand marketing of our vAuto, VinSolutions and HomeNet software solutions to dealers through advertising in trade publications and a presence at industry events to enhance awareness of these brands.
Increase Penetration of the Dealer Market. In 2011, over 20,000 dealers, out of our target market of approximately 45,000 dealers in the United States, subscribed to one or more of our solutions. We believe that there is a substantial opportunity to further penetrate the U.S. dealer market across our Digital Media and Software Solutions businesses. We initially focused on acquiring franchise dealer and larger independent dealership customers, where we have a paying relationships with approximately 12,000 franchise dealers out of 17,700 total estimated franchise dealers, according to the NADA. In addition to increasing the penetration of franchise dealers, there also is an opportunity to further penetrate independent dealers. With approximately 28,000 independent dealers in the United States, according to our estimates, there is an opportunity to convert the approximately 20,000 independent dealers who were not customers as of June 30, 2012. Smaller independent dealers have more limited overall marketing and operating budgets, but they represent a significant opportunity for additional revenue growth. We are currently creating services and a specialized in-house sales force to specifically work with the smaller independent dealer market. We continue to add new dealer customers across our businesses and believe that the continued expansion of our dealer customer base will contribute to our overall growth.
106
Table of Contents
Expand Into New Markets. We believe that there are significant opportunities to expand into adjacent markets in the automotive industry, offer our existing services in select new geographic markets and to potentially enter into new industry verticals. There are a number of international retail automotive markets, such as Canada, that have characteristics that are similar to the U.S. market, primarily strong consumer internet usage and substantial dealer competition, where we believe our solutions can provide key differentiation and enhanced dealer profitability. We are exploring opportunities to expand into other countries on a selected basis through joint ventures and acquisitions. For example, we currently operate a joint venture in Canada in which we market our vAuto software solutions. In addition, there are aspects of the retail automotive industry and dealer operations that we either serve only on a limited basis or do not yet serve at all, including automotive finance, insurance, service and repair and parts acquisition and management. We believe our expertise in dealer operations and the retail automotive industry, and our ability to manage data and develop technological solutions, can be leveraged to address other aspects of the automotive industry. In addition, we are exploring expanding our digital media solutions to address other vehicle types, such as heavy trucks. Further, we believe that our business model and digital media experience can be applied to other industry verticals with attributes that are similar to the retail automotive market, specifically, consumer driven services with high relative price points and a broad range of sellers, and we may seek to opportunistically enter into new industry verticals in the future. Our expansion strategy also includes exploring acquisitions, partnerships, strategic investments and joint ventures. We believe that our leadership position enhances our ability to evaluate such opportunities on an on-going basis.
Our Services
Digital Media
Consumers
We aggregate what we believe is the largest selection of unique new and used car listings for consumers to view, with over 3.6 million daily listings, as of June 30, 2012, from our network of over 25,000 dealer relationships throughout all 50 states. We offer consumers customizable search and comparison tools to access detailed descriptions of cars with photos, videos and reviews across multiple platforms, including mobile.
Our properties, including KBB.com and AutoTrader.com, feature valuable content on car features, valuation and reviews. Kelley Blue Book offers comprehensive consumer valuation tools for consumers with access to recent transaction and pricing information in regions across the country. On KBB.com, consumers are provided with comprehensive guidance on car valuation, and can configure and compare new and used vehicles and obtain proprietary valuation estimates for buying or selling a new or used vehicle, including total cost of ownership. In addition, consumers can read in-depth vehicle reviews and information and engage in connection tools, including chat, email, dealer contact information, vehicle history reports, insurance options and finance options. On AutoTrader.com, we offer consumers an extensive set of listings, many of which include premium features such as photos and videos, and specialized search functionality to find the exact new or used vehicle they would like to purchase. We offer TIM through both of these websites. Through these tools and content, we believe we provide consumers with all the information necessary to make a car purchasing decision with confidence.
In addition to automobile listings and content, we also offer consumers the following tools across all of our digital media properties:
Trade-In Marketplace (TIM). We offer consumers the ability to trade-in or sell their car to a dealer through an instant trade-in offer pricing program. By filling out a form on our website with details about
107
Table of Contents
their car, a consumer can receive an instant trade-in offer, sight unseen, that is immediately redeemable at a participating local dealer. After verification of the information provided, the consumer can receive cash for their car or use the proceeds of the trade-in to offset the cost of purchasing another vehicle. Dealers are also able to place an application containing the TIM tool on their own websites so that they can provide consumers a transparent third-party basis for valuing their trade-in that is easily activated.
Mobile Applications. We have developed innovative mobile applications for the iPhone and Android devices to allow consumers to take the AutoTrader.com web experience on the road with them. We expect our new car tablet application, currently under development, will allow consumers to select car attributes and offer a connection to participating local dealer where cars that meet a consumer’s exact specifications are available for sale based on our inventory data, which is updated multiple times each day.
Private Seller. We offer consumers looking to sell their used vehicle the ability to reach our large targeted audience of in-market car shoppers. A consumer can purchase different service levels on AutoTrader.com with different lengths of run, photo and video options and page placement.
Ancillary Offerings. Through a third party, we offer a tool on our websites that enables consumers to submit personal financial information to receive personalized loan offers from several lenders. We also facilitate a consumer’s search for car insurance by connecting them with insurance providers in their local area.
Dealers
Classified Listings Subscriptions. We offer online classified listing placements on both AutoTrader.com and KBB.com. We sell these listings as monthly, recurring subscriptions to independent and franchise dealers for both new and used cars. We employ a “pay for placement” model that allows subscribing dealers to achieve higher placement of their listings on our search results page. There are several tiers of listings for a subscribing dealer, including standard, featured and premium. The higher priced listing packages offer higher listings placement and more listings features, including vehicle photos, a secure credit application, a link back to the dealer’s website, video capability and bundled display add-ons such as our Alpha and Spotlight services. We estimate that premium listings, which populate the higher and more visible section of the page, typically generate two to three times as much vehicle exposure and consumer responses as featured listings, which in turn are typically eight to nine times more effective than our free standard listings.
À la Carte Enhancement Advertising Services. We offer additional features for classified listings that can be purchased on an on-going or episodic basis, including Alpha and Spotlight placements. These are prominently visible interactive advertising positions across the top of a search results page and allow consumers to view multiple cars in the advertising dealer’s inventory. Our Alpha service allows a dealer to purchase the top advertisement spot on a search results page; it is an interactive advertisement which allows the consumer to view multiple cars in that dealer’s inventory and these placements are sold by local region (zip code) so that consumers only see Alpha advertisers in their vicinity, allowing the advertising dealer to dominate the page. Spotlight placements are located below Alpha services and above all other search results and these listings are presented to consumers on our search results page based on their desired search radius.
Trade-In Marketplace (TIM). We offer dealers the ability to purchase our TIM service to help drive dealership traffic and procure used car inventory. Dealers pay subscription fees to receive opportunities to fulfill trade-in offers provided to consumers who utilize TIM through AutoTrader.com,
108
Table of Contents
KBB.com and dealers’ own websites. Consumers fill out a detailed description of their trade-in vehicle using our TIM tool. We then deliver the consumer an instant trade-in offer for their vehicle, which is valid for 72 hours, to redeem via trade-in or outright sale. Consumers can then bring their vehicle into a participating local dealership for a confirmation inspection and automatic purchase by the participating dealership. The dealership provides the consumer with cash for their car or the ability to use the proceeds to offset the cost of purchasing a new or used vehicle from the dealer. The dealer can then decide whether to keep the car for their own inventory or sell the car to our partner in the TIM service. This partner, one of the leading wholesale purchasers of used cars, provides the TIM pricing and backstops the TIM purchase offer. We do not purchase any cars through TIM.
Mobile Applications. We offer dealers mobile inventory applications, including VIN scanners and iPhone applications, which help dealers manage their inventory straight from the lot and automatically upload car information online.
Advertisers
We provide a variety of digital display advertising formats on AutoTrader.com and KBB.com to OEMs, dealer associations, industry groups and other brand advertisers to reach in-market car shoppers. Our most popular digital display advertisements are banners, which are placed at the top, bottom or middle of a page, as well as tower advertisements placed alongside a page. We charge for these advertisements based on the number of times the advertisement is displayed, or based on a fixed amount for a campaign. In some cases, display advertising is sold to dealers as a bundle with our listing subscriptions. Advertisement rates vary depending upon the web pages upon which the advertisements are placed, the geographic regions targeted, the amount of advertising purchased and the length of time the advertisement runs on our websites. We sell to advertisers targeting specific geographic regions or to brand advertisers aiming to reach a national audience. Advertising placements on AutoTrader.com and KBB.com can be targeted based on the consumer’s geographic location and the year, make and model of the car that the consumer is searching for.
109
Table of Contents
AutoTrader.com Home Page during an “Overdrive” OEM Sponsorship
On our AutoTrader.com home page, consumers can type in their zip code and make of interest to search for dealers and cars in their area. They can also find car reviews, automotive research and information on trading in their current car. We recently released our “Overdrive” advertising service, in which an OEM can prominently advertise on the AutoTrader.com home page. The “Overdrive” sponsorship is especially beneficial when OEMs are introducing a new or redesigned model, as the Sonic is below.

110
Table of Contents
AutoTrader.com Search Results Page
Once consumers have entered their search criteria, they are taken to vehicle listings that match the search, such as this consumer’s search for a new or used Ford Explorer. Our Alpha and Spotlight advertisements are at the top of the page, followed by dealers subscribing to our Premium listings package, then Featured, then Standard. Premium listings include a description, photos, video, dealer contact information and a link to the dealer’s website.
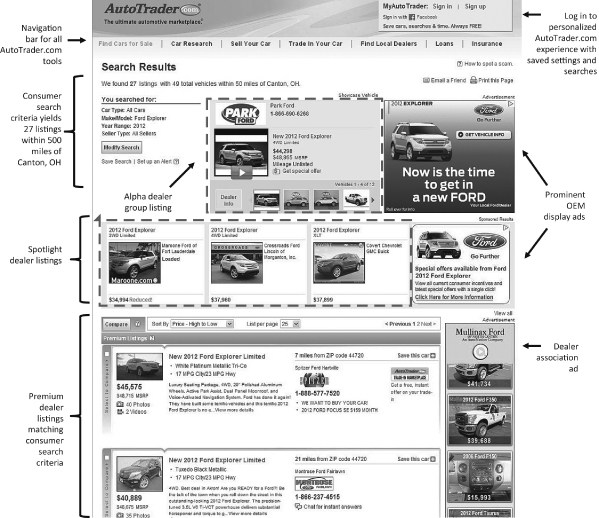
111
Table of Contents
AutoTrader.com Vehicle Display Page
Once a consumer clicks on a listing, such as this used 2012 Ford Explorer, they can see an updated listing price, detailed dealer contact information, more photos, video and descriptive information, and a form to fill out to contact the dealer.
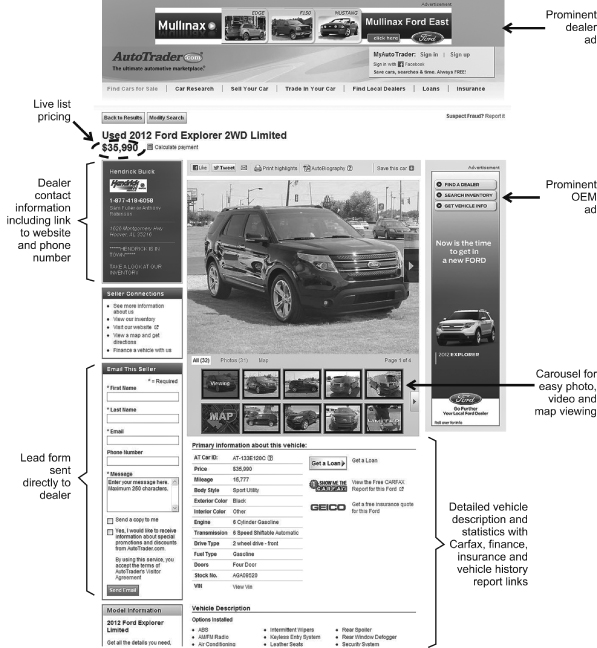
112
Table of Contents
Kelley Blue Book Home Page
Our KBB.com home page contains original editorial content on new and used cars, as well as Kelley Blue Book’s proprietary fair purchase price information. Consumers can search for a particular make or model to learn about its value and nearby listings.
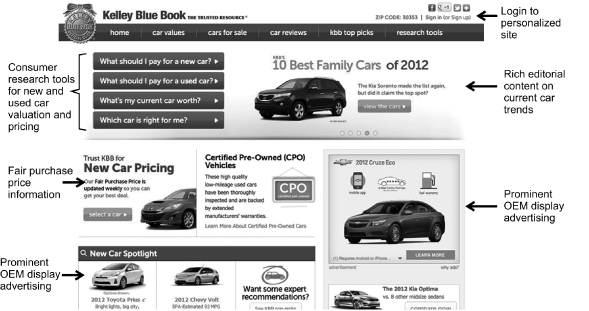
113
Table of Contents
Kelley Blue Book Used Car Valuation Information Page
Once a consumer has entered their search criteria, they are taken to the vehicle that matches the search, such as this used 2012 Ford Explorer. The consumer can see the Kelley Blue Book suggested price, read further reviews and research on that particular make and model, find nearby listings and enter their own vehicle’s VIN to determine their own car’s value.
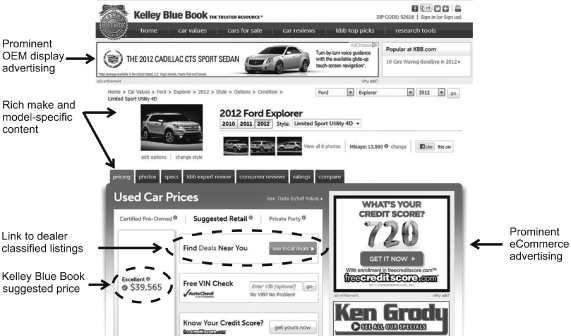
Digital Media Mobile Applications
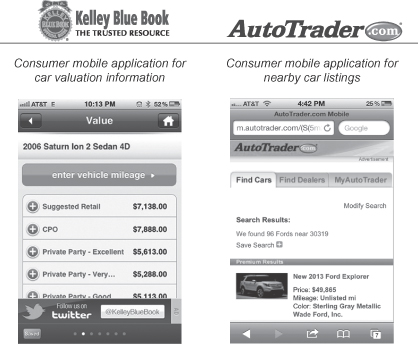
114
Table of Contents
Software Solutions
We also offer dealers sophisticated software solutions for procuring, pricing, managing and marketing their inventory of cars, all through a single sign-on. Through monthly subscription software services marketed under the vAuto, VinSolutions and HomeNet brands, we provide dealers easy-to-use tools with clear reports to understand the performance of their sales and marketing strategies. Our comprehensive software solutions enable dealers to efficiently create and distribute their listings, track current consumer demand, inform their inventory purchasing and pricing decisions and help dealers manage the sales process from lead to after close. Throughout each step of the process, our consultative sales and customer service professionals ensure that dealer customers are using these tools effectively.
Inventory Management Subscriptions. Through our premium desktop inventory management software, dealers can search sources for inventory procurement and evaluate what vehicle to purchase at what price. Our software can auto-populate a list of recommendations of what car to purchase based on our data and suggest wholesale auctions where the dealer will be able to find these vehicles. For each suggested vehicle, dealers can also view an acquisition strategy report and access a built-in dealer vehicle history report, which allows dealers to understand their expected profit and days to sale prior to ever acquiring the vehicle.
Our software solutions also provide dealers with valuable data analytic tools to set pricing and selling strategies. Our analytics and software tools leverage a proprietary nationwide pricing database of over 2.3 million vehicles. Once dealers have set prices for their inventory, our software also enables them to automatically upload their inventory data to their own and third-party websites to advertise to consumers. We sell these solutions to dealers through monthly, recurring subscriptions with additional add-on services and an initial setup fee.
vAuto Inventory Pricing Page
Through vAuto’s “Vehicle Gauge” tool, a dealer can view the market dynamics, including pricing and market days supply, such as for this 2008 Dodge Caliber SE, in order to decide how and where to price it for sale.
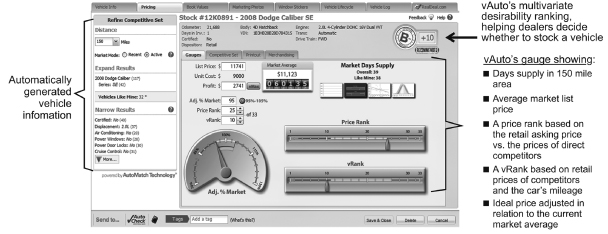
115
Table of Contents
vAuto Mobile Application For Dealers
Dealer mobile application for inventory pricing
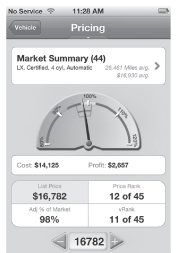
Integrated CRM Subscriptions. We provide dealers with a one-stop, web-based integrated platform for CRM, lead generation and tracking and marketing. In certain circumstances, our customers have reported that our coordinated services replaced up to ten other competitive services with one comprehensive solution which helps dealers set up a custom website and gather and track leads from third-party and dealer websites. With our solutions, the dealer’s website is optimized for search engine optimization, or SEO, and features video uploading capability and video SEO. Dealers can generate leads automatically for their website and third-party websites and manage leads through live chatting, texting and a business development center. It also provides comprehensive CRM tools to track sales through a mobile platform and provides historical sales reports analyzing campaign success. We also help dealers quickly and easily convert raw automotive data into display advertisements that can be automatically posted to the dealer’s website, third-party websites, OEM websites and online classified listings. We sell these solutions to dealers through monthly and multi-month recurring subscriptions with additional add-on services and an initial setup fee.
Our suite of software solutions enhances dealers’ effectiveness on AutoTrader.com, helping them determine which product to stock, how to price it and how to manage the sales process from lead until after close.
116
Table of Contents
VinSolutions’ CRM Dashboard
Through VinSolutions’ CRM dashboard, a dealer can see a comprehensive view of its current phone, internet and walk-in leads, including the pipeline by salesperson and feedback on how various advertising formats are performing.
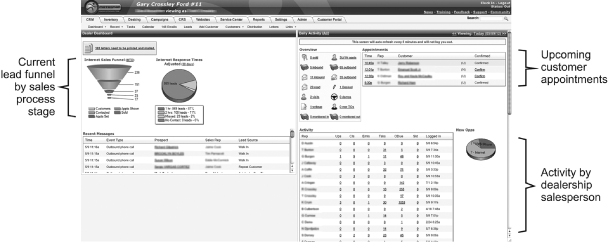
Competition
Within our Digital Media business, we compete for consumer traffic with traditional offline classifieds, on- and offline advertising media and online providers of automobile information on the basis of a number of factors, including the depth, breadth and reliability of listings and the utility of our consumer shopping and search experience. Our competitors for share of dealer marketing spending include the following types of businesses:
| Ÿ | Offline. We compete with offline media companies and service providers who have existing advertising relationships with dealers. Services provided by competitors range from direct mail campaigns to classified listings in local newspapers and display advertising in magazines, television and radio. |
| Ÿ | Online. Competition in the online classifieds business is generally directed at growing unique visitors and dealer customers to enhance the value proposition to both sides. We compete with other online automotive classified websites including Cars.com, Edmunds.com, eBay Motors and Craigslist, as well as emerging transaction and “fair-price” based platforms like TrueCar.com. We also compete with various dealer network lead generation websites, broad-based consumer review and pricing data websites, search engines utilizing cost-per-click advertising and online pay-per-sale automotive marketplaces. |
We compete for brand advertising revenues across the broad categories of classified marketplaces, pay-per-sale marketplaces, general automotive content and multi-vertical content, both in traditional media and in the rapidly growing market for online automotive information.
Within our Software Solutions business, we compete for software solutions across both automotive-focused software suppliers and broad CRM and inventory management providers. This competition includes the following:
| Ÿ | dealer web and marketing firms, such as Dealer.com, ClickMotive, and Cobalt; |
| Ÿ | inventory management and price analytics providers, such as DealerTrack AAX, and FirstLook; |
117
Table of Contents
| Ÿ | CRM software solutions providers, such as, DealerSocket and Autobase; and |
| Ÿ | dealership management solutions providers, such as Reynolds & Reynolds, ADP, and DealerTrack. |
We believe that we compete favorably in both the automobile advertising market and software solutions market, as none of our competitors offer the breadth of dealer services and consumer tools that we do. We plan to continue to distinguish ourselves from the competition through our product innovation, customer service and scale of our offerings. We also continue to evaluate potential acquisition opportunities that would complement our existing properties.
We compete on the basis of the following factors:
| Ÿ | access to in-market car shoppers; |
| Ÿ | breadth of features offered by our solutions; |
| Ÿ | performance and reliability; |
| Ÿ | sales performance; |
| Ÿ | customer service; |
| Ÿ | brand recognition; |
| Ÿ | the success of our marketing programs; and |
| Ÿ | price. |
Sales
Dealer Sales. We have succeeded in large part by building what we believe is the largest dealer sales force in the country. Our over 1,400 highly trained, consultative sales and customer service professionals meet regularly with our dealer customers to review their performance and to optimize their presence on our websites and use of our software solutions. Our dealer sales force also helps grow our base of dealer customers by marketing our services to new potential customers. In addition to our in-the-field sales team of over 900, we also have 400 employees who provide customer service support to our dealer customers. Additionally, we have over 50 specialized performance managers who support the dealer’s sales team’s analysis of how well the dealer is utilizing our services.
Our dealer sales force, along with our customer care professionals, proactively reach out to dealer customers to review the impact of our services; we provide our dealer customers with detailed data and analytic reports that, for example, help them understand the effectiveness of their classifieds listings when compared to other dealers in their market and around the country. The sales team uses this data to help customize the use of their services and identify additional services that can benefit them. On average, members of our team contact each dealer customer approximately twice per month.
We have built a highly valuable asset of over 21,000 subscribing dealers over the past 14 years and many of these dealers have been subscribing to our digital media solutions for years. On average in 2011, we maintained a monthly subscribing dealer churn rate of less than 2% and a monthly revenue churn rate of less than 1% for AutoTrader.com subscribing dealers. We believe the relationships that dealers have with our sales executives and the success that they have experienced with our services provides a word-of-mouth referral network that has powered the growth of our dealer customer base and the growth of our premium listing packages. The average tenure of our sales team is four years; we work hard to maintain our long-term, privileged relationships with our subscribing dealers.
118
Table of Contents
With our expansion into software services, our dealer sales force has been complemented by the sales teams at each of our acquired businesses. These teams have helped our dealer sales force augment its portfolio of marketing solutions with valuable software solutions. We believe the coordination and integration of our sales efforts across our dealer-facing businesses represents a tremendous opportunity to drive further adoption of our software solutions.
Brand Advertising Sales. We have a sales team of over 50 people who work closely with our OEMs, dealer associations, industry groups and other brand advertiser customers. This team sells and services a wide range of targeted advertising campaigns on AutoTrader.com and KBB.com. This team also services all of the leading automotive OEM brands and applies a consultative selling approach to help these advertisers best target consumers across our websites.
Marketing
We believe the strength of our brands represents a distinct competitive advantage, including AutoTrader.com (“The Ultimate Automotive Marketplace”) and Kelley Blue Book (“The Trusted Resource”). We make a sustained, strategic investment in our brands to ensure that we maintain our brand leadership. In 2011 and the six months ended June 30, 2012, we spent approximately $111 million and $62 million, respectively, on marketing initiatives across all forms of media, and since our inception have spent over $840 million on marketing initiatives to market our brands. Historically, these initiatives supported only AutoTrader.com, but we have begun targeting all of our brands, including a campaign to enhance the Kelley Blue Book brand. We promote our AutoTrader.com and Kelley Blue Book brands across all media platforms, with major campaigns in television and online.
Our long-term investment in building our brands has resulted in strong consumer awareness, according to the 2011 KS&R Study. The AutoTrader.com brand has the highest unaided consumer brand awareness in the category, reinforced by the fact that 70% of traffic comes to the site through organic search and direct navigation. After acquiring Kelley Blue Book, we initiated a national television campaign for the first time in its history as we seek to reinforce and grow its place in the car shopper’s mind as a valuable resource for vehicle valuation advice.
We have partnered with some of the world’s best-known brands and media outlets to reach a broad targeted audience, including viewers of the National Football League, National Basketball Association, National Hockey League and Major League Baseball, and we also have long-term relationships with A&E, CBS, ESPN, Fox, TNT and Lifetime. In the 2011-12 Season, we were the official marketing partner of the NBA. The success of our marketing campaigns directly benefits our dealer customers by driving greater consumer traffic to our websites. We believe our dealer customers see their investments in us reinvested in them via our high-profile television marketing campaigns and sponsorship programs.
Technology
We continually develop our technology platform, which provides the consumer-facing services and tools across our websites and mobile applications as well as the tools and infrastructure to help our dealer customers manage their services through our software solutions. We recently completed a technology overhaul of our AutoTrader.com and KBB.com websites and updated our billing, sales tools, finance, CRM and data collection capabilities. AutoTrader.com has a best-in-class uptime ratings, according to Keynote Systems, Inc., allowing us to provide highly reliable service to the dealers, consumers and brand advertisers that depend on us. New advertisements and classified listings can be uploaded quickly, ensuring that consumers are accessing current marketplace pricing and availability data.
119
Table of Contents
We believe our technology infrastructure is highly scalable, allowing us to efficiently grow as we add more consumers, dealer customers and services to our network. We have developed back-end tools and are implementing Oracle-based solutions to support our business. AutoTrader.com and KBB.com are both designed to be fully redundant, and each is hosted in two distinct data centers, four in total. We have implemented tight security measures and back-up power plans designed to ensure the uninterrupted operation of our consumer- and dealer-facing technology platform. We have scalable CRM, accounting, order management, data warehousing and analytics systems that we have developed through continuous improvements over the past several years.
We actively pursue new product development across our Digital Media and Software Solutions businesses. In recent years, we have improved search functionality on AutoTrader.com, released new consumer web services like TIM and Alpha advertising placements, and invested heavily in the creation of mobile applications for the iPhone, Android and iPad. We have also added new features to our software solutions, including vAuto’s inventory management tools, HomeNet’s IOL 2.0 inventory tools and VinSolutions’ process and service CRM tools. We intend to continue to develop differentiated, innovative features and solutions.
Culture and Employees
We believe the root of our success is our highly-engaged team of over 3,400 full- or part-time employees, as of November 12, 2012, and their passion for and commitment to improving the car purchasing process for all participants in the automotive ecosystem. We are a company of innovators and car enthusiasts, continually seeking to improve the car purchasing process for both buyers and sellers. We believe that the car purchasing decision is one of the largest financial decisions a person makes in his or her lifetime and one that historically has been too complex and inefficient. We believe that our employees are committed to achieving our mission of making the car buying process as transparent and frictionless as possible for all parties.
While we believe we have made significant progress in this endeavor, we believe the digital automotive marketplace remains far from perfect. Our team is energized by the mission to dramatically improve the way people buy and sell cars; every day we continue to drive towards the destination of a frictionless automotive purchasing experience for all participants.
We have invested and continue to invest in our employees through extensive training and leadership programs that are designed to foster a culture of highly engaged employees committed to achieving our mission. At ATC, for example, we have operated under a set of seven values that are intended to differentiate our culture from competitors’ and stress the importance of providing top-quality service to our customers.
By adhering to such values, we believe we are making a positive impact not only on our consumer audience and customers, but also on our employees and the communities in which we work and live.
None of our employees are represented by a collective bargaining agreement. We believe that relations with our employees are good.
120
Table of Contents
Facilities
Our principal executive offices are located at 3003 Summit Boulevard, Atlanta, Georgia 30319. The following table summarizes information regarding our significant properties, as of June 30, 2012, all of which are leased:
| Location |
Principal Use |
Square Feet | ||
| Corporate |
||||
| Atlanta, Georgia(a) |
Corporate and AutoTrader.com | 391,059 | ||
| Digital Media |
||||
| Brea, California |
AutoTrader.com | 16,940 | ||
| Irvine, California(b) |
Kelley Blue Book | 113,780 | ||
| Tampa, Florida |
AutoTrader.com | 10,545 | ||
| Oakbrook Terrace, Illinois |
AutoTrader.com | 12,180 | ||
| Novi, Michigan |
AutoTrader.com | 13,777 | ||
| Troy, Michigan |
Kelley Blue Book | 3,810 | ||
| Charlotte, North Carolina |
AutoTrader.com | 14,924 | ||
| Irving, Texas |
AutoTrader.com | 9,100 | ||
| Software Solutions |
||||
| Scottsdale, Arizona |
CDMdata | 9,285 | ||
| Oak Brook, Illinois |
vAuto | 15,654 | ||
| Overland Park, Kansas(a) |
VinSolutions | 28,734 | ||
| Exton, Pennsylvania |
HomeNet | 24,057 | ||
| Austin, Texas |
vAuto | 4,283 | ||
| (a) | Two facilities. |
| (b) | Three facilities. |
We relocated to our Atlanta headquarters in 2011. To the extent that we require additional space in the future, we believe that it will be readily available on commercially reasonable terms.
Intellectual Property
We protect our intellectual property rights by relying on a combination of trademark, copyright, patent and trade secret laws, in addition to contractual restrictions that protect our rights in our brands, technology and services. We enter into confidentiality and invention assignment agreements with certain of our employees and contractors, and require other third parties with whom we do business to maintain the confidentiality of our proprietary information. We seek to control access to, and distribution of, our proprietary information in a commercially reasonable manner. We have registered domain names, trademarks, and service marks in the United States and a number of international jurisdictions, and have filed U.S. patent applications covering certain aspects of our technology. As of November 8, 2012, we had approximately 200 registrations or applications for registration of trademarks in 25 jurisdictions, one issued U.S. patent, 18 pending U.S. patent applications, over 550 copyright registrations and approximately 1,600 domain name registrations.
We do not own the “AutoTrader.com” trademark. Since 1999, we have licensed the right to use the “AutoTrader.com” trademark and certain other marks incorporating the term “Trader” pursuant to a series of licenses from TPI Holdings, Inc. TPI Holdings is currently owned in equal, 50% shares by ATC IP License Holdings, LLC, a limited-purpose ATG subsidiary, and affiliates of Landmark Media Enterprises LLC, a former investor in AutoTrader.com. The current license is royalty-free and is in effect for unlimited, successive 10 year terms that automatically renew at ATG’s option.
121
Table of Contents
The license grants us the exclusive right to use the “Trader” mark in combination with terms that relate exclusively to automobiles, including family cars, sports utility vehicles, crossover vehicles, antique/collector cars and family light trucks, in connection with online advertising websites and print advertising publications. In addition, pursuant to the license, we have the exclusive right to use the “Auto Trader,” “AutoTrader.com” and “AutoTrader Classic” marks other than with respect to media directed primarily to the prohibited fields described in the following sentence. We are prohibited from adopting trademarks that use the “Trader” mark in combination with terms that relate to motorcycles, RVs, ATVs, dune buggies, go-carts, golf carts, snow mobiles, boats, yachts, personal watercrafts, commercial light trucks, big trucks, construction and heavy equipment, trailers and aircrafts, parts and accessories for these products, and apartments, condominiums, homes, employment, travel and multiple categories of general merchandise, which are all exclusively licensed to Dominion Enterprises, an affiliate of Landmark Communications, Inc. For example, we could not adopt the marks “Boat & RV Trader,” “Cycle Trader” or “Yacht Trader.” We may, however, publish listings and advertisements on AutoTrader.com for any of the categories of trademarks that are exclusive to Dominion Enterprises and on any other print publications or websites so long as less than 50% of the advertisements are for products that fall within the Dominion Enterprises exclusive categories and the products within the Dominion Enterprises exclusive categories are not advertised on the front or back cover of such publication or the home page of such website.
We may not have the right to adopt internationally domain names or trademarks that are identical or similar to the trademarks and domain names we use in the United States because third parties may have already adopted these marks. For example, AutoTrader.com agreed pursuant to a settlement agreement not to use the AutoTrader.com logo on automotive classified websites in the European Union. International expansion may require us to adopt and promote new marks, which may be expensive and place us at a competitive disadvantage.
There are circumstances beyond our control that may pose a threat to our intellectual property rights. For example, effective intellectual property protection may not be available in the United States or other countries in which we operate. The efforts we have taken to protect our intellectual property may not be sufficient or effective, and it may be possible for competitors to acquire domain names or trademarks that are similar to, infringe upon or diminish the value of our domain names, trademarks, and other proprietary rights and for third parties to copy or otherwise obtain and use the content of our websites without authorization. Effective protection of trademarks, copyrights, patents, domain names, and trade secrets is expensive, time consuming, may require litigation and may not be successful in all jurisdictions. Impairment of our intellectual property rights may damage our business or our ability to compete effectively.
Companies in internet, media, software, technology and other industries own large numbers of patents, copyrights, trademarks and other proprietary rights and may frequently request license agreements, threaten litigation or file suit against us based on allegations of infringement or other violations of rights. Third parties have from time to time claimed, and others may claim in the future, that we have infringed or violated their intellectual property rights. Any intellectual property claim, regardless of its merit, could be time consuming and expensive to settle or litigate. As our business grows, we will likely face more claims of infringement and we may not be able to overcome claims by third parties that we are violating their rights. We may be subject to significant liability for damages and may have to stop using technology, content, branding or business methods that may violate another party’s rights. We may be required to license, or may opt to seek a license for rights held by others, which may require the payment of substantial license fees. We may also be required to develop alternative non-infringing technology, content, branding or business methods, which could require significant effort and expense and make our services less competitive.
122
Table of Contents
Regulatory Issues
Various aspects of our business are subject to U.S. federal, state and local, as well as international, regulation. Failure to comply with regulations may result in the suspension or revocation of licenses or registrations, the limitation, suspension or termination of services and/or the imposition of civil and criminal penalties, including fines.
Consumer Data Regulation
We process, store and use personal information and other consumer data, including credit card information. While we do not sell or share personal information with third parties for direct marketing purposes, we do have relationships with third parties that may allow them access to user information for other purposes. For example, when we outsource functions such as technical and customer support, quality assurance and payment processing to other companies, we make user information available to those companies to the extent necessary for them to provide the outsourced services.
These activities are governed by numerous evolving, inconsistent and often conflicting laws. For example, the FTC expects companies like ours to comply with guidelines that govern the collection, use and storage of consumer information, and establish principles relating to notice, consent, access and data integrity and security. Our practices are designed to comply with these guidelines as described in our published privacy policies. These policies disclose that we collect a range of information about consumers, such as their names, email addresses, search histories and activity on our platform. We also use and store such information primarily to personalize the experience on our platform, provide customer support and display relevant advertising.
Additionally, we and third parties use tracking technologies, including “cookies” and related technologies, to help us manage and track consumers’ interactions with our websites and deliver relevant listings and advertising. United States regulatory agencies are increasingly focused on online privacy matters and, in particular, on online advertising activities that utilize cookies and other online tools for tracking purposes. For example, the FTC, Department of Commerce and White House have recently issued several reports emphasizing the importance of the principles of consumer notice and choice, and recommending the adoption of methods of simplified choice, including the implementation of a “Do Not Track” mechanism—likely a persistent setting on consumers’ internet browsers—to enable consumers to choose whether to allow the tracking of their online search and browsing activities.
Further, we participate in the Digital Advertising Alliance and similar industry self-regulatory organizations. These and other organizations issue guidelines addressing privacy protection on the internet, and in many cases, government regulators expect us to abide by these guidelines, even if we are not a member of the issuing organization. In addition, the mobile platform may be governed by separate, and possibly conflicting, self-regulatory guidelines and federal state and local regulations.
A number of existing bills are currently pending in the U.S. Congress that contain provisions that would regulate how companies can use cookies and other tracking technologies to collect and use information about consumers. Several of these bills contain additional provisions that would specifically regulate the collection and use of information, particularly geolocation information from mobile devices.
Other
We are directly and indirectly subject to numerous laws and regulations in the United States and abroad that involve matters central to our business, including advertising, content and automobile valuation. These laws and regulations are constantly evolving and can be subject to significant change.
123
Table of Contents
In addition, the application and interpretation of these laws and regulations are often uncertain, particularly in the new and rapidly evolving industry in which we operate. For example, automotive sales, leasing and financing, as well as advertising generally, is highly regulated, and such regulation could be interpreted to obligate us to ensure that our listings and advertising complies with applicable laws and regulations. Consequently, we may face liability for, and may be subject to claims related to, inaccurate or improper advertising content provided to us, which even if unfounded or decided in our favor, may be extremely costly to defend, could require us to pay significant damages and could limit our ability to operate.
We may face potential liability for the content of our classified listings and advertisements. The classified listings on AutoTrader.com currently qualify for protection under the CDA because we do not exercise any control over the content of these listings. However, these protections do not apply to advertisements and advertorial content that we exercise control over. Advertorials, in particular, have come under increasing scrutiny in cases in which they are designed to resemble news alerts or stories but are in fact advertisements. More generally, automotive dealerships and automotive leasing and financing services are highly regulated, and such regulation may be extended to more heavily regulate motor vehicle advertising on the internet by our dealers or could be interpreted to obligate us to ensure that the advertisements we display on behalf of automotive dealerships comply with applicable laws and regulations. We obligate our dealers to be responsible for determining what laws and regulations are applicable to them.
Additionally, laws relating to the liability of providers of online services for actions by users and third parties are currently being tested by a number of claims, including actions based on invasion of privacy and other torts, unfair competition, copyright and trademark infringement and other theories. If legislation is passed that limits the immunities afforded to websites that publish content generated by third parties, we may be compelled to remove such content from our platform.
Further, instant trade-in offer pricing through our TIM service could subject us to liability under state “Bird Dog” laws, which prohibit dealers from making payments to third-parties in connection with the sale of motor vehicles through persons other than their licensed salespeople. If we become subject to these laws or regulations, we may be forced to implement new measures to reduce our exposure to this liability, including discontinuing certain services or features.
A number of jurisdictions are considering legislative and regulatory proposals concerning these or other aspects of our business, including anti-internet neutrality, taxation and access charges. We do not know if such regulations will be applied to the internet, or whether they could result in a decrease in internet usage, which could in turn decrease demand for our solutions. Such regulation could also require us to modify or discontinue providing all or a portion of our solutions.
The foregoing description of laws and regulations to which we are subject is not exhaustive, and the regulatory framework governing our operations changes continuously. Although we do not believe that compliance with future laws and regulations related to the internet commerce industry and our business will have a material adverse effect on our business, financial condition or results of operations, the enactment of new laws and regulations may increasingly affect the operation of our business, directly or indirectly, which could result in substantial regulatory compliance costs, litigations expense, adverse publicity, the loss or revenue and decreased profitability.
Legal Proceedings
We and our subsidiaries are parties to various legal proceedings that are ordinary and incidental to our businesses. Management does not expect that any of these currently pending legal proceedings will have a material adverse impact on our consolidated financial position, results of operations or cash flows.
124
Table of Contents
We are a holding company, and our principal assets are common stock in ATC. The diagram below depicts our organizational structure immediately following this offering:
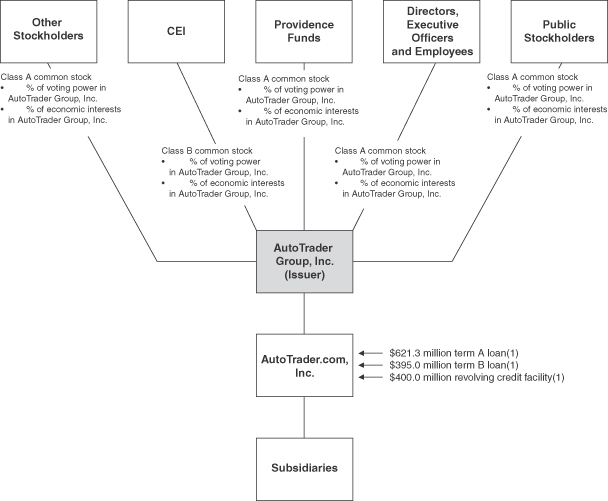
| (1) | As of June 30, 2012. |
125
Table of Contents
Executive Officers and Directors
The following table sets forth the names, ages and positions of our executive officers and directors and other key employees, as of November 13, 2012.
| Name |
Age |
Position | ||||
| Chip Perry |
59 | President, Chief Executive Officer and Director | ||||
| Dallas S. Clement |
47 | Executive Vice President and Chief Financial Officer | ||||
| James S. Franchi |
48 | President, Media | ||||
| Edward D. Smith |
46 | Chief Technology Officer | ||||
| Clark Wood |
60 | Chief Marketing Officer | ||||
| Steven Alan Smith |
47 | Executive Vice President; Chief Operating Officer, AutoTrader.com | ||||
| Matthew S. McKenna |
47 | Senior Vice President, National Account Sales, AutoTrader.com | ||||
| David B. Amundsen |
43 | Vice President, Finance and Accounting | ||||
| Peter C. Cassat |
49 | Vice President and General Counsel | ||||
| Jared R. Rowe |
39 | President, Kelley Blue Book | ||||
| Keith A. Jezek |
48 | President, Software | ||||
| Dale Pollak |
53 | Senior Vice President; vAuto Founder | ||||
| Jimmy W. Hayes |
60 | Chairman of the Board and Director | ||||
| Albert J. Dobron |
43 | Director | ||||
| Michael J. Dominguez |
43 | Director | ||||
| John M. Dyer |
58 | Director | ||||
| James C. Kennedy, Jr |
30 | Director | ||||
| John Olin |
51 | Director | ||||
| Sanford H. Schwartz |
59 | Director | ||||
| Alexander C. Taylor |
37 | Director | ||||
Set forth below is a description of the business experience of the foregoing persons.
Chip Perry has served as our President and Chief Executive Officer since August 1997 and he has been a director of ATC since August 1999. Mr. Perry became our first employee when he started ATC with CEI’s backing in August 1997. Mr. Perry’s institutional knowledge of our company, as well as his leadership and automotive industry experience enable him to make valuable contributions to the operations of our business.
Dallas S. Clement has served as our Chief Financial Officer since February 2011. Prior to joining our company, Mr. Clement served as Chief Strategy Officer of CCI from July 2010 to February 2011. He also previously served as Chief Product and Strategy Officer of Cox Communications, Inc., where he oversaw the product and strategy groups from August 2000 to July 2010.
James S. Franchi has served as our President, Media since August 2012. He previously served as Executive Vice President and Chief Operating Officer for AutoTrader.com from December 2011 to August 2012, Senior Vice President, Operations from September 2009 to December 2011, Vice President, Customer Operations from August 2008 to September 2009, and Vice President, Product Management from January 2007 to August 2008.
126
Table of Contents
Edward D. Smith has served as our Chief Technology Officer since February 2012. Prior to joining our company, Mr. Smith served as Chief Information Officer of Alere Health LLC, a healthcare technology company, where he oversaw technology strategy, development and operations. From 2007 to 2011, he was Senior Vice President of Technology at Equifax, where he was responsible for technology delivery and operations for their Personal Solutions and US Credit Information Services businesses. Prior to Equifax he was a partner at Unisys and Accenture.
Clark Wood has served as our Chief Marketing Officer since June 2008. He previously served as our Vice President, Marketing from January 2000 to June 2008 and Director of Marketing from April 1998 to January 2000.
Steven Alan Smith has served as our Executive Vice President and Chief Operating Officer of AutoTrader.com since August 2012. He previously served at AutoTrader.com as Senior Vice President, Dealer Sales from July 2008 to August 2012 and Vice President, Consumer Operations from September 2005 to July 2008.
Matthew S. McKenna has served as Senior Vice President, National Accounts, for AutoTrader.com since September 2008. Prior to that, he held the position of our Vice President, National Accounts from December 2006 to September 2008. Prior to December 2006, he held the position of our General Manager of National Accounts.
David B. Amundsen has served as our Vice President, Finance and Accounting since August 2012. He previously served as the Vice President, Finance, for AutoTrader.com from July 2005 to August 2012. Prior to that, he was our Controller from 2001 to July 2005. Mr. Amundsen has prior experience as a financial reporting manager for CEI and as a senior auditor for Deloitte & Touche.
Peter C. Cassat has served as our Vice President and General Counsel since November 2011. Prior to joining our company, Mr. Cassat was a Partner at the law firm of Dow Lohnes, PLLC from January 2000 to November 2011.
Jared R. Rowe has served as President, Kelley Blue Book since February 2012. Prior to his tenure at Kelley Blue Book, from September 2010 to February 2012, Mr. Rowe served as Vice President, Product Management at ATC. Prior to his tenure at ATC, Mr. Rowe held the position of Executive Vice President at FordDirect, an online automotive marketing company principally focused on the new vehicle market from 2000 to September 2010. In his capacity as Executive Vice President at FordDirect, Mr. Rowe was primarily responsible for product and strategy.
Keith A. Jezek has served as our President, Software since August 2012. He previously served as President, vAuto from January 1, 2006 to August 2012 and President, VinSolutions from January 1, 2012 to August 2012. Prior to that, he held the position of Senior Vice President, ADP, Inc. Dealer Services from April 2002 to December 2005.
Dale Pollak has served as our Senior Vice President since August 2012. Additionally, Mr. Pollak founded vAuto in 2005. Prior to joining vAuto, he was Vice President of Sales and Imagery at Digital Motorworks.
Jimmy W. Hayes has served as the Chairman of ATC’s board of directors since January 2007 and is currently the Chairman of the Board and a member of the executive committee and the compensation committee. He has held the positions of President of CEI since December 2005, Chief Executive Officer of CEI since January 2009 and Director of CEI since April 2006. Mr. Hayes also previously served as Chief Operating Officer of CEI from December 2005 to December 2008 and Executive Vice President, Finance of CCI from 1999 to December 2005. In addition, Mr. Hayes held
127
Table of Contents
the position of Vice President of ATC from March 2009 to April 2011. Mr. Hayes’s experience in the communications, media and automotive services industries allows him to make valuable contributions to our Board and our business’ operations.
Albert J. Dobron has served as a director of ATC since June 2010, and was nominated by Providence Equity Partners pursuant to the Stockholder Agreement entered into at the time of the Providence Investment. He is a Managing Director for Providence Equity Partners, where he has been employed since 1999. He is responsible for, among other things, deal origination and the evaluation and oversight of companies owned by the private investment funds managed directly and indirectly by Providence Equity Partners. Mr. Dobron has over 15 years of experience operating, managing and advising companies in the media, entertainment, communications and information sectors, including analyzing business operations, models, strategic plans and financial statements and serving as a member of the board of directors for such companies. In addition to the Company, he is currently on the boards of OpenSky, Newport Television, Univision Communications and Wize Commerce. Mr. Dobron received a B.S. from the University of New Hampshire and an MBA from Harvard University. Mr. Dobron’s professional experience and business background allow him to make key contributions to our Board and the operation of our business.
Michael J. Dominguez has served as a director of ATC since June 2010 and is a member of the executive committee. He was nominated by Providence Equity Partners pursuant to the Stockholder Agreement entered into at the time of the Providence Investment. He is a Managing Director for Providence Equity Partners, where he has been employed since 1998. He is responsible for, among other things, deal origination and the evaluation and oversight of companies owned by the private investment funds managed directly and indirectly by Providence Equity Partners. Mr. Dominguez has over 15 years of experience operating, managing and advising companies in the media, entertainment, communications and information sectors, including analyzing business operations, models, strategic plans and financial statements and serving as a member of the board of directors for such companies. In addition to the Company, he is currently on the boards of ZeniMex Media, CDW and GLM Holdings. Mr. Dominguez received a B.A. from Bucknell University and an MBA from Harvard University. Mr. Dominguez’s professional experience and business background allow him to make key contributions to our Board and the operation of our business.
John M. Dyer has served as a director of ATC since June 2008 and is a member of the executive committee and the compensation committee. He currently serves as Executive Vice President of CEI, a position he has held since January 2008, and has also held the position of Chief Financial Officer of CEI since July 2008. Mr. Dyer also previously served as Executive Vice President of Finance of CEI from January 2008 to June 2008, Senior Vice President and Chief Financial Officer of CCI from October 2005 to March 2008 and Senior Vice President of Operations of CCI from May 1994 to December 2005. Mr. Dyer’s experience in the communications, media and automotive services industries enables him to make valuable contributions to our Board and our business.
James C. Kennedy, Jr. has served as a director of ATC since March 2011. Mr. Kennedy serves as the Vice President of Business Development for CEI, where he has been employed since 2010. During the summer of 2009, prior to his tenure at CEI, he served as a Masters of Business Administration intern for Facebook. Mr. Kennedy also participated in CCI’s Leadership Rotation Program from 2006 to 2008. Mr. Kennedy’s experience in the communications and media industries enables him to make valuable contributions to our Board and the operation of our business.
John Olin has served as our director since June 2012. He currently serves as the Senior Vice President and Chief Financial Officer of Harley-Davidson, Inc., a position he has held since May 2009. Mr. Olin previously served from May 2003 to May 2009 as the Vice President, Controller of Harley-Davidson Motor Company. Mr. Olin’s experience in leadership roles and accounting allow him to make key contributions to our business through his participation on the Board.
128
Table of Contents
Sanford H. Schwartz has served as a director of ATC since September 2006. He currently serves as President of Manheim, a position he has held since 2011. Mr. Schwartz also previously served as a Vice President of our company from 2010 to March 2012, President of Cox Media Group from 2009 to 2011 and President of Cox AutoTrader, Inc., from 2006 to 2009. Mr. Schwartz’s experience in the communications, media and automotive services industries allow him to make valuable contributions to our Board and the operation of our business.
Alexander C. Taylor has served as a director of ATC since March 2011. Mr. Taylor has held the position of Senior Vice President of Field Operations for CCI since January 2012. Prior to that, he served as an Executive Vice President of the Cox Media Group from 2010 to 2012, and as a publisher for the Palm Beach Post and The Daily Sentinel, both CEI newspapers, from 2007 to 2009. Mr. Taylor’s experience in the communications and media industries contribute to our Board and the operation of our business.
Board of Directors
Our business and affairs are managed under the direction of our Board.
Our Board currently is comprised of nine directors, of which five members are representatives of CEI, two members are representatives of Providence Equity Partners and one member who is our President and CEO, Chip Perry. Representatives of CEI consist of: Jimmy W. Hayes, the Chairman of our Board; John M. Dyer; James C. Kennedy, Jr.; Sanford H. Schwartz; and Alexander C. Taylor. The Providence Equity Partners representatives are Albert J. Dobron and Michael J. Dominguez. Our ninth director, John Olin, is not affiliated with CEI or Providence Equity Partners.
Following this offering, in accordance with our director nomination agreements, our Board will eventually consist of 13 directors, of which seven will be nominated by CEI, two will be nominated by Providence Equity Partners, three nominees will be independent directors that meet the NYSE listing requirements for independence and also satisfy the independence criteria set forth in Rule 10A-3 under the Securities Exchange Act of 1934, as amended, or the Exchange Act, and one nominee will be our chief executive officer. In the event that, after selling shares of our common stock, CEI and its affiliates holds less than 10% of the number of shares of common stock outstanding as of the Charter Effective Date, as adjusted to reflect any stock dividend, stock split, reverse stock split or combination of shares, or any non-dilutive recapitalization, reorganization or similar event, but not issuances of equity (including, without limitation, upon exercise of options or similar rights to acquire shares or exchange securities for shares), CEI will no longer have the right to nominate any of our directors. In the event that, after selling shares of our common stock, Providence Equity Partners and its affiliates hold less than 10%, but more than 5%, of the number of shares of our common stock outstanding as of the Charter Effective Date (as adjusted), Providence Equity Partners will have the right to nominate one of our directors and in the event that, after selling any shares of our common stock, Providence Equity Partners and its affiliates holds less than 5% of the number of shares of our common stock outstanding as of the Charter Effective Date (as adjusted), Providence Equity Partners will no longer have the right to nominate any of our directors. After this offering, we will have shares of common stock outstanding, or shares if the underwriters’ option to purchase additional shares is exercised in full.
Director Independence and Controlled Company Exemption
Our Board has not affirmatively determined that any of our directors is an independent director under the rules of the NYSE or that any or our directors is an independent director as such term is defined in Rule 10A-3(b)(1) under the Exchange Act. In accordance with the NYSE phase-in rules for newly public companies, we will have at least one director that is independent under the New York Stock Exchange rules and under Rule 10A-3(b)(1) at the time our shares are listed, two independent directors within 90 days of such listing and three independent directors by the first anniversary of listing.
129
Table of Contents
Following this offering, CEI and its affiliates will control a majority of the outstanding voting power of our common stock. As a result, we will be a “controlled company” within the meaning of the NYSE corporate governance rules. As a “controlled company,” we may elect not to comply with certain NYSE corporate governance rules, including:
| Ÿ | the requirement that a majority of the Board consist of independent directors; |
| Ÿ | the requirement that we have a governance committee that is composed entirely of independent directors with a written charter addressing the committee’s purpose and responsibilities; |
| Ÿ | the requirement that we have a compensation committee that is composed entirely of independent directors with a written charter addressing the committee’s purpose and responsibilities; and |
| Ÿ | the requirement for an annual performance evaluation of the governance committee and compensation committee. |
Following this offering, we intend to utilize these exemptions. As a result, we will not have a majority of independent directors, our nominating and corporate governance committee and compensation committee will not consist entirely of independent directors and such committees will not be subject to annual performance evaluations. Accordingly, holders of our Class A common stock will not have the same protections afforded to stockholders of companies that are subject to all of the NYSE corporate governance requirements.
Board Committees
Our Board will establish an audit committee prior to our shares being listed on the NYSE, and our Board has established a compensation committee, a related party committee and an executive committee. We do not intend to establish a governance committee. Each committee will have the composition and responsibilities described below. Members serve on these committees until their resignations or until otherwise determined by our Board.
Audit Committee
We do not have an audit committee. Prior to the listing of our Class A common stock, we will establish an audit committee comprised of , and . will serve as chair of the audit committee. qualifies as an “audit committee financial expert” as such term has been defined by the Securities and Exchange Commission in Item 401(h)(2) of Regulation S-K. Our Board has affirmatively determined that meets the definition of an “independent director” for the purposes of serving on the audit committee under applicable NYSE rules and Rule 10A-3 under the Exchange Act. We intend to comply with these independence requirements for all members of the audit committee within the time periods specified under such rules. Our audit committee will have a written charter that will be posted on our investor relations section of our website after this offering.
Our audit committee will be responsible for, among other things:
| Ÿ | selecting the independent registered public accounting firm to audit our financial statements; |
| Ÿ | ensuring the independence of the independent registered public accounting firm; |
| Ÿ | discussing the scope and results of the audit with the independent registered public accounting firm, and reviewing, with management and that firm, our interim and year-end results of operations; |
130
Table of Contents
| Ÿ | developing procedures to enable submission of anonymous concerns about accounting or audit matters; |
| Ÿ | considering the adequacy of our internal accounting controls and audit procedures; and |
| Ÿ | approving or, as permitted, pre-approving all audit and non-audit services to be performed by the independent registered public accounting firm. |
Compensation Committee
Our compensation committee is comprised of Messrs. Hayes, Dyer, Dominguez and Dobron. Mr. Hayes is the chair of the compensation committee. In connection with this offering, the compensation committee will be reconstituted to include at least two directors who are non-employee directors, as defined pursuant to Rule 16b-3 promulgated under the Exchange Act, and who are outside directors, as defined under Section 162(m) of the Internal Revenue Code of 1986, as amended, or the Code. Our compensation committee will have a written charter that will be posted on our investor relations section of our website after this offering.
Our compensation committee is responsible for, among other things:
| Ÿ | reviewing and approving, or recommending that our Board approve, the compensation of our CEO and other executive officers; |
| Ÿ | reviewing and approving, or recommending that our Board approve, the terms of any compensatory agreements with our CEO and other executive officers; |
| Ÿ | reviewing and administering our compensation, benefits and stock and long-term incentive plans; and |
| Ÿ | reviewing and making recommendations to our Board with compensation, benefits and long-term incentive plans. |
Related Party Committee
Our related party committee is comprised of Messrs. Dominguez, Dobron and Olin. The related party committee will have responsibility for the oversight and implementation of our related party agreement and our cross-license agreement, and the matters set forth in the related party agreement for determination by our related party committee. For more information, see “Certain Relationships and Related Person Transactions—Agreements Related to CEI—Related Party Agreement.”
Executive Committee
The executive committee, to the extent permitted by Delaware law, has and may exercise, when our Board is not in session, all powers of our Board, except for matters required to be submitted for stockholder approval under Delaware law and the amendment or repeal of our second amended and restated bylaws.
Code of Business Conduct and Ethics Policy
Prior to this offering, our Board will adopt a code of business conduct and ethics that applies to all of our employees, officers, and directors. Our code of business conduct and ethics will be posted on the investor relations section of our website after this offering. We intend to disclose future amendments to or waivers of specified provisions of our code of business conduct and ethics policy on our website or in filings under the Exchange Act.
131
Table of Contents
Compensation Committee Interlocks and Insider Participation
Messrs. Hayes, Dyer, Dominguez and Dobron served as members of the compensation committee during 2011. None of the members of our compensation committee is or has in the past served as an officer or employee of our company. None of our executive officers currently serves, or in the past year has served, as a member of the board of directors or compensation committee of any entity that has one or more executive officers serving on our Board or compensation committee.
132
Table of Contents
EXECUTIVE AND DIRECTOR COMPENSATION
The following discussion and analysis of compensation arrangements should be read with the compensation tables and related disclosures set forth below. This discussion contains forward-looking statements that are based on our current plans and expectations regarding future compensation programs. See “Forward-Looking Statements.” Actual compensation programs that we adopt may differ materially from the programs summarized in this discussion.
Compensation Discussion and Analysis
Overview
This compensation discussion and analysis describes our approach to compensation, including what we do, how we do it, and why we have made the choices that we have made. It focuses on the material elements of compensation awarded to, earned by, or paid to each of our named executive officers, or NEOs, during the last completed fiscal year, which ended December 31, 2011, but we also describe actions taken before or after 2011 in instances where it could enhance the understanding of our executive compensation program and our compensation-setting process. Much of this discussion applies to our President and CEO, and to each of our other NEOs, but, for context, we also offer certain information that pertains more widely to all of our executives and to our employees in general.
For 2011, our NEOs were:
| Ÿ | Chip Perry, President and CEO; |
| Ÿ | Dallas S. Clement, Executive Vice President and Chief Financial Officer; |
| Ÿ | James S. Franchi, President, Media; |
| Ÿ | Matthew S. McKenna, Senior Vice President, National Account Sales, AutoTrader.com; and |
| Ÿ | Steven Alan Smith, Executive Vice President; Chief Operating Officer, AutoTrader.com. |
Objectives and Philosophy
The key objectives of our executive compensation program are to:
| Ÿ | attract and retain qualified, talented and experienced executive officers who contribute to our success by their leadership, knowledge, skills and performance; |
| Ÿ | establish a clear pay for performance relationship by basing incentives on financial and operating performance and the creation and maintenance of stockholder value by providing meaningful variable pay opportunities in order to align the interests of our executive officers with those of our stockholders; |
| Ÿ | promote teamwork while also recognizing the role each executive officer plays in our success; |
| Ÿ | maintain competitive and fair compensation practices, both internally and as compared to our competition; |
| Ÿ | balance the focus between short-term results and building an extraordinary company for the long term. |
Our executive compensation program balances short-term and long-term financial and operating performance as well as the achievement of pre-determined strategic goals, and consists of a combination of fixed compensation and compensation that is “at risk” and tied to the attainment of previously established financial, operating and strategic objectives that are directly related to stockholder value and our overall performance. We believe our stockholders benefit from an executive compensation program that is competitive with industry standards, variable with annual and long-term
133
Table of Contents
performance and focused on stockholder value. Compensation components are structured to attract, retain and motivate our executives and are allocated in a manner that is intended to be complementary. Specifically, we believe our executives are:
| Ÿ | attracted and retained by meaningful and predictable levels of fixed compensation through base salary and a competitive benefits package; |
| Ÿ | motivated to deliver exceptional short-term results through annual incentive awards; and |
| Ÿ | encouraged to focus on building enduring stockholder value through long-term incentive awards and long-term stock ownership, which also serve to retain key executives. |
We believe a substantial portion of total compensation should be “at risk,” based on our financial and operational performance, and that the “at risk” components should be progressively greater for higher-level positions. Our compensation program seeks to incentivize executives to achieve sustained excellent performance by including components with a long-term performance focus, such as stock options, stock appreciation rights and performance unit awards.
Compensation-Setting Process
Role of our Board and Management. The compensation committee of the Board oversees the design and administration of our executive compensation program. The CEI Human Resources Department advises the compensation committee and implements the administrative functions of our executive compensation program. The compensation committee approves all long-term incentive and equity awards for our executive officers as well as our President and CEO’s salary and annual incentive compensation. Our President and CEO approves the salary and annual incentive compensation for all of the other NEOs and reviews this information with the compensation committee. No executive officer voted in the final determinations regarding the amount of any component of his or her own compensation package. For the year ended December 31, 2011, the compensation committee consisted of four members. Following this offering, the compensation committee will be reconstituted to include at least two members who meet the non-employee director requirements of Section 16 of the Exchange Act and qualify as “outside directors” under Section 162(m) of the Code.
Role of Compensation Consultant. CEI engages the services of the consulting firm Pay Governance, Inc. to assist with strategy and design recommendations for our executive compensation and benefit programs. Compensation plans and compensation levels are developed by reviewing competitive compensation data provided in the Croner Digital Content and Technology Survey, which in 2011 consisted of compensation information primarily from online technology companies, as well as considering other relevant survey data provided by Pay Governance, Inc. For a list of the component companies of the two surveys, see “—Compensation Survey Component Companies.” The CEI Human Resources Department uses select data from compensation surveys provided by Pay Governance, Inc. to develop recommendations based on an examination of compensation levels at companies with which we compete for talent in the marketplace. Where necessary, survey information is supplemented by proxy statement analysis and other survey sources. We do not benchmark compensation against a finite and static group of companies; instead we, in conjunction with CEI Human Resources, review compensation against the various sources mentioned above, which may change slightly from year to year and may vary depending on the position, to develop compensation recommendations for the compensation committee and President and CEO to consider. We do not target compensation amounts for specific executives to a specific benchmark, but the compensation committee, in setting President and CEO compensation and long-term incentive awards, and our President and CEO, in setting other executives’ compensation, retain the discretion to determine whether or not the compensation data provided by Pay Governance, Inc. or developed from other sources is used for establishing executive compensation. The Compensation Committee has the ability to directly engage a compensation consultant which is independent of any compensation consultant engaged by management.
134
Table of Contents
Summary of Compensation Components
The table below summarizes each component of our executive compensation program, as well as who is eligible and the rationale underlying each component of compensation:
| Compensation Element |
Who is Eligible |
Rationale for Component | ||
| Base salary | All employees | Security and stability | ||
| Annual Incentive Awards | Substantially all employees | Focuses our employees on financial and operating performance critical to our success | ||
| ATG Long-Term Incentive Awards | Management and senior level individual contributors | Ties pay to long-term performance; promotes retention; promotes alignment with stockholders | ||
| Life, health and disability benefits | All full-time employees | Security and stability | ||
| Defined benefit pension plan | All full-time and part-time employees who are least age 21 that work at least 1,000 hours in a calendar year | Provides retirement income for long-tenured employees; rewards long-term loyalty to our company | ||
| Non-qualified supplemental retirement plan | Employees impacted by Internal Revenue Service, or IRS, limits on the defined benefit pension plan | Provides additional pension benefits for employees who are limited by the annual IRS compensation limit under the defined benefit pension plan | ||
| 401(k) defined contribution plan | All full-time and part-time employees working 20 hours per week or more | Allows employees to defer a percentage of their pre-tax compensation to save for retirement | ||
| Non-qualified retirement savings plan | Employees impacted by IRS limits on the 401(k) plan | Provides additional retirement savings for employees who are limited by IRS caps under the 401(k) Plan | ||
| Company cars and club allowances | Officers | Assists with attraction and retention of key talent; the car program is limited to eco-friendly vehicles, which aligns with our commitment to the environment | ||
We believe that each component of our executive compensation program serves an important function in achieving the objectives of our program. In determining the relevant amount of each component, the compensation committee considers the objectives and principles discussed above and the additional factors discussed below. We have not adopted formal policies or guidelines for allocating compensation. The compensation committee has not affirmatively set out in any given year, or with respect to any given executive officer, any specific ratio between cash and equity, or long-term and short-term compensation in which to apportion compensation. The compensation committee’s collective judgment and analysis of these objectives, principles and factors has been the most important factor in setting executive compensation.
135
Table of Contents
Elements of Compensation
Historically, we have targeted the 75th percentile of the general market when setting compensation. Specifically, we have:
| Ÿ | targeted the 75th percentile for base salaries; |
| Ÿ | set annual bonuses such that total cash compensation (base salary plus annual cash incentive compensation) would be between the 50th and the 75th percentiles when company performance approximates the pre-determined performance objectives; and |
| Ÿ | set long-term incentive award levels at approximately the 75th percentile. |
Going forward, in order to more closely align executives’ interests with those of our stockholders, we intend to shift pay opportunities to be more variable in nature. While we will continue to provide total compensation opportunities that approximate the 75th percentile, we will do so by moderating the growth of cash compensation and concurrently offering meaningful opportunities through long-term, equity-based incentive awards. As a result, over time, the percentage of target total compensation attributable to cash compensation should decline as the percentage of target total compensation and the target percentage for long-term, equity-based incentive opportunity will rise.
The compensation committee evaluates and sets the base salary of Mr. Perry and Mr. Perry evaluates and sets the base salaries of our other NEOs and reviews this information with the compensation committee on an annual basis. In setting initial salary levels and determining adjustments thereto, a number of factors were, and in the future will be considered, including:
| Ÿ | job scope and responsibilities; |
| Ÿ | tenure in the role and the individual’s experience; |
| Ÿ | our overall financial and operational performance, including subjective factors; |
| Ÿ | our ability to replace the individual; |
| Ÿ | other components of such individual’s compensation; |
| Ÿ | competitive salaries for similar positions at peer companies; and |
| Ÿ | overall individual performance, including both objective and subjective factors. |
These factors were, and in the future will be, reviewed collectively with no specific weighting assigned. No specific formulas are applied in determining base salary increases or adjustments. Taking these factors into account, in December 2011, the compensation committee approved an increase in Mr. Perry’s base salary from $700,000 to $726,000, which approximates the 75th percentile market reference point, and is considered appropriate in light of Mr. Perry’s performance and tenure.
The base salaries for each of our NEOs other than Mr. Perry were reviewed and approved by Mr. Perry based on the factors listed above, and are at or around the 75th percentile market reference point for their respective positions. The actual base salaries paid to each of our NEOs are set forth in the Summary Compensation Table below.
Annual Incentive Awards
Substantially all of our employees are eligible to receive an annual incentive award. Annual incentive awards provide an opportunity for us to adjust compensation based on the level of performance achieved over an annual period. The annual incentive award program is designed to reward collective and individual contributions to our financial and operating performance. Annual incentive award targets are set as a percentage of base salary, based on job responsibility and competitive market pay data.
136
Table of Contents
For each member of management at or above the Vice President level, whom we call participating individuals, we provide annual incentive awards which are designed to align such participating individual’s efforts with our annual financial and strategic objectives and reward the participating individual based on his or her performance relative to these objectives and the participating individual’s contribution to that performance. Actual annual incentive awards are based on an assessment by the compensation committee against pre-established goals as set forth in our annual business plans for overall financial performance for the year and may also have a component tied to financial performance of the area/group for which the individual is responsible. For 2011, the sole metric in the annual incentive plan was operating free cash flow, or OFCF, which is defined as revenues less operations expenses, sales and marketing expenses, general and administrative expenses and capital expenses (capital expenditures adjusted for any material, un-budgeted capital expenditures), allowing for certain adjustments to provide a consistent year-over-year comparison. The compensation committee chose OFCF as the sole metric to focus these participating individuals on growing our earnings before interest, taxes, depreciation and amortization while concurrently managing capital expenditures effectively.
We set three performance levels under our annual incentive plan. The “threshold” goal is set at a level below which there will be no payment of an incentive award. The “target” goal is set above the minimum desired goal to reflect a targeted level of performance. We believe that the “target” performance level can be characterized as difficult but attainable, meaning that based on historical performance this payout level is not assured but is within reasonable reach. The “maximum” goal reflects an ambitious level of performance that would only be attainable in an outstanding year, providing strong motivation for participating individuals to strive to exceed the performance goals in a way that balances short and long-term stockholder value creation. Goals and actual results for the 2011 annual incentive plan are set forth below (dollars in thousands):
| Threshold | Target | Maximum | Actual Result |
|||||||||||||
| OFCF |
$ | 168,276 | $ | 224,368 | $ | 280,460 | $ | 230,592 | * | |||||||
| % of Target Performance |
75 | % | 100 | % | 125 | % | 102.7 | % | ||||||||
| % of Target Payout Earned |
0 | % | 100 | % | 200 | % | 111.1 | % | ||||||||
| * | includes adjustments related to the acquisition of VinSolutions. |
For all participating individuals, the financial performance component is an objective calculation based on predetermined goals; we typically do not make discretionary adjustments to annual incentive awards to reduce or increase the size of the award. However it is permissible for such awards to be subject to adjustment by the compensation committee, in the case of Mr. Perry, or by Mr. Perry, in the case of our other executive officers. The compensation committee establishes the performance levels on an annual basis and has the flexibility to decrease or increase any level and/or adjust the structure, including allocation percentages among the levels as needed in order to better align our incentive plan to our business plan, as well as to make other determinations under the plan, including whether and to what extent the pre-determined goals have been achieved.
137
Table of Contents
The annual target incentive award opportunities and actual earned awards under the annual incentive award plan for our NEOs in 2011 were as follows:
| Target Performance | Actual Performance | |||||||||||||||
| Name |
Percentage of Salary |
Amount | Percentage of Salary |
Amount | ||||||||||||
| Chip Perry |
75 | % | $ | 525,000 | 83.3 | % | $ | 582,750 | ||||||||
| Dallas S. Clement* |
70 | % | $ | 312,712 | 80.5 | % | $ | 359,686 | ||||||||
| James S. Franchi |
55 | % | $ | 203,280 | 62.3 | % | $ | 230,314 | ||||||||
| Matthew S. McKenna |
55 | % | $ | 200,750 | 61.1 | % | $ | 222,833 | ||||||||
| Steven Alan Smith |
55 | % | $ | 209,000 | 61.1 | % | $ | 231,990 | ||||||||
| * | For Mr. Clement, amounts are based on his salary that are attributable to his service to us. |
Long-Term Incentive Awards
Long-term incentive awards promote creation of long-term value, aid in retention of our executive talent, and provide executive officers with a competitive long-term incentive opportunity. Payments made, if any, of long-term awards will vary considerably with our long-term performance. We believe that long-term incentives are an excellent device by which to align the interests of our executives with those of our stockholders.
After reviewing our strategic priorities and considering the alternatives available, the compensation committee approved, and we implemented, a long-term incentive award format consisting primarily of non-qualified stock options and stock appreciation rights for 2011, as well as 2012, as distributed pursuant to our 1999 Long-Term Incentive Plan, or our Long-Term Incentive Plan. In prior years (2009 and 2010), long-term incentive awards were cash-settled, three-year performance awards tied to specified financial results.
The compensation committee determines the size of the awards, taking into account the recommendation of our President and CEO, and a number of other factors, including our needs, the particular and uniqueness of the skills and responsibilities of the executive officer, competitive pay level data, the financial performance of our company as a whole, and the performance of the group which the executive officer oversees, as applicable. Long-term incentive awards are determined as a percentage of total compensation by reference to base salary and annual incentive targets and taking into account the executive’s duties and responsibilities.
Each type of long-term award presents exposure to downside performance risk, insofar as performance award targets may not be achieved and stock options only have value if our share price increases. We do not have a policy that forbids the hedging of the economic risk associated with ownership of our securities, but any and all hedging is strongly discouraged, due to the reality or perception that such hedging arrangements may create a lack of alignment between our employees and our stockholders.
We have not established specific guidelines for the disgorgement of bonuses or profits from the sale of our securities in the event of a restatement of financial statements, but we will abide, in all instances, by the relevant statutory and regulatory provisions governing this topic, including Section 304 of the Sarbanes-Oxley Act of 2002. Further, in the event that one of our executives is terminated for cause, all long-term awards, both vested and unvested, will be forfeited.
In connection with this offering, we plan to amend and restate our Long-Term Incentive Plan, which we refer to, as amended, as the 2012 Long-Term Incentive Plan.
138
Table of Contents
Stock Options. Our Long-Term Incentive Plan permits the grant of nonqualified and incentive stock options and stock appreciation rights. Stock options permit the holder to buy our Class A common stock at a specific price during a specific period of time. As the price of our Class A common stock rises, the option increases in value. The intent of such awards is to provide a compensation opportunity directly aligned with stockholder value.
In 2011, in conjunction with our desire to focus the executive team on delivering on an aggressive long-range business plan, the compensation committee approved an option grant to a select group of top executives, including each of our NEOs. The award of these stock options, which were issued with exercise prices based on our appraised value, were approved as a single grant to represent five years worth of opportunity, with the intent that no additional grants would be made to these participants until 2016. To ensure that potential payouts would be commensurate with performance, the compensation committee determined that half of the options should be granted with time-based vesting and half should be granted with performance-based vesting. All options will vest in full by December 31, 2015 assuming that (a) the executive remains employed by us or one of our affiliates, including CEI, and (b) for the performance-based portion, the underlying financial goals are met. The financial goals are tied to our five-year OFCF goals as set forth in our 2011-2015 long-range business plan. This long-range plan includes confidential forward-looking financial data, and disclosure of the specific performance targets could cause us competitive harm. While we believe these goals can be met, the performance targets are ambitious and will require the highest level of management performance in order for the goals to be fully achieved. Additional details on the 2011 awards can be found in the footnotes to the Grants of Plan-Based Awards Table.
In 2012, after reviewing these awards in light of our contemplation of an initial public offering and in consideration of material changes in the duties and responsibilities of certain of our executives, we determined to make an incremental stock option grant similar to the 2011 awards for each of our NEOs, except Mr. Perry. As with the 2011 awards, vesting of the 2012 options will be half time-based and half performance-based, and both types will vest in full by December 31, 2015 assuming that (a) the executive remains employed by us or one of our affiliates, including CEI, and (b) for the performance-based portion, the underlying financial goals are met.
We did not plan to award any stock appreciation rights to our NEOs in 2012.
For information on 2012 adjustments related to our stock option and stock appreciation right grants, see “Management’s Discussion and Analysis of Financial Condition and Results of Operations—Critical Accounting Policies and Estimates—Long-Term Incentive Compensation—Adjustment of Stock Options and Stock Appreciation Rights.”
Performance Units. In 2009 and 2010, we granted performance units under our Long-Term Incentive Plan. Consistent with our approach to long-term incentive awards, generally, the number of performance units awarded to each executive were determined as a percentage of total compensation by reference to base salary and annual incentive targets and taking into account the executive’s duties and responsibilities. The performance units granted in 2009 vested in full on December 31, 2011. The performance units granted in 2010 will vest in full by December 31, 2012 assuming that the executive remains employed by us or one or our affiliates, including CEI. The value of each performance unit generally equals the cumulative percentage increase, measured annually, in our OFCF minus our net debt. These performance units will be settled in cash within a reasonably practical period after they vest.
Executive Stock Retention
We believe that executives should retain a sufficient stock ownership position in us to align their interests with the interests of our stockholders. We have historically encouraged and continue to
139
Table of Contents
encourage each of our NEOs to purchase shares of our stock with the proceeds from their long-term incentive payments. In the past, most have used 25% to 100% of the net proceeds from such payments to do so. We believe that current ownership stakes among our NEOs in conjunction with the stock option grants made in 2011 and 2012 provide significant alignment with the interests of our stockholders. We intend to develop and implement stock ownership guidelines in connection with this offering.
Stock-Based Award Practices
All stock-based awards to our executive officers, including stock options, stock appreciation rights and restricted stock, are made under our Long-Term Incentive Plan and are reviewed and approved by the compensation committee. The Long-Term Incentive Plan generally does not permit stock option grants at prices below the fair market value on the date of grant, and stock option grants with an exercise price below the fair market value on the date of the grant have not been made. Our stock option grants historically have been based on an annual valuation derived by taking the average value from two independent, third-party appraisals obtained on an annual basis. The appraisals determine an appraised value as of December 31 of each year and any awards, purchase or sales of shares during the following year have been based on this average appraised value. In the event of a material transaction during a year, or as other events may warrant, we may conduct an off-cycle valuation, which we have done in the past and may do in the future. Any awards, purchases or sales of shares subsequent to such an off-cycle valuation would be made at the new appraised value as determined in the off-cycle valuation.
Change-in-Control and Severance Benefits
We do not have a formal severance policy. However, individual executives, including certain of our NEOs, may be eligible for severance benefits under certain termination scenarios based on the terms in their respective employment or employment-related agreements. In general, these benefits provide for cash severance at the time of termination along with benefits continuation. All or a portion of any outstanding long-term incentives may also be payable based on the provisions of the individual awards and the type of termination.
Performance awards under the Long-Term Incentive Plan contain a double-trigger provision for the accelerated vesting and exercisability of awards if there is a change-in-control combined with a termination of employment without cause. Similarly, awards to executive officers under the annual incentive program, which normally are contingent upon employment through the end of the year, may be payable in the event of a change-in-control and termination of employment. For more information on these provisions or on employment agreements with our NEOs, along with other items that would be payable in the event of termination of employment for various reasons, including a change-in-control, please see below under “—Employment Agreements” and “—Potential Payments Upon Termination or Change-in-Control—Benefits Payable Under the Restoration Plans.”
Retirement and Other Benefits
Certain of our benefits are provided through CEI, which provides benefits to all of its subsidiaries, including us.
CEI Pension Plan. The CEI Pension Plan, or the Pension Plan, is a qualified defined-benefit pension plan. All employees who work annually 1,000 hours or more in a 12-month period are eligible to participate in the Pension Plan with the exception of employees of our Kelley Blue Book, vAuto, VinSolutions and HomeNet subsidiaries. We intend to allow these employees to participate in the Pension Plan effective January 1, 2013. All of our NEOs are participants in the Pension Plan, and Mr. Perry is eligible for early retirement benefits under the Pension Plan because he satisfies the age and years of service requirements for early retirement under the Pension Plan.
140
Table of Contents
The Pension Plan calls for benefits to be paid to eligible employees at retirement based primarily upon years of service with CEI and its affiliates and compensation rates near retirement. The Pension Plan is funded through a tax-exempt trust, into which contributions are made by CEI as necessary based on an actuarial funding analysis. We reimburse CEI for the annual pension expense attributable to our employees, as defined under Statement of Financial Accounting Standards No. 87, or FAS 87. The Pension Plan provides for the payment of benefits upon retirement, including early retirement, death, disability and termination of employment. Participants become vested under the Pension Plan after completing five years of service. Pension Plan benefits are determined according to a formula which is based on a participant’s final average compensation, years of benefit service (up to a maximum of 30 years), and estimated Social Security benefit at age 65. The calculation of the monthly benefit is as follows:
| ( | 1.75% | × | Employee’s Final Average Monthly Compensation | × |
Employee’s Benefit Service Years | ) | - | ( | 1.67% | × | Employee’s Monthly Social Security Benefit | × | Employee’s Benefit Service Years | ) |
Normal retirement age is 65 after five years of service; early retirement can be taken at age 55 after ten years of service. If early retirement is taken, the benefit is reduced by 4% for each year between normal retirement date and the date of retirement.
CEI Supplemental Retirement Plan. All employees who are impacted by the Code limits on compensation under the Pension Plan are automatic participants in the CEI Supplemental Retirement Plan, or the Supplemental Retirement Plan. Of our NEOs, Messrs. Franchi, McKenna and Smith are participants in this plan. The Supplemental Retirement Plan is a non-qualified benefit plan that allows a participant’s creditable compensation for retirement benefit purposes to be calculated without regard to the statutory maximum limit which must be used in calculating benefits under the Pension Plan. The Supplemental Retirement Plan’s benefit formula mirrors that of the Pension Plan for benefit calculation purposes. Upon retirement, Social Security and Medicare taxes are withheld based on the present value of the supplemental benefit. The Supplemental Retirement Plan is an unfunded plan and such benefits will be paid from the general corporate assets of CEI. Under the Supplemental Retirement Plan, CEI allocates expenses to us generally based on actuarial determinations of the value of our employees’ benefits as determined under the plan.
CEI Executive Supplemental Plan. Of our NEOs, Messrs. Perry and Clement are participants in the CEI Executive Supplemental Plan, or the Executive Supplemental Plan, a non-qualified defined benefit pension plan providing supplemental retirement benefits. Messrs. Perry and Clement are grandfathered participants in the Executive Supplemental Plan and no additional ATG participants will be added. Benefits under the Executive Supplemental Plan are payable at retirement, either at age 65 or at any time on or after age 60 with at least twenty years of service, and are determined according to a monthly benefit formula calculated as 2.5% of a participant’s final average compensation, multiplied by the participant’s years of benefit service. The benefit may not exceed 50% of a participant’s final average compensation at retirement. If early retirement is taken, the benefit is reduced 4% per year for each year between eligible retirement date and the date of retirement.
The executive’s retirement benefit is calculated under both the Pension Plan and the Executive Supplemental Plan, and the plan calculation affords that the higher benefit is used. If the higher benefit is payable under the Executive Supplemental Plan, then the executive would receive the benefit payable under the Pension Plan, plus the amount by which the benefit calculated under the Executive Supplemental Plan exceeds the benefit payable under the Pension Plan. The Executive Supplemental Plan is an unfunded plan and such benefits will be paid from the general corporate assets of CEI. Under the Executive Supplemental Plan, CEI allocates expenses to us generally based on actuarial determinations of the value of our employees’ benefits as determined under the plan. Mr. Perry is eligible for early retirement benefits under the plan because he satisfies the age and years of service requirements for early retirement under the plan.
141
Table of Contents
CEI Savings and Investment Plan. Substantially all of our full and part-time employees who work at least 20 hours per week are eligible to participate in the CEI Savings and Investment Plan, or the Savings and Investment Plan, a tax-qualified defined contribution retirement savings plan, often called a 401(k) plan. For 2011, we provided a matching contribution in the amount of 50 cents for every dollar an employee contributed to his or her 401(k) plan, up to 6% of eligible pay, not to exceed 50% of the contribution limits under the Code (50% of the 2011 contribution limit was $8,250). All contributions to the Savings and Investment Plan, including matching contributions, are fully vested. All of our NEOs participated in and made contributions to the Savings and Investment Plan during 2011. Our expenses under this plan were $4.0 million, $4.3 million, $5.0 million, $2.8 million and $3.2 million for the years ended December 31, 2009, 2010 and 2011 and the six months ended June 30, 2011 and 2012, respectively.
ATG Restoration Plan. The ATG Savings Plus Restoration Plan, or the ATG Restoration Plan, is a non-qualified retirement savings plan under which we may credit any amounts in excess of the maximum contribution provided for under the Savings and Investment Plan allowed by the IRS, up to a maximum annual contribution (when combined with the Savings and Investment Plan) equal to 15% of eligible pay. For 2011, we provided a matching contribution in the amount of 50 cents for every dollar an employee contributed to this plan, up to 3% of eligible pay, 50% of the contribution limits under the Code (50% of the 2011 contribution limit was $8,250). If the maximum match was provided under the Savings and Investment Plan, no additional match is provided under the ATG Restoration Plan. Amounts payable under this plan represent our unsecured general obligations. Mr. Smith was the only one of our NEOs who did not participate in the ATG Restoration Plan during 2011.
Other Restoration Plans. CEI and its subsidiaries sponsor non-qualified retirement savings plans and other restoration plans for the benefit of their respective employees. The terms of these other Restoration Plans are substantially identical to those of the ATG Restoration Plan. Some of our NEOs previously have participated in these other plans, continue to have historical balances under those plans, and continue to accrue earnings under those plans. Contributions for our NEOs, including contributions made during 2011 and thereafter, are and will be made solely to the ATG Restoration Plan.
Perquisites and Employee Benefits
Substantially all of our full-time employees are eligible for life, health, and disability insurance through the CEI Flex Plan, and each of our NEOs participated in these benefits during 2011. Benefits and allocations under the CEI Flex Plan are calculated and provided on a non-discriminatory basis to our NEOs and to plan participants generally. In addition, our executives, including our NEOs, also receive certain perquisites and employee benefits in addition to life, health and disability insurance benefits, such as reimbursement of club dues and a company car. We believe that these perquisites and benefits are reasonable and consistent with our overall compensation program. Such perquisites and employee benefits are intended to promote health, wellness, convenience, security and financial protection to our executives in the event of illness, injury, disability or death. The value of these perquisites and the incremental costs of these benefits for 2011 that are attributable to our NEOs are described in more detail in a footnote to the “All Other Compensation” column of the Summary Compensation Table.
Accounting and Tax Considerations
ASC 718 requires us to incur compensation expense over the life of stock options and other stock-based awards. We consider and will continue to consider the effect of compensation expense in granting stock-based awards.
Section 162(m) of the Code, limits the deductibility of compensation in excess of $1 million that we, as a public company, pay to our executive officers, other than our Chief Financial Officer, per year, unless certain requirements are met. The intention of the compensation committee is to preserve the deductibility of
142
Table of Contents
compensation under Section 162(m) to the extent the compensation committee believes that doing so is consistent with our best interests and those of our stockholders. Awards under both the annual incentive plan and the Long-Term Incentive Plan generally are designed to qualify as deductible under Section 162(m).
Compensation Survey Component Companies
For 2011, the component companies in the Croner Digital Content and Technology Survey were as follows:
| A&E Television Networks, LLC Activision Blizzard, Inc. Amazon.com, Inc. American Greetings Corporation AOL Inc. Arc Worldwide, Inc. AT&T Inc. Belk, Inc. Blue Shield of California Life & Health Insurance Company CBS Corporation Cengage Learning, Inc. CBOE Holdings, Inc. Classified Ventures, LLC Comcast Corporation Consumers Union. Cox Enterprises, Inc. Deluxe Corporation Demand Media, Inc. Dex One Corporation Digital Chocolate, Inc. Discovery Communications, Inc. Disney ABC Television Group Disney Interactive Media Group Dow Jones & Company, Inc. Edmunds.com, Inc. eHarmony.com, Inc. Electronic Arts Inc. ESPN, Inc. Esurance, Inc. Expedia, Inc. Experian Information Solutions, Inc. Facebook, Inc. Fox Interactive Media, Inc. Freedom Communications, Inc. GameStop Corp. Gannett Co., Inc. Getty Images, Inc. Gilt Groupe, Inc. Google Inc. GSI Commerce, Inc. Hearst Magazines Home Box Office, Inc. Houghton Mifflin Harcourt Publishing Company |
Hulu, LLC Infospace, Inc. International Data Group, Inc. J. C. Penney Company, Inc. Johnson & Johnson Kelley Blue Book Co., Inc. Kohl’s Corporation LinkedIn Corporation Live Nation Entertainment, Inc. Lowe’s Companies, Inc. MailOnline US Marchex, Inc. Match.com, LLC Mattel, Inc. Mayo Clinic Microsoft Corporation Monster Worldwide, Inc. Morningstar, Inc. MSNBC Interactive News, L.L.C. MTV Networks Company National Football League National Geographic Society NBC Universal, Inc. Newegg Inc. Nordstrom, Inc. Orbitz Worldwide, Inc. OWN: The Oprah Winfrey Network, LLC Pandora Media, Inc. Public Broadcasting Service Publishers Clearing House LLC QVC, Inc. Razorfish, LLC The Reader’s Digest Association, Inc. Recreational Equipment, Inc. Sabre Holdings Corporation Saks Incorporated Salesforce.com, Inc. Scripps Networks Interactive, Inc. Sears Holdings Corporation Sony Computer Entertainment America, LLC Sony Music Entertainment Inc. Sony Pictures Entertainment Inc. Staples, Inc. |
143
Table of Contents
| For 2011, the compensation survey data provided by Pay Governance, Inc. was from the following companies:
| ||
| Amazon.com, Inc. AOL Inc. Automatic Data Processing, Inc. Avanade Inc. Broadcom Corporation Cengage Learning, Inc. Cisco Systems, Inc. Convergys Corporation Dex One Corporation EMC Corporation Fair Isaac Corporation Fidelity National Information Services, Inc. Fiserv, Inc. Getty Images, Inc. Google Inc. GTECH Corporation GXS, Inc. Hewlett-Packard Company Hitachi Data Systems Corporation |
International Business Machines Corporation Infragistics, Inc. Microsoft Corporation Novell, Inc. Omgeo LLC Parametric Technology Corporation Pervasive Software Inc. Razorfish, LLC SAS Institute, Inc. Skype Softtek Sparta Systems, Inc. SRA International, Inc. Synacor, Inc. Teradata Corporation Total System Services, Inc. Unisys Corporation VistaPrint Limited Yahoo! Inc. | |
Summary Compensation Table
The following table sets forth certain information for the year ended December 31, 2011 concerning the total compensation awarded to, earned by or paid to our President and CEO, our Chief Financial Officer, and our other three most highly compensated executive officers. We refer to these individuals in this prospectus as our NEOs.
| Name and Principal Position |
Year | Salary ($) |
Bonus ($)(a) |
Stock Awards ($)(b)(c) |
Option Awards ($)(c) |
Non-Equity Incentive Plan Compensation ($)(d) |
Change in Pension Value and Nonqualified Deferred Compen- sation Earnings ($)(e) |
All Other Compen- sation ($)(f) |
Total ($) |
|||||||||||||||||||||||||||
| Chip Perry |
2011 | 700,000 | 1,000,000 | — | 9,620,976 | 7,368,750 | 889,221 | 32,863 | 19,611,810 | |||||||||||||||||||||||||||
| President and CEO |
||||||||||||||||||||||||||||||||||||
| Dallas S. Clement(g) |
2011 | 446,731 | — | 489,017 | 2,449,620 | 359,686 | 611,102 | 20,776 | 4,376,932 | |||||||||||||||||||||||||||
| Executive Vice President and Chief Financial Officer |
||||||||||||||||||||||||||||||||||||
| James S. Franchi |
2011 | 369,600 | 750,000 | — | 2,449,620 | 1,369,759 | 140,916 | 18,351 | 5,098,246 | |||||||||||||||||||||||||||
| President, Media |
||||||||||||||||||||||||||||||||||||
| Matthew S. McKenna |
2011 | 365,000 | — | — | 2,449,620 | 1,479,072 | 133,761 | 38,711 | 4,466,164 | |||||||||||||||||||||||||||
| Senior Vice President, National Account Sales, AutoTrader.com |
||||||||||||||||||||||||||||||||||||
| Steven Alan Smith |
2011 | 380,000 | — | — | 2,449,620 | 1,695,881 | 170,291 | 22,848 | 4,718,640 | |||||||||||||||||||||||||||
| Executive Vice President; Chief Operating Officer, AutoTrader.com |
||||||||||||||||||||||||||||||||||||
| (a) | In each case, represents a signing or retention bonus paid in accordance with the individual’s respective employment agreement. See “—Employment Agreements.” Mr. Franchi was also subject to an employment agreement at the time his bonus was awarded, but his agreement expired on December 31, 2011. |
144
Table of Contents
| (b) | Represents an amount equal to the grant date fair value ($15.00) of the restricted stock award times the number of shares of our common stock awarded. |
| (c) | Amounts set forth in the “Stock Awards” and “Option Awards” columns represent the aggregate grant date fair value of awards granted in 2011 computed in accordance with the Financial Accounting Standards Board, or FASB, Accounting Standards Codification Topic 718, or FASB ASC Topic 718. For the assumptions made in the valuation of the awards, see Note 14, “Long-Term Incentive Compensation,” to our audited financial statements included elsewhere in this prospectus. For information on 2012 adjustments related to stock option and stock appreciation right grants, see “Management’s Discussion and Analysis of Financial Condition and Results of Operations—Critical Accounting Policies and Estimates—Long-Term Incentive Compensation—Adjustment of Stock Options and Stock Appreciation Rights.” This table does not reflect such adjustments. |
| (d) | Amount represents the annual incentive awards earned in 2011 and the amount paid pursuant to performance units, which are performance-based cash awards that were granted in 2009 and vested on December 31, 2011 and are described above under “—Long-Term Incentive Awards—Performance Units.” Mr. Perry received $582,750 under the annual incentive program and $6,786,000 under his performance units. Mr. Clement received $359,686 under the annual incentive program and was not a participant in the performance plan. Mr. Franchi received $230,314 under the annual incentive program and $1,139,445 under his performance units. Mr. McKenna received $222,833 under the annual incentive program and $1,256,239 as his performance award. Mr. Smith received $231,990 under the annual incentive program and $1,463,891 under his performance units. |
| (e) | Messrs. Perry and Clement participate in the Pension Plan and the Executive Supplemental Plan. For 2011, the aggregate increase in the value of Mr. Perry’s benefits under those plans was $875,824; the aggregate increase in Mr. Clement’s benefit was $585,091. Messrs. Franchi, McKenna and Smith participate in the Pension Plan and the Supplemental Retirement Plan, a non-qualified pension plan. The aggregate increases in their corresponding benefits thereunder were $133,650, $127,567 and $170,291, respectively. In addition, our NEOs other than Mr. Smith participate in the ATG Restoration Plan, a non-qualified deferred compensation plan. That plan is an account balance plan under which interest is credited at a rate set annually by a committee comprised of executives of CEI and our chief financial officer. In 2011, the ATG Restoration Plan accounts were credited with earnings at a rate of 6%, which was in excess of the applicable federal long-term rate of 4.57%. For 2011, above-market earnings credited to accounts under the ATG Restoration Plan were as follows for Messrs. Perry, Clement, Franchi and McKenna, respectively: $13,397, $26,011, $7,266 and $6,194. |
| (f) | All other compensation for our NEOs consisted of the following for 2011: |
| Name |
Auto | Special Travel Award |
Club Dues |
Gas Allowance |
Registrant Contribu- tions to Defined Contribu- tion Plans |
Life Insurance Premiums |
Long- Term Disability Insurance Premiums |
Total | ||||||||||||||||||||||||
| Chip Perry |
$ | 8,231 | — | $ | 8,962 | — | $ | 8,250 | $ | 5,610 | $ | 1,810 | $ | 32,863 | ||||||||||||||||||
| Dallas S. Clement |
$ | 11,069 | — | — | — | $ | 6,533 | $ | 1,364 | $ | 1,810 | $ | 20,776 | |||||||||||||||||||
| James S. Franchi |
$ | 8,599 | — | — | $ | 540 | $ | 8,250 | $ | 962 | — | $ | 18,351 | |||||||||||||||||||
| Matthew S. McKenna |
$ | 21,051 | — | $ | 7,932 | $ | 540 | $ | 8,250 | $ | 938 | — | $ | 38,711 | ||||||||||||||||||
| Steven Alan Smith |
$ | 10,368 | $ | 4,154 | — | — | $ | 7,350 | $ | 976 | — | $ | 22,848 | |||||||||||||||||||
| (g) | Mr. Clement has served as our Chief Financial Officer since February 7, 2011. Between January 1, 2011 and February 7, 2011, we did not employ a Chief Financial Officer, principal financial officer or any executive officer acting in a similar capacity. |
Grants of Plan-Based Awards Table
The following table sets forth all plan-based awards granted to our NEOs during the year ended December 31, 2011.
| Name |
Grant Date | Estimated Future Payouts Under Non-Equity Incentive Plan Awards |
All Other Stock Awards: Number of Shares of Stock or Units (#)(b)(c) |
All Other Option Awards: Number of Securities Underlying Options (#)(c)(d) |
Exercise or Base Price of Option Awards ($/Sh)(c) |
Grant Date Fair Value of Stock and Option Awards(d) |
||||||||||||||||||||||||||
| Threshold ($) |
Target ($)(a) |
Maximum ($)(a) |
||||||||||||||||||||||||||||||
| Chip Perry |
3/15/2011 | — | — | — | — | 869,200 | 15.00 | 5,786,699 | ||||||||||||||||||||||||
| Chip Perry |
10/3/2011 | — | 525,000 | 1,050,000 | — | 597,472 | 15.00 | 3,834,277 | ||||||||||||||||||||||||
| Dallas S. Clement |
5/13/2011 | — | 312,712 | 625,423 | 32,612 | 372,000 | 15.00 | 2,938,637 | ||||||||||||||||||||||||
| James S. Franchi |
5/13/2011 | — | 203,280 | 406,560 | — | 372,000 | 15.00 | 2,449,620 | ||||||||||||||||||||||||
| Matthew S. McKenna |
5/13/2011 | — | 200,750 | 401,500 | — | 372,000 | 15.00 | 2,449,620 | ||||||||||||||||||||||||
| Steven Alan Smith |
5/13/2011 | — | 209,000 | 418,000 | — | 372,000 | 15.00 | 2,449,620 | ||||||||||||||||||||||||
145
Table of Contents
| (a) | Represents target and maximum payout under the annual incentive award program for the calendar year ended December 31, 2011. Amount actually earned is included in the Summary Compensation Table. |
| (b) | Represents a grant of restricted stock which will vest fully on December 31, 2013 subject to Mr. Clement’s employment with us through such date, and pursuant to which Mr. Clement is entitled to receive dividends with respect to the shares of restricted stock. |
| (c) | For information on 2012 adjustments related to stock option and stock appreciation right grants, see “Management’s Discussion and Analysis of Financial Condition and Results of Operations—Critical Accounting Policies and Estimates—Long-Term Incentive Compensation—Adjustment of Stock Options and Stock Appreciation Rights.” This table does not reflect such adjustments. |
| (d) | Half of the options vest based on continual service and the other half vest based on our meeting annual OFCF goals. Following our initial public offering, or IPO, the options vest 20% per year as of December 31 of each year, from the date of grant. If the IPO occurs prior to December 31, 2013 a portion of the options is accelerated to become vested as of the IPO date to equal the amount which would have been vested as of the December 31st prior to the IPO date. The options have a ten-year term. To the extent that any of the annual OFCF goals are not achieved, there is an opportunity to make up any unearned options at the end of the award term based on cumulative OFCF results. |
| (e) | Amounts set forth in this column for stock awards and option awards represent the aggregate grant date fair value of awards granted in 2011 computed in accordance with FASB ASC Topic 718. For the assumptions made in the valuation of the awards, see Note 14, “Long-Term Incentive Compensation,” to our audited financial statements included elsewhere in this prospectus. |
Outstanding Equity Awards Table
The following table sets forth certain information about outstanding equity awards held by our NEOs as of December 31, 2011.
| Option Awards | Stock Awards | |||||||||||||||||||||||
| Name |
Number of Securities Underlying Unexercised Options (#) Unexercis- able(a)(b) |
Equity Incentive Plan Awards: Number of Securities Underlying Unexercised Unearned Options (#)(b)(c) |
Option Exercise Price ($)(b) |
Option Expiration Date(d) |
Number of Shares or Units of Stock That Have Not Vested (#)(b)(e) |
Market Value of Shares or Units of Stock That Have Not Vested ($)(b)(f) |
||||||||||||||||||
| Chip Perry |
880,004 | 586,668 | 15.00 | 12/31/2020 | — | — | ||||||||||||||||||
| Dallas S. Clement |
223,200 | 148,800 | 15.00 | 12/31/2020 | 32,612 | 650,854 | ||||||||||||||||||
| James S. Franchi |
223,200 | 148,800 | 15.00 | 12/31/2020 | — | — | ||||||||||||||||||
| Matthew S. McKenna |
223,200 | 148,800 | 15.00 | 12/31/2020 | — | — | ||||||||||||||||||
| Steven Alan Smith |
223,200 | 148,800 | 15.00 | 12/31/2020 | — | — | ||||||||||||||||||
| (a) | Represents all time-based options and 20% of the performance-based options granted. Following our IPO, the time-based options vest 20% per year as of December 31 of each year, from the date of grant. If the IPO occurs prior to December 31, 2013 a portion of the time-based options is accelerated to become vested as of the IPO date to equal the amount which would have been vested as of the December 31st prior to the IPO date. The performance-based options that relate to 2011 OFCF performance will become vested as of the date of our IPO. |
| (b) | For information on the 2012 stock split. See “Prospectus Summary—Recent Developments—Amendment to Certificate of Incorporation and Stock Split.” |
146
Table of Contents
| (c) | Represents the remaining 80% of the performance-based options granted (40% of the total award) subject to annual OFCF goals. Following our IPO, 20% of the total performance-based options granted may vest for each of 2012, 2013, 2014 and 2015 if performance conditions are met. |
| (d) | Options expire December 31, 2020 in the event of an IPO. |
| (e) | Represents a grant of restricted stock which will vest fully on December 31, 2013 subject to Mr. Clement’s employment with us through such date. |
| (f) | Represents the fair market value at December 31, 2011 ($19.96) times the number of shares issued as the restricted stock award. |
147
Table of Contents
Pension Benefits Table
The following table shows for each of our NEOs the aggregate increase in actual value of all defined benefit plans accrued during the year ended December 31, 2011, which includes increases in value due to additional year(s) of service, compensation increases, gain in investment value as well as interest rate and assumption changes. The valuation method used to quantify the present value of the current accrued value utilizes the following assumptions:
| Ÿ | For December 31, 2011, an interest rate equal to 5.10%, and post-retirement RP-2000 mortality for males and females projected to 2015, with a white collar adjustment utilized for the Supplemental Retirement Plan and Executive Supplemental Plan, and an interest rate of 5.30%, and post-retirement RP-2000 mortality for males and females projected to 2015, with no white collar adjustment utilized for the Pension Plan; |
| Ÿ | For December 31, 2010, an interest rate equal to 5.65%, and post-retirement RP-2000 mortality for males and females projected to 2015, with a white collar adjustment utilized for the Supplemental Retirement Plan and Executive Supplemental Plan, and an interest rate of 5.85%, and post-retirement RP-2000 mortality for males and females projected to 2015, with no white collar adjustment utilized for the Pension Plan. |
| Name |
Plan Name |
Number of Years Credited Service (#) |
Present Value of Accumulated Benefit ($) |
|||||||
| Chip Perry(a) |
Pension Plan | 14 | 432,672 | |||||||
| Executive Supplemental Plan | 14 | 3,349,720 | ||||||||
| Dallas S. Clement |
Pension Plan | 22 | 416,932 | |||||||
| Executive Supplemental Plan | 22 | 3,053,683 | ||||||||
| James S. Franchi |
Pension Plan | 9 | 157,377 | |||||||
| Supplemental Retirement Plan | 9 | 172,246 | ||||||||
| Matthew S. McKenna |
Pension Plan | 12.25 | 148,151 | |||||||
| Supplemental Retirement Plan | 9 | 207,067 | ||||||||
| Steven Alan Smith |
Pension Plan | 13 | 210,344 | |||||||
| Supplemental Retirement Plan | 13 | 289,277 | ||||||||
| (a) | Mr. Perry is eligible for early retirement under both the Pension Plan and the Executive Supplemental Plan. The early retirement payment and benefit calculations applicable to these plans are described under “—Retirement and Other Benefits.” |
148
Table of Contents
Non-Qualified Deferred Compensation Table
The following table shows contributions, earnings, balance and distributions under the ATG Restoration Plan and, as applicable, restoration plan(s) sponsored by CEI or its other subsidiaries, or the Other Restoration Plans.
| Executive Contributions in Last FY ($) |
Company Contributions in Last FY ($) |
Aggregate Earnings in Last FY ($) |
Aggregate Balance at Last FYE ($) |
|||||||||||||||||||||||||||||||||||||
| Name |
ATG Restor- ation Plan |
Other Restor- ation Plan(s) |
ATG Restor- ation Plan |
Other Restor- ation Plan(s) |
ATG Restor- ation Plan |
Other Restor- ation Plan(s) |
Total | ATG Restor- ation Plan |
Other Restor- ation Plan(s) |
Total | ||||||||||||||||||||||||||||||
| Chip Perry |
151,608 | — | 900 | — | 27,646 | 27,239 | 54,885 | 534,838 | 477,503 | 1,012,341 | ||||||||||||||||||||||||||||||
| Dallas S. Clement(a) |
156,994 | 8,012 | — | 900 | 6,145 | 100,522 | 106,667 | 163,139 | 1,762,998 | 1,926,137 | ||||||||||||||||||||||||||||||
| James S. Franchi |
387,127 | — | 900 | — | 28,755 | 414 | 29,169 | 588,218 | 7,256 | 595,474 | ||||||||||||||||||||||||||||||
| Matthew S. McKenna |
96,219 | — | 900 | — | 18,843 | 6,533 | 25,376 | 365,695 | 114,532 | 480,227 | ||||||||||||||||||||||||||||||
| Steven Alan Smith |
— | — | — | — | — | — | — | — | — | — | ||||||||||||||||||||||||||||||
| (a) | Prior to joining us, Mr. Clement was an executive officer at CCI, a wholly-owned subsidiary of CEI, and prior to that he was an executive officer at CEI, our parent, and was therefore enrolled in a CCI Restoration Plan and a CEI Restoration Plan, respectively. |
The amounts reported as company contributions for each of our NEOs are also reported as compensation to each such officer in the “Salary” and “Bonus” columns of the Summary Compensation Table.
The above-market portion of earnings for each plan is reported in footnote (e) to the Summary Compensation Table.
Earnings on amounts contributed to the ATG Restoration Plan and the Other Restoration Plans are calculated at an annual fixed rate of not less than 5%, which is established annually by the management committees of ATG and CEI. For 2011, the rate for each of the restoration plans was set at 6%. For additional information regarding the Restoration Plans, including information regarding types and limitation on eligible compensation and material terms regarding payouts and distributions, see “—Compensation Discussion and Analysis—Retirement and Other Benefits,” and “—Potential Payments Upon Termination or Change-in-Control—Benefits Payable Under the Restoration Plans.”
Employment Agreements
The only NEO with whom we have an employment agreement is Chip Perry, our President and CEO. We have entered into employment arrangements with Keith A. Jezek, President, Software; Dale Pollak, Senior Vice President and vAuto Founder; and Jared Rowe, President, Kelley Blue Book.
Chip Perry—President and CEO
We entered into an amended and restated employment agreement with Mr. Perry in October 2011. The employment agreement expires on December 31, 2015. Mr. Perry currently receives an annual salary of $726,000 and is eligible under his employment agreement to receive in cash (i) an annual target bonus amount, ranging from 0%-150% of his base salary (with a target of 75% of his base salary), subject to the terms of our annual bonus plan; (ii) a retention bonus of $1 million payable annually before each of the following dates: December 31, 2012, December 31, 2013, December 31, 2014 and December 31, 2015, provided that he does not voluntarily terminate his employment other than for good reason and we do not terminate his employment for cause prior to the end of any such calendar year; and (iii) a success bonus of
149
Table of Contents
$1 million if a definitive agreement for a sale of the company is entered into prior to December 31, 2015, such transaction subsequently closes, and he has not voluntarily terminated his employment other than for good reason or his employment has not been terminated by us for cause before such date (an IPO does not constitute a sale of the company for this purpose). In addition, Mr. Perry was paid a signing bonus of $1 million within 30 days following the execution of his amended and restated employment agreement.
As part of his employment agreement, Mr. Perry also was granted an award under our Long-Term Incentive Plan to purchase 1,466,672 shares of our Class A common stock with an exercise price of $15.00 and a term of ten years if the company becomes publicly traded prior to December 31, 2015 (or on December 31, 2015 if our stock is not publicly traded as of such date). These options were granted in addition to Mr. Perry’s other existing stock holdings and outstanding long-term incentive awards. For information on 2012 adjustments related to stock option and stock appreciation right grants, see “Management’s Discussion and Analysis of Financial Condition and Results of Operations—Critical Accounting Policies and Estimates—Long-Term Incentive Compensation—Adjustment of Stock Options and Stock Appreciation Rights.”
The options vest according to the following schedule:
| Ÿ | Time-Based. 50% of his options vest if he remains employed by us in accordance with the following schedule: |
| Company Stock Not Publicly Traded |
Company Stock Publicly Traded |
|||||||
| December 31, 2011 |
0 | % | 20 | % | ||||
| December 31, 2012 |
0 | % | 40 | % | ||||
| December 31, 2013 |
60 | % | 60 | % | ||||
| December 31, 2014 |
80 | % | 80 | % | ||||
| December 31, 2015 |
100 | % | 100 | % | ||||
If the Company’s stock becomes publicly traded prior to December 31, 2013 and he is continuously employed as of the date the stock is publicly traded, the vesting of these options will accelerate so that the vested amount as of such date will be equal to the amount which would have been vested as of the December 31 prior to such date had the stock been publicly traded since the grant date. These options will become 100% vested if his employment is terminated by reason of his death or disability.
| Ÿ | Performance-Based. 50% of his options vest if certain performance-based criteria are met and he remains in continuous employment with us as of the end of each year: (i) If the Company’s stock is not publicly traded, (A) he has the opportunity to become vested up to 60% in such options on December 31, 2013 if the Company attains its OFCF goal for each of 2011, 2012 and 2013, as established in the 2011-2015 long range plan, and (B) he has the opportunity to become vested in 20% of such options in each of 2014 and 2015 if the Company attains its OFCF goal for such year; (ii) If the Company’s stock is publicly traded, he may become vested in 20% of his options for each of 2011-2015 if the Company attains its OFCF goal for each such year. If his employment is terminated by reason of his death or disability, any options for which he had an opportunity to become vested will become 100% vested as of the date of termination. |
For information regarding Mr. Perry’s entitlements upon termination by us without cause or if he terminates his employment for good reason or upon a change-in-control, see “—Potential Payments Upon Termination or Change-in-Control” below.
Mr. Perry’s employment agreement also contains non-competition, non-solicitation of customers and employees and non-disparagement provisions for the period of his employment and for 24 months thereafter, as well as confidentiality and intellectual property provisions.
150
Table of Contents
Keith A. Jezek—President, Software
We entered into an employment and non-competition agreement with Mr. Jezek, as of October 15, 2010. The employment agreement expires on December 31, 2012. Mr. Jezek currently receives an annual salary of $400,000 and is eligible for a target bonus of $220,000 and a maximum bonus of $440,000 provided we meet certain objectives, which target range is higher than that provided under his agreement. Under his employment agreement he was eligible to receive, for 2011, an annual target bonus in an amount no less than $150,000 and a maximum bonus in an amount no less than $300,000 provided we met certain objectives. Mr. Jezek also is eligible to participate in a long-term incentive program providing incentive compensation on the same basis as similarly situated officers and executives of vAuto. vAuto may terminate Mr. Jezek’s employment without cause upon 15 business days’ prior notice to him. In the event his employment is terminated by us without cause or he terminates his employment for good reason: (i) Mr. Jezek is entitled to receive severance pay in an amount equal to his base salary, in effect as of his termination date, for a period equal to the greater of 12 months and the remainder of the term; and (ii) vAuto is required to pay the employer portion of his healthcare and dental care premiums for the shorter of 12 months or until he ceases to be eligible for participation in such plans under COBRA. Payment of such amounts is subject to Mr. Jezek entering into a release of all claims arising under or in connection with his employment and termination of employment with vAuto. Mr. Jezek’s employment agreement also contains non-competition and non-solicitation of customers and employees provisions for the period of his employment and for 24 months thereafter, as well as confidentiality and intellectual property provisions.
Dale Pollak—Senior Vice President; vAuto Founder
We entered into an employment and non-competition agreement with Mr. Pollak, the Founder of vAuto, as of October 15, 2010. The employment agreement expires on December 31, 2012. In recognition of his leadership, Mr. Pollak currently receives an annual salary of $400,000 and is eligible for a target bonus of $220,000 and a maximum bonus of $440,000 provided we meet certain objectives, which target range is higher than that provided under his agreement. Under his employment agreement he was eligible to receive, for 2011, an annual target bonus in an amount no less than $150,000 and a maximum bonus in an amount no less than $300,000 provided we met certain objectives. Mr. Pollak also is eligible to participate in a long-term incentive program providing incentive compensation on the same basis as similarly situated officers and executives of vAuto. vAuto may terminate Mr. Pollak’s employment without cause upon 15 business days’ prior notice to him. In the event his employment is terminated by us without cause or he terminates his employment for good reason: (i) Mr. Pollak is entitled to receive severance pay in an amount equal to his base salary, in effect as of his termination date, for a period equal to the greater of 12 months and the remainder of the term; and (ii) vAuto is required to pay the employer portion of his healthcare and dental care premiums for the shorter of 12 months or until he ceases to be eligible for participation in such plans under COBRA. Payment of such amounts is subject to Mr. Pollak entering into a release of all claims arising under or in connection with his employment and termination of employment with vAuto. Mr. Pollak’s employment agreement also contains non-competition and non-solicitation provisions for the period of his employment and for 24 months thereafter, as well as confidentiality and intellectual property provisions.
Jared Rowe—President, Kelley Blue Book
We entered into a restrictive covenant and confidentiality agreement with Mr. Rowe, as of August 27, 2010, which contains non-competition, non-solicitation of customers and employees and confidentiality provisions for the period of his employment and for one year thereafter, as well as intellectual property provisions. Mr. Rowe is employed by us on an at-will basis. However, his agreement provides that if he is terminated by us without cause, he will be entitled to receive (i) severance pay equal to 12 months of his then-current base salary plus a pro-rated portion of his
151
Table of Contents
target annual cash bonus in effect at the time of his termination, payable in installments over a 12-month period coinciding with the our normal payroll schedule; and (ii) continuation of his healthcare benefits at our cost for up to 12 months. Payment of such amounts is subject to Mr. Rowe entering into a release of all claims against us. In the event the company is sold to a third-party, any outstanding long-term incentive awards held by Mr. Rowe at that time under our long-term incentive plan(s) will become fully vested as of such date, provided Mr. Rowe has not voluntarily terminated his employment with us and has not been terminated by us for cause on or before the date the definitive purchase agreement has been entered into.
Potential Payments Upon Termination or Change-in-Control
The following describes the estimated benefits under the specified plan or program that would be provided to each of our NEOs in the event of a termination of employment, including voluntary termination, involuntary termination without cause, termination for cause, and termination upon death, disability or retirement.
Benefits Available Generally to all Salaried Employees
Regardless of the manner in which the executive’s employment terminates, each of our NEOs is entitled to receive the following benefits under plans, programs or arrangements generally available to all salaried employees of us who are automatically eligible for, or who have elected to participate in, such plans, programs or arrangements:
| Ÿ | unused accrued vacation pay; and |
| Ÿ | retirement savings benefits under the Savings and Investment Plan. |
In addition, if an executive’s employment terminates by reason of death or disability, each would be entitled to receive the following benefits:
| Ÿ | long-term disability benefits under the CEI Flex Plan; and |
| Ÿ | life insurance benefits under the CEI Flex Plan. |
In the event of an executive’s retirement, each would be entitled to receive the following benefit:
| Ÿ | health benefits under the CEI retiree healthcare plan. |
Annual Incentive Awards
Awards under the annual incentive award program normally are contingent upon employment through the end of the year. However, assuming termination on December 31, 2011 for any reason other than for cause, each of our NEOs would have been entitled to the full amount of their annual incentive payments, which are disclosed in the “Non-Equity Incentive Plan Compensation” column of the Summary Compensation Table. In the event of termination for cause, normally no amount would be payable under the annual incentive award.
Long-Term Incentive Awards
For termination for cause, each of our NEOs forfeits any:
| Ÿ | vested and unvested stock options; |
| Ÿ | unvested restricted stock; and |
| Ÿ | vested and unvested performance awards. |
152
Table of Contents
For voluntary or without cause termination, each of our NEOs forfeits any:
| Ÿ | unvested stock options; |
| Ÿ | unvested restricted stock; and |
| Ÿ | unvested portion of performance awards. |
For termination due to retirement each of our NEOs:
| Ÿ | forfeits any unvested stock options; |
| Ÿ | forfeits any unvested restricted stock; and |
| Ÿ | receives immediate full vesting of any unvested performance awards. |
For termination due to death or disability, each of our NEOs receives immediate full vesting of any:
| Ÿ | time vested stock options; |
| Ÿ | performance options in which the opportunity to become vested was achieved; |
| Ÿ | unvested restricted stock; and |
| Ÿ | unvested performance awards. |
In the event of a change-in-control, performance awards become 100% vested. We do not have any other change-in-control provisions for our NEOs, except in the case of Mr. Perry as provided for in his employment agreement and detailed below.
Mr. Perry’s employment agreement with us contains the following material terms in connection with termination or Change-in-Control (as defined below) and values assuming a December 31, 2011 termination date:
For termination by us without cause, or by Mr. Perry for good reason (as defined in his employment agreement), Mr. Perry will:
| Ÿ | receive severance pay in the sum of $2,500,000 payable in equal installments at intervals over a period of 24 months; |
| Ÿ | receive a lump sum cash payment equal to a pro rata Target Bonus (as defined in his employment agreement) for the year in which termination occurs; |
| Ÿ | forfeit any unvested stock options; |
| Ÿ | receive a lump sum cash payment equal to any Retention Bonuses (as defined in his employment agreement) otherwise payable during the 24 months following the termination date; and |
| Ÿ | be provided with healthcare benefits continuation for a period of 24 months. |
In the event of a Change-in-Control, which is defined in Mr. Perry’s employment agreement as an event in which we seek to sell AutoTrader.com to a third-party or parties (whether by merger, sale of stock, sale of assets or otherwise), Mr. Perry’s agreement may be assigned to the surviving entity, in which case, no benefits payments would be triggered at the time of the Change-in-Control. However, if the agreement was not assigned to the surviving entity and Mr. Perry was terminated without cause (i.e., a double trigger arrangement), Mr. Perry would be entitled to the benefits as described above as well as a lump sum cash bonus in the amount of $1,000,000 within 30 days of closing.
153
Table of Contents
Benefits Payable Under the Restoration Plans
In the event of termination of employment for any reason, each of our NEOs would be entitled to a distribution based on their then-current account balance under the restoration plans as provided for under the terms of the restoration plans, with no enhancement or diminution of benefit based on reason for termination, including change-in-control. The account balances for each of our NEOs under the Restoration Plans as of December 31, 2011 are shown above in the Nonqualified Deferred Compensation Table.
Restoration Plans
ATG Restoration Plan. Participants in the ATG Restoration Plan who terminate their employment with us for any reason other than retirement (as defined in the Pension Plan), will be paid in a lump sum distribution. For participants who terminate due to retirement, (as defined in the Pension Plan), balances of $10,000 or less are paid in a lump sum distribution, and balances of greater than $10,000 are payable in annual installments over a five-year period.
Other Restoration Plans. To the extent permitted under Section 409A of the Code, the distribution provisions under each of the Other Restoration Plans in the event of termination of employment vary based on the amount to be distributed, the age of the participant, and when the balance under the plans accrued. For balances accrued prior to January 1, 2005, if any, balances of $5,000 or less are paid in a lump sum distribution, and balances of greater than $5,000 for participants under age 65 are payable when the participant reaches age 65, subject to the participant’s right to request accelerated payment with our consent. Upon reaching age 65, the participant is required to take distribution in a lump sum payment, subject to the participant’s right to request annual installment payments over five, ten or fifteen years with our consent. For balances accrued on or after January 1, 2005, participants who terminate for any reason other than retirement (as defined in the Pension Plan), will be paid in a lump sum distribution. For participants who terminate based on retirement, (as defined in the Pension Plan), balances of $10,000 or less are paid in a lump sum distribution, and balances of greater than $10,000 are payable in annual installments over a five-year period.
Pension Plan, Executive Supplemental Plan and Supplemental Retirement Plan
In the event of retirement or termination of employment for any reason, each of our NEOs who were eligible to participate in the Pension Plan, the Executive Supplemental Plan or the Supplemental Retirement Plan, as of December 31, 2011, would be vested in their benefit under the Pension Plan, the Executive Supplemental Plan or the Supplemental Retirement Plan, as applicable. In accordance with the process described above under “—Retirement and Other Benefits,” the benefits for Messrs. Clement and Perry are calculated pursuant to the Executive Supplemental Plan, as that calculation affords a higher benefit than the Pension Plan and Supplemental Retirement Plan.
In the event of termination for any reason other than death or disability, the benefit under the Pension Plan and the Executive Supplemental Plan would be as follows: Mr. Perry, who is retirement eligible, would receive a monthly annuity of $26,660 beginning immediately following the termination date. Mr. Clement would receive a monthly annuity of $21,128 beginning at age 55. The benefit under the Pension Plan and the Supplemental Retirement Plan would be a monthly annuity payable to Messrs. Franchi, McKenna and Smith, beginning at age 55, of $2,824, $3,214 and $4,599, respectively.
In the event of death on December 31, 2011, a benefit would have been payable as a lump sum to Messrs. Clement, Perry, Franchi and McKenna as follows: $3,095,126, $2,808,702, $157,979 and $186,782, respectively. Mr. Smith is single, and there would be no death benefit. In each situation, if a death benefit becomes payable, the voluntary termination retirement benefit or other retirement benefit described above would cease.
154
Table of Contents
In the event of disability as of December 31, 2011, Messrs. Clement and Perry would receive payments pursuant to the Executive Supplemental Plan during the first year of disability equaling 100% of base salary, as follows: $530,250 and $726,000, respectively. Following the first year, these participants would be eligible to receive a monthly disability benefit under the Executive Supplemental Plan in the following amounts: Mr. Clement $50,707 until age 65 and $42,256 each month thereafter; Mr. Perry $58,592 until age 65 and $34,179 each month thereafter. In the event of disability as of December 31, 2011, Messrs. Franchi, McKenna and Smith would be eligible to receive immediate benefits from CEI’s broad-base Long-Term Disability program until age 65, followed by a monthly benefit from the Pension Plan and the Supplemental Retirement Plan of $11,296, $12,856 and $18,396, respectively.
Potential Payments Upon Termination or Change-in-Control
The table below details the amounts payable assuming termination effective December 31, 2011. Any actual amounts to be paid can be determined only at the time of such executive’s termination of employment. As of December 31, 2011, Mr. Perry was the only officer eligible to retire and therefore, we have not included retirement values for any other officer. Long-term incentive plan amounts are based on the following December 31, 2011 values: stock price of $79.83, performance award value of 78.3 per unit. Amounts will be paid in a lump sum, except as indicated above for Mr. Perry.
Chip Perry
| Benefit |
Voluntary | Death | Disability | Retirement | Without Cause |
Change-in- Control |
Good Reason |
|||||||||||||||||||||
| Annual Incentive |
$ | 582,750 | $ | 582,750 | $ | 582,750 | $ | 582,750 | $ | 582,750 | $ | 582,750 | $ | 582,750 | ||||||||||||||
| Long-Term Incentive Plan |
||||||||||||||||||||||||||||
| Stock Option Award |
— | $ | 4,367,020 | $ | 4,367,020 | — | — | — | — | |||||||||||||||||||
| Performance Award |
$ | 516,623 | $ | 1,291,559 | $ | 1,291,559 | $ | 1,291,559 | $ | 516,623 | $ | 1,291,559 | $ | 516,623 | ||||||||||||||
| Severance Pay |
— | — | — | — | $ | 2,500,000 | $ | 2,500,000 | $ | 2,500,000 | ||||||||||||||||||
| Bonus |
— | — | — | — | — | $ | 1,000,000 | — | ||||||||||||||||||||
| Retention Bonus |
— | — | — | — | $ | 2,000,000 | $ | 2,000,000 | $ | 2,000,000 | ||||||||||||||||||
Dallas S. Clement
| Benefit |
Voluntary | Death | Disability | Without Cause |
Change-in- Control |
|||||||||||||||
| Annual Incentive |
$ | 359,686 | $ | $359,686 | $ | 359,686 | $ | 359,686 | $ | 359,686 | ||||||||||
| Long-Term Incentive Plan |
||||||||||||||||||||
| Stock Option Award |
— | $ | 1,107,630 | $ | 1,107,630 | — | — | |||||||||||||
| Restricted Stock Award |
— | $ | 650,854 | $ | 650,854 | — | — | |||||||||||||
| Performance Award |
$ | 361,245 | $ | 903,112 | $ | 903,112 | $ | 361,245 | $ | 903,112 | ||||||||||
James S. Franchi
| Benefit |
Voluntary | Death | Disability | Without Cause |
Change-in- Control |
|||||||||||||||
| Annual Incentive |
$ | 230,314 | $ | 230,314 | $ | 230,314 | $ | 230,314 | $ | 230,314 | ||||||||||
| Long-Term Incentive Plan |
||||||||||||||||||||
| Stock Option Award |
— | $ | 1,107,630 | $ | 1,107,630 | — | — | |||||||||||||
| Performance Award |
$ | 169,754 | $ | 424,386 | $ | 424,386 | $ | 169,754 | $ | 424,386 | ||||||||||
Matthew S. McKenna
| Benefit |
Voluntary | Death | Disability | Without Cause |
Change-in- Control |
|||||||||||||||
| Annual Incentive |
$ | 222,833 | $ | 222,833 | $ | 222,833 | $ | 222,833 | $ | 222,833 | ||||||||||
| Long-Term Incentive Plan |
||||||||||||||||||||
| Stock Option Award |
$ | — | $ | 1,107,630 | $ | 1,107,630 | — | — | ||||||||||||
| Performance Award |
$ | 169,754 | $ | 424,386 | $ | 424,386 | $ | 169,754 | $ | 424,386 | ||||||||||
155
Table of Contents
Steven Alan Smith
| Benefit |
Voluntary | Death | Disability | Without Cause |
Change-in- Control |
|||||||||||||||
| Annual Incentive |
$ | 231,990 | $ | 231,990 | $ | 231,990 | $ | 231,990 | $ | 231,990 | ||||||||||
| Long-Term Incentive Plan |
||||||||||||||||||||
| Stock Option Award |
— | $ | 1,107,630 | $ | 1,107,630 | — | — | |||||||||||||
| Performance Award |
$ | 169,754 | $ | 424,386 | $ | 424,386 | $ | 169,754 | $ | 424,386 | ||||||||||
Director Compensation
We did not pay any compensation to our directors for the year ended December 31, 2011.
Our employee directors and our directors who are employed by CEI or any of its affiliates or the Providence Funds will not receive any compensation in the future, except as limited to expense reimbursement. Each of our non-employee directors who are not employed by CEI, Providence Equity Partners or any of their respective affiliates will be entitled to receive an annual retainer of $200,000, consisting of $40,000 in cash and $160,000 in restricted stock. The cash retainer will be paid, and the restricted stock will be granted, to each director on the first business day following the annual meeting at which directors are elected; provided, however, that in the event a non-employee director is appointed during the year, such director will receive a pro rata portion of the cash retainer and restricted stock award on the first business day of the month following such appointment.
The awards of restricted stock are granted pursuant to the terms of the our Director Restricted Stock Plan, and vest on the one-year anniversary of the grant date, provided the director does not leave the Board during his or her term of service. A director who stops serving on the Board prior to vesting will forfeit his or her restricted stock, unless his or her cessation of service is due to his or her death. The number of shares of restricted stock awarded to each director is based on the fair market value of our Class A common stock as of the grant date.
Mr. Olin received $30,000 in cash and was granted 6,012 shares of restricted stock as his initial board retainer.
In addition to the $200,000 annual retainer, each non-employee director who serves on a committee of our Board also receives an additional cash retainer, as set forth in the table below. The amount of such retainer is based on which committee the director serves on and whether the director chairs such committee.
| Committee |
Annual Chair Retainer |
Annual Member Retainer |
||||||
| Audit Committee |
$ | 20,000 | $ | 10,000 | ||||
| Compensation Committee |
$ | 15,000 | $ | 7,500 | ||||
| Executive Committee |
$ | 15,000 | $ | 7,500 | ||||
| Related Party Committee |
$ | 15,000 | $ | 7,500 | ||||
In the event that a non-employee director is appointed to a committee or the director’s committee designation changes during the year, his or her compensation will be adjusted accordingly on a pro rata basis.
156
Table of Contents
CERTAIN RELATIONSHIPS AND RELATED PERSON TRANSACTIONS
Set forth below is a description of certain relationships and related person transactions between us or our subsidiaries, and our directors, executive officers and holders of more than 5% of our voting securities. We believe that all of the following transactions were entered into with terms as favorable as could have been obtained from unaffiliated third parties.
Stock Purchase Agreement
In connection with the Providence Investment, on May 5, 2010, we entered into a stock purchase agreement, with the Providence Funds, KPCB Holdings, Inc., or KP, and certain Class A stockholders, pursuant to which Providence Equity Partners purchased shares of our Class A common stock for $537.5 million from certain stockholders, which represented a 25% stake in us at the time of the closing of the Providence Investment.
Stockholders Agreement
In connection with the Providence Investment, on June 15, 2010, ATC, the Providence Funds, CEI, KP and certain Class A stockholders, including Manheim, entered into an amended and restated stockholders agreement, as amended on October 14, 2010 and June 14, 2012, or Stockholders Agreement, whereby we agreed not to undertake certain actions without Providence Equity Partners’ consent and agreed to certain transfer restrictions on our shares. In addition, the stockholders have the right to tag along on any sale of Class A common stock by Manheim, subject to a carveout for de minimis transfers in the amount of 1% of Manheim’s stake at the time of such transfer. This agreement, as amended, provides for termination upon the closing of an initial public offering and therefore will be terminated upon the consummation of this offering.
Registration Rights Agreement
Upon the consummation of this offering, the parties to the Stockholders Agreement are expected to enter into a registration rights agreement which will provide for Form S-3 demand registration rights and piggyback registration rights. The registration rights agreement will terminate upon the earlier of the seventh anniversary of this offering or the date on which none of our stockholders holds registrable securities. See “Description of Capital Stock—Registration Rights.”
In 1999, we entered into a registration rights agreement with certain former and current stockholders, including CEI. This agreement provides for demand registration rights six months following the consummation of our initial public offering, Form S-3 registration rights and piggyback registration rights. Entry into the new registration rights agreement described above will supersede this 1999 agreement in all respects for those stockholders that enter into the new agreement.
Agreements Related to CEI
Intercompany Services Agreement
In connection with the Providence Investment, we entered into an intercompany services agreement with CEI, or the Intercompany Services Agreement, related to certain administrative services to be provided by CEI to us. These services include corporate, secretarial, accounting, corporate information systems, tax, internal audit, risk management, benefits administration, business development, communications, legal, human resources information systems, real estate and other support services. These services will continue to be provided by CEI to us following the consummation of this offering. Pursuant to this agreement, we paid CEI an aggregate annual base fee of $1.9 million,
157
Table of Contents
$2.0 million, $2.0 million and $1.0 million, respectively, for the years ended December 31, 2009, 2010 and 2011, and the six months ended June 30, 2012. In June 2012, this agreement was amended to reflect an annual base fee of $5.5 million for 2012, $6.0 million for 2013 and $9.0 million for 2014 and each year thereafter. Such base fee can be increased or decreased by CEI, following consultation with us to reflect (i) internal cost allocations, (ii) increased or decreased services provided by CEI, (iii) actual versus estimated costs to perform services and (iv) compliance with transfer pricing rules. Other than the base fee and the adjustments to the base fee, we will not pay any additional fees to CEI under the Intercompany Services Agreement.
Cash Management Agreement
Under our cash management agreement with CEI, CEI provides, and after the consummation of the offering will continue to provide, centralized day-to-day cash management to us for an indefinite term, with settlements of outstanding balances between us and CEI occurring periodically. These services include the sweep of our deposited receipts into CEI’s cash management system, as well as the payment of our checks presented for payment. The agreement automatically terminates without any further action by any person or entity if, at any time, CEI and its affiliates, other than us, own, in the aggregate, less than 50% of our issued and outstanding equity interests or less than 50% of the voting power of all classes of our common stock, in each case on a fully-exercised and as converted basis, provided that CEI will continue to provide such services upon such termination for a period of up to 180 days if requested by us. We do not pay CEI any fees under the cash management agreement, except for any daily net outstanding amounts due to CEI. Amounts due to or from CEI are subject to interest based on CEI’s commercial borrowing rate. For the years ended December 31, 2009, 2010 and 2011, and the six months ended June 30, 2012, we received $0.4 million, $1.3 million, $2.3 million and $1.0 million, respectively, in interest income from CEI under the cash management agreement. See “Management’s Discussion and Analysis of Financial Condition and Results of Operations—Liquidity and Capital Resources” for more information.
Related Party Agreement
In June 2012, we entered into a Related Party Agreement with CEI, Cox Digital Exchange, LLC, or CDX, and Manheim, Inc., pursuant to which we have agreed, for a period ending on the earliest of (i) June 14, 2017, (ii) the date on which CEI and its affiliates no longer, directly or indirectly, hold securities entitling them to voting control of us or Manheim or (iii) the date on which CEI is no longer controlled by the CEI Related Parties, not to (and not to permit our controlled subsidiaries to) actively pursue, undertake or consummate any Manheim Opportunities in the United States (other than limited non-control investments and opportunities in which we were engaged as of the date of the Related Party Agreement). Manheim Opportunities include business, commercial or investment opportunities, joint ventures, strategic alliances, certain exclusive license agreements, loans, acquisitions of debt or equity interests and the development, production or sale of new products or services to the extent the subject matter of any of the foregoing is in the businesses actively conducted by Manheim and CDX, and their controlled subsidiaries as of the date of the Related Party Agreement, which consist primarily of wholesale vehicle auctions and related businesses. Similarly, CEI has agreed, for the same period ending on the earlier of the fifth anniversary of such agreement or the date on which CEI and its affiliates no longer, directly or indirectly, hold securities entitling them to voting control of us and Manheim, not to (and not to permit its controlled subsidiaries, other than ATG and its controlled subsidiaries, to) actively pursue, undertake or consummate any ATG Opportunities in the United States (other than limited non-control investments and opportunities in which any of the Manheim entities were engaged as of the date of the Related Party Agreement). ATG Opportunities include business, commercial or investment opportunities, joint ventures, strategic alliances, certain exclusive license agreements, loans, acquisitions of debt or equity interests and the development, production or sale of new products or services to the extent the subject matter of any of the foregoing is in the business actively conducted by us and our controlled subsidiaries as of the date of the Related Party Agreement.
158
Table of Contents
In addition, pursuant to the Related Party Agreement, we have agreed that as long as CEI and its controlled subsidiaries (other than ATG and its controlled subsidiaries) have voting control of us and Manheim, we must notify the executive committee of our Board of all acquisitions being actively pursued by us or any of our controlled subsidiaries and Manheim will cause CEI and its controlled subsidiaries (other than ATG and its controlled subsidiaries) to notify CEI’s chief executive officer or chief financial officer of any acquisitions being actively pursued by CEI and its controlled subsidiaries (other than ATG and its controlled subsidiaries). If CEI’s chief executive officer and chief financial officer have actual knowledge that any Manheim entity or any ATG entity are actively pursuing the same acquisition, then CEI’s designees on our Board must recuse themselves from the consideration and approval of such acquisition as long as a Manheim entity is actively pursuing such acquisition (provided, that they may participate in the consideration and approval of such acquisition on our behalf if a Manheim entity is no longer actively pursuing such acquisition). In addition, we have agreed not to (1) become bound to undertake (or consummate) an acquisition of a business or line of business from another person or entity or (2) become bound to lend money or acquire an equity or debt interest in any person or entity (or consummate any such transaction), without first obtaining the consent of the holders of a majority of our outstanding Class B common stock (which currently is held by affiliates of CEI and which consent may be subject to such conditions and limitations as such holders specify in their sole discretion). If the holders of such Class B common stock do not consent, none of the Manheim entities may consummate such acquisition or investment without our written consent, which consent must be authorized by the related party committee of our Board.
CEI Related Parties means the lineal descendants of Governor James M. Cox (including adopted children), and the estates, executors and administrators of the above-described individuals, any private foundation or other charitable entity of which the above-described individuals constitute a majority of the trustees, directors or managers, and any corporation, partnership, limited liability company, trust or other entity in which the above-named trusts or above-described individuals and the estates, executors and administrators, and lineal descendants of the above-named individuals in the aggregate have a direct or indirect beneficial or voting interest of greater than 50%.
Cross-License Agreement
Concurrently with our entry into the Related Party Agreement described above, we entered into a cross-license agreement with Manheim and CDX, pursuant to which we have agreed to share certain data with Manheim and its controlled subsidiaries and CDX and its controlled subsidiaries and each of Manheim and CDX have agreed to share certain data with us and our controlled subsidiaries. In addition, we have granted to Manheim and CDX, and each of Manheim and CDX have granted to us, a limited, non-exclusive, non-transferable, non-sublicensable royalty-free right and license to use, modify or create derivative works of the data and to use certain trademarks and related technology for certain permitted uses during the term of the agreement. The cross-license agreement has an initial term of 5 years with automatic 1-year renewals thereafter. At any time after the initial 5-year term, the cross-license agreement may be cancelled by any party thereto on 180 days prior written notice. There are no fees payable by any party for the licenses currently granted under the cross-license agreement.
Manheim Director Nomination Agreement
Pursuant to Director Nomination Agreement with Manheim, we have agreed to nominate (or cause the nomination of) seven individuals designated by Manheim, to stand for election as directors at each annual or special meeting of our stockholders at which directors are to be elected. In addition, we have agreed that the Board initially will be comprised of 13 directors and that to the extent the number of directors is increased, Manheim will be entitled to nominate additional directors in order to ensure that CEI will maintain the same proportionate representation on our Board. Manheim shall no longer be entitled to nominate directors for election at such time as Manheim, and its affiliates shall have sold or
159
Table of Contents
transferred shares of our common stock to persons or entities who are not Manheim, any of the CEI Related Parties or any of their respective affiliates and immediately thereafter, Manheim, the CEI Related Parties and their respective affiliates, in the aggregate, are the beneficial owner (as defined for purposes of Rule 13d-3 under the Exchange Act) of a number of shares of our common stock less than 10% of the aggregate number of shares of Class A common stock and Class B common stock outstanding as of the Charter Effective Date, as such shares shall be adjusted from time to time to take into account any stock dividend, stock split, reverse stock split, combination of shares or any non-dilutive recapitalization, reorganization or similar event, but not other issuances of equity (including, without limitation, upon exercise of options or similar rights to acquire shares of our common stock or exchange securities for shares of our common stock). In addition, we will establish an executive committee of the Board, comprised of directors, of whom shall be directors nominated by Manheim. Furthermore, we will agree that any directors nominated by Manheim that are not employees of Manheim or its affiliates shall be entitled to director fees and other compensation to the same extent as other non-employee directors shall be entitled (provided that, if none of the directors designated by any of our other stockholders receive any such fees and other compensation, then the directors nominated by Manheim shall not receive such fees and other compensation).
Providence Director Nomination Agreement
Pursuant to our Director Nomination Agreement with Providence Equity Partners we have agreed to nominate (or cause the nomination of) two individuals designated by Providence Equity Partners to stand for election as directors at each annual or special meeting of our stockholders at which directors are to be elected. In addition, we will agree that the Board initially will be comprised of 13 directors and that to the extent the number of directors is increased, Providence Equity Partners will be entitled to nominate additional directors in order to ensure that Providence Equity Partners will maintain the same proportionate representation on our Board. The number of directors that Providence Equity Partners shall be entitled to nominate for election will be reduced from two to one at such time as Providence Equity Partners and its affiliates shall have sold or transferred shares of our common stock to persons or entities who are not affiliates and immediately thereafter, Providence Equity Partners and its affiliates, in the aggregate, are the beneficial owner (as defined for purposes of Rule 13d-3 under the Exchange Act) of a number of shares of our common stock less than 10% but at least 5% of the aggregate number of shares of Class A common stock and Class B common stock outstanding as of the Charter Effective Date, as such shares shall be adjusted from time to time to take into account any stock dividend, stock split, reverse stock split, combination of shares or any non-dilutive recapitalization, reorganization or similar event, but not other issuances of equity (including, without limitation, upon exercise of options or similar rights to acquire shares of our common stock or exchange securities for shares of our common stock), and will further be reduced from one to zero at such time as Providence Equity Partners and its affiliates, shall have sold or transferred shares of our common stock to persons or entities who are not affiliates and, immediately thereafter, Providence Equity Partners and its affiliates, in the aggregate, are the beneficial owner (as defined for purposes of Rule 13d-3 under the Exchange Act) of a number of shares of our common stock less than 5% of the aggregate number of shares of Class A common stock and Class B common stock outstanding as of the Charter Effective Date, as such shares shall be adjusted from time to time to take into account any stock dividend, stock split, reverse stock split, combination of shares or any non-dilutive recapitalization, reorganization or similar event, but not other issuances of equity (including, without limitation, upon exercise of options or similar rights to acquire shares of our common stock or exchange securities for shares of our common stock). In addition, we will establish an Executive Committee of the Board, comprised of directors, and a Related Party Committee of the Board and at least one member of each such committee of the Board shall be a director nominated by Providence Equity Partners. Furthermore, we will agree that any directors nominated by Providence Equity Partners shall be entitled to director fees and other compensation to the same extent as other non-employee directors shall be entitled (provided that, if none of the directors designated by any of our
160
Table of Contents
other stockholders receive any such fees and other compensation, then the directors nominated by Providence Equity Partners shall not receive such fees and other compensation).
Other Services
In addition to the relationships described above, we received other miscellaneous services from various CEI-related or controlled entities related to internet connectivity, server co-location and website development. For the years ended December 31, 2009, 2010 and 2011, we paid CEI certain fees and expenses of $2.4 million, $1.8 million and $0.4 million, respectively. Fees for the six months ended June 30, 2012 were nominal.
Transactions of Securities
On May 29, 2012, AutoTrader Group, Inc. was formed as a Delaware corporation, and on June 13, 2012, in accordance with our charter, all shares of ATC Class B common stock were converted into shares of Class A common stock on a share-for-share basis. On June 14, 2012, a wholly-owned subsidiary of ATG merged with and into ATC, with ATC as the surviving corporation and, as a result, ATC became a wholly owned subsidiary of ATG. As part of the merger:
| Ÿ | We issued 72,118,748 shares of our Class A common stock for 72,118,748 shares of the Class A common stock of ATC. |
| Ÿ | We issued 121,351,424 shares of our Class B common stock for 121,351,424 shares of the Class C common stock of ATC. |
In October 2010, in connection with our acquisition of vAuto, we sold 2,206,844 shares of ATC’s Class A common stock and 4,368,928 shares of ATC’s Class C common stock to existing holders for approximately $12.78 per share.
In December 2010, in connection with our acquisitions of Kelley Blue Book and HomeNet, we sold 6,100,076 shares of ATC’s Class A common stock and 12,101,696 shares of ATC’s Class C common stock to existing holders for approximately $12.78 per share.
We amended our certificate of incorporation effective September 30, 2012 to increase the number of authorized shares of our Class A common stock and our Class B common stock and to effect a four-for-one stock split of our Class A common stock and our Class B common stock. See “Prospectus Summary—Recent Developments—Amendment to Certificate of Incorporation and Stock Split.” Accordingly, except as otherwise indicated, all share and per share data presented in this prospectus reflect the impact of the increase in authorized shares and the stock split.
Acquisition of vAuto
In connection with our acquisition of vAuto in October 2010, Dale Pollak, our Senior Vice President; vAuto Founder, received approximately $54.8 million in proceeds from his sale of vAuto stock and his father, Philip Len Pollak, received approximately $0.7 million in proceeds from his sale of vAuto stock. Keith Jezek, our President, Software, also received approximately $19.2 million in proceeds from his sale of vAuto stock in connection with our acquisition of vAuto.
Board Compensation
Our employee directors and our directors who are employed by CEI or any of its affiliates and the Providence Funds will receive no compensation for their service as members of our Board. Our other directors will receive compensation for their service as members of our Board as described in “Executive and Director Compensation—Director Compensation.”
161
Table of Contents
Employment Agreements
We entered into employment agreements with Messrs. Perry, Jezek, Pollak and Rowe. For more information regarding these agreements, see “Executive and Director Compensation—Employment Agreements.”
Indemnification Agreements
We intend to enter into indemnification agreements with each of our directors and executive officers. We expect these agreements, among other things, will require us to indemnify each director and executive officer to the fullest extent permitted by Delaware law, including indemnification of expenses such as attorneys’ fees, judgments, fines and settlement amounts incurred by the director or executive officer in any action or proceeding, including any action or proceeding by or in right of us, arising out of the person’s services as a director or executive officer.
Policies for Approval of Related Person Transactions
We will establish and maintain procedures for the review of related party transactions. These procedures are embodied in written guidelines to be adopted by our Board. All of the transactions described above were implemented or approved prior to adoption of guidelines.
Other than transactions to be reviewed by the related party committee under the Related Party Agreement, we will utilize the audit committee of the Board as the authority for review and approval of transactions with related persons, as defined in SEC rules, in order to ensure fairness to ATG. Subject to certain thresholds such as minimum review amounts, the audit committee has full discretion to determine the scope of review that is appropriate in considering any transaction with a related person. Other than transactions to be reviewed by the related party committee under the Related Party Agreement, the types of transactions covered by the guidelines are as follows:
| Ÿ | The audit committee reviews related party transactions between ATG and any of its subsidiaries and CEI or any subsidiary or affiliate of CEI, or any officer or director of ATG or CEI or their respective subsidiaries or affiliates. |
| Ÿ | The audit committee reviews the fairness to ATG of all insurance programs and employee benefit plans provided by CEI, or any subsidiary or affiliate of CEI, in which ATG or its employees participate. The related party committee may review available reports from a third party insurer or administrator concerning the manner in which premiums or other charges are developed. |
| Ÿ | The audit committee reviews the fairness of lease transactions and other charges or payments relating to real estate transactions entered into between ATG and CEI, or any subsidiary or affiliate of CEI, and requires evidence of fairness, which may include a market evaluation from a qualified, independent professional source, for rental or other real estate amounts exceeding $1 million annually. |
| Ÿ | The audit committee receives an annual report from ATG management, and if requested, from CEI, concerning management and administrative services provided by CEI to ATG that describes the services provided and analyzes the value to ATG. |
| Ÿ | For other related party transactions, the audit committee may obtain an analysis by a qualified third party to support the audit committee’s fairness findings for any transaction with a related party involving the payment for, or the receipt of payment for goods and services, in an amount exceeding 1% of ATG’s gross revenues. |
| Ÿ | Finally, the audit committee may review civic, charitable, community, and other not-for-profit activities involving ATG or its officers or directors if such activities may constitute related party transactions or would require disclosure under stock exchange rules. |
162
Table of Contents
Security Ownership
The following table shows information regarding the beneficial ownership of our Class A common stock and Class B common stock (1) as of , 2012 and (2) as adjusted to give effect to this offering by:
| Ÿ | each person or group who is known by us to own beneficially more than 5% of our common stock; |
| Ÿ | each member of our Board and each of our NEOs; and |
| Ÿ | all members of our Board and our executive officers as a group. |
Beneficial ownership of shares is determined under rules of the SEC and generally includes any shares over which a person exercises sole or shared voting or investment power. Except as noted by footnote, and subject to community property laws where applicable, we believe based on the information provided to us that the persons and entities named in the table below have sole voting and investment power with respect to all shares of our Class A common stock shown as beneficially owned by them. Percentage of beneficial ownership is based on shares of Class A common stock outstanding as of , 2012 and shares of Class A common stock outstanding after giving effect to this offering, assuming no exercise of the underwriters’ option to purchase additional shares, or shares of Class A common stock, assuming full exercise of the option to purchase additional shares, and shares of Class B common stock outstanding as of , 2012. Shares of Class A common stock subject to options currently exercisable or exercisable within 60 days of the date of this prospectus are deemed to be outstanding and beneficially owned by the person holding the options for the purposes of computing the percentage of beneficial ownership of that person and any group of which that person is a member, but are not deemed outstanding for the purpose of computing the percentage of beneficial ownership for any other person. Except as otherwise indicated, the persons named in the table below have sole voting and investment power with respect to all shares of capital stock held by them. Unless otherwise indicated, the address for each holder listed below is c/o AutoTrader Group, Inc., 3003 Summit Boulevard, Atlanta, Georgia 30319.
163
Table of Contents
| Shares of Class A common stock beneficially owned |
Shares of Class B common stock beneficially owned |
% of Total Voting Power | ||||||||
| Name and address of beneficial owner |
Number of shares |
Percentage of shares |
Number of shares |
Percentage of shares |
||||||
| 5% Stockholders: |
||||||||||
| Cox Enterprises, Inc.(1) |
||||||||||
| Providence Funds(2) |
||||||||||
| Named Executive |
||||||||||
| Chip Perry |
||||||||||
| Dallas S. Clement |
||||||||||
| James S. Franchi |
||||||||||
| Steven Alan Smith |
||||||||||
| Matthew S. McKenna |
||||||||||
| Albert J. Dobron(3) |
||||||||||
| Michael J. Dominguez(3) |
||||||||||
| John M. Dyer(4) |
||||||||||
| Jimmy W. Hayes(4) |
||||||||||
| James C. Kennedy Jr. |
||||||||||
| John Olin |
||||||||||
| Sanford H. Schwartz |
||||||||||
| Alexander C. Taylor |
||||||||||
| All board of director members and executive officers as a group (20 persons) |
||||||||||
| * | Represents beneficial ownership of less than 1% of our outstanding Class A common stock. |
| (1) | All the shares of our Class B common stock that are beneficially owned by CEI are held of record by an indirect wholly-owned subsidiary of CEI. CEI has two classes of common stock outstanding. One class is entitled to one vote per share, and the other class is non-voting. The Dayton Cox Trust A holds over 99% of the voting stock of CEI. Anne Cox Chambers, James C. Kennedy and Jimmy W. Hayes serve as trustees of the Dayton Cox Trust A. Actions by the Dayton Cox Trust A, including investment and voting decisions, require at least a majority of the trustees, and no trustee has the power to remove any other trustee. Anne Cox Chambers, who is also a director of CEI, is the aunt of James C. Kennedy, who is the Chairman of the board of directors of CEI. Jimmy W. Hayes is not related to either Anne Cox Chambers or James C. Kennedy, and serves as president and chief executive officer and a director of CEI and as a director of ATG. The address for CEI is 6205 Peachtree Dunwoody Road, Atlanta, Georgia, 30328. |
| (2) | Represents (i) shares of common stock held by Providence Equity Partners VI L.P. (“PEP VI”) and (ii) shares of common stock held by PEP VI-A Auto Trader AIV L.P. (“PEP AT VI-A”). |
| Certain persons may be deemed to indirectly own the common stock listed above as follows: (a) PEP VI-A Auto Trader AIV GP LLC (“PEP AT VI-A GP”), as the general partner of PEP AT VI-A; (b) Providence Equity GP VI L.P. (“PEP VI GP”), as the general partner of PEP AT VI-A GP and PEP VI; (c) Providence Equity Partners VI L.L.C. (“PEP VI LLC”), as the general partner of PEP VI GP; and (d) Providence Equity Partners, as the management company to PEP VI and PEP AT VI-A. Each of PEP VI, PEP AT VI-A, PEP VI GP, PEP AT VI-A GP, PEP VI LLC and Providence Equity Partners (collectively, the “Providence Entities”) disclaims indirect beneficial ownership, except to the extent of each of their respective pecuniary interests therein. |
164
Table of Contents
| Messrs. Jonathan Nelson, Glenn Creamer and Paul Salem each are: (1) members of PEP VI LLC; and (2) may be deemed to share beneficial ownership of shares owned by the Providence Entities. Each of Messrs. Nelson, Creamer and Salem disclaims this beneficial ownership, except to the extent of each of their respective pecuniary interests therein. |
| The address of Messrs. Nelson, Creamer and Salem and the entities in this footnote is c/o Providence Equity Partners L.L.C., 50 Kennedy Plaza, 18th Floor, Providence, Rhode Island, 02903. |
| (3) | Does not include shares held by the Providence Entities. By virtue of their affiliation with Providence Equity Partners, including as indirect beneficial owners of PEP VI GP, Messrs. Albert Dobron and Michael Dominguez may be deemed to share beneficial ownership of shares held by each of PEP VI and PEP AT VI-A and their affiliated entities. See footnote (2) above. Messrs. Dobron and Dominguez disclaim any such beneficial ownership of such shares, except to the extent of their pecuniary interest therein. The address of Messrs. Dobron and Dominguez is c/o Providence Equity Partners L.L.C., 50 Kennedy Plaza, 18th Floor, Providence, Rhode Island, 02903. |
| (4) | Does not include shares held by CEI. By virtue of their affiliation with CEI, including as chief financial officer and chief executive officer of CEI, Messrs. Dyer and Hayes may be deemed to have or share beneficial ownership of shares held by CEI. Messrs. Dyer and Hayes disclaim any such beneficial ownership, except to the extent of their pecuniary interest therein. |
165
Table of Contents
DESCRIPTION OF MATERIAL INDEBTEDNESS
On December 15, 2010, ATC entered into our credit facilities with Wells Fargo Bank, National Association, as administrative agent and collateral agent, and other agents and lenders, which initially provided for a revolving credit facility in an aggregate principal amount of up to $200.0 million and two term loan facilities in an aggregate principal amount of $750.0 million. On June 14, 2011, we amended our credit facilities to, among other things, increase the aggregate term loan commitments by $100.0 million to finance the acquisition of VinSolutions. On April 30, 2012, we amended our credit facilities to, among other things, increase the aggregate term loan commitments by $200.0 million and increase the aggregate revolving credit commitments by $200.0 million in order to finance a dividend to ATC’s then-existing stockholders. As of June 30, 2012, total outstanding indebtedness under our credit facilities was $1,284.4 million and we had additional availability under our credit facilities of $130.0 million.
Set forth below is a summary of the terms of our credit facilities. This summary is not a complete description of all of the terms of the agreement. The agreement setting forth the principal terms and conditions of our credit facilities, as amended to date, is filed as an exhibit to the registration statement of which this prospectus forms a part.
General
Our credit facilities consist of:
| Ÿ | a term A loan facility, of which $621.3 million was outstanding as of June 30, 2012, which matures in 2015 (provided that the $200.0 million of the term A loan facility loaned pursuant to the amendment on April 30, 2012 shall mature in 2017 unless we have not repaid or refinanced the earlier maturing portion of the term A loans by 2015 or repaid or refinanced the term B loans by 2016 (or, in either case, we have not demonstrated to the reasonable satisfaction of Wells Fargo that we have committed financing or cash available to repay or refinance such loans), in which case the additional loans made pursuant to the amendment on April 30, 2012 shall mature in 2015 or 2016, as applicable), |
| Ÿ | a term B loan facility, of which $395.0 million was outstanding as of June 30, 2012, which matures in 2016, and |
| Ÿ | a $400.0 million revolving credit facility, of which $270.0 million was outstanding as of June 30, 2012, which matures in 2015. |
The revolving credit facility includes a sublimit of $25.0 million for letters of credit.
In November 2012, we intend to use $65.0 million in proceeds from borrowings under our revolving credit facility to purchase a 21.8% interest in Bitauto and to finance the purchase of $6.5 million of Bitauto shares by certain members of Bitauto’s senior management. In exchange, they agreed to issue to us an aggregate principal amount of $6.5 million in senior secured guaranteed exchangeable bonds. See “Management’s Discussion and Analysis of Financial Condition and Results of Operations—Bitauto Investment.”
The obligations under our credit facilities are unconditional and are guaranteed by substantially all of ATC’s existing and future domestic subsidiaries. Our credit facilities and related guarantees are secured on a first-priority basis by security interests (subject to liens permitted under the credit agreement governing our credit facilities) in substantially all tangible and intangible assets owned by ATC, the obligors under our credit facilities, and each of ATC’s other domestic subsidiaries, subject to certain exceptions, including limiting pledges of voting stock of foreign subsidiaries to 65% of such voting stock.
166
Table of Contents
Interest and Fees
Borrowings under our credit facilities bear interest at a rate equal to (1) in the case of term B loans, at our option (i) the greater of (a) the rate of interest per annum determined by Wells Fargo Bank, from time to time, as its prime rate in effect at its principal office in Charlotte, North Carolina, and (b) the federal funds rate plus 0.50% per annum (the “base rate”) (provided that such rate as applied to the term B loans shall not be less than 2.0% per annum), in each case plus 2.00% per annum or (ii) LIBOR (adjusted for statutory reserves and provided that such rate as applied to the term B loans shall not be less than 1.0% per annum) plus 3.00% and (2) in the case of term A loans and the revolving loans, at our option (subject to certain exceptions) (i) the base rate plus 1.50% when our leverage ratio (as defined in our credit facilities) is greater than 4.00 to 1.00 (Leverage Level 1), the base rate plus 1.25% when our leverage ratio is greater than 3.50 to 1.00 but less than or equal to 4.00 to 1.00 (Leverage Level 2), the base rate plus 1.00% when our leverage ratio is greater than 3.00 to 1.00 but less than or equal to 3.50 to 1.00 (Leverage Level 3), the base rate plus 0.75% when our leverage ratio is greater than 2.50 to 1.00 but less than or equal to 3.00 to 1.00 (Leverage Level 4), and the base rate plus 0.50% when our leverage ratio is less than or equal to 2.50 to 1.00 (Leverage Level 5), or (ii) LIBOR (adjusted for statutory reserves) plus 2.50% in the case of Leverage Level 1, 2.25% in the case of Leverage Level 2, 2.00% in the case of Leverage Level 3, 1.75% in the case of Leverage Level 4 and 1.50% in the case of Leverage Level 5.
If we default on the payment of any principal, interest, or any other amounts due under our credit facilities, we will be obligated to pay default interest on the overdue amounts. The default interest rate on principal payments will equal the interest rate applicable to such loan plus 2.00% per annum, and the default interest rate on all other payments will equal the interest rate applicable to base rate revolving loans plus 2.00% per annum.
As of June 30, 2012, the weighted average interest rate under our credit facilities was 2.68%. We have no interest rate swaps. Our regularly scheduled principal payments for the remainder of 2012 will be $18.3 million, our regularly scheduled principal payments for the year ended December 31, 2013 will be $45.5 million and our regularly scheduled principal payments for the year ended December 31, 2014 will be $61.0 million. In addition, we may be required to make additional prepayments in certain circumstances.
In addition to paying interest on outstanding principal under our credit facilities, we are also required to pay a commitment fee at a rate ranging from 0.25% to 0.45% per annum (based on a leverage ratio) on the daily unused commitments available to be drawn under the revolving credit facility. We are also required to pay letter of credit fees, with respect to each letter of credit issued, at a rate per annum equal to the applicable LIBOR margin for revolving loans on the average daily amount of undrawn letters of credit. Letter of credit disbursements that have not been repaid by us accrue interest at the applicable base rate plus the margin, as described above. We are also required to pay fronting fees, with respect to each letter of credit issued, at a rate specified by the issuer of the letters of credit and to pay Wells Fargo Bank certain administrative fees from time to time, in its role as administrative agent. The term A loans under our credit facilities amortize in quarterly installments in amounts set forth in the credit agreement governing our credit facilities, with the outstanding balance due at maturity. The term B loans under our credit facilities amortize in quarterly installments of 0.25% of the principal amount, with the outstanding balance due at maturity. Under certain circumstances, we may be required to reimburse the lenders under our credit facilities for certain increased fees and expenses caused by a change of law.
Prepayments
We may prepay the loans under our credit facilities from time to time without penalty, subject to certain customary restrictions. We are generally required to prepay term loan borrowings under our
167
Table of Contents
credit facilities with (1) 100% of the net cash proceeds we receive from non-ordinary course asset sales or as a result of a casualty or condemnation, subject to certain exceptions including limited rights to reinvest such net cash proceeds, (2) 100% of the net cash proceeds we receive from the issuance of debt obligations other than debt obligations permitted under the credit agreement and (3) 50% (or, if our leverage ratio is less than 3.25 to 1.00, 0%) of excess cash flow (as defined in the credit agreement governing our credit facilities). All mandatory prepayments will be applied to the term loans on a pro rata basis, subject to certain adjustments in the event any term loans are voluntarily prepaid in any period.
Covenants
Our credit facilities require us to maintain certain financial ratios, including a maximum leverage ratio (based upon the ratio of our total outstanding indebtedness, net of certain unrestricted cash and cash equivalents, to Consolidated Adjusted EBITDA, as defined in the credit agreement governing our credit facilities), and a minimum debt service coverage ratio (based upon the ratio of Consolidated Adjusted EBITDA, less capital expenditures, to consolidated debt service), which are tested quarterly. Based on the formulas set forth in the credit agreement governing our credit facilities, as of June 30, 2012, we were required to maintain a maximum leverage ratio of 4.50 to 1.00 and a minimum debt service coverage ratio of 2.25 to 1.00. The financial ratios required under our credit facilities become more restrictive over time.
The credit agreement also contains a number of affirmative and negative covenants including: limitations on mergers, consolidations and dissolutions; sales of assets; sale-leaseback transactions; investments and acquisitions; indebtedness; liens; negative pledges; affiliate transactions; the conduct of our business; modifications or prepayments of other material indebtedness; issuing certain redeemable, convertible or exchangeable equity securities and the activities of certain subsidiaries holding material intellectual property. The credit agreement also includes a covenant that restricts ATC’s ability to pay dividends or to make any other payments in respect of our common stock. This restriction is subject to customary exceptions including, among others, payments required pursuant to certain contracts, payments to satisfy certain tax obligations of our holding companies, payments out of the proceeds of an initial public offering up to 6% per annum of such proceeds and payments subject to our pro forma compliance with certain leverage ratios. The credit agreement contains events of default that are customary for similar facilities and transactions, including a cross-default provision with respect to other material indebtedness, and an event of default that would be triggered by a change of control, as defined in the credit agreement governing our credit facilities, and which is not expected to be triggered by this offering. As of June 30, 2012, we were in compliance with all of our covenants and other obligations under the credit agreement.
168
Table of Contents
The following is a description of the material terms of our second amended and restated certificate of incorporation and our second amended and restated bylaws. This summary does not purport to be complete and is qualified in its entirety by reference to the actual terms and provisions of our second amended and restated certificate of incorporation and our second amended and restated bylaws, copies of which have been filed as exhibits to the registration statement of which this prospectus is a part.
Authorized Capitalization
Our authorized capital stock consists of: (i) 500,000,000 shares of Class A common stock, $0.001 par value per share; (ii) 200,000,000 shares of Class B common stock, $0.001 par value per share; and (iii) 15,000,000 shares of preferred stock, $0.001 par value per share.
Amendment to Certificate of Incorporation
Effective September 30, 2012, our certificate of incorporation was amended to increase the number of authorized shares of our (i) Class A common stock from 250 million to 500 million and (ii) Class B common stock from 100 million to 200 million, and to effect a four-for-one stock split of our Class A common stock and our Class B common stock. Each holder of record of Class A common stock and Class B common stock on the close of business on the effective date received three additional shares for each share held. The stock split did not affect the par value of our common stock. Except as otherwise indicated, all share and per share data presented in this prospectus, including in our financial statements and related notes thereto included elsewhere in this prospectus, reflect the impact of the increase in authorized shares and the stock split.
Common Stock
Except with respect to voting and conversion, shares of Class A common stock and Class B common stock are identical in all respects. Affiliates of CEI hold all of the outstanding shares of Class B common stock.
As of November 2, 2012, there were 49 holders of our Class A common stock and one holder of our Class B common stock. The holders of our common stock are entitled to the following rights:
Voting Rights
One share of Class A common stock entitles the holders to one vote, and one share of Class B common stock entitles the holder to ten votes. Except as set forth below, all actions submitted to a vote of our stockholders are voted on by the holders of Class A common stock and Class B common stock voting together as a single class. The affirmative vote of the holders of a majority of the outstanding shares of Class A common stock or Class B common stock, voting separately as a class, is required to approve such matters as may require a class vote under the Delaware General Corporation Law, or the DGCL. In addition, the affirmative vote of the holders of a majority of our Class B common stock then outstanding, voting as a separate class, is required prior to us or any of our affiliates entering into any agreements relating to the consummation of any acquisition until such time as CEI and its affiliates no longer hold, directly or indirectly, or cease to be the beneficial owners of, securities entitling them to cast a majority of the votes of holders of outstanding shares of common stock at any annual or special meeting of our stockholders and the stockholders of CEI.
169
Table of Contents
Dividends and Other Distributions
Holders of Class A common stock and Class B common stock will share equally in any dividends and other distributions in cash, stock or property (including distributions upon liquidation and consideration to be received upon a sale or conveyance of all or substantially all of our assets), declared by our Board, subject to any preferential rights of the holders of any then outstanding preferred stock. In the case of dividends or other distributions payable on the Class A common stock or the Class B common stock in shares of such stock, including distributions pursuant to stock splits or dividends, only Class A common stock will be distributed with respect to the Class A common stock and only Class B common stock will be distributed with respect to the Class B common stock. In no event will any of the Class A common stock or Class B common stock be split, divided or combined unless each other class of common stock is proportionately split, divided or combined.
Convertibility
The Class B common stock is convertible at any time at the option of the holder of the Class B common stock, into Class A common stock on a share-for-share basis. The shares of our Class B common stock will automatically convert into Class A common stock on a share-for-share basis (1) upon the sale or other transfer to a person that is not a beneficial owner hereof as of the Charter Effective Date, a CEI Related Party or any of their respective affiliates, and (2) on the first date on which the beneficial owners of our Class B common stock as of the Charter Effective Date, the CEI Related Parties and their respective affiliates have sold or otherwise transferred shares such that some beneficial owners, the CEI Related Parties and their respective affiliates, in the aggregate, hold, directly or indirectly, or are the beneficial owners of, less than 10% of the aggregate number of shares of common stock outstanding as of the Charter Effective Date, as adjusted.
Preemptive Rights
Neither the Class A common stock nor the Class B common stock carry any preemptive rights entitling a holder to subscribe for or receive shares of any class of our stock or any other securities convertible into shares of any class of our stock. Our Board possesses the power to issue shares of authorized but unissued Class A common stock, Class B common stock and preferred stock without further stockholder action.
Liquidation, Dissolution or Winding Up
In the event of any liquidation, dissolution or winding up, whether voluntarily or involuntarily, the holders of the Class A common stock and the Class B common stock shall be entitled to share ratably in any of our assets legally available for distribution to stockholders after payment or provision for payment of our debts and other liabilities. If we have any preferred stock outstanding at such time, holders of the preferred stock may be entitled to distribution or liquidation preferences. In either such case, we must pay the applicable distributions or preferential amounts to the holders of any preferred stock before we pay distributions to the Class A common stock and the Class B common stock.
Preferred Stock
Our Board is authorized to provide for the issuance of preferred stock from time to time in one or more series and to fix or alter the preferences, powers and relative, participating, optional or other special rights, and qualifications, limitations or restrictions thereof, including the dividend rate, conversion rights, voting rights, redemption rights (whether through the operation of a sinking fund or otherwise) and liquidation preference and to fix or alter the number of shares to be included in any such series without any further vote or action by our stockholders. Any preferred stock so issued may rank senior to our common stock with respect to the payment of dividends or amounts upon liquidation,
170
Table of Contents
dissolution or winding up, or both. In addition, any such shares of preferred stock may have class or series voting rights. The issuance of preferred stock may have the effect of delaying, deferring or preventing a change in control of our company without further action by the stockholders and may adversely affect the voting and other rights of the holders of our common stock. As of the date of this prospectus, there are no outstanding shares of preferred stock.
Registration Rights
Pursuant to the terms of the registration rights agreement between us, CEI, Providence Equity Partners and certain other holders of our stock, such holders, including certain of our directors, officers and other holders of our outstanding capital stock, are entitled to demand and piggyback registration rights. The stockholders who are parties to the registration rights agreement will hold shares, or approximately % of our common stock, comprised of an aggregate of shares, or approximately % of our Class A common stock, and shares, or 100% of our Class B common stock, outstanding upon completion of this offering (assuming no exercise of the underwriters’ option to purchase additional shares). The registration rights described below will expire seven years after the effective date of the registration statement of which this prospectus forms a part.
Piggyback Registration Rights. In the event that we propose to register any of our securities under the Securities Act, either for our account or for the account of our other security holders, the holders of registrable shares will be entitled to certain “piggyback” registration rights allowing the holder to include their shares in such registration, subject to certain marketing and other limitations. As a result, whenever we propose to file a registration under the Securities Act, other than with respect to a registration statement on Form S-4 or Form S-8, a registration relating solely to employee benefit plans, a registration relating to a corporate reorganization or other Rule 145 transaction or a registration on any registration form that does not permit sales by selling stockholders, the holders of these shares are entitled to notice of the registration and have the right, subject to certain limitations, to include their shares in the registration.
Form S-3 Registration Rights. Any holder of registrable securities may make a request that we register their shares on Form S-3 if we are qualified to file a registration statement on Form S-3 and if the aggregate price to the public is equal to or would exceed $5 million. We would not be required to effect more than two registrations on Form S-3 within any 12-month period.
Anti-Takeover Provisions
Provisions of our second amended and restated certificate of incorporation and second amended and restated bylaws may delay, defer or discourage transactions involving an actual or potential change in control of us or change in our management. These provisions, which are summarized below, may discourage coercive takeover practices or inadequate takeover bids. These provisions are also designed to encourage persons seeking to acquire control of us to first negotiate with our Board, which we believe may result in an improvement of the terms of any such acquisition in favor of our stockholders. However, they also give our Board the power to discourage transactions that some stockholders may favor, including transactions in which stockholders might otherwise receive a premium for their shares, or transactions that our stockholders might otherwise deem to be in their best interests. Accordingly, these provisions could adversely affect the price of our Class A common stock.
Elimination of Stockholder’s Power to Call Special Stockholders Meeting and Right to Act Without a Meeting. Our second amended and restated certificate of incorporation provides that from and after the date that CEI and its affiliates no longer hold, directly or indirectly, or cease to be the beneficial owners of, securities entitling them to cast a majority of the votes of holders of outstanding shares of common stock at any annual or special meeting of our stockholders, a special meeting of stockholders
171
Table of Contents
may be called only by our Board or the chairman of our Board or our president and chief executive officer. The principal effect of this provision is to prevent stockholders from forcing a special meeting to consider a proposal by our Board. In addition, our second amended and restated certificate of incorporation provides that from and after the date that CEI and its affiliates no longer hold, directly or indirectly, or cease to be the beneficial owners of, securities entitling them to cast a majority of the votes of holders of outstanding shares of common stock at any annual or special meeting of our stockholders, no action required by the DGCL to be taken at any annual or special meeting of our stockholders, and no action which may be taken at any annual or special meeting of our stockholders, may be taken by written consent of the stockholders in lieu of a meeting of our stockholders.
Procedures for Stockholder Proposals. Our second amended and restated bylaws provide that a stockholder must furnish written notice to our corporate secretary of any nomination or business proposal to be brought before a meeting of our stockholders not less than 90 nor more than 120 days prior to the first anniversary of the prior year’s annual meeting of our stockholders in the case of proposals to be brought before stockholders at the annual meeting and not less than 90 nor more than 120 days prior to the date of such meeting in the case of proposals to be brought before the stockholders at a special meeting of our stockholders, or if less, a stockholder must furnish notice of a nomination or business proposal not later than the close of business on the tenth day following the mailing or the public disclosure of notice of the meeting date. These procedures prohibit last minute attempts by any stockholder to nominate a director or present a business proposal at an annual or special stockholders meeting, even if such a nomination or proposal might be desired by the holders of a majority of our common stock.
Classified Board. Our second amended and restated certificate of incorporation provides that from and after the date that CEI and its affiliates no longer hold, directly or indirectly, or cease to be the beneficial owners of, securities entitling them to cast a majority of the votes of holders of outstanding shares of common stock at any annual or special meeting of our stockholders, our Board will be divided into three classes of directors, with each class as nearly equal in number as possible, serving staggered three year terms.
Exclusive Forum. Our second amended and restated certificate of incorporation provides that, subject to certain exceptions, the Court of Chancery of the State of Delaware shall be the sole and exclusive forum for certain stockholder litigation matters. However, it is possible that a court could rule that this provision is unenforceable or inapplicable.
Corporate Opportunity
Our second amended and restated certificate of incorporation provides that our non-employee stockholders, our non-employee directors, CEI, Manheim or Providence Equity Partners, their respective affiliates and subsidiaries, or any of their respective officers, directors, agents, stockholders, members or partners, and their respective representatives on our Board are not required to offer us any corporate opportunity of which they become aware and could take any such opportunity for themselves or offer it to other companies, unless such opportunity is expressly offered to a representative of CEI, Manheim or Providence Equity Partners who is one of our directors or officers in writing solely in their capacity as one of our directors or officers, in which case such opportunity must be communicated to us. We do not renounce our interest in any corporate opportunity offered to any such director or officer if such opportunity is offered to such person in writing solely in his or her capacity as our director or officer.
172
Table of Contents
Section 203 of the DGCL
Section 203 of the DGCL prohibits a publicly-held Delaware corporation from engaging in a “business combination” with an “interested stockholder” for a period of three years after the date of the transaction in which the person became an interested stockholder, unless: (i) prior to such date, the transaction is approved by the board of directors of the corporation; (ii) upon consummation of the transaction which resulted in the stockholder becoming an interested stockholder, the interested stockholder owns at least 85% of the outstanding voting stock; or (iii) on or after such date, the business combination is approved by the board of directors of the corporation and by affirmative vote of at least 66 2/3% of the outstanding voting stock which is not owned by the interested stockholder. A “business combination” includes mergers, asset sales and certain other transactions resulting in a financial benefit to the stockholder. An “interested stockholder” is a person who, together with affiliates and associates, owns (or within three years, did own) 15% or more of the corporation’s voting stock. Corporations, pursuant to a provision in their certificate of incorporation, may choose not to be governed by Section 203 of the DGCL. We have elected, pursuant to a provision in our second amended and restated certificate of incorporation, not to be governed by Section 203 of the DGCL until such time as CEI and its affiliates no longer hold, directly or indirectly, or cease to be the beneficial owners of, securities entitling them to cast a majority of the votes of holders of outstanding shares of common stock at any annual or special meeting of our stockholders.
Listing
We intend to apply to have our Class A common stock listed on the NYSE under the symbol “ATG.”
Transfer Agent and Registrar
The transfer agent and registrar for the Class A common stock is American Stock Transfer & Trust, LLC.
173
Table of Contents
SHARES ELIGIBLE FOR FUTURE SALE
Sale of Restricted Securities
Prior to this offering, there has been no public market for our capital stock. Future sales of our Class A common stock in the public market, or the availability of such shares for sale in the public market, could adversely affect market prices prevailing from time to time. Future sales of our Class A common stock in the public market or the perception that sales may occur, could adversely affect the prevailing market price at such time and our ability to raise equity capital in the future.
Upon consummation of this offering, we will have shares of our Class A common stock outstanding (or shares, if the underwriters exercise their option to purchase additional shares in full). Of these shares, the shares sold in this offering (or shares, if the underwriters exercise their option to purchase additional shares in full) will be freely tradable without further restriction or registration under the Securities Act, except that any shares purchased by our affiliates may generally only be sold in compliance with Rule 144, which is described below. Of the remaining outstanding shares, shares will be deemed “restricted securities” under the Securities Act.
In addition, upon consummation of this offering, CEI will hold shares of our Class B common stock. CEI will have the right to exchange their shares of our Class B common stock for shares of our Class A common stock on a one-for-one basis. Shares of our Class A common stock issuable to our existing investors upon an exchange of our Class B common stock and shares of our Class B common stock will be deemed “restricted securities” under the Securities Act. Restricted securities may be sold in the public market only if they qualify for an exemption from registration under Rule 144 or any other applicable exemption.
Lock-Up Arrangements and Registration Rights
In connection with this offering, we, each of our directors, executive officers, as well as certain other stockholders, will enter into lock-up agreements described under “Underwriting” that restrict the sale of our securities for up to 180 days after the date of this prospectus, subject to certain exceptions or an extension in certain circumstances.
In addition, following the expiration of the lock-up period, certain stockholders will have the right, subject to certain conditions, to require us to register the sale of their shares of our Class A common stock under federal securities laws. See “Certain Relationships and Related Person Transactions—Registration Rights Agreement.” If these stockholders exercise this right, our other existing stockholders may require us to register their registrable securities.
Following the lock-up periods described above, all of the shares of our Class A common stock that are restricted securities or are held by our affiliates as of the date of this prospectus will be eligible for sale in the public market in compliance with Rule 144 under the Securities Act.
Rule 144
The shares of our Class A common stock sold in this offering will generally be freely transferable without restriction or further registration under the Securities Act, except that any shares of our Class A common stock held by an “affiliate” of ours may not be resold publicly except in compliance with the registration requirements of the Securities Act or under an exemption under Rule 144 or otherwise. Rule 144 permits our Class A common stock that has been acquired by a person who is an affiliate of ours, or has been an affiliate of ours within the past three months, to be sold into the market in an amount that does not exceed, during any three-month period, the greater of:
| Ÿ | one percent of the total number of shares of our Class A common stock outstanding; or |
174
Table of Contents
| Ÿ | the average weekly reported trading volume of our Class A common stock for the four calendar weeks prior to the sale. |
Such sales are also subject to specific manner of sale provisions, a six-month holding period requirement, notice requirements and the availability of current public information about us.
Rule 144 also provides that a person who is not deemed to have been an affiliate of ours at any time during the three months preceding a sale, and who has for at least six months beneficially owned shares of our Class A common stock that are restricted securities, will be entitled to freely sell such shares of our Class A common stock subject only to the availability of current public information regarding us. A person who is not deemed to have been an affiliate of ours at any time during the three months preceding a sale, and who has beneficially owned for at least one year shares of our Class A common stock that are restricted securities, will be entitled to freely sell such shares of our Class A common stock under Rule 144 without regard to the current public information requirements of Rule 144.
Additional Registration Statements
We intend to file one or more registration statements on Form S-8 under the Securities Act to register shares of our Class A common stock to be issued or reserved for issuance under the 2012 Long-Term Incentive Plan and our Director Restricted Stock Plan and to register deferred compensation obligations under our Restoration Plan. Such registration statements are expected to be filed soon after the date of this prospectus and will automatically become effective upon filing with the SEC. Accordingly, shares registered under such registration statement, including shares of unrestricted Class A common stock, will be available for sale in the open market, unless such shares are subject to vesting restrictions with us or the lock-up restrictions described above.
175
Table of Contents
MATERIAL UNITED STATES FEDERAL INCOME AND ESTATE TAX CONSIDERATIONS
FOR NON-U.S. HOLDERS
The following is a summary of the material U.S. federal income and estate tax consequences of the purchase, ownership and disposition of our Class A common stock by a non-U.S. holder (as defined below) that acquires our Class A common stock in this offering and holds it as a “capital asset” within the meaning of Section 1221 of the U.S. Internal Revenue Code of 1986, as amended, or the Code. This discussion is based upon current provisions of the Code, Treasury regulations promulgated thereunder and administrative pronouncements, judicial decisions and other applicable authorities and interpretations thereof, all as of the date hereof and all of which are subject to change, possibly with retroactive effect. The foregoing are subject to differing interpretations that could affect the tax consequences described herein. This summary is necessarily general and may not discuss all of the tax consequences that may be relevant to investors in light of their particular circumstances, or to investors subject to special treatment under U.S. federal income tax laws, such as certain financial institutions or financial services entities, insurance companies, tax-exempt entities, dealers in securities or currencies, entities that are treated as partnerships for U.S. federal income tax purposes, “controlled foreign corporations,” “passive foreign investment companies,” former U.S. citizens or long-term residents, persons deemed to sell Class A common stock under the constructive sale provisions of the Code, and persons that hold Class A common stock as part of a straddle, hedge, conversion transaction, or other integrated investment. Furthermore, this discussion does not address any state, local or foreign tax laws.
For purposes of this summary, the term “non-U.S. holder” means a beneficial owner of our Class A common stock that is not a partnership and is not:
| Ÿ | an individual who is a citizen or resident of the United States; |
| Ÿ | a corporation (or other entity taxable as a corporation for U.S. federal income tax purposes) that is created or organized in or under the laws of the United States, any state thereof or the District of Columbia; |
| Ÿ | an estate the income of which is subject to U.S. federal income taxation regardless of its source; or |
| Ÿ | a trust if (1) a court within the United States is able to exercise primary supervision over the administration of the trust and one or more U.S. persons (as defined in the Code) have the authority to control all substantial decisions of that trust, or (2) it was in existence on August 20, 1996 and has a valid election in effect under applicable U.S. Treasury regulations to be treated as a domestic trust for U.S. federal income tax purposes. |
If a partnership (including any entity or arrangement treated as a partnership for U.S. federal income tax purposes) owns our Class A common stock, the U.S. federal income tax treatment of a partner in the partnership generally will depend upon the status of the partner and the activities of the partnership. Partners in a partnership that own our Class A common stock should consult their tax advisors as to the particular U.S. federal income tax consequences applicable to them.
We urge you to consult your tax advisors regarding the U.S. federal, state, local, and foreign income, estate and other tax consequences of the purchase, ownership, and disposition of our Class A common stock, including your status as a non-U.S. holder.
Distributions on Our Class A Common Stock
We do not anticipate making any distributions on our Class A common stock. See “Dividend Policy.” Nevertheless, if we make cash or other property distributions on our Class A common stock,
176
Table of Contents
such distributions generally will constitute dividends for U.S. federal income tax purposes to the extent paid from our current or accumulated earnings and profits, as determined under U.S. federal income tax principles. If a distribution exceeds our current and accumulated earnings and profits, such excess will first constitute a return of capital that reduces, but not below zero, a non-U.S. holder’s tax basis in our Class A common stock and will then be taxable as capital gain realized on the sale or other disposition of the Class A common stock, as described under “—Dispositions of Our Class A Common Stock” below.
Distributions that are treated as dividends generally will be subject to U.S. federal withholding tax at a rate of 30% of the gross amount of the dividends or at such lower rate specified by an applicable income tax treaty. To receive the benefit of a reduced treaty rate, a non-U.S. holder must furnish to the withholding agent a valid IRS Form W-8BEN or Form W-8IMY, as applicable (or any applicable successor form), certifying such holder’s qualification for the reduced rate in accordance with applicable Treasury regulations. Such certification must be provided to the withholding agent prior to the payment of dividends and must be updated periodically. Non-U.S. holders that do not timely provide to the withholding agent the required certification, but that qualify for a reduced treaty rate, may obtain a refund of any excess amounts withheld by timely filing an appropriate claim for refund with the IRS.
Any dividends paid on our Class A common stock that are effectively connected with a non-U.S. holder’s conduct of a trade or business in the United States are exempt from the 30% withholding tax described above if the non-U.S. holder provides to the withholding agent with an IRS Form W-8ECI properly certifying such exemption. Such effectively connected dividends generally will be subject to U.S. federal income tax on a net income basis at the regular graduated U.S. federal income tax rates in much the same manner as if such holder were a resident of the United States, unless the non-U.S. holder provides to the withholding agent an IRS Form W-8BEN properly certifying that such effectively connected income is exempt pursuant to an applicable income tax treaty because the income is not attributable to a permanent establishment maintained by the non-U.S. holder in the United States. A non-U.S. holder that is a foreign corporation also may be subject to an additional branch profits tax equal to 30% (or such lower rate specified by an applicable income tax treaty) of its effectively connected earnings and profits for the taxable year, as adjusted for certain items.
Non-U.S. holders are urged to consult with their tax advisors regarding any applicable income tax treaties that may provide for different rules. For purposes of the above certification requirements, those persons that, under United States federal income tax principles, are the beneficial owners of the dividends are generally treated as the taxpayers with respect to such dividends, rather than persons such as nominees or agents legally entitled to such payments from us or our paying agent.
Dispositions of Our Class A Common Stock
A non-U.S. holder generally will not be subject to U.S. federal income tax on any gain realized upon the sale or other disposition of our Class A common stock, unless:
| Ÿ | the gain is effectively connected with the non-U.S. holder’s conduct of a trade or business in the United States and, if required by an applicable income tax treaty, is attributable to a permanent establishment maintained by the non-U.S. holder in the United States; |
| Ÿ | the non-U.S. holder is a nonresident alien individual present in the United States for 183 days or more during the taxable year of the sale or disposition, and certain other requirements are met; or |
| Ÿ | our Class A common stock constitutes a “United States real property interest,” or USRPI, within the meaning of the Code, by reason of our status as a “United States real property holding |
177
Table of Contents
| corporation,” or USRPHC, within the meaning of the Code, at any time within the shorter of (i) the five-year period preceding the disposition or (ii) the non-U.S. holder’s holding period for our Class A common stock. |
Unless an applicable income tax treaty provides otherwise, gain described in the first bullet point above will be subject to U.S. federal income tax on a net income basis at the regular graduated U.S. federal income tax rates in much the same manner as if such holder were a resident of the United States. A non-U.S. holder that is a corporation also may be subject to an additional branch profits tax equal to 30% (or such lower rate specified by an applicable income tax treaty) of its effectively connected earnings and profits for the taxable year, as adjusted for certain items. Non-U.S. holders are urged to consult with their tax advisors regarding any applicable income tax treaties that may provide for different rules.
Gain described in the second bullet point above will be subject to U.S. federal income tax at a flat 30% rate (or such lower rate specified by an applicable income tax treaty), but may be offset by U.S. source capital losses from the same taxable year (even though the individual is not considered a resident of the United States), provided that the non-U.S. holder has timely filed a U.S. federal income tax return with respect to such losses.
As to the third bullet point above, we do not believe we are, and do not anticipate becoming, a USRPHC for U.S. federal income tax purposes. Further, even if we were to become a USRPHC, any gain recognized by a non U.S. Holder still would not be subject to U.S. federal income tax if the Class A common stock is considered to be “regularly traded” (within the meaning of applicable U.S. Treasury regulations) on an established securities market (e.g., the NYSE, on which the Class A common stock will be listed), and the non-U.S. Holder did not own, directly or indirectly, at any time during the five year period ending on the date of the sale or other disposition, more than 5% of the Class A common stock.
Federal Estate Tax
Class A common stock held by an individual at the time of such individual’s death, or held by an entity the property of which is includable in such individual’s gross estate for U.S. federal estate tax purposes, will be included in such individual’s gross estate for U.S. federal estate tax purposes and may be subject to U.S. federal estate tax, unless an applicable estate tax treaty provides otherwise.
Backup Withholding and Information Reporting
We must report annually to the IRS and to each non-U.S. holder the amount of the distributions on our Class A common stock paid to such holder and the amount of any tax withheld with respect to those distributions. These information reporting requirements apply even if no withholding was required because the distributions were effectively connected with the non-U.S. holder’s conduct of a United States trade or business or withholding was reduced or eliminated by an applicable income tax treaty. This information may be made available to the tax authorities in the country in which the non-U.S. holder resides or is established pursuant to a specific treaty or agreement.
Backup withholding, currently at a rate of 28%, generally will not apply to distributions paid to a non-U.S. holder of our Class A common stock provided the non-U.S. holder furnishes to the withholding agent the required certification as to its non-U.S. status, such as by providing a valid IRS Form W-8BEN or IRS Form W-8ECI, or certain other requirements are met. Notwithstanding the foregoing, backup withholding may apply if either we or the withholding agent has actual knowledge, or reason to know, that the holder is a U.S. person that is not an exempt recipient.
178
Table of Contents
Payments of the proceeds from a sale or other disposition by a non-U.S. holder of our Class A common stock effected outside the United States by or through a foreign office of a broker generally will not be subject to information reporting or backup withholding. However, information reporting (but not backup withholding) will apply to those payments if the broker does not have documentary evidence that the holder is a non-U.S. holder, an exemption is not otherwise established, and the broker has certain relationships with the United States.
Payments of the proceeds from a sale or other disposition by a non-U.S. holder of our Class A common stock effected by or through a U.S. office of a broker generally will be subject to information reporting and backup withholding (at the applicable rate) unless the non-U.S. holder establishes an exemption, for example, by properly certifying its non-U.S. status on an IRS Form W-8BEN or another appropriate version of IRS Form W-8. Notwithstanding the foregoing, information reporting and backup withholding may apply if the broker has actual knowledge, or reason to know, that the holder is a U.S. person that is not an exempt recipient.
Backup withholding is not an additional tax. Any amounts withheld under the backup withholding rules may be allowed as a refund or a credit against a non-U.S. holder’s U.S. federal income tax liability, provided the required information is timely furnished to the IRS.
Legislation Affecting Taxation of Class A Common Stock Held By or Through Foreign Entities
Recent legislation and applicable guidance will generally impose a 30% U.S. federal withholding tax on U.S.-source dividends paid after December 31, 2013 and on proceeds from the dispositions of certain stock paid after December 31, 2014, in both cases paid to or through a “foreign financial institution” (as specially defined under these rules), unless such institution enters into an agreement with the U.S. Treasury to collect and provide to the U.S. Treasury substantial information regarding U.S. account holders, including certain account holders that are foreign entities with U.S. owners, with such institution. The legislation also generally imposes a U.S. federal withholding tax of 30% on such payments of dividends and gross proceeds to or through a non-financial foreign entity unless such entity provides the withholding agent with a certification that it does not have any substantial U.S. owners or a certification identifying the direct and indirect substantial U.S. owners of the entity. Under certain circumstances, a holder may be eligible for refunds or credits of such taxes. Investors are urged to consult with their tax advisors regarding the possible implications of this recently enacted legislation on their investment in our Class A common stock.
179
Table of Contents
We and the underwriters named below have entered into an underwriting agreement with respect to the shares being offered. Subject to certain conditions, each underwriter has severally agreed to purchase the number of shares indicated in the following table. Goldman, Sachs & Co. and Morgan Stanley & Co. LLC are the representatives of the underwriters.
| Underwriters |
Number of Shares | |
| Goldman, Sachs & Co. |
||
| Morgan Stanley & Co. LLC |
||
| Allen & Company LLC |
||
| Barclays Capital Inc. |
||
| Citigroup Global Markets Inc. |
||
| Deutsche Bank Securities Inc. |
||
| SunTrust Robinson Humphrey, Inc. |
||
| Wells Fargo Securities, LLC |
||
| RBC Capital Markets, LLC |
||
| Raymond James & Associates, Inc. |
||
| Evercore Group L.L.C. |
||
| Guggenheim Securities, LLC |
||
| Mizuho Securities USA Inc. |
||
| Needham & Company, LLC |
||
| SMBC Nikko Capital Markets Limited |
||
| The Williams Capital Group, L.P. |
||
| Total |
||
|
|
The underwriters are committed to take and pay for all of the shares being offered, if any are taken, other than the shares covered by the option described below unless and until this option is exercised.
The underwriters have an option to buy up to an additional shares from us to cover sales by the underwriters of a greater number of shares than the total number set forth in the table above. They may exercise that option for 30 days. If any shares are purchased pursuant to this option, the underwriters will severally purchase shares in approximately the same proportion as set forth in the table above.
The following table shows the per share and total underwriting discounts and commissions to be paid to the underwriters by us. Such amounts are shown assuming both no exercise and full exercise of the underwriters’ option to purchase additional shares.
| Paid by Us | ||||||||
| No Exercise | Full Exercise | |||||||
| Per Share |
$ | $ | ||||||
| Total |
$ | $ | ||||||
Shares sold by the underwriters to the public will initially be offered at the initial public offering price set forth on the cover of this prospectus. Any shares sold by the underwriters to securities dealers may be sold at a discount of up to $ per share from the initial public offering price. After the initial offering of the shares, the representatives may change the offering price and the other selling terms. The offering of the shares by the underwriters is subject to receipt and acceptance and subject to the underwriters’ right to reject any order in whole or in part.
180
Table of Contents
We and our officers, directors and the holders of substantially all of our common stock have agreed with the underwriters, subject to certain exceptions, not to dispose of or hedge any of their common stock or securities convertible into or exchangeable for shares of common stock during the period from the date of this prospectus continuing through the date 180 days after the date of this prospectus, except with the prior written consent of Goldman, Sachs & Co. and Morgan Stanley & Co. LLC. This agreement does not apply to any existing employee benefit plans. See “Shares Eligible for Future Sale” for a discussion of certain transfer restrictions.
The 180-day restricted period described in the preceding paragraph will be automatically extended if: (1) during the last 17 days of the 180-day restricted period we issue an earnings release or announce material news or a material event relating to us; or (2) prior to the expiration of the 180-day restricted period, we announce that we will release earnings results during the 15-day period following the last day of the 180-day period, in which case the restrictions described in the preceding paragraph will continue to apply until the expiration of the 18-day period beginning on the issuance of the earnings release or the announcement of the material news or material event.
Prior to the offering, there has been no public market for the shares. The initial public offering price has been negotiated between us and the representatives. Among the factors considered in determining the initial public offering price of the shares, in addition to prevailing market conditions, were our historical performance, estimates of our business potential and earnings prospects, an assessment of our management and the consideration of the above factors in relation to market valuation of companies in related businesses.
After the pricing of the offering, we expect our Class A common stock will be listed on the NYSE under the symbol “ATG.”
In connection with the offering, the underwriters may purchase and sell shares of our Class A common stock in the open market. These transactions may include short sales, stabilizing transactions and purchases to cover positions created by short sales. Short sales involve the sale by the underwriters of a greater number of shares than they are required to purchase in the offering, and a short position represents the amount of such sales that have not been covered by subsequent purchases. A “covered short position” is a short position that is not greater than the amount of additional shares for which the underwriters’ option described above may be exercised. The underwriters may cover any covered short position by either exercising their option to purchase additional shares or purchasing shares in the open market. In determining the source of shares to cover the covered short position, the underwriters will consider, among other things, the price of shares available for purchase in the open market as compared to the price at which they may purchase additional shares pursuant to the option described above. “Naked” short sales are any short sales that create a short position greater than the amount of additional shares for which the option described above may be exercised. The underwriters must cover any such naked short position by purchasing shares in the open market. A naked short position is more likely to be created if the underwriters are concerned that there may be downward pressure on the price of our Class A common stock in the open market after pricing that could adversely affect investors who purchase in the offering. Stabilizing transactions consist of various bids for or purchases of our Class A common stock made by the underwriters in the open market prior to the completion of the offering.
The underwriters may also impose a penalty bid. This occurs when a particular underwriter repays to the underwriters a portion of the underwriting discount received by it because the representatives have repurchased shares sold by or for the account of such underwriter in stabilizing or short covering transactions.
Purchases to cover a short position and stabilizing transactions, as well as other purchases by the underwriters for their own accounts, may have the effect of preventing or retarding a decline in the
181
Table of Contents
market price of our Class A common stock, and together with the imposition of the penalty bid, may stabilize, maintain or otherwise affect the market price of our Class A common stock. As a result, the price of our Class A common stock may be higher than the price that otherwise might exist in the open market. The underwriters are not required to engage in these activities and may end any of these activities at any time. These transactions may be effected on the NYSE, in the over-the-counter market or otherwise.
European Economic Area
In relation to each Member State of the European Economic Area which has implemented the Prospectus Directive, or, each, a Relevant Member State, each underwriter has represented and agreed that with effect from and including the date on which the Prospectus Directive is implemented in that Relevant Member State, or the Relevant Implementation Date, it has not made and will not make an offer of shares to the public in that Relevant Member State prior to the publication of a prospectus in relation to the shares which has been approved by the competent authority in that Relevant Member State or, where appropriate, approved in another Relevant Member State and notified to the competent authority in that Relevant Member State, all in accordance with the Prospectus Directive, except that it may, with effect from and including the Relevant Implementation Date, make an offer of shares to the public in that Relevant Member State at any time:
| Ÿ | to legal entities which are authorised or regulated to operate in the financial markets or, if not so authorised or regulated, whose corporate purpose is solely to invest in securities; |
| Ÿ | to any legal entity which has two or more of (1) an average of at least 250 employees during the last financial year; (2) a total balance sheet of more than €43,000,000 and (3) an annual net turnover of more than €50,000,000, as shown in its last annual or consolidated accounts; |
| Ÿ | to fewer than 100 natural or legal persons (other than qualified investors as defined in the Prospectus Directive) subject to obtaining the prior consent of Goldman, Sachs & Co. and Morgan Stanley & Co. LLC for any such offer; or |
| Ÿ | in any other circumstances which do not require the publication by the Issuer of a prospectus pursuant to Article 3 of the Prospectus Directive. |
For the purposes of this provision, the expression an “offer of shares to the public” in relation to any shares in any Relevant Member State means the communication in any form and by any means of sufficient information on the terms of the offer and the shares to be offered so as to enable an investor to decide to purchase or subscribe the shares, as the same may be varied in that Relevant Member State by any measure implementing the Prospectus Directive in that Relevant Member State and the expression Prospectus Directive means Directive 2003/71/EC and includes any relevant implementing measure in each Relevant Member State.
United Kingdom
Each underwriter has represented and agreed that:
| Ÿ | it has only communicated or caused to be communicated and will only communicate or cause to be communicated an invitation or inducement to engage in investment activity (within the meaning of Section 21 of the Financial Services and Markets Act 2000, or the FSMA) received by it in connection with the issue or sale of the shares in circumstances in which Section 21(1) of the FSMA does not apply to us; and |
| Ÿ | it has complied and will comply with all applicable provisions of the FSMA with respect to anything done by it in relation to the shares in, from or otherwise involving the United Kingdom. |
182
Table of Contents
Hong Kong
The shares may not be offered or sold by means of any document other than (i) in circumstances which do not constitute an offer to the public within the meaning of the Companies Ordinance (Cap.32, Laws of Hong Kong), (ii) to “professional investors” within the meaning of the Securities and Futures Ordinance (Cap.571, Laws of Hong Kong) and any rules made thereunder, or (iii) in other circumstances which do not result in the document being a “prospectus” within the meaning of the Companies Ordinance (Cap.32, Laws of Hong Kong), and no advertisement, invitation or document relating to the shares may be issued or may be in the possession of any person for the purpose of issue (in each case whether in Hong Kong or elsewhere), which is directed at, or the contents of which are likely to be accessed or read by, the public in Hong Kong (except if permitted to do so under the laws of Hong Kong) other than with respect to shares which are or are intended to be disposed of only to persons outside Hong Kong or only to “professional investors” within the meaning of the Securities and Futures Ordinance (Cap. 571, Laws of Hong Kong) and any rules made thereunder.
Singapore
This prospectus has not been registered as a prospectus with the Monetary Authority of Singapore. Accordingly, this prospectus and any other document or material in connection with the offer or sale, or invitation for subscription or purchase, of the shares may not be circulated or distributed, nor may the shares be offered or sold, or be made the subject of an invitation for subscription or purchase, whether directly or indirectly, to persons in Singapore other than (i) to an institutional investor under Section 274 of the Securities and Futures Act, Chapter 289 of Singapore, or the SFA, (ii) to a relevant person, or any person pursuant to Section 275(1A), and in accordance with the conditions, specified in Section 275 of the SFA or (iii) otherwise pursuant to, and in accordance with the conditions of, any other applicable provision of the SFA.
Where the shares are subscribed or purchased under Section 275 by a relevant person which is: (a) a corporation (which is not an accredited investor) the sole business of which is to hold investments and the entire share capital of which is owned by one or more individuals, each of whom is an accredited investor; or (b) a trust (where the trustee is not an accredited investor) whose sole purpose is to hold investments and each beneficiary is an accredited investor, shares, debentures and units of shares and debentures of that corporation or the beneficiaries’ rights and interest in that trust shall not be transferable for 6 months after that corporation or that trust has acquired the shares under Section 275 except: (1) to an institutional investor under Section 274 of the SFA or to a relevant person, or any person pursuant to Section 275(1A), and in accordance with the conditions, specified in Section 275 of the SFA; (2) where no consideration is given for the transfer; or (3) by operation of law.
Japan
The securities have not been and will not be registered under the Financial Instruments and Exchange Law of Japan (the Financial Instruments and Exchange Law) and each underwriter has agreed that it will not offer or sell any securities, directly or indirectly, in Japan or to, or for the benefit of, any resident of Japan (which term as used herein means any person resident in Japan, including any corporation or other entity organized under the laws of Japan), or to others for re-offering or resale, directly or indirectly, in Japan or to a resident of Japan, except pursuant to an exemption from the registration requirements of, and otherwise in compliance with, the Financial Instruments and Exchange Law and any other applicable laws, regulations and ministerial guidelines of Japan.
The underwriters do not expect sales to discretionary accounts to exceed five percent of the total number of shares offered.
183
Table of Contents
We estimate that our share of the total expenses of the offering, excluding underwriting discounts and commissions, will be approximately $ .
We have agreed to indemnify the several underwriters and , in its capacity as qualified independent underwriter, against certain liabilities, including liabilities under the Securities Act.
The underwriters and their respective affiliates are full service financial institutions engaged in various activities, which may include sales and trading, commercial and investment banking, advisory, investment management, investment research, principal investment, hedging, market making, brokerage and other financial and non-financial activities and services. Certain of the underwriters and their respective affiliates have provided, and may in the future provide, a variety of these services to us and to persons and entities with relationships with us, for which they received or will receive customary fees and expenses. Certain affiliates of the underwriters are lenders under our credit facilities and are expected to receive a portion of the net proceeds from this offering in connection with our repayment of indebtedness under our credit facilities, as described in “Use of Proceeds.”
In the ordinary course of their various business activities, the underwriters and their respective affiliates, officers, directors and employees may purchase, sell or hold a broad array of investments and actively trade securities, derivatives, loans, commodities, currencies, credit default swaps and other financial instruments for their own account and for the accounts of their customers, and such investment and trading activities may involve or relate to assets, securities and/or instruments of ours (directly, as collateral securing other obligations or otherwise) and/or persons and entities with relationships with us. The underwriters and their respective affiliates may also communicate independent investment recommendations, market color or trading ideas and/or publish or express independent research views in respect of such assets, securities or instruments and may at any time hold, or recommend to clients that they should acquire, long and/or short positions in such assets, securities and instruments.
Conflicts of Interest
We expect to use more than 5% of the net proceeds from the sale of our Class A common stock to repay indebtedness under our credit facilities owed by us to certain affiliates of the underwriters. See “Use of Proceeds” and “Description of Material Indebtedness.” Accordingly, the offering is being made in compliance with the requirements of Rule 5121. This rule provides generally that if more than 5% of the net proceeds from the sale of securities, not including underwriting compensation, is paid to the underwriters or their affiliates, a “qualified independent underwriter,” as defined in Rule 5121, must participate in the preparation of the registration statement of which this prospectus forms a part and perform its usual standard of due diligence with respect thereto. is assuming the responsibilities of acting as the qualified independent underwriter in conducting due diligence. We have agreed to indemnify against certain liabilities incurred in connection with acting as “qualified independent underwriter” for this offering, including liabilities under the Securities Act. In accordance with Rule 5121, the underwriters who receive more than 5% of the net proceeds from this offering will not sell shares of our Class A common stock to a discretionary account without receiving the written approval from the account holder.
184
Table of Contents
We are being represented by Weil, Gotshal and Manges LLP, New York, New York, and Dow Lohnes PLLC, Washington, D.C., in connection with this offering. Dow Lohnes PLLC in Washington, D.C. will pass upon the validity of the shares of Class A common stock offered under this prospectus. The underwriters are being represented by Davis Polk & Wardwell LLP, New York, New York, in connection with the offering.
The consolidated financial statements of AutoTrader Group, Inc. and subsidiaries, as of December 31, 2011 and 2010, and for each of the three years in the period ended December 31, 2011, included in this Prospectus, have been audited by Deloitte & Touche LLP, an independent registered public accounting firm, as stated in their report appearing herein (which report expresses an unqualified opinion and includes an explanatory paragraph regarding the company’s change in accounting for redeemable common stock). Such consolidated financial statements have been so included in reliance upon the report of such firm given upon their authority as experts in accounting and auditing.
The combined financial statements of Kelley Blue Book Co., Inc. and APJ Holdings Inc. for the year ended December 31, 2009 and the period from January 1 to December 14, 2010, included in this Prospectus have been audited by Deloitte & Touche LLP, independent auditors, as stated in their report appearing herein, and are included in reliance upon the report of such firm given upon their authority as experts in accounting and auditing.
The financial statements of vAuto, Inc. for the period from January 1 to October 15, 2010 included in this Prospectus have been audited by Crowe Horwath LLP, independent auditors, as stated in their report appearing herein, and are included in reliance upon the report of such firm given upon their authority as experts in accounting and auditing.
185
Table of Contents
WHERE YOU CAN FIND MORE INFORMATION
We have filed with the SEC a registration statement on Form S-1 under the Securities Act, with respect to the shares of Class A common stock offered hereby. This prospectus does not contain all of the information set forth in the registration statement and the exhibits and schedules thereto. For further information with respect to us and the shares of Class A common stock offered hereby, you should refer to the registration statement and to the exhibits and schedules filed therewith. Statements contained in this prospectus regarding the contents of any contract or any other document that is filed as an exhibit to the registration statement are not necessarily complete, and each such statement is qualified in all respects by reference to the full text of such contract or other document filed as an exhibit to the registration statement. When we complete this offering, we will be required to file annual, quarterly and current reports, proxy statements and other information with the SEC. Our SEC filings, including our registration statement and the exhibits and schedules thereto, may be inspected without charge at the public reference room maintained by the SEC located at 100 F Street, N.E., Room 1580, Washington, D.C. 20549. Copies of all or any portion of the registration statements and the filings may be obtained from such offices upon payment of prescribed fees. The public may obtain information on the operation of the public reference room by calling the SEC at 1-800-SEC-0330 or (202) 551-8090. The SEC maintains a website at www.sec.gov that contains reports, proxy and information statements and other information regarding registrants that file electronically with the SEC.
You may obtain a copy of any of our filings, at no cost, by writing or telephoning us at:
AutoTrader Group, Inc.
3003 Summit Boulevard
Atlanta, GA 30319
(404) 568-8000
Attn: Investor Relations
186
Table of Contents
F-1
Table of Contents
REPORT OF INDEPENDENT REGISTERED PUBLIC ACCOUNTING FIRM
To the Board of Directors and Stockholders of
AutoTrader Group, Inc.
Atlanta, Georgia
We have audited the accompanying consolidated balance sheets of AutoTrader Group, Inc. (formerly AutoTrader.com, Inc.) and subsidiaries (the “Company”) (an indirect, majority owned subsidiary of Cox Enterprises, Inc.) as of December 31, 2010 and 2011, and the related consolidated statements of income, stockholders’ equity and redeemable common stock, and cash flows for the years ended December 31, 2009, 2010 and 2011. These financial statements and are the responsibility of the Company’s management. Our responsibility is to express an opinion on the financial statements based on our audits.
We conducted our audits in accordance with the standards of the Public Company Accounting Oversight Board (United States). Those standards require that we plan and perform the audit to obtain reasonable assurance about whether the financial statements are free of material misstatement. The Company is not required to have, nor were we engaged to perform, an audit of its internal control over financial reporting. Our audits included consideration of internal control over financial reporting as a basis for designing audit procedures that are appropriate in the circumstances, but not for the purpose of expressing an opinion on the effectiveness of the Company’s internal control over financial reporting. Accordingly, we express no such opinion. An audit also includes examining, on a test basis, evidence supporting the amounts and disclosures in the financial statements, assessing the accounting principles used and significant estimates made by management, as well as evaluating the overall financial statement presentation. We believe that our audits provide a reasonable basis for our opinion.
In our opinion, such consolidated financial statements present fairly, in all material respects, the financial position of the Company as of December 31, 2010 and 2011, and the results of their operations and their cash flows for the years ended December 31, 2009, 2010 and 2011, in conformity with accounting principles generally accepted in the United States of America.
As discussed in Note 2, effective January 1, 2009, the Company changed its method of accounting for redeemable common stock and applied such change retrospectively to all periods.
/s/ Deloitte & Touche LLP
Atlanta, Georgia
June 15, 2012 (November 13, 2012 as to the effects of the stock split described in Note 17)
F-2
Table of Contents
(formerly AutoTrader.com, Inc.)
CONSOLIDATED BALANCE SHEETS
AS OF DECEMBER 31, 2010 AND 2011
(In thousands, except per share amounts)
| 2010 | 2011 | |||||||
| ASSETS |
||||||||
| CURRENT ASSETS: |
||||||||
| Amounts due from Cox Enterprises, Inc |
$ | 4,056 | $ | 2,476 | ||||
| Accounts receivable—less allowance for doubtful accounts of $3,742 and $3,043, respectively |
95,575 | 94,166 | ||||||
| Prepaid expenses |
22,721 | 18,642 | ||||||
| Deferred income tax assets |
1,387 | 15,471 | ||||||
| Other current assets |
2,155 | 2,761 | ||||||
|
|
|
|
|
|||||
| Total current assets |
125,894 | 133,516 | ||||||
| PROPERTY AND EQUIPMENT—Net |
177,231 | 197,621 | ||||||
| GOODWILL |
553,392 | 622,539 | ||||||
| INTANGIBLE ASSETS—Net |
552,698 | 545,982 | ||||||
| OTHER |
12,494 | 11,492 | ||||||
|
|
|
|
|
|||||
| TOTAL ASSETS |
$ | 1,421,709 | $ | 1,511,150 | ||||
|
|
|
|
|
|||||
| LIABILITIES, REDEEMABLE COMMON STOCK AND STOCKHOLDERS’ EQUITY |
||||||||
| CURRENT LIABILITIES: |
||||||||
| Current portion of long-term debt |
$ | 17,500 | $ | 26,500 | ||||
| Accounts payable |
44,147 | 49,742 | ||||||
| Accrued expenses |
39,596 | 44,600 | ||||||
| Current portion of long-term incentive compensation |
5,539 | 34,011 | ||||||
| Other current liabilities |
17,508 | 27,011 | ||||||
|
|
|
|
|
|||||
| Total current liabilities |
124,290 | 181,864 | ||||||
| LONG-TERM DEBT |
868,019 | 865,936 | ||||||
| LONG-TERM INCENTIVE COMPENSATION |
35,880 | 14,750 | ||||||
| DEFERRED INCOME TAXES |
92,672 | 90,874 | ||||||
| OTHER LIABILITIES |
52,020 | 35,423 | ||||||
|
|
|
|
|
|||||
| Total liabilities |
1,172,881 | 1,188,847 | ||||||
|
|
|
|
|
|||||
| COMMITMENTS AND CONTINGENCIES (See Note 12) |
||||||||
| REDEEMABLE COMMON STOCK |
39,786 | 57,290 | ||||||
|
|
|
|
|
|||||
| STOCKHOLDERS’ EQUITY: |
||||||||
| Common stock(1): |
||||||||
| Class A, $0.001 par value—authorized, 500,000 shares; issued and outstanding, 70,730 shares (2,364 of which are redeemable) (See Note 1) |
68 | 68 | ||||||
| Class B, $0.001 par value—authorized, 15,000 shares; issued and outstanding, 1,003 and 1,106 shares, respectively (all of which are redeemable) (See Note 1) |
— | — | ||||||
| Class C, $0.001 par value—authorized, 200,000 shares; issued and outstanding, 121,352 shares |
120 | 120 | ||||||
| Additional paid-in capital(1) (See Note 1) |
677,158 | 681,038 | ||||||
| Treasury stock |
(539,395 | ) | (539,395 | ) | ||||
| Retained earnings (See Note 1) |
71,091 | 123,182 | ||||||
|
|
|
|
|
|||||
| Total stockholders’ equity |
209,042 | 265,013 | ||||||
|
|
|
|
|
|||||
| TOTAL LIABILITIES, REDEEMABLE COMMON STOCK AND STOCKHOLDERS' EQUITY |
$ | 1,421,709 | $ | 1,511,150 | ||||
|
|
|
|
|
|||||
| (1) | The Company amended its certificate of incorporation effective September 30, 2012 to increase the number of authorized shares and to effect a four-for-one stock split of its common stock. |
See notes to consolidated financial statements.
F-3
Table of Contents
(formerly AutoTrader.com, Inc.)
CONSOLIDATED STATEMENTS OF INCOME
YEARS ENDED DECEMBER 31, 2009, 2010, AND 2011
(In thousands, except per share amounts)
| 2009 | 2010 | 2011 | ||||||||||
| REVENUES |
$ | 629,450 | $ | 737,827 | $ | 1,025,177 | ||||||
|
|
|
|
|
|
|
|||||||
| OPERATING EXPENSES: |
||||||||||||
| Operations (excluding depreciation and amortization) |
106,190 | 117,471 | 197,187 | |||||||||
| Sales and marketing (excluding depreciation and amortization) |
331,285 | 371,060 | 402,054 | |||||||||
| General and administrative (excluding depreciation and amortization) |
55,605 | 68,293 | 117,381 | |||||||||
| Depreciation and amortization |
120,471 | 65,325 | 122,951 | |||||||||
| Impairment of goodwill |
— | — | 36,216 | |||||||||
| Other |
1,374 | 1,131 | 9,634 | |||||||||
|
|
|
|
|
|
|
|||||||
| Total operating expenses |
614,925 | 623,280 | 885,423 | |||||||||
|
|
|
|
|
|
|
|||||||
| INCOME FROM OPERATIONS |
14,525 | 114,547 | 139,754 | |||||||||
|
|
|
|
|
|
|
|||||||
| OTHER INCOME (EXPENSE): |
||||||||||||
| Interest income (expense)—net |
379 | (15,829 | ) | (33,030 | ) | |||||||
| Loss on early retirement of debt |
— | (23,370 | ) | — | ||||||||
| Other income (expense)—net |
— | (867 | ) | 19 | ||||||||
|
|
|
|
|
|
|
|||||||
| Total other income (expense) |
379 | (40,066 | ) | (33,011 | ) | |||||||
|
|
|
|
|
|
|
|||||||
| INCOME BEFORE INCOME TAXES |
14,904 | 74,481 | 106,743 | |||||||||
| INCOME TAX EXPENSE |
5,045 | 25,357 | 38,692 | |||||||||
|
|
|
|
|
|
|
|||||||
| NET INCOME |
$ | 9,859 | $ | 49,124 | $ | 68,051 | ||||||
|
|
|
|
|
|
|
|||||||
| NET INCOME PER COMMON SHARE(1): |
||||||||||||
| Basic |
$ | 0.05 | $ | 0.26 | $ | 0.35 | ||||||
|
|
|
|
|
|
|
|||||||
| Diluted |
$ | 0.05 | $ | 0.26 | $ | 0.35 | ||||||
|
|
|
|
|
|
|
|||||||
| WEIGHTED AVERAGE SHARES OUTSTANDING(1): |
||||||||||||
| Basic |
211,928 | 190,024 | 193,168 | |||||||||
|
|
|
|
|
|
|
|||||||
| Diluted |
212,612 | 190,236 | 193,484 | |||||||||
|
|
|
|
|
|
|
|||||||
| (1) | The Company amended its certificate of incorporation effective September 30, 2012 to increase the number of authorized shares and to effect a four-for-one stock split of its common stock. |
See notes to consolidated financial statements.
F-4
Table of Contents
(formerly AutoTrader.com, Inc.)
CONSOLIDATED STATEMENTS OF STOCKHOLDERS’ EQUITY AND REDEEMABLE COMMON STOCK
YEARS ENDED DECEMBER 31, 2009, 2010, AND 2011
(In thousands)
| Common Stock(1) | Additional Paid-In Capital(1) |
Treasury Stock |
Retained Earnings |
Total Stockholders’ Equity |
Redeemable Common Stock |
|||||||||||||||||||||||||||||||
| Class A Shares |
Class B Shares |
Class C Shares |
Par Value |
|||||||||||||||||||||||||||||||||
| BALANCE—December 31, 2008 |
96,856 | 1,556 | 113,604 | $ | 212 | $ | 357,174 | $ | — | $ | 75,581 | $ | 432,967 | $ | — | |||||||||||||||||||||
| Change in accounting policy—redeemable common stock |
(3,452 | ) | (1,556 | ) | — | (4 | ) | 3,480 | — | (60,975 | ) | (57,499 | ) | 57,499 | ||||||||||||||||||||||
|
|
|
|
|
|
|
|
|
|
|
|
|
|
|
|
|
|
|
|||||||||||||||||||
| BALANCE—December 31, 2008 |
93,404 | — | 113,604 | 208 | 360,654 | — | 14,606 | 375,468 | 57,499 | |||||||||||||||||||||||||||
| Repurchase of stock |
— | — | — | — | — | — | — | — | (7,576 | ) | ||||||||||||||||||||||||||
| Settlement of long-term incentive compensation awards |
— | — | — | — | — | — | — | — | 1,330 | |||||||||||||||||||||||||||
| Change in redemption value of redeemable common stock |
— | — | — | — | — | — | (3,647 | ) | (3,647 | ) | 3,647 | |||||||||||||||||||||||||
| Other |
— | — | — | — | 15 | — | — | 15 | — | |||||||||||||||||||||||||||
| Net income |
— | — | — | — | — | — | 9,859 | 9,859 | — | |||||||||||||||||||||||||||
|
|
|
|
|
|
|
|
|
|
|
|
|
|
|
|
|
|
|
|||||||||||||||||||
| BALANCE—December 31, 2009 |
93,404 | — | 113,604 | 208 | 360,669 | — | 20,818 | 381,695 | 54,900 | |||||||||||||||||||||||||||
| Repurchase of stock |
(33,348 | ) | — | (8,720 | ) | (44 | ) | — | (539,395 | ) | — | (539,439 | ) | (15,581 | ) | |||||||||||||||||||||
| Issuance of stock |
8,308 | — | 16,468 | 24 | 316,489 | — | — | 316,513 | — | |||||||||||||||||||||||||||
| Settlement of long-term incentive compensation awards |
— | — | — | — | — | — | — | — | 1,616 | |||||||||||||||||||||||||||
| Change in redemption value of redeemable common stock |
— | — | — | — | — | — | 1,149 | 1,149 | (1,149 | ) | ||||||||||||||||||||||||||
| Net income |
— | — | — | — | — | — | 49,124 | 49,124 | — | |||||||||||||||||||||||||||
|
|
|
|
|
|
|
|
|
|
|
|
|
|
|
|
|
|
|
|||||||||||||||||||
| BALANCE—December 31, 2010 |
68,364 | — | 121,352 | 188 | 677,158 | (539,395 | ) | 71,091 | 209,042 | 39,786 | ||||||||||||||||||||||||||
| Stock-based compensation |
— | — | — | — | 3,880 | — | — | 3,880 | — | |||||||||||||||||||||||||||
| Settlement of long-term incentive compensation awards |
— | — | — | — | — | — | — | — | 1,334 | |||||||||||||||||||||||||||
| Change in redemption value of redeemable common stock |
— | — | — | — | — | — | (15,960 | ) | (15,960 | ) | 15,960 | |||||||||||||||||||||||||
| Other |
— | — | — | — | — | — | — | — | 210 | |||||||||||||||||||||||||||
| Net income |
— | — | — | — | — | — | 68,051 | 68,051 | — | |||||||||||||||||||||||||||
|
|
|
|
|
|
|
|
|
|
|
|
|
|
|
|
|
|
|
|||||||||||||||||||
| BALANCE—December 31, 2011 |
68,364 | — | 121,352 | $ | 188 | $ | 681,038 | $ | (539,395 | ) | $ | 123,182 | $ | 265,013 | $ | 57,290 | ||||||||||||||||||||
|
|
|
|
|
|
|
|
|
|
|
|
|
|
|
|
|
|
|
|||||||||||||||||||
| (1) | The Company amended its certificate of incorporation effective September 30, 2012 to increase the number of authorized shares and to effect a four-for-one stock split of its common stock. |
See notes to consolidated financial statements.
F-5
Table of Contents
(formerly AutoTrader.com, Inc.)
CONSOLIDATED STATEMENTS OF CASH FLOWS
YEARS ENDED DECEMBER 31, 2009, 2010, AND 2011
(In thousands)
| 2009 | 2010 | 2011 | ||||||||||
| CASH FLOWS FROM OPERATING ACTIVITIES: |
||||||||||||
| Net income |
$ | 9,859 | $ | 49,124 | $ | 68,051 | ||||||
| Adjustments to reconcile net income to net cash provided by operating activities: |
||||||||||||
| Depreciation and amortization |
120,471 | 65,325 | 122,951 | |||||||||
| Impairment of goodwill |
— | — | 36,216 | |||||||||
| Non-cash loss on early retirement of debt |
— | 20,670 | — | |||||||||
| Long-term incentive compensation expense |
11,560 | 24,040 | 19,136 | |||||||||
| Payment of long-term incentive compensation |
(30,786 | ) | (9,826 | ) | (6,604 | ) | ||||||
| Deferred income taxes |
(3,861 | ) | (8,868 | ) | (15,882 | ) | ||||||
| Other |
1,374 | 2,902 | 10,494 | |||||||||
| Changes in assets and liabilities: |
||||||||||||
| Decrease (increase) in accounts receivable |
7,848 | (17,432 | ) | 1,622 | ||||||||
| (Increase) decrease in prepaid expenses and other assets |
(329 | ) | (3,098 | ) | 6,579 | |||||||
| (Decrease) increase in accounts payable, accrued expenses and other liabilities |
(5,319 | ) | 25,556 | 4,446 | ||||||||
|
|
|
|
|
|
|
|||||||
| Net cash provided by operating activities |
110,817 | 148,393 | 247,009 | |||||||||
|
|
|
|
|
|
|
|||||||
| CASH FLOWS FROM INVESTING ACTIVITIES: |
||||||||||||
| Capital expenditures |
(62,610 | ) | (51,351 | ) | (90,382 | ) | ||||||
| Businesses acquired, net of cash acquired |
(7,525 | ) | (786,777 | ) | (134,107 | ) | ||||||
| Proceeds from sale of assets |
68 | 3 | 371 | |||||||||
| (Increase) decrease in amounts due from Cox Enterprises, Inc |
(33,189 | ) | 75,560 | 1,714 | ||||||||
|
|
|
|
|
|
|
|||||||
| Net cash used in investing activities |
(103,256 | ) | (762,565 | ) | (222,404 | ) | ||||||
|
|
|
|
|
|
|
|||||||
| CASH FLOWS FROM FINANCING ACTIVITIES: |
||||||||||||
| Proceeds from issuance of stock |
— | 314,821 | — | |||||||||
| Proceeds from borrowings on credit facilities, net of original issue discounts |
— | 1,469,500 | 397,000 | |||||||||
| Repayments of borrowings on credit facilities |
— | (590,000 | ) | (390,500 | ) | |||||||
| Payment of debt issuance costs |
— | (25,129 | ) | (3,777 | ) | |||||||
| Repurchase of stock |
(7,576 | ) | (555,020 | ) | — | |||||||
| Payment of contingent consideration |
— | — | (27,428 | ) | ||||||||
| Other |
15 | — | 100 | |||||||||
|
|
|
|
|
|
|
|||||||
| Net cash (used in) provided by financing activities |
(7,561 | ) | 614,172 | (24,605 | ) | |||||||
|
|
|
|
|
|
|
|||||||
| NET CHANGE IN CASH |
— | — | — | |||||||||
| CASH—Beginning of year |
— | — | — | |||||||||
|
|
|
|
|
|
|
|||||||
| CASH—End of year |
$ | — | $ | — | $ | — | ||||||
|
|
|
|
|
|
|
|||||||
| SIGNIFICANT NON-CASH TRANSACTIONS: |
||||||||||||
| Settlement of long-term incentive compensation awards by issuance of Class B common stock |
$ | 1,330 | $ | 1,616 | $ | 1,334 | ||||||
| (Decrease) increase in accrued capital expenditures—net |
(11,793 | ) | 2,328 | (225 | ) | |||||||
| Receivable for issuance of stock |
— | 1,692 | — | |||||||||
| Leasehold improvements funded by landlord |
— | 9,884 | 6,049 | |||||||||
| Contingent additional consideration for businesses acquired |
— | 27,428 | 10,633 | |||||||||
| SUPPLEMENTAL DISCLOSURES OF CASH FLOW INFORMATION: |
||||||||||||
| Cash received (paid) during the year for: |
||||||||||||
| Interest |
$ | 448 | $ | (13,599 | ) | $ | (34,415 | ) | ||||
| Taxes |
(9,939 | ) | (38,624 | ) | (48,470 | ) | ||||||
See notes to consolidated financial statements.
F-6
Table of Contents
(formerly, AutoTrader.com, Inc.)
NOTES TO CONSOLIDATED FINANCIAL STATEMENTS
AS OF DECEMBER 31, 2010 AND 2011, AND FOR THE YEARS ENDED
DECEMBER 31, 2009, 2010, AND 2011
1. THE COMPANY
AutoTrader Group, Inc. (“ATG” or the “Company”) connects in-market car shoppers and sellers through its AutoTrader.com, Inc. (“ATC”) and KBB.com websites, which showcase car listings in local markets throughout the United States, as well as descriptive content relating to cars. It also offers car dealers software solutions to help them source, appraise, manage, price and market their inventory, and helps them manage their consumer relationships.
The Company is an indirect, majority-owned subsidiary of Manheim, Inc. (“Manheim”), which in turn is a wholly-owned subsidiary of Cox Enterprises, Inc. (“CEI”). Non-controlling interests are held by affiliates of Providence Equity Partners, LLC (“Providence”), affiliates of KPCB Holdings, Inc. (“KPCB”), current and former CEI executives, and Company employees. See Note 9 for further information regarding the Company’s ownership structure.
In May 2012, a new Delaware corporation, ATG, was formed, and ATG, in turn, formed a wholly-owned subsidiary, (“Merger Sub”). In June 2012, pursuant to an agreement and plan of merger, Merger Sub merged with and into ATC, with ATC as the surviving corporation and, as a result, a wholly-owned subsidiary of ATG. Prior to the merger, shares of Class B common stock (non-voting) of ATC, in accordance with their terms, were converted into shares of Class A common stock (one vote per share) of ATC on a 1-for-1 share basis. In the merger, the previous stockholders of ATC received stock of ATG as consideration. Specifically, the holders of Class C common stock (ten votes per share) of ATC received Class B common stock (ten votes per share) of ATG on a 1-for-1 share basis, the holders of Class A common stock (one vote per share) of ATC received Class A common stock (one vote per share) of ATG on a 1-for-1 share basis.
The Company has no significant operations outside of the United States of America.
2. SUMMARY OF SIGNIFICANT ACCOUNTING POLICIES
Basis of Presentation—These consolidated financial statements have been prepared on the historical cost basis in accordance with accounting principles generally accepted in the United States of America. The merger of ATG and ATC represents a merger between commonly controlled entities. Accordingly, the accompanying consolidated financial statements present the consolidated financial position, results of operations, and cash flows of ATG (including its wholly-owned subsidiary, ATC) for all periods presented. The exchange of ATC common stock for ATG common stock will be accounted for as an equity restructuring and will be reflected in the period of the merger. All intercompany transactions and balances have been eliminated. The Company has included results of operations of acquired companies from the date of acquisition.
Fair Value Measurements—The Financial Accounting Standards Board (“FASB”) authoritative guidance establishes a fair value hierarchy disclosure framework that prioritizes and ranks the level of inputs used in measuring assets and liabilities at fair value. This hierarchy prioritizes the inputs into three broad levels as follows:
Level 1—Quoted prices in active markets for identical assets or liabilities.
F-7
Table of Contents
Level 2—Inputs other than level 1 that are derived principally from observable market data. These include quoted prices for similar assets or liabilities in active markets, quoted prices for identical assets or liabilities in inactive markets, inputs that are observable that are not quoted prices, and inputs that are derived from or corroborated by observable market data.
Level 3—Valuations developed from unobservable data reflecting the Company’s own assumptions.
The fair value of goodwill and intangible assets subject to impairment during 2011 was determined using significant level 3 inputs (see Note 6).
The redemption value of the Company’s redeemable common stock was based on the fair value of the Company’s common stock, which is determined using significant level 3 inputs in the form of a combination of the income approach and the market approach. The income approach utilizes a discounted cash flow model incorporating management’s expectations for future revenue, operating expenses, EBITDA, capital expenditures and an anticipated tax rate. The related cash flow forecasts are discounted using management’s estimate of the Company’s weighted-average cost of capital at the date of valuation. The market approach utilizes comparative market multiples in the valuation estimate. Multiples are derived by relating the value of guideline companies based on the market price of publicly traded shares to various measures of their earnings and cash flow. Such multiples are then applied to the Company’s historical and projected earnings and cash flow in developing the valuation estimate.
The carrying amounts of certain financial instruments, including cash, accounts receivable, accounts payable and accrued expenses, approximate fair value due to their short maturities. Borrowings under revolving credit agreements and floating-rate term loans approximate fair value because the borrowings incur interest at current market rates. The fair value of contingent consideration is estimated based on significant level 3 inputs primarily consisting of analyses using estimated cost of capital rates, which reflect interest rates currently available to the Company for debt with similar terms and estimates of the Company’s overall credit risk.
Use of Estimates—The preparation of financial statements in conformity with accounting principles generally accepted in the United States of America requires management to make estimates and assumptions that affect the reported amount of assets and liabilities and disclosure of contingent assets and liabilities at the date of the financial statements and the reported amounts of revenues and expenses during the reporting period. Estimates are evaluated based on outside information and experience, as well as other assumptions the Company believes reasonable under the circumstances. Actual results could differ from those estimates.
Revenue Recognition—The Company recognizes revenue when it is realized (or realizable) and earned, which generally occurs when each of the following criteria is met:
| a. | persuasive evidence of an arrangement exists |
| b. | services have been rendered and delivered |
| c. | the price to the buyer from the seller is fixed and determinable |
| d. | collectability is reasonably assured |
The Company provides the following digital media and software solutions services to its customers.
| Ÿ | Digital media services are provided via websites operated by ATC and Kelley Blue Book Co., Inc. (“KBB”) and consist of online advertising sales to local and national sellers of automobiles and automotive-related products. |
F-8
Table of Contents
| Ÿ | Dealer revenues are derived primarily from recurring monthly subscription-based advertising services sold to franchise and independent automobile dealers that allow the dealers to advertise their entire inventory on the Company’s websites. The Company offers a “pay for placement” model that sells tiered listings and premium advertising features that enhance the listings. Revenues from these services are recognized ratably over the subscription period in which the service is provided. |
| Ÿ | Brand advertising revenues are generated primarily from display advertising insertion orders placed by original equipment manufacturers (“OEMs”) and related advertising associations, in which the Company typically guarantees for a fixed fee a minimum number of impressions, or times that an advertisement appears in pages viewed by the users. These revenues are recognized ratably over the term of the agreement, provided that the total amount recognized does not exceed the amount that would be recognized based upon actual impressions delivered. Additional display advertising customers include automotive vendors, such as insurance, warranty and finance companies, automotive aftermarket retailers, and general advertisers who market their services on or integrate their product with the Company’s websites. Revenues from such customers are generally derived from transaction-based fees determined by contractually defined metrics, such as total site visitors, specific traffic referrals or transaction leads that originate on the Company’s websites and are recognized as the related fees are earned. In addition, other revenues generated from the sale of consumer and vehicle data gathered internally from the Company’s websites, such as vehicle values and visitor traffic trends, are included in this category and are recognized as the related fees are earned. |
| Ÿ | Private seller advertising revenues are generated from the sale of advertising services to private sellers desiring to list their automobiles for sale primarily on the ATC website, and are recognized ratably over the average life of the listing. |
| Ÿ | Software solutions services are generated by vAuto, Inc. (“vAuto”), HomeNet LLC (“HomeNet”), CDMdata, Inc. and CDM Dealer Services, Inc. (collectively, “CDM”), and VinSolutions, Inc. (“VinSolutions”) and consist of subscription sales to automobile dealers for a broad suite of dealership software tools for vehicle management, pricing and inventory optimization, online marketing and merchandising, and sales and service management. Generally, subscription fees are payable monthly and include training, support, and maintenance on an as-needed basis. Revenues are recognized ratably over the subscription period in which the services are provided. |
The Company does not customarily enter into barter advertising arrangements, and thus any revenue related to such arrangements is not material.
Allowance for Doubtful Accounts—The Company provides an allowance for doubtful accounts and customer credits that is determined by management’s expectations for probable future losses in accounts receivable based primarily on historical experience and other currently available evidence.
Activity in the allowance for doubtful accounts was as follows (thousands of dollars):
| Year Ended December 31, | Balance at Beginning of Period |
Charged to Expense |
Write-Offs- Net of Recoveries |
Balance at End of Period |
||||||||||||
| 2009 |
$ | 3,626 | $ | 9,435 | $ | (8,808 | ) | $ | 4,253 | |||||||
| 2010 |
4,253 | 2,009 | (2,520 | ) | 3,742 | |||||||||||
| 2011 |
3,742 | 4,017 | (4,716 | ) | 3,043 | |||||||||||
F-9
Table of Contents
Concentration of Credit Risk—Financial instruments that potentially subject the Company to significant concentrations of credit risk consist primarily of accounts receivable. To date, accounts receivable have primarily been derived from fees billed to subscribing dealers and private sellers, national advertisers, and other industry participants. The Company generally requires no collateral to support customer receivables. The Company maintains reserves for potential credit losses. Historically, such losses have been within management’s expectations. For all periods presented in the accompanying consolidated statements of income, no single customer accounted for greater than 10% of total revenues.
Property and Equipment—Property and equipment are carried at cost, less accumulated depreciation. Depreciation is computed using the straight-line method over estimated useful lives as follows: three years for computer equipment and software and five to 10 years for other property and equipment. Leasehold improvements are depreciated over the shorter of the asset’s useful life or the life of the applicable lease or contract, ranging from three to 15 years. Expenditures for maintenance and repairs are charged to expense as incurred.
The Company develops software that is used in providing services to customers. Capitalization of internally developed software occurs when the Company has completed the preliminary project stage and it is probable the project will be completed and will be used to perform the function intended. The preliminary project stage consists of the conceptual formulation of alternatives, the evaluation of alternatives, the determination of the existence of needed technology and the final selection of alternatives. Costs incurred prior to and during the preliminary project stage are expensed as incurred. Eligible costs incurred during the application and infrastructure development stage are capitalized and amortized over their estimated useful lives, generally three years. The Company capitalized costs totaling $42.5 million, $29.1 million, and $41.1 million in 2009, 2010 and 2011, respectively, related to these activities.
Goodwill and Intangible Assets—The Company evaluates goodwill and indefinite-lived intangible assets for impairment annually as of December 31 or more frequently if an event occurs or circumstances change that would more likely than not reduce the fair value of a reporting unit or indefinite-lived intangible asset below its carrying value. The goodwill impairment test consists of two steps. In the first step, the reporting unit’s carrying amount, including goodwill, is compared to its fair value which is measured based upon, among other factors, a discounted cash flow analysis as well as market multiples for comparable companies. If the carrying amount of the reporting unit is greater than its fair value, goodwill is considered potentially impaired and step two must be performed. Step two measures the impairment loss by comparing the implied fair value of the reporting unit’s goodwill with the carrying amount of that goodwill. The implied fair value of goodwill is determined by allocating the fair value of the reporting unit to all the assets and liabilities of that unit (including unrecognized intangibles) as if the reporting unit had been acquired in a business combination. The excess of fair value over the amounts allocated to the assets and liabilities of the reporting unit is the implied fair value of goodwill. The excess of the carrying amount over the implied fair value is the impairment loss.
In performing impairment tests of indefinite-lived intangible assets, the Company directly values the assets, rather than using a two-step approach. If the carrying value of the asset exceeds its estimated fair value, an impairment charge is measured and recorded in an amount equal to the excess.
The Company has six reporting units: ATC, vAuto, KBB, CDM, HomeNet and VinSolutions. The Company estimates the fair value of reporting units and indefinite-lived intangible assets using a combination of the income approach and the market approach. The income approach utilizes a discounted cash flow model incorporating management’s expectations for future revenue, operating expenses, EBITDA, capital expenditures and an anticipated tax rate. The related cash flow forecasts
F-10
Table of Contents
are discounted using management’s estimate of a weighted-average cost of capital for each reporting unit at the date of valuation. The market approach utilizes comparative market multiples in the valuation estimate. Multiples are derived by relating the value of guideline companies based on the market price of publicly traded shares to various measures of their earnings and cash flow. Such multiples are then applied to the historical and projected earnings and cash flow of the reporting unit in developing the valuation estimate. Preparation of forecasts and the selection of the discount rates involve significant judgments about expected future business performance and general market conditions. Significant changes in forecasts, the discount rates selected or the weighting of the income and market approach could affect the estimated fair value of one or more of the reporting units and could result in a goodwill impairment charge in a future period.
Other finite-lived intangible assets are amortized over their estimated useful lives in a manner reflecting the pattern in which the economic benefit of the assets are consumed.
Valuation of Long-Lived Assets—The Company regularly evaluates whether events and circumstances have occurred that indicate the carrying amount of property and equipment and finite-lived intangible assets may not be recoverable. Conditions that could indicate an impairment assessment is needed include a significant decline in the observable market value of an asset or asset group, a significant change in the extent or manner in which an asset or asset group is used, or a significant adverse change that would indicate that the carrying amount of an asset or asset group is not recoverable. When factors indicate that these long-lived assets or asset groups should be evaluated for possible impairment, we assess the potential impairment by determining whether the carrying value of such long-lived assets or asset groups will be recovered through the future undiscounted cash flows expected from use of the asset or asset group and its eventual disposition. If the carrying amount of the asset or asset group is determined not to be recoverable, an impairment charge is recorded based on the excess, if any, of the carrying amount over fair value. Fair values are determined based on quoted market values or discounted cash flows analyses as applicable. The Company regularly evaluates whether events and circumstances have occurred that indicate the useful lives of property and equipment and finite-life intangible assets may warrant revision. The Company believes the carrying values of its long-lived assets were not impaired at December 31, 2011.
Long-Term Incentive Compensation—The Company’s long-term incentive compensation plan provides for the granting of a variety of cash and stock-based incentive awards to employees (see Note 14).
Cash awards and stock-based payment awards to be settled in cash are classified as liabilities in the accompanying consolidated balance sheets. Generally, the amount of compensation expense for such awards is ultimately determined by reference to the amount paid upon the eventual settlement of such awards and is recognized over the corresponding requisite service period. The recognition of compensation expense in periods prior to settlement is based upon interim estimates, and the effects of changes in such estimates are recognized over the corresponding requisite service period, whereby the cumulative effect of such change is recognized in the period in which the change occurs. For cash awards not determined by reference to the fair value of the Company’s equity stock, such interim estimates are based upon the amount expected to be paid upon eventual settlement of the award. For stock-based payment awards to be settled in cash, the Company has elected to determine such interim estimates based upon the intrinsic value (or the difference between the fair value of the underlying equity instrument and the exercise price) of the award as determined at the end of each reporting period.
F-11
Table of Contents
Stock-based payment awards to be settled in stock are classified as additional paid-in capital in the accompanying consolidated balance sheets. Such awards are measured at fair value as determined on the date of grant and recognized as compensation expense over the requisite service period.
For awards with graded vesting, compensation expense is recognized ratably over the requisite service period for each separately vesting tranche of the award as if the award was, in substance, multiple awards. The Company does not recognize compensation expense for awards that are not expected to vest. The Company’s estimate of pre-vesting forfeitures is periodically adjusted, when necessary, to reflect actual forfeiture experience.
Advertising Costs—Costs for advertising, including television, radio, print and online marketing campaigns, search engine marketing and local market advertising for dealer services, are expensed as incurred and totaled approximately $86.6 million, $95.9 million, and $111.4 million for the years ended December 31, 2009, 2010 and 2011, respectively. The Company does not incur any significant direct-response advertising costs.
Income Taxes—Until June 2010, the Company joined with CEI in filing a consolidated U.S. federal income tax return and certain state income tax returns. Current federal and state income tax expenses and benefits were allocated on a separate return basis to the Company based on the current-year tax effects of the inclusion of its income, expenses, and credits in the consolidated income tax returns of CEI or based on separate state income tax returns. After Providence’s purchase of a 25% ownership in the Company in June 2010 (see Note 9), the Company ceased consolidation with CEI’s consolidated U.S. federal tax return filing group.
The Company provides for income taxes using the liability method, which requires an asset- and liability-based approach in accounting for income taxes. Deferred income taxes reflect the net tax effect on future years of temporary differences between the carrying amount of assets and liabilities for financial statement and income tax purposes. Valuation allowances are established when the Company determines that it is more likely than not that some portion or the entire deferred tax asset will not be realized. The Company evaluates its effective tax rates regularly and adjusts them when appropriate based on currently available information relative to statutory rates, apportionment factors and the applicable taxable income in the jurisdictions in which the Company operates, among other factors.
The Company applies additional tax provisions, where applicable, related to accounting for uncertainty in income taxes, which prescribe a recognition threshold and measurement attribute for the financial statement recognition and measurement of tax positions taken or expected to be taken in a tax return. For those benefits to be recognized, a tax position must be more likely than not to be sustained upon examination by taxing authorities. The amount recognized is measured as the largest benefit that has a greater than 50% likelihood of being realized upon settlement. The Company adjusts its estimates of uncertain tax positions periodically because of ongoing examinations by, and settlements with, various taxing authorities, as well as changes in tax laws, regulations, and interpretations.
Net Income Per Common Share—Basic net income per common share is calculated by dividing net income available to common stockholders by the weighted average number of common shares outstanding during the year. Diluted net income per common share is similar to basic, except that the weighted average number of shares outstanding is increased by the potentially dilutive effect of outstanding stock options, stock appreciation rights and certain cash-based incentive awards that may be settled in shares of common stock, if applicable, during the year, using the treasury stock method.
F-12
Table of Contents
The following table is a reconciliation of the numerator and denominator of basic net income per common share to the numerator and denominator of diluted net income per common share (in thousands, except per share amounts):
| Year Ended December 31, | ||||||||||||
| 2009 | 2010 | 2011 | ||||||||||
| Numerator: |
||||||||||||
| Net income attributable to common stockholders |
$ | 9,859 | $ | 49,124 | $ | 68,051 | ||||||
|
|
|
|
|
|
|
|||||||
| Denominator: |
||||||||||||
| Weighted average common shares outstanding—basic |
211,928 | 190,024 | 193,168 | |||||||||
|
|
|
|
|
|
|
|||||||
| Stock appreciation rights |
684 | 116 | 52 | |||||||||
| Cash-based incentives |
— | 96 | 264 | |||||||||
|
|
|
|
|
|
|
|||||||
| Weighted average common shares outstanding—diluted |
212,612 | 190,236 | 193,484 | |||||||||
|
|
|
|
|
|
|
|||||||
| Basic net income per common share |
$ | 0.05 | $ | 0.26 | $ | 0.35 | ||||||
|
|
|
|
|
|
|
|||||||
| Diluted net income per common share |
$ | 0.05 | $ | 0.26 | $ | 0.35 | ||||||
|
|
|
|
|
|
|
|||||||
Diluted net income per common share for the years presented does not reflect the following shares of potential common stock, as the effect would be anti-dilutive (in thousands):
| Year Ended December 31, | ||||||||||||
| 2009 | 2010 | 2011 | ||||||||||
| Stock options |
— | — | 3,840 | |||||||||
|
|
|
|
|
|
|
|||||||
| Performance awards |
— | 20 | 52 | |||||||||
|
|
|
|
|
|
|
|||||||
Comprehensive Income—To the extent that the Company experiences changes in the recorded amounts of equity from sources other than investments by or distributions to shareholders that are not otherwise reflected as a component of net income, such changes would be presented separately as a component of comprehensive income. There were no such changes or amounts for any period presented in the accompanying consolidated financial statements.
Change in Accounting Policy—Redeemable Common Stock—In June 2012, upon filing a registration statement on Form S-1, the Company became subject to certain presentation and disclosure rules that require redeemable common stock to be excluded from stockholders’ equity in the Company’s consolidated balance sheet and be measured at redemption value (see Note 10). For financial statements issued prior to June 2012, the Company had classified such stock as a component of stockholders’ equity generally at its initial issuance price. The Company has applied this change in accounting policy retrospectively to all periods presented in the accompanying consolidated financial statements as if the new policy had always been used. Accordingly, stockholders’ equity as of December 31, 2008 was reduced by $57.5 million (consisting of a decrease in retained earnings of $61.0 million and an increase in additional paid-in capital of $3.5 million), which represents the cumulative effect of the change for all periods prior to January 1, 2009. This change in accounting policy did not result in a change in net income (or any component thereof) for any period; however, it did result in an increase (decrease) in retained earnings of ($3.6 million), $1.1 million and ($16.0 million) for the years ended December 31, 2009, 2010 and 2011, respectively, as compared to amounts previously reported, representing the change in redemption value of the redeemable common stock for those respective years.
F-13
Table of Contents
Correction—Operations, sales and marketing and general and administrative expenses for 2009 and 2010 have been corrected to reflect the allocation of pension and postretirement health care and life insurance benefits based on the underlying personnel and related compensation, consistent with the 2011 presentation. These expenses were previously not allocated and reflected entirely in general and administrative expense. The impact to operating expenses is an increase to operations expense of $2.8 million and $4.3 million for 2009 and 2010, respectively, an increase to sales and marketing expense of $5.4 million and $8.8 million for 2009 and 2010, respectively, and a decrease to general and administrative expense of $8.2 million and $13.1 million for 2009 and 2010, respectively.
Subsequent Events—The Company evaluated subsequent events through April 9, 2012, the date the financial statements were originally issued, and has updated such evaluation through June 15, 2012, the date the financial statements were reissued, for disclosure purposes.
Recent Accounting Pronouncements—In May 2011, the FASB amended fair value measurement and disclosure guidance which amends certain fair value measurements and disclosures. The guidance will be effective for the Company as of January 1, 2012 and the Company does not expect the adoption to have a material effect on the Company’s consolidated balance sheets, statements of income, cash flows and stockholders’ equity.
In September 2011, the FASB issued an accounting standards update that amends the accounting guidance on goodwill impairment testing. This accounting standards update is intended to reduce complexity and costs by allowing an entity the option to make a qualitative evaluation about the likelihood of goodwill impairment to determine whether it should calculate the fair value of a reporting unit. This accounting standards update also amends existing guidance by expanding upon the examples of events and circumstances that an entity should consider between annual impairment tests in determining whether it is more likely than not that the fair value of a reporting unit is less than its carrying amount. This accounting standards update will be effective for the Company beginning January 1, 2012, and the Company does not expect the adoption to have a material effect on its consolidated financial position, results of operations, or cash flows.
3. ACQUISITIONS
vAuto—In October 2010, ATG acquired 100% of the outstanding stock of vAuto, a provider of advanced software tools for used vehicle management, pricing, and inventory optimization, for $192.8 million in cash. In addition, the purchase agreement provided for maximum additional consideration of $34.5 million in the form of an earn-out payable in 2012 and based upon the achievement of certain cumulative financial targets for 2010 and 2011. The fair value of this earn-out was $27.4 million at the time of the acquisition and was accounted for as a long-term liability and considered additional purchase price. From October to December 2010, the fair value of the earn-out increased to $28.4 million, and the corresponding $0.9 million increase was recognized as other operating expense. ATG acquired vAuto to complement its digital media services and to help dealers further enhance their performance through the use of vAuto’s advanced software tools.
In June 2011, the acquisition of VinSolutions triggered certain provisions of the vAuto purchase agreement that accelerated the vesting of the earn-out, resulting in a full payment of $34.5 million in July 2011. Prior to payment, $6.2 million was recognized as other operating expense in 2011, representing an additional increase in the fair value of the earn-out.
KBB—In December 2010, ATG acquired 100% of the outstanding stock of Kelley Blue Book Company, Inc. (“KBB”), a provider of new and used vehicle pricing information to the auto industry, as well as KBB’s sister companies, CDM, for $532.4 million in cash. ATG acquired KBB to strengthen its digital media services for objective third-party vehicle valuations.
F-14
Table of Contents
HomeNet—In March 2009, the Company (i) entered into an agreement with HomeNet, a provider of online inventory management and merchandising solutions to automotive dealers, to integrate their dealer inventory and customer relationship management systems into the Company’s own system and processes and (ii) paid cash consideration of $3.5 million in exchange for an option to purchase HomeNet at fair value. The option consideration was accounted for as an additional cost of the services obtained from HomeNet under the operating agreement and was recognized as operations expense over the agreement’s five-year term. In December 2010, the Company acquired certain assets of HomeNet in a business combination for cash consideration of $61.6 million. The $2.2 million remaining unamortized option value as of the acquisition date was accounted for as additional purchase price of the acquired assets.
VinSolutions—In June 2011, ATG acquired 100% of the assets of VinSolutions, a provider of end-to-end solution platforms for automobile dealers including customer relationship and Internet lead management, inventory management tools, dealer websites, sales management and desking tools, social media and direct targeted marketing campaign tools, for $134.6 million in cash. In addition, the purchase agreement provided for maximum additional consideration of $15.0 million in the form of an earn-out payable in 2012 and based upon the achievement of certain financial targets for 2011. The fair value of this earn-out was $10.6 million at the time of the acquisition and was accounted for as a current liability and considered additional purchase price. From June to December 2011, the fair value of the earn-out increased to $12.1 million, and the corresponding $1.4 million increase was recognized as other operating expense. Based on 2011 results, the Company paid $13.0 million in 2012 in settlement of the earn-out. ATG acquired VinSolutions to enhance its existing dealer software solutions business.
Transaction costs associated with these aforementioned acquisitions totaled $5.9 million and $0.9 million for 2010 and 2011, respectively, and were expensed as incurred as general and administrative expense. These acquisitions have been accounted for using the acquisition method of accounting which requires, among other things, the assets acquired and liabilities assumed be recognized at their fair values as of the acquisition date, which management has determined utilizing the assistance of an independent appraisal process. Although the working capital settlement with respect to VinSolutions was not finalized as of December 31, 2011, the following represents the allocations of the purchase prices for the assets acquired and the liabilities assumed for these acquisitions (in thousands):
| vAuto | KBB | HomeNet | VinSolutions | |||||||||||||
| Cash paid, net of cash acquired |
$ | 192,801 | $ | 532,400 | $ | 61,576 | $ | 134,619 | ||||||||
| Working capital settlements |
1,497 | (2,095 | ) | 86 | — | |||||||||||
| Fair value of contingent consideration |
27,428 | — | — | 10,633 | ||||||||||||
| Unamortized purchase option |
— | — | 2,227 | — | ||||||||||||
|
|
|
|
|
|
|
|
|
|||||||||
| Total purchase price |
$ | 221,726 | $ | 530,305 | $ | 63,889 | $ | 145,252 | ||||||||
|
|
|
|
|
|
|
|
|
|||||||||
| Current and other assets |
$ | 2,017 | $ | 27,898 | $ | 1,154 | $ | 2,618 | ||||||||
| Property and equipment |
5,371 | 36,615 | 11,036 | 7,334 | ||||||||||||
| Goodwill |
185,990 | 317,260 | 47,328 | 105,363 | ||||||||||||
| Intangible assets |
61,000 | 276,304 | 5,831 | 35,912 | ||||||||||||
|
|
|
|
|
|
|
|
|
|||||||||
| Total assets acquired |
254,378 | 658,077 | 65,349 | 151,227 | ||||||||||||
|
|
|
|
|
|
|
|
|
|||||||||
| Current and other liabilities |
8,398 | 17,397 | 1,460 | 5,975 | ||||||||||||
| Deferred income taxes |
24,254 | 110,375 | — | — | ||||||||||||
|
|
|
|
|
|
|
|
|
|||||||||
| Total liabilities assumed |
32,652 | 127,772 | 1,460 | 5,975 | ||||||||||||
|
|
|
|
|
|
|
|
|
|||||||||
| Fair value of net assets acquired |
$ | 221,726 | $ | 530,305 | $ | 63,889 | $ | 145,252 | ||||||||
|
|
|
|
|
|
|
|
|
|||||||||
F-15
Table of Contents
The table above includes adjustments that were made during 2011 to (i) reflect the final settlement of the working capital accounts and (ii) finalize the fair values and tax bases that were provisionally assigned in 2010 to the assets acquired and liabilities assumed for vAuto, KBB, and HomeNet. These adjustments, which have been retrospectively applied as of the respective acquisition dates in the accompanying consolidated financial statements, resulted in an increase in other current assets of $0.3 million, a decrease in property and equipment of $5.8 million, an increase in goodwill of $7.1 million, a decrease in intangible assets of $2.9 million, an increase in other current liabilities of $0.7 million, and a decrease in deferred income tax liabilities of $2.0 million, as compared to the corresponding amounts that were previously presented in the consolidated balance sheet at December 31, 2010.
The goodwill resulting from the purchases of vAuto and KBB is not deductible for tax purposes, while the goodwill resulting from the purchases of HomeNet and VinSolutions is deductible for tax purposes.
The following supplemental information presents a summary of the operating results of the acquired businesses that are included in the consolidated results for the respective years of acquisition (in thousands):
| vAuto | KBB | HomeNet | VinSolutions | |||||||||||||
| October 15 - December 31, 2010 |
December 15 - December 31, 2010 |
December 23 - December 31, 2010 |
June 15 - December 31, 2011 |
|||||||||||||
| Revenues |
$ | 11,056 | $ | 6,695 | $ | 308 | $ | 22,173 | ||||||||
| Income (loss) from operations |
6,212 | 1,458 | 5 | (1,235 | ) | |||||||||||
| Net income (loss) |
5,271 | 1,457 | 5 | (1,249 | ) | |||||||||||
The following supplemental unaudited pro forma information presents a summary of the operating results of the Company for the years ended December 31, 2009, 2010 and 2011, as if the Company had acquired vAuto, KBB and HomeNet as of January 1, 2009 and VinSolutions as of January 1, 2010 (in thousands):
| Unaudited Pro Forma Consolidated Results | ||||||||||||||||||||
| Year Ended December 31, 2009 | ||||||||||||||||||||
| Historical ATG Consolidated |
KBB | HomeNet | vAuto | Pro Forma ATG Consolidated |
||||||||||||||||
| Revenues |
$ | 629,450 | $ | 122,774 | $ | 15,917 | $ | 30,284 | $ | 798,425 | ||||||||||
| Income (loss) from operations |
14,525 | (5,049 | ) | 2,644 | (7,165 | ) | 4,955 | |||||||||||||
| Net income (loss) |
9,859 | (13,671 | ) | 571 | (7,876 | ) | (11,117 | ) | ||||||||||||
| Unaudited Pro Forma Consolidated Results | ||||||||||||||||||||||||
| Year Ended December 31, 2010 | ||||||||||||||||||||||||
| Historical ATG Consolidated |
KBB | HomeNet | vAuto | VinSolutions | Pro Forma ATG Consolidated |
|||||||||||||||||||
| Revenues |
$ | 737,827 | $ | 123,948 | $ | 18,171 | $ | 35,085 | $ | 16,118 | $ | 931,149 | ||||||||||||
| Income (loss) from operations |
114,547 | (44,380 | ) | (1,553 | ) | 2,326 | (8,890 | ) | 62,050 | |||||||||||||||
| Net income (loss) |
49,124 | (38,360 | ) | (1,795 | ) | (1,214 | ) | (8,330 | ) | (575 | ) | |||||||||||||
F-16
Table of Contents
| Unaudited Pro Forma Consolidated Results | ||||||||||||
| Year Ended December 31, 2011 | ||||||||||||
| Historical ATG Consolidated |
VinSolutions | Pro Forma ATG Consolidated |
||||||||||
| Revenues |
$ | 1,025,177 | $ | 12,772 | $ | 1,037,949 | ||||||
| Income (loss) from operations |
139,754 | (2,770 | ) | 136,984 | ||||||||
| Net income (loss) |
68,051 | (2,954 | ) | 65,097 | ||||||||
The unaudited pro forma consolidated results were prepared using the acquisition method of accounting and are based on the historical financial information of ATG, vAuto, KBB, HomeNet and VinSolutions, reflecting in 2009, 2010 and 2011 results of operations for a 12-month period. The historical financial information has been adjusted to give effect to the pro forma events that are: (i) directly attributable to the acquisitions; (ii) factually supportable; and (iii) expected to have a continuing impact on the combined results. The unaudited pro forma consolidated results reflect primarily adjustments related to additional amortization expense, additional depreciation expense, additional interest expense and the corresponding tax benefits. The unaudited pro forma consolidated results are not necessarily indicative of what the Company’s consolidated results of operations actually would have been had these acquisitions been completed on January 1, 2009, 2010 and 2011. In addition, the unaudited pro forma consolidated results do not purport to project future results of operations of the combined company nor do they reflect the expected realization of any cost savings associated with the acquisitions.
4. CASH MANAGEMENT
The Company receives day-to-day cash management services from CEI, with settlements of outstanding balances between the Company and CEI occurring periodically at market interest rates. These services include the sweep of the Company’s deposited receipts into the CEI cash management system, as well as the coverage of the Company’s checks presented for payment. The net outstanding balance is classified as amounts due from CEI in the accompanying balance sheets. Included in accounts payable are book overdrafts of $19.6 million and $27.1 million at December 31, 2010 and 2011, respectively, which resulted from checks outstanding and not yet presented for payment and are considered operating activities in the accompanying consolidated statements of cash flows.
5. PROPERTY AND EQUIPMENT
The carrying amounts of property and equipment as of December 31, 2010 and 2011 are summarized as follows (in thousands):
| December 31, | ||||||||
| 2010 | 2011 | |||||||
| Computer equipment and software |
$ | 316,813 | $ | 395,920 | ||||
| Leasehold improvements |
39,803 | 53,453 | ||||||
| Other property and equipment |
58,822 | 56,881 | ||||||
|
|
|
|
|
|||||
| Property and equipment—at cost |
415,438 | 506,254 | ||||||
| Less—accumulated depreciation |
(238,207 | ) | (308,633 | ) | ||||
|
|
|
|
|
|||||
| Property and equipment—net |
$ | 177,231 | $ | 197,621 | ||||
|
|
|
|
|
|||||
Total depreciation expense related to property and equipment was $62.2 million, $60.6 million and $80.3 million in 2009, 2010 and 2011, respectively.
F-17
Table of Contents
Included in leasehold improvements in 2010 and 2011 were $9.9 million and $6.0 million, respectively, in landlord-funded leasehold improvements that were provided for the Company’s new Atlanta headquarters building during 2010 and 2011. These improvements are being depreciated over the remaining life of the building lease.
6. GOODWILL AND INTANGIBLE ASSETS
Summarized below are the carrying values and accumulated amortization of intangible assets that continue to be amortized, as well as the carrying value of those intangible assets (other than goodwill) which are not subject to amortization as of December 31, 2010 and 2011 (in thousands).
| December 31, | ||||||||||||||||||||||||||
| 2010 | 2011 | |||||||||||||||||||||||||
| Weighted- Average Useful Lives |
Gross Carrying Value |
Accumulated Amortization |
Net Carrying Value |
Gross Carrying Value |
Accumulated Amortization |
Net Carrying Value |
||||||||||||||||||||
| Non-amortizable trade names |
NA | $ | 348,276 | $ | — | $ | 348,276 | $ | 348,394 | $ | — | $ | 348,394 | |||||||||||||
| Customer relationships |
13.0 yrs | 208,119 | (119,824 | ) | 88,295 | 222,518 | (146,303 | ) | 76,215 | |||||||||||||||||
| Web-based technology |
9.0 yrs | 208,224 | (119,199 | ) | 89,025 | 214,957 | (130,948 | ) | 84,009 | |||||||||||||||||
| Amortizable brand and trademarks |
5.0 yrs | 24,593 | (742 | ) | 23,851 | 37,013 | (4,460 | ) | 32,553 | |||||||||||||||||
| Patent licenses |
18.8 yrs | 6,730 | (6,700 | ) | 30 | 6,730 | (6,707 | ) | 23 | |||||||||||||||||
| Non-compete agreements |
3.4 yrs | 1,714 | (402 | ) | 1,312 | 3,956 | (436 | ) | 3,520 | |||||||||||||||||
| Other amortizable intangible assets |
4.1 yrs | 2,107 | (198 | ) | 1,909 | 1,996 | (728 | ) | 1,268 | |||||||||||||||||
|
|
|
|
|
|
|
|
|
|
|
|
|
|||||||||||||||
| Total intangible assets |
$ | 799,763 | $ | (247,065 | ) | $ | 552,698 | $ | 835,564 | $ | (289,582 | ) | $ | 545,982 | ||||||||||||
|
|
|
|
|
|
|
|
|
|
|
|
|
|||||||||||||||
Total amortization expense related to intangible assets with estimated useful lives was $58.2 million, $4.8 million and $42.7 million in 2009, 2010 and 2011, respectively. Future amortization expense related to these assets as of December 31, 2011, is estimated to be as follows (in thousands):
| Years Ending December 31, | Estimated Amortization Expense |
|||
| 2012 |
$ | 40,497 | ||
| 2013 |
37,091 | |||
| 2014 |
29,829 | |||
| 2015 |
25,442 | |||
| 2016 |
16,949 | |||
In 2011, in connection with the annual impairment tests of goodwill, the Company determined that the $47.3 million carrying value of goodwill attributable to HomeNet exceeded its fair value of $11.1 million at December 31, 2011. Accordingly, the Company recognized a $36.2 million impairment of goodwill in 2011 as a result of lower than expected revenue growth relative to investment assumptions made in the year of acquisition. Further declines in expected revenue and earnings growth will likely result in additional impairment charges in a future period. With the exception of HomeNet, the fair values of the Company’s reporting units exceeded their carrying values by more than 10%.
F-18
Table of Contents
The changes in the carrying amount of goodwill for the years ended December 31, 2010 and 2011 are summarized as follows (in thousands):
| Year Ended December 31, 2010 | ||||||||||||
| Digital Media | Software Solutions | Consolidated | ||||||||||
| Balance at January 1, 2010 |
||||||||||||
| Goodwill |
$ | 8,124 | $ | — | $ | 8,124 | ||||||
| Accumulated impairment losses |
(5,310 | ) | — | $ | (5,310 | ) | ||||||
|
|
|
|
|
|
|
|||||||
| 2,814 | — | 2,814 | ||||||||||
|
|
|
|
|
|
|
|||||||
| Acquisitions: |
||||||||||||
| KBB |
317,260 | — | 317,260 | |||||||||
| vAuto |
— | 185,990 | 185,990 | |||||||||
| HomeNet |
— | 47,328 | 47,328 | |||||||||
| Impairments |
— | — | — | |||||||||
|
|
|
|
|
|
|
|||||||
| 317,260 | 233,318 | 550,578 | ||||||||||
|
|
|
|
|
|
|
|||||||
| Balance at December 31, 2010: |
||||||||||||
| Goodwill |
325,384 | 233,318 | 558,702 | |||||||||
| Accumulated impairment losses |
(5,310 | ) | — | (5,310 | ) | |||||||
|
|
|
|
|
|
|
|||||||
| $ | 320,074 | $ | 233,318 | $ | 553,392 | |||||||
|
|
|
|
|
|
|
|||||||
| Year Ended December 31, 2011 | ||||||||||||
| Digital Media | Software Solutions | Consolidated | ||||||||||
| Balance at January 1, 2011 |
||||||||||||
| Goodwill |
$ | 325,384 | $ | 233,318 | $ | 558,702 | ||||||
| Accumulated impairment losses |
(5,310 | ) | — | $ | (5,310 | ) | ||||||
|
|
|
|
|
|
|
|||||||
| 320,074 | 233,318 | 553,392 | ||||||||||
|
|
|
|
|
|
|
|||||||
| Acquisitions: |
||||||||||||
| VinSolutions |
— | 105,363 | 105,363 | |||||||||
| Impairments |
— | (36,216 | ) | (36,216 | ) | |||||||
|
|
|
|
|
|
|
|||||||
| — | 69,147 | 69,147 | ||||||||||
|
|
|
|
|
|
|
|||||||
| Balance at December 31, 2011: |
||||||||||||
| Goodwill |
325,384 | 338,681 | 664,065 | |||||||||
| Accumulated impairment losses |
(5,310 | ) | (36,216 | ) | (41,526 | ) | ||||||
|
|
|
|
|
|
|
|||||||
| $ | 320,074 | $ | 302,465 | $ | 622,539 | |||||||
|
|
|
|
|
|
|
|||||||
7. LONG-TERM DEBT
In June 2010, ATC negotiated a financing arrangement with Goldman Sachs Lending Partners LLC and Wells Fargo Bank, National Association and certain other lenders and agents (the “June 2010 Credit Facility”) that provided ATC with senior secured revolving credit and term loan facilities in an aggregate principal amount of $525.0 million. Also in June 2010, ATC borrowed $475.0 million from these debt facilities and used proceeds of $454.2 million, net of original issue discount and debt issuance costs, to fund the redemption of stock as described in Note 9. The net proceeds of $454.2 million consisted of $404.2 million from senior secured term loan facilities, net of original issue discount and debt issuance costs, and $50.0 million from the senior secured revolving credit facility with a capacity of $100.0 million. In October 2010, the Company added $100.0 million to its senior secured facilities in the form of an $80.0 million incremental term facility and a $20.0 million incremental revolving facility, the proceeds of which were used to help fund the acquisition of vAuto.
F-19
Table of Contents
In December 2010, ATC entered into a new financing arrangement with Wells Fargo Bank, National Association, and Wells Fargo Securities, LLC and certain other lenders and agents (the “December 2010 Credit Facility”) that provided ATC with increased senior secured revolving credit and term loan facilities in an aggregate principal amount of $950.0 million, consisting of $750.0 million in term loans and $200.0 million in revolving credit. Under the new financing arrangement, ATC borrowed $876.7 million, net of original issue discount and debt issuance costs, from these facilities and used $536.2 million to fully retire the June 2010 Credit Facility and the remainder to help finance the acquisitions of KBB and HomeNet.
In connection with the early retirement of the June 2010 Credit Facility, ATC recognized a loss totaling $23.4 million, consisting of a prepayment penalty of $2.7 million and the write-off of $15.1 million in deferred debt issuance costs and $5.5 million in original issue discount.
In June 2011, ATC amended the December 2010 Credit Facility to increase the senior secured credit by $200.0 million and used proceeds of $196.2 million, net of debt issuance costs, to prepay certain term loans and finance the VinSolutions acquisition (the “December 2010 Credit Facility Amendment 1”).
Long-term debt as of December 31, 2010 and 2011 consisted of the following (in thousands):
| December 31, | ||||||||
| 2010 | 2011 | |||||||
| Revolving bank credit borrowing, maturing 2015 (“Revolver”) |
$ | 138,000 | $ | 65,000 | ||||
| Senior secured bank credit borrowing, maturing 2015 (“Term Loan A”) |
250,000 | 432,500 | ||||||
| Senior secured bank credit borrowing, maturing 2016 (“Term Loan B”) |
500,000 | 397,000 | ||||||
| Original issue discount on senior secured credit borrowings |
(2,481 | ) | (2,064 | ) | ||||
|
|
|
|
|
|||||
| Total debt |
885,519 | 892,436 | ||||||
| Less—current portion |
(17,500 | ) | (26,500 | ) | ||||
|
|
|
|
|
|||||
| Long-term debt |
$ | 868,019 | $ | 865,936 | ||||
|
|
|
|
|
|||||
The Revolver bears interest, at ATC’s option, at the London interbank offering rate (“LIBOR”) or at a base rate. At December 31, 2011, ATC had $65.0 million outstanding under the Revolver, resulting in unused capacity of $135.0 million of the total $200.0 million in revolving credit available under the facility. As of December 31, 2010 and 2011, the LIBOR rate Revolver borrowings totaled $100.0 million and $20.0 million, respectively, while the base rate Revolver borrowings totaled $38.0 million and $45.0 million, respectively.
Under the terms of the credit facilities outstanding during 2010 and 2011, interest on the outstanding balances resets and is payable quarterly, in the case of base-rate borrowings, and at the end of each interest period, in the case of LIBOR-based borrowings and is determined as follows:
| Ÿ | Interest on the LIBOR-based Revolver borrowings is based on LIBOR, plus a basis point (“bps”) spread that has ranged from 425 bps for most of 2010 to 175 bps at the end of 2011, resulting in per annum interest rates ranging from 3.26% to 4.60% in 2010 and 2.05% to 3.27% in 2011. The interest rate on the LIBOR-based borrowings was 2.05% at December 31, 2011. Interest on the base rate Revolver borrowings is determined by a base rate plus a bps spread that has ranged from 200 bps in 2010 to 75 bps at the end of 2011, resulting in per annum interest rates ranging from 5.25% in 2010 and 4.00% to 5.25% in 2011. The interest rate on the base rate borrowings was 4.00% at December 31, 2011. |
In addition, ATC paid an unutilized Revolver commitment fee at a per annum rate of 0.625% for most of 2010 which was based on the daily utilization rate. In December 2010 and for all of
F-20
Table of Contents
2011, the commitment fee was based on a debt-to-cash flow leverage ratio and ranged on a per annum basis from 0.3% to 0.5%. The commitment fee was 0.3% as of December 31, 2011. Commitment fees are included as a component of interest expense in the accompanying income statement, reset monthly and are payable quarterly.
| Ÿ | In 2010 and 2011, interest on the Term Loan A was based on LIBOR, plus a bps spread ranging from 425 bps for most of 2010 to 175 bps at the end of 2011, resulting in per annum interest rates ranging from 3.26% to 4.60% in 2010 and 2.05% to 3.27% in 2011. The interest rate on the Term Loan A was 2.05% at December 31, 2011. |
| Ÿ | In 2010 and 2011, interest on the Term Loan B was based on a LIBOR floor, plus a bps spread ranging from 450 bps for most of 2010 to 300 bps at the end of 2011, resulting in per annum interest rates ranging from 4.75% to 6.00% in 2010 and 4.00% to 4.75% in 2011. The interest rate on the Term Loan B was 4.00% at December 31, 2011. |
The bps spread of the outstanding Revolver and Term Loan A borrowings is determined on a quarterly basis by reference to ATC’s debt-to-cash flow leverage ratio for the preceding four fiscal quarters, ranging from 50 to 250 bps. The bps spread of the outstanding Term Loan B borrowings is fixed and does not fluctuate with changes in ATC’s debt-to-cash-flow leverage ratio.
Prior to the increase in aggregate term loan and revolving credit commitments in April 2012 (see Note 17), the scheduled annual principal payments for the senior secured bank credit borrowings, to be paid in ratable quarterly installments, are $26.5 million in 2012, $35.5 million in 2013, $49.0 million in 2014, $337.5 million in 2015 and $381.0 million in 2016.
Debt Covenants—ATC’s credit facilities contain, among other provisions, specified leverage and debt service ratio requirements. Compliance with these ratios limits ATC’s ability to incur unlimited indebtedness. The credit agreement also includes a covenant that restricts ATC’s ability to pay dividends to ATG or to make any other payments in respect of its common stock. This restriction is subject to customary exceptions including, among others, payments required pursuant to certain contracts, payments to satisfy certain of our tax obligations, payments out of the proceeds of an initial public offering up to 6% per annum of such proceeds and payments subject to its pro forma leverage ratio remaining below 3.25 to 1.0 (this ratio was 2.75 to 1.0 at December 31, 2011). The credit agreement also includes restrictions on the ability of ATC to make loans or advances. At December 31, 2011, ATC was in compliance with all covenants under its credit facilities. However, at December 31, 2011, ATC was restricted in its ability to pay dividends to ATG (see Note 18).
8. OTHER CURRENT AND NONCURRENT LIABILITIES
The Company’s other current liabilities as of December 31, 2010 and 2011 consist of the following (in thousands):
| December 31, | ||||||||
| 2010 | 2011 | |||||||
| Deferred revenue |
$ | 10,729 | $ | 11,270 | ||||
| Deferred purchase price and contingent consideration |
732 | 12,077 | ||||||
| Other |
6,047 | 3,664 | ||||||
|
|
|
|
|
|||||
| Total other current liabilities |
$ | 17,508 | $ | 27,011 | ||||
|
|
|
|
|
|||||
Deferred revenue consists of the timing difference between payments by customers for subscription advertising services and set-up fees and the recognition as revenue of the services and fees based on the average life of the vehicle listing or customer, as applicable.
F-21
Table of Contents
Deferred purchase price and contingent consideration is comprised primarily of the contingent consideration of $15.0 million related to the 2011 acquisition of VinSolutions as described in Note 3. At December 31, 2011, the fair value of this obligation was $12.1 million and was classified within other current liabilities as payment is expected to occur in 2012.
The Company’s other noncurrent liabilities as of December 31, 2010 and 2011 consist of the following (in thousands):
| December 31, | ||||||||
| 2010 | 2011 | |||||||
| Deferred rent |
$ | 12,198 | $ | 19,638 | ||||
| Contingent consideration |
28,352 | — | ||||||
| Accrued employee benefits and other |
11,470 | 15,785 | ||||||
|
|
|
|
|
|||||
| Total other noncurrent liabilities |
$ | 52,020 | $ | 35,423 | ||||
|
|
|
|
|
|||||
Deferred rent consists of the timing difference between the contractual operating lease payments and the recognition of rent expense on a straight-line basis. In addition, deferred rent at December 31, 2010 and 2011 reflects $9.6 million and $14.8 million, respectively, in unamortized rent abatement attributable to the landlord-funded leasehold improvements that were provided for the new Atlanta headquarters building (see Notes 5 and 12). This rent abatement is being recognized as a reduction of general and administrative expense over the remaining life of the building lease.
As discussed in Note 3, the vAuto purchase agreement provided for the deferral of $34.5 million of purchase price to 2012, pending the achievement of certain cumulative financial targets of the acquired business for 2010 and 2011. The fair value of this obligation was $28.4 million at December 31, 2010. However, the acquisition of VinSolutions in 2011 triggered the waiving of the operating performance requirements, and the contingent consideration was paid in its entirety in 2011.
Accrued employee benefits and other liabilities primarily reflect amounts payable under the Company’s Savings Plus and Executive Savings Plus Restoration Plans (see Note 13). At December 31, 2010 and 2011, respectively, $8.8 million and $12.6 million were payable under these Plans.
9. STOCKHOLDERS’ EQUITY
The Company has Class A, Class B, and Class C common stock, each with varying rights. Class C stock is convertible at the option of the holder into Class A stock on a share-for-share basis. Class C stock differs from Class A stock only in that Class C stock has a 10-to-1 voting right. Class B stock differs from Class A and Class C stock only in that Class B stock does not have voting, tag-along, or preemptive rights.
In June 2010, the Company repurchased approximately 43.4 million total shares of stock from all existing stockholders, comprised of approximately 42.1 million shares of non-redeemable common stock in the amount of $539.4 million and approximately 1.3 million shares of redeemable common stock (see Note 10) in the amount of $15.2 million. All stockholders maintained their existing ownership percentage subsequent to the stock repurchase. This redemption of stock is included in the accompanying consolidated financial statements as treasury stock in the amount of $539.4 million and a reduction of redeemable common stock in the amount of $15.2 million and was partially financed by borrowings from the June 2010 Credit Facility (see Note 7).
F-22
Table of Contents
Also in June 2010, the Company’s Class A shareholders sold 25% of their collective ownership interest to Providence, a global private equity firm specializing in equity investments in media entertainment, communications, and information services companies. CEI retained majority ownership and operating control of the Company, and Providence obtained two seats on the Company’s Board of Directors in addition to the Class A stock.
At various times during fourth quarter 2010, 8.3 million shares of Class A stock and 16.5 million shares of Class C stock were issued in exchange for $316.5 million from existing shareholders, of which $1.7 million was paid in first quarter 2011. The proceeds from the issuance of this stock was used to help fund the fourth quarter 2010 acquisitions described in Note 3.
As of December 31, 2011, the share ownership and voting percentages for the stockholders was as follows (in thousands):
| Ownership | Voting % |
|||||||||||
| Shares | % | |||||||||||
| Class C stockholder—Manheim |
121,352 | 62.8 | % | 94.5 | % | |||||||
|
|
|
|
|
|
|
|||||||
| Class A stockholders: |
||||||||||||
| CEI and related entities |
12,627 | 6.5 | 1.0 | |||||||||
| Providence |
48,685 | 25.2 | 3.8 | |||||||||
| KPCB |
9,418 | 4.9 | 0.7 | |||||||||
|
|
|
|
|
|
|
|||||||
| Total Class A stockholders |
70,730 | 36.6 | 5.5 | |||||||||
|
|
|
|
|
|
|
|||||||
| Class B stockholders |
1,106 | 0.6 | — | |||||||||
|
|
|
|
|
|
|
|||||||
| Total |
193,188 | 100.0 | % | 100.0 | % | |||||||
|
|
|
|
|
|
|
|||||||
See Note 1 regarding the formation of ATG and the related conversion of stock in June 2012.
10. REDEEMABLE COMMON STOCK
At December 31, 2011, approximately 2.4 million outstanding shares of Class A stock and 1.1 million outstanding shares of Class B stock were owned by current and former employees of the Company or CEI and were restricted as to sale or transfer. The Company has a right, which terminates in the event of a public offering of the Company’s stock, to repurchase such stock and may be required to repurchase the stock at fair value if offered by the stockholder, subject to annual limitations. Accordingly, such stock is reflected as redeemable common stock in the accompanying consolidated balance sheet and is excluded from stockholders’ equity. Redeemable common stock is measured initially at fair value as of the date of issuance and is subsequently adjusted to its redemption value at the end of each reporting period, provided that the carrying value of the redeemable common stock is never reduced below its initial measurement value. Changes in the carrying value of redeemable common stock are accounted for in the same manner as dividends on nonredeemable common stock and are effected by adjustments to retained earnings. In 2009 and 2010, repurchases of the Company’s Class A and Class B stock from various stockholders exercising their put-options totaled $7.6 million and $0.4 million, respectively. In addition, in June 2010, the Company repurchased $15.2 million of redeemable common stock as part of a redemption of common stock from all existing stockholders (see Note 9), resulting in total repurchases of redeemable common stock of $15.6 million in 2010. There were no repurchases of Class A or Class B stock in 2011.
F-23
Table of Contents
11. INCOME TAXES
Income tax expense for the years ended December 31, 2009, 2010 and 2011, is summarized as follows (in thousands):
| Year Ended December 31, | ||||||||||||
| 2009 | 2010 | 2011 | ||||||||||
| Current: |
||||||||||||
| Federal |
$ | 8,603 | $ | 30,934 | $ | 49,451 | ||||||
| State |
303 | 3,291 | 5,123 | |||||||||
|
|
|
|
|
|
|
|||||||
| Total current |
8,906 | 34,225 | 54,574 | |||||||||
|
|
|
|
|
|
|
|||||||
| Deferred: |
||||||||||||
| Federal |
(2,816 | ) | (4,109 | ) | (8,244 | ) | ||||||
| State |
(1,045 | ) | (4,759 | ) | (7,638 | ) | ||||||
|
|
|
|
|
|
|
|||||||
| Total deferred |
(3,861 | ) | (8,868 | ) | (15,882 | ) | ||||||
|
|
|
|
|
|
|
|||||||
| Total income tax expense |
$ | 5,045 | $ | 25,357 | $ | 38,692 | ||||||
|
|
|
|
|
|
|
|||||||
The tax effects of significant temporary differences, which comprise the net deferred tax liabilities as of December 31, 2010 and 2011, are as follows (in thousands):
| December 31, | ||||||||
| 2010 | 2011 | |||||||
| Current deferred tax assets (liabilities): |
||||||||
| Employee compensation and benefits |
$ | — | $ | 12,693 | ||||
| Allowance for doubtful accounts |
1,788 | 1,561 | ||||||
| Other |
(401 | ) | 1,217 | |||||
|
|
|
|
|
|||||
| Total current deferred tax assets |
1,387 | 15,471 | ||||||
|
|
|
|
|
|||||
| Noncurrent deferred tax assets (liabilities): |
||||||||
| Property and equipment |
(31,118 | ) | (47,687 | ) | ||||
| Intangible assets |
(87,492 | ) | (68,925 | ) | ||||
| Employee compensation and benefits |
19,102 | 11,791 | ||||||
| Rent expense |
4,765 | 7,498 | ||||||
| Other |
2,071 | 6,449 | ||||||
|
|
|
|
|
|||||
| Total noncurrent deferred tax liabilities |
(92,672 | ) | (90,874 | ) | ||||
|
|
|
|
|
|||||
| Net deferred tax liabilities |
$ | (91,285 | ) | $ | (75,403 | ) | ||
|
|
|
|
|
|||||
Income tax expense computed using the federal statutory rates is reconciled to the reported income tax provisions for the years ended December 31, 2009, 2010 and 2011 as follows (in thousands):
| Year Ended December 31, | ||||||||||||
| 2009 | 2010 | 2011 | ||||||||||
| Federal statutory income tax rate |
35 | % | 35 | % | 35 | % | ||||||
|
|
|
|
|
|
|
|||||||
| Computed tax expense at federal statutory rates on income before income taxes |
$ | 5,216 | $ | 26,068 | $ | 37,360 | ||||||
| State income taxes (net of federal tax benefit) |
(634 | ) | (178 | ) | (1,381 | ) | ||||||
| Change in estimated effective state tax rates |
142 | (1,125 | ) | (240 | ) | |||||||
| Entertainment disallowance |
624 | 523 | 671 | |||||||||
| vAuto earn-out |
— | — | 2,123 | |||||||||
| Other—net |
(303 | ) | 69 | 159 | ||||||||
|
|
|
|
|
|
|
|||||||
| Income tax expense |
$ | 5,045 | $ | 25,357 | $ | 38,692 | ||||||
|
|
|
|
|
|
|
|||||||
F-24
Table of Contents
The Company’s deferred tax liabilities include $2.7 million and $4.3 million in deferred tax assets from state net operating losses and credits for the years ended December 31, 2010 and 2011, respectively. These carryforwards are expected to be utilized before they expire beginning in 2017.
The Company’s unrecognized tax benefits relate to a variety of issues for which the ultimate tax determination is uncertain due to the interpretation and judgment necessary in applying complex tax laws and regulations in various taxing jurisdictions.
Total unrecognized tax benefits, excluding the deferred income tax impact of federal benefits on state tax positions and federal and state benefits on interest, were $0, $1.3 million and $1.3 million as of December 31, 2009, 2010 and 2011, respectively. Of these amounts, $0, $0.9 million and $0.9 million would impact the effective tax rate if the Company were to recognize the tax benefit for such positions during the years ended December 31, 2009, 2010 and 2011, respectively.
A reconciliation of the beginning and ending amounts of unrecognized tax benefits, excluding interest, is provided below (in thousands):
| Year Ended December 31, | ||||||||||||
| 2009 | 2010 | 2011 | ||||||||||
| Balance at January 1 |
$ | — | $ | — | $ | 1,284 | ||||||
| Additions related to prior year tax positions |
— | 1,020 | — | |||||||||
| Additions related to current year tax positions |
— | 264 | — | |||||||||
| Lapse of applicable statute of limitations |
— | — | (53 | ) | ||||||||
|
|
|
|
|
|
|
|||||||
| Balance at December 31 |
$ | — | $ | 1,284 | $ | 1,231 | ||||||
|
|
|
|
|
|
|
|||||||
While it is reasonably possible that the amount of unrecognized tax benefits will increase or decrease within the next 12 months due to the settlement of ongoing audits or the lapse of statutes of limitations, the Company does not expect any change in the amount of unrecognized tax benefits to be material to the consolidated financial statements.
The Company classifies interest and penalties associated with its unrecognized tax benefits as a component of income tax expense. In 2010 and 2011, any interest expense accrued or liabilities for potential interest recorded were nominal. No accrued interest or liability for potential interest was recorded prior to 2010.
As a result of the Providence transaction (see Note 9), the Company ceased consolidation with the CEI federal filing group on June 15, 2010. The Internal Revenue Service (“IRS”) has examined all federal tax returns for the CEI and subsidiaries filing group and all issues have been settled through the 2010 tax year. The Company is not under examination for the separate federal tax year beginning June 16, 2010 and ended December 31, 2010, or for the tax year ended December 31, 2011. The Company has joined the IRS Compliance Assurance Program for the tax year ending December 31, 2012. This program accelerates the examination of key issues in an attempt to resolve them before the tax return is filed.
In addition, the Company is a member of certain CEI consolidated state filing groups, some of which are under examination for tax years through December 31, 2010. Further, various nonconsolidating states are currently conducting examinations of the Company’s income tax returns for tax years 2006 through 2010.
12. COMMITMENTS AND CONTINGENCIES
Operating Leases—The Company leases office facilities, equipment and vehicles under noncancelable operating leases. The Company rents its Atlanta, Georgia headquarters under a three-
F-25
Table of Contents
phase, long-term operating lease expiring in 2026, with the Company acquiring additional square footage for each phase. The three phases commence in July 2010, March 2011 and November 2012, with lease payments beginning in March 2011, August 2011 and June 2013, respectively. Leases relating to the Company’s previous headquarters buildings expired at various times in 2011. In addition, the Company has multiple lease agreements for office space and equipment primarily for its regional sales offices and recently acquired subsidiaries, with various expiration dates through 2016.
Future minimum lease payments under noncancelable operating leases as of December 31, 2011, are as follows (in thousands):
| Years Ending December 31, | ||||
| 2012 |
$ | 10,392 | ||
| 2013 |
11,093 | |||
| 2014 |
9,969 | |||
| 2015 |
8,980 | |||
| 2016 |
8,012 | |||
| Thereafter |
72,579 | |||
|
|
|
|||
| Total |
$ | 121,025 | ||
|
|
|
|||
Total rental expense was approximately $13.7 million, $15.0 million and $16.1 million for the years ended December 31, 2009, 2010, and 2011, respectively.
Other Agreements—In 2008, the Company entered into a three-year advertising and sponsorship agreement with National Basketball Association Properties, Inc. (“NBA”), which was extended an additional three years in 2011. In connection with the extension of this agreement, the Company will pay the NBA and recognize as sales and marketing expense $9.6 million, $10.4 million and $9.4 million in 2012, 2013 and 2014, respectively.
In addition, the Company has entered into noncancelable agreements to purchase certain advertising, web-based content, software, and other commitments and services. Future scheduled payments under these agreements are approximately $26.3 million, $4.8 million and $1.6 million in 2012, 2013 and 2014, respectively.
Other Contingencies—In April 2009, Trader Publishing, Ltd., filed suit in the High Court of Justice, London, England against AutoTrader.com, Inc., Portfolio Europe Ltd., and Manheim Auctions, Ltd. The complaint alleged trademark infringement and passing off based on the automatic seamless redirection to the AllApprovedcars.co.uk site of Internet users with United Kingdom IP addresses who sought the autotrader.com site, and the complaint was amended to allege redirection to the carmoney.co.uk site and linking to the carmoney site via an interstitial page. The complaint sought an injunction, unspecified monetary relief and fees. In 2010, the Company and other CEI-owned companies entered into a settlement agreement with Trader Publishing, Ltd. Among other things, the settlement agreement provides that the Company’s logo will not be used in automotive classified websites in the European Union, although the Company may use the names AutoTrader and AutoTrader.com on such websites for the purpose of referring to or describing any business affiliation between such sites and the Company. The Company also paid nominal consideration as a result of the settlement.
The Company is party to other legal proceedings that are ordinary and incidental to the business. Management does not expect that any of these other currently pending legal proceedings will have a material adverse effect on the Company’s consolidated financial position, results of operations, or cash flows.
F-26
Table of Contents
13. EMPLOYEE BENEFIT PLANS
Certain full-time employees of the Company are eligible to participate in CEI’s funded, qualified, defined-benefit pension plan. Certain key employees also participate in CEI’s unfunded, nonqualified, supplemental pension plan. These plans call for benefits to be paid to eligible employees at retirement based primarily upon years of service with CEI and the Company and compensation rates near retirement. Under the CEI pension plans, CEI allocates pension expense to the Company generally based on actuarial determinations of the effects of the Company’s employees’ participation in the plan. Annual expenses may be volatile, largely as a result of economic factors, including volatility in discount rates and investment returns, as well as changes in laws, regulations and assumptions used to calculate pension expense. Pension expense allocated to and paid by the Company under the qualified and nonqualified plans was $8.4 million, $13.9 million and $16.5 million for the years ended December 31, 2009, 2010 and 2011, respectively, which was recognized as operating expense and allocated based on the underlying departmental personnel and related compensation.
In addition to pension benefits, the Company provides certain postretirement health care and life insurance benefits to certain employees through participation in the CEI postretirement plan. Under the CEI postretirement healthcare plan, CEI allocates postretirement healthcare expense to the Company generally based on actuarial determinations of the effects of the Company’s employees’ participation in the plan. Annual expenses may be volatile, largely as a result of economic factors, including volatility in discount rates and investment returns, as well as changes in laws, regulations and assumptions used to calculate postretirement healthcare expense. Periodic postretirement expense allocated to and paid by the Company was approximately $0.5 million, $0.2 million and $0.1 million for the years ended December 31, 2009, 2010 and 2011, respectively, which is recognized as operating expense and allocated based on the underlying departmental personnel and related compensation. In addition, certain of the Company’s employees are eligible to participate in the qualified 401(k) savings plan of CEI. Under the terms of this plan, the Company matches 50% of employee contributions up to a maximum 6% of the employee’s eligible compensation. The Company’s expense under this plan was $4.0 million, $4.3 million and $5.0 million for the years ended December 31, 2009, 2010 and 2011, respectively.
Also, the Company provides eligible employees the opportunity to defer a percentage of annual compensation under the Company’s Savings Plus Restoration Plan and Executive Savings Plus Restoration Plan. The Company matches 50% of employee contributions up to a maximum 6% of the employee’s eligible compensation, reduced by the amount matched by the Company under the CEI 401(k) plan. The amounts due each participant represent the deferred compensation and the Company’s matching deferral, plus an annual rate of return on such amounts determined by CEI which in no event shall be less than an annual rate of 5%. Amounts payable under these plans represent unsecured general obligations of the Company. During 2009, 2010 and 2011, the Company recorded $0.3 million, $0.4 million and $0.7 million of expense related to these plans, respectively.
14. LONG-TERM INCENTIVE COMPENSATION
The Company’s long-term incentive plan (the “LTIP”) provides opportunities for employees and certain others to participate in the appreciation in the equity value of the Company or awards based on Company performance. Since the inception of the LTIP, the Company has granted various types of cash and share-based awards to management-level employees on a discretionary basis.
The Company recognized long-term incentive compensation expense in the aggregate amount of $11.6 million, $24.0 million and $19.1 million related to the following awards for the years ended December 31, 2009, 2010 and 2011, respectively.
F-27
Table of Contents
Stock Options—The Plan permits the grant of nonqualified and incentive stock options and stock appreciation rights. The Company maintains a stock option plan under which options are granted to purchase shares of the Company’s Class B common stock.
Persons earning the right to receive stock options are determined by the Compensation Committee, which is a subset of the Company’s Board of Directors. The options currently outstanding are generally exercisable at the end of the appreciation period, which is December 31, 2015. Half of the stock options granted vest over a period more than four years, with 60% vesting at December 31, 2013, 80% at December 31, 2014, and 100% at December 31, 2015. The remaining half of the stock options vest at a similar rate and time and are based on the achievement of certain performance criteria. In the event of a public offering of the Company’s stock prior to December 31, 2015, the options will vest 20% per year and, once vested, are exercisable during the 10-year period ended December 31, 2020.
The options are net-settled in shares of the Company’s Class B common stock. The following is a reconciliation of options outstanding (number of options and aggregate intrinsic values in thousands):
| Options | Weighted- Average Exercise Price |
Average Remaining Contractual Term (in years) |
Aggregate Intrinsic Value |
|||||||||||||
| Outstanding at January 1, 2011 |
— | $ | — | — | $ | — | ||||||||||
| Granted |
3,842 | 15.00 | 4.6 | 19,065 | ||||||||||||
| Exercised |
— | — | — | — | ||||||||||||
| Forfeited/expired |
— | — | — | — | ||||||||||||
|
|
|
|
|
|
|
|
|
|||||||||
| Outstanding at December 31, 2011 |
3,842 | $ | 15.00 | 4.0 | $ | 19,065 | ||||||||||
|
|
|
|
|
|
|
|
|
|||||||||
Of the 3.8 million options outstanding at December 31, 2011, approximately 3.2 million are expected to vest. Unrecognized compensation cost for these options expected to vest is $17.5 million as of December 31, 2011.
There were no such awards granted prior to January 1, 2011.
The fair value of each option grant is estimated using the Black-Scholes option pricing model. The weighted-average assumptions used for 2011 and the calculated weighted-average fair values of the options are as follows:
| Expected dividend yield |
0 | % | ||
| Risk-free interest rate |
1.7 | % | ||
| Expected life in years |
4.6 | |||
| Expected volatility |
50.9 | % | ||
| Weighted-average fair value of options granted |
$ | 6.59 |
Expected volatilities are based on the median of the Company’s publicly traded peer companies’ most recent historical volatility commensurate with the expected life. The expected dividend yield is 0% since the Company does not plan to offer regular dividends. The risk-free interest rate is based on the yield at the date of grant of a U.S. Treasury security with a maturity period approximating the expected term. The expected life represents an estimate of the period of time options are expected to remain outstanding and reflects the vesting schedule of the options. The contractual and expected life of the options would increase if the Company were to pursue a public offering of its stock.
F-28
Table of Contents
Restricted Stock Awards—In 2011, the Company awarded 32,612 shares of restricted stock under the LTIP with a grant-date fair value of $15.00 per share. Such shares remained outstanding at December 31, 2011, and vest 100% on December 31, 2013.
Stock Appreciation Rights—Under the LTIP, the Company granted stock appreciation rights that entitle the holder to receive a cash payment based upon the appreciation in the fair value of the Company’s stock. Employee awards vest 60%, 80%, and 100% on the third, fourth, and fifth anniversaries, respectively, of the grant dates. Vested awards become payable on the earlier of the fifth anniversary of the grant date or date of termination. In the event of a public offering of the Company’s stock prior to December 31, 2015, the stock appreciation rights will vest 20% per year and become payable in shares of the Company’s Class B common stock instead of cash.
The following is a summary of stock appreciation rights activity (number of rights in thousands):
| Year Ended December 31, | ||||||||||||||||||||||||
| 2009 | 2010 | 2011 | ||||||||||||||||||||||
| Number of Awards |
Weighted- Average Exercise Price |
Number of Awards |
Weighted- Average Exercise Price |
Number of Awards |
Weighted- Average Exercise Price |
|||||||||||||||||||
| Outstanding at January 1 |
5,980 | $ | 4.99 | 2,828 | $ | 6.63 | 930 | $ | 9.03 | |||||||||||||||
| Granted |
— | — | — | — | 721 | 15.00 | ||||||||||||||||||
| Canceled |
(48 | ) | 7.16 | (13 | ) | 9.03 | (6 | ) | 15.00 | |||||||||||||||
| Exercised |
(3,104 | ) | 3.46 | (1,885 | ) | 5.43 | (930 | ) | 9.03 | |||||||||||||||
|
|
|
|
|
|
|
|
|
|
|
|
|
|||||||||||||
| Outstanding at December 31 |
2,828 | $ | 6.63 | 930 | $ | 9.03 | 715 | $ | 15.00 | |||||||||||||||
|
|
|
|
|
|
|
|
|
|
|
|
|
|||||||||||||
| Vested at December 31 |
2,625 | $ | 6.44 | 930 | $ | 9.03 | — | — | ||||||||||||||||
|
|
|
|
|
|
|
|
|
|
|
|
|
|||||||||||||
| Vested and Payable at December 31 |
1,817 | $ | 5.30 | 930 | $ | 9.03 | — | — | ||||||||||||||||
|
|
|
|
|
|
|
|
|
|
|
|
|
|||||||||||||
As of December 31, 2009, 2010 and 2011, stock appreciation rights outstanding had weighted-average contractual terms of 0.4 years, 0.0 years and 4.0 years, respectively, and aggregate intrinsic value of $15.4 million, $5.6 million and $3.5 million, respectively. The aggregate intrinsic value of such awards that were vested and payable at December 31, 2009, 2010 and 2011, were $12.3 million, $5.6 million and $0, respectively.
Also included in the above tables are outstanding awards that were granted to certain executives and directors of the Company. Upon exercise, these executives and directors can settle between 15%–60% of the intrinsic value of their awards in the form of Class B shares of common stock. In 2009, 2010 and 2011, respectively, 110,560, 133,852 and 88,964 shares of Class B stock were issued to certain executives and directors of the Company in accordance with these settlement provisions.
Performance Plan—In 2009 and 2010, the Company granted performance awards under the LTIP to executives and key employees that entitle the recipient to a cash payment generally based on growth in the Company’s cash flows and debt reduction over a three-year period. Awards vest 40% and 100% on the second and third anniversaries, respectively, of the grant date. Similar to the stock appreciation rights awards, certain executives are permitted to settle 15%–60% of the value of their awards through issuance of Class B shares of common stock. As of December 31, 2010 and 2011, amounts accrued for performance awards were $35.9 million and $48.1 million, respectively, of which $34.0 million was vested and payable at December 31, 2011.
As discussed in Note 1, effective upon the merger of Merger Sub with and into ATC in June 2012, any future stock settlement of long-term incentive compensation awards will be through the issuance of shares of Class A common stock of ATG.
F-29
Table of Contents
15. TRANSACTIONS WITH AFFILIATED COMPANIES
CEI provides certain management services to the Company, including legal, corporate secretarial, tax, cash management (see Note 4), internal audit, risk management, benefits administration, business development, and other support services. The Company was allocated general and administrative expenses of approximately $1.9 million, $2.0 million and $2.0 million, respectively, for the years ended December 31, 2009, 2010 and 2011, related to these services. Allocated expenses are based on CEI’s estimate of services provided to the Company in relation to those provided to other divisions of CEI. Management believes that these allocations were made on a reasonable basis. However, the allocations are not necessarily indicative of the level of expenses that might have been incurred had the Company contracted directly with third parties. Management has not made any attempt to determine what the cost of obtaining such services from third parties would have been. Such expenses are subject to change in future periods.
The amounts due from CEI, as reported in the accompanying consolidated balance sheets, represent the net of (i) amounts due to CEI pursuant to various transactions, including those described above and in Notes 11 and 13, and (ii) amounts due from CEI pursuant to the cash management services provided by CEI as described in Note 4. Any daily net outstanding amounts due to or from CEI were subject to interest based on CEI’s internal borrowing rate, generally determined from CEI’s revolver rates, which ranged from 0.9% to 1.2% in 2009, 0.8% to 2.3% in 2010, and 2.2% to 2.6% in 2011. Interest income related to the net daily amounts due from CEI was $0.4 million, $1.3 million and $2.3 million for the years ended December 31, 2009, 2010 and 2011, respectively.
In addition, the Company received or provided other miscellaneous services with various CEI-related or controlled entities which totaled $2.4 million, $1.8 million and $0.4 million in 2009, 2010 and 2011, respectively.
16. SEGMENT INFORMATION
The Company operates in two reportable segments, defined as digital media and software solutions. The Company’s chief operating decision maker (the chief executive officer) evaluates performance and allocates resources based on the key performance measure of segment profit, which is defined as net income before depreciation and amortization, impairment of goodwill, other operating expense, other income (expense) and income tax expense. Other income (expense) and income tax expense are not allocated to individual segments, and the Company does not evaluate performance or allocate resources using segment asset data. All intercompany revenues and operating expenses are eliminated in consolidation and are not reviewed when evaluating segment performance. The accounting policies of the reportable segments are the same as those described in the summary of significant accounting policies in Note 2.
In the digital media segment, revenues are primarily generated by the autotrader.com and kbb.com websites through digital media subscriptions that allow subscribing dealers to list their cars on these websites as well as through display advertising purchased by OEMs, dealers and other brand advertisers. In the software solutions segment, which started in fourth quarter 2010 after the acquisitions of vAuto, CDM and HomeNet and was later augmented with the second quarter 2011 acquisition of VinSolutions, revenues are generated by selling subscriptions to a portfolio of software solutions which help subscribing dealers manage their operations more efficiently. This portfolio includes solutions that address dealer inventory sourcing and management, customer relationship management, marketing tracking and value appraising.
F-30
Table of Contents
Select financial information by reportable segment for the years ended December 31, 2009, 2010 and 2011 is as follows (in thousands):
| Year Ended December 31, 2009 | ||||||||||||
| Digital Media |
Software Solutions |
Consolidated | ||||||||||
| Segment revenues |
$ | 629,450 | $ | — | $ | 629,450 | ||||||
| Segment operating expenses |
493,080 | — | 493,080 | |||||||||
|
|
|
|
|
|
|
|||||||
| Segment profit |
136,370 | — | 136,370 | |||||||||
| Depreciation and amortization |
120,471 | |||||||||||
| Other operating expense |
1,374 | |||||||||||
|
|
|
|||||||||||
| Income from operations |
14,525 | |||||||||||
| Other income (expense) |
379 | |||||||||||
|
|
|
|||||||||||
| Income before income taxes |
$ | 14,904 | ||||||||||
|
|
|
|||||||||||
| Year Ended December 31, 2010 | ||||||||||||
| Digital Media |
Software Solutions |
Consolidated | ||||||||||
| Segment revenues |
$ | 725,890 | $ | 11,937 | $ | 737,827 | ||||||
| Segment operating expenses |
551,333 | 5,491 | 556,824 | |||||||||
|
|
|
|
|
|
|
|||||||
| Segment profit |
174,557 | 6,446 | 181,003 | |||||||||
| Depreciation and amortization |
65,325 | |||||||||||
| Other operating expense |
1,131 | |||||||||||
|
|
|
|||||||||||
| Income from operations |
114,547 | |||||||||||
| Other income (expense) |
(40,066 | ) | ||||||||||
|
|
|
|||||||||||
| Income before income taxes |
$ | 74,481 | ||||||||||
|
|
|
|||||||||||
| Year Ended December 31, 2011 | ||||||||||||
| Digital Media |
Software Solutions |
Consolidated | ||||||||||
| Segment revenues |
$ | 917,041 | $ | 108,136 | $ | 1,025,177 | ||||||
| Segment expenses |
641,996 | 74,626 | 716,622 | |||||||||
|
|
|
|
|
|
|
|||||||
| Segment profit |
275,045 | 33,510 | 308,555 | |||||||||
| Depreciation and amortization |
122,951 | |||||||||||
| Impairment of goodwill |
36,216 | |||||||||||
| Other operating expense |
9,634 | |||||||||||
|
|
|
|||||||||||
| Income from operations |
139,754 | |||||||||||
| Other income (expense) |
(33,011 | ) | ||||||||||
|
|
|
|||||||||||
| Income before income taxes |
$ | 106,743 | ||||||||||
|
|
|
|||||||||||
Substantially all of our revenues were generated in the United States and substantially all of our long-lived assets reside in the United States for all years presented.
17. SUBSEQUENT EVENTS
In April 2012, the December 2010 Credit Facility was further amended to, among other things, increase the aggregate term loan commitments by $200.0 million and increase the aggregate revolving credit commitments by $200.0 million in order to finance the April 2012 payment of a $400.0 million dividend to the Company’s shareholders.
F-31
Table of Contents
Effective September 30, 2012, the Company’s certificate of incorporation was amended to increase the number of authorized shares of its (i) Class A common stock from 250 million to 500 million and (ii) Class B common stock from 100 million to 200 million, and to effect a four-for-one stock split of its Class A common stock and its Class B common stock. Each holder of record of Class A common stock and Class B common stock on the close of business on the effective date received three additional shares for each share held. Except as otherwise indicated, all share and per share data presented in our financial statements and related notes thereto reflect the impact of the increase in authorized shares and the stock split.
18. CONDENSED PARENT COMPANY FINANCIAL INFORMATION
Basis of Presentation—The following condensed parent company financial information as of December 31, 2010 and 2011 and for the years ended December 31, 2009, 2010 and 2011 has been prepared in accordance with Rule 12-04 of Regulation S-X, as the restricted net assets of the subsidiaries of ATG exceed 25% of the consolidated net assets of ATG. As the parent of ATC, ATG’s ability to pay dividends may be restricted due to availability of cash balances of ATC as well as ATC’s ability to pay dividends to ATG (see Note 7). The condensed parent company financial information has been prepared using the same accounting principles and policies described in the notes to these consolidated financial statements, except that ATG’s investment in ATC is presented on an unconsolidated basis using the equity method of accounting.
| December 31, | ||||||||
| 2010 | 2011 | |||||||
| Investment in subsidiary |
$ | 248,828 | $ | 322,303 | ||||
|
|
|
|
|
|||||
| Redeemable common stock |
$ | 39,786 | $ | 57,290 | ||||
|
|
|
|
|
|||||
| Stockholders’ equity |
$ | 209,042 | $ | 265,013 | ||||
|
|
|
|
|
|||||
| Year Ended December 31, | ||||||||||||
| 2009 | 2010 | 2011 | ||||||||||
| Equity in earnings of subsidiary, net of taxes |
$ | 9,859 | $ | 49,124 | $ | 68,051 | ||||||
|
|
|
|
|
|
|
|||||||
| Net income |
$ | 9,859 | $ | 49,124 | $ | 68,051 | ||||||
|
|
|
|
|
|
|
|||||||
| NET INCOME PER COMMON SHARE: |
||||||||||||
| Basic |
$ | 0.05 | $ | 0.26 | $ | 0.35 | ||||||
|
|
|
|
|
|
|
|||||||
| Diluted |
$ | 0.05 | $ | 0.26 | $ | 0.35 | ||||||
|
|
|
|
|
|
|
|||||||
| WEIGHTED AVERAGE SHARES OUTSTANDING: |
||||||||||||
| Basic |
211,928 | 190,024 | 193,168 | |||||||||
|
|
|
|
|
|
|
|||||||
| Diluted |
212,612 | 190,236 | 193,484 | |||||||||
|
|
|
|
|
|
|
|||||||
| CASH FLOWS FROM OPERATING ACTIVITIES: |
||||||||||||
| Net income |
$ | 9,859 | $ | 49,124 | $ | 68,051 | ||||||
| Undistributed earnings of subsidiary |
(9,859 | ) | (49,124 | ) | (68,051 | ) | ||||||
|
|
|
|
|
|
|
|||||||
| Net cash from operating activities |
— | — | — | |||||||||
|
|
|
|
|
|
|
|||||||
| CASH FLOWS FROM FINANCING ACTIVITIES: |
||||||||||||
| Proceeds from issuance of stock |
— | 314,821 | — | |||||||||
| Repurchase of stock |
(7,576 | ) | (555,020 | ) | — | |||||||
| Deemed distribution from subsidiary |
7,576 | 240,199 | — | |||||||||
| Other |
— | — | — | |||||||||
|
|
|
|
|
|
|
|||||||
| Net cash from financing activities |
— | — | — | |||||||||
|
|
|
|
|
|
|
|||||||
| NET CHANGE IN CASH |
$ | — | $ | — | $ | — | ||||||
|
|
|
|
|
|
|
|||||||
* * * * * *
F-32
Table of Contents
(Formerly AutoTrader.com, Inc.)
CONDENSED CONSOLIDATED BALANCE SHEETS
AS OF DECEMBER 31, 2011 AND JUNE 30, 2012
(Unaudited, in thousands, except per share amounts)
| December 31, 2011 |
June 30, 2012 |
|||||||
| ASSETS |
||||||||
| CURRENT ASSETS: |
||||||||
| Amounts due from Cox Enterprises, Inc |
$ | 2,476 | $ | — | ||||
| Accounts receivable—less allowance for doubtful accounts of $3,043 and $1,733, respectively |
94,166 | 110,091 | ||||||
| Prepaid expenses |
18,642 | 18,564 | ||||||
| Deferred income tax assets |
15,471 | 8,465 | ||||||
| Other current assets |
2,761 | 5,990 | ||||||
|
|
|
|
|
|||||
| Total current assets |
133,516 | 143,110 | ||||||
| PROPERTY AND EQUIPMENT—Net |
197,621 | 197,609 | ||||||
| GOODWILL |
622,539 | 611,428 | ||||||
| INTANGIBLE ASSETS—Net |
545,982 | 520,152 | ||||||
| OTHER |
11,492 | 13,449 | ||||||
|
|
|
|
|
|||||
| TOTAL ASSETS |
$ | 1,511,150 | $ | 1,485,748 | ||||
|
|
|
|
|
|||||
| LIABILITIES, REDEEMABLE COMMON STOCK AND STOCKHOLDERS’ EQUITY (DEFICIT) |
||||||||
| CURRENT LIABILITIES: |
||||||||
| Current portion of long-term debt |
$ | 26,500 | $ | 41,000 | ||||
| Accounts payable |
49,742 | 36,843 | ||||||
| Accrued expenses |
44,600 | 32,630 | ||||||
| Current portion of long-term incentive compensation |
34,011 | 15,766 | ||||||
| Amounts due to Cox Enterprises, Inc |
— | 2,102 | ||||||
| Other current liabilities |
27,011 | 13,826 | ||||||
|
|
|
|
|
|||||
| Total current liabilities |
181,864 | 142,167 | ||||||
| LONG-TERM DEBT |
865,936 | 1,243,394 | ||||||
| LONG-TERM INCENTIVE COMPENSATION |
14,750 | 2,261 | ||||||
| DEFERRED INCOME TAXES |
90,874 | 84,436 | ||||||
| OTHER LIABILITIES |
35,423 | 40,712 | ||||||
|
|
|
|
|
|||||
| Total liabilities |
1,188,847 | 1,512,970 | ||||||
|
|
|
|
|
|||||
| COMMITMENTS AND CONTINGENCIES |
||||||||
| REDEEMABLE COMMON STOCK |
57,290 | 62,279 | ||||||
|
|
|
|
|
|||||
| STOCKHOLDERS’ EQUITY (DEFICIT): |
||||||||
| Common stock:(1) |
||||||||
| Class A, $0.001 par value—authorized, 500,000 shares; issued and outstanding, 71,836 and 72,125 shares, respectively (3,470 and 3,759 of which are redeemable, respectively) (See Note 1) |
68 | 68 | ||||||
| Class B, $0.001 par value—authorized, 200,000 shares; issued and outstanding, 121,352 shares (See Note 1) |
120 | 120 | ||||||
| Additional paid-in capital(1) (See Note 1) |
681,038 | 684,912 | ||||||
| Treasury stock |
(539,395 | ) | (539,395 | ) | ||||
| Retained earnings (accumulated deficit) |
123,182 | (235,206 | ) | |||||
|
|
|
|
|
|||||
| Total stockholders’ equity (deficit) |
265,013 | (89,501 | ) | |||||
|
|
|
|
|
|||||
| TOTAL LIABILITIES, REDEEMABLE COMMON STOCK AND STOCKHOLDERS’ EQUITY (DEFICIT) |
$ | 1,511,150 | $ | 1,485,748 | ||||
|
|
|
|
|
|||||
| (1) | The Company amended its certificate of incorporation effective September 30, 2012 to increase the number of authorized shares and to effect a four-for-one stock split of its common stock. |
See notes to condensed consolidated financial statements.
F-33
Table of Contents
(Formerly AutoTrader.com, Inc.)
CONDENSED CONSOLIDATED STATEMENTS OF INCOME
(SIX MONTHS ENDED JUNE 30, 2011 AND 2012)
(Unaudited, in thousands, except per share amounts)
| Six Months Ended June 30, |
||||||||
| 2011 | 2012 | |||||||
| REVENUES |
$ | 489,965 | $ | 563,091 | ||||
|
|
|
|
|
|||||
| OPERATING EXPENSES: |
||||||||
| Operations (excluding depreciation and amortization) |
91,225 | 111,620 | ||||||
| Sales and marketing (excluding depreciation and amortization) |
202,455 | 218,549 | ||||||
| General and administrative (excluding depreciation and amortization) |
57,149 | 64,758 | ||||||
| Depreciation and amortization |
61,224 | 63,919 | ||||||
| Impairment of goodwill |
— | 11,112 | ||||||
| Impairment of intangible assets |
— | 4,544 | ||||||
| Other |
6,043 | 873 | ||||||
|
|
|
|
|
|||||
| Total operating expenses |
418,096 | 475,375 | ||||||
|
|
|
|
|
|||||
| INCOME FROM OPERATIONS |
71,869 | 87,716 | ||||||
|
|
|
|
|
|||||
| OTHER EXPENSE: |
||||||||
| Interest expense—net |
(17,314 | ) | (15,900 | ) | ||||
| Other expense—net |
(7 | ) | (69 | ) | ||||
|
|
|
|
|
|||||
| Total other expense |
(17,321 | ) | (15,969 | ) | ||||
|
|
|
|
|
|||||
| INCOME BEFORE INCOME TAXES |
54,548 | 71,747 | ||||||
| INCOME TAX EXPENSE |
22,403 | 30,135 | ||||||
|
|
|
|
|
|||||
| NET INCOME |
$ | 32,145 | $ | 41,612 | ||||
|
|
|
|
|
|||||
| NET INCOME PER COMMON SHARE(1): |
||||||||
| Basic |
$ | 0.17 | $ | 0.22 | ||||
|
|
|
|
|
|||||
| Diluted |
$ | 0.17 | $ | 0.21 | ||||
|
|
|
|
|
|||||
| WEIGHTED AVERAGE SHARES OUTSTANDING(1): |
||||||||
| Basic |
193,136 | 193,356 | ||||||
|
|
|
|
|
|||||
| Diluted |
193,212 | 193,732 | ||||||
|
|
|
|
|
|||||
| DIVIDENDS PER COMMON SHARE: |
$ | — | $ | 2.07 | ||||
|
|
|
|
|
|||||
| (1) | The Company amended its certificate of incorporation effective September 30, 2012 to increase the number of authorized shares and to effect a four-for-one stock split of its common stock. |
See notes to condensed consolidated financial statements.
F-34
Table of Contents
(Formerly AutoTrader.com, Inc.)
CONDENSED CONSOLIDATED STATEMENTS OF STOCKHOLDERS’ EQUITY (DEFICIT) AND REDEEMABLE COMMON STOCK
SIX MONTHS ENDED JUNE 30, 2012
(Unaudited, in thousands)
| Common Stock(1) | Additional Paid-In Capital(1) |
Treasury Stock |
Retained Earnings (Accumulated Deficit) |
Total Stockholders’ Equity (Deficit) |
Redeemable Common Stock |
|||||||||||||||||||||||||||||||
| Class A Shares |
Class B Shares |
Class C Shares |
Par Value |
|||||||||||||||||||||||||||||||||
| BALANCE—December 31, 2011 |
68,364 | — | 121,352 | $ | 188 | $ | 681,038 | $ | (539,395 | ) | $ | 123,182 | $ | 265,013 | $ | 57,290 | ||||||||||||||||||||
| Repurchase of stock |
— | — | — | — | — | — | — | — | (611 | ) | ||||||||||||||||||||||||||
| Exchange of stock due to ATG formation |
— | 121,352 | (121,352 | ) | — | — | — | — | — | — | ||||||||||||||||||||||||||
| Stock-based compensation |
— | — | — | — | 3,874 | — | — | 3,874 | ||||||||||||||||||||||||||||
| Dividend paid |
— | — | — | — | — | — | (400,000 | ) | (400,000 | ) | — | |||||||||||||||||||||||||
| Settlement of long-term incentive compensation awards |
— | — | — | — | — | — | — | — | 5,600 | |||||||||||||||||||||||||||
| Net income |
— | — | — | — | — | — | 41,612 | 41,612 | — | |||||||||||||||||||||||||||
|
|
|
|
|
|
|
|
|
|
|
|
|
|
|
|
|
|
|
|||||||||||||||||||
| BALANCE—June 30, 2012 |
68,364 | 121,352 | — | $ | 188 | $ | 684,912 | $ | (539,395 | ) | $ | (235,206 | ) | $ | (89,501 | ) | $ | 62,279 | ||||||||||||||||||
|
|
|
|
|
|
|
|
|
|
|
|
|
|
|
|
|
|
|
|||||||||||||||||||
| (1) | The Company amended its certificate of incorporation effective September 30, 2012 to increase the number of authorized shares and to effect a four-for-one stock split of its common stock. |
See notes to condensed consolidated financial statements.
F-35
Table of Contents
(Formerly AutoTrader.com, Inc.)
CONDENSED CONSOLIDATED STATEMENTS OF CASH FLOWS
(SIX MONTHS ENDED JUNE 30, 2011 AND 2012)
(Unaudited, in thousands)
| Six Months Ended June 30, |
||||||||
| 2011 | 2012 | |||||||
| CASH FLOWS FROM OPERATING ACTIVITIES: |
||||||||
| Net income |
$ | 32,145 | $ | 41,612 | ||||
| Adjustments to reconcile net income to net cash provided by operating activities: |
||||||||
| Depreciation and amortization |
61,224 | 63,919 | ||||||
| Impairment of goodwill and intangible assets |
— | 15,656 | ||||||
| Long-term incentive compensation expense |
8,521 | 7,239 | ||||||
| Payment of long-term incentive compensation |
(4,199 | ) | (28,954 | ) | ||||
| Deferred income taxes |
2,271 | 567 | ||||||
| Other |
5,396 | 2,524 | ||||||
| Changes in assets and liabilities: |
||||||||
| (Increase) decrease in accounts receivable |
8,385 | (17,127 | ) | |||||
| (Increase) decrease in prepaid expenses and other assets |
12,764 | (258 | ) | |||||
| Decrease in accounts payable, accrued expenses and other liabilities |
(6,905 | ) | (23,163 | ) | ||||
|
|
|
|
|
|||||
| Net cash provided by operating activities |
119,602 | 62,015 | ||||||
|
|
|
|
|
|||||
| CASH FLOWS FROM INVESTING ACTIVITIES: |
||||||||
| Capital expenditures |
(38,662 | ) | (42,520 | ) | ||||
| Business acquired, net of cash acquired |
(133,354 | ) | 1,202 | |||||
| Change in amounts due from Cox Enterprises, Inc |
3,631 | 2,476 | ||||||
| Other |
210 | 6 | ||||||
|
|
|
|
|
|||||
| Net cash used in investing activities |
(168,175 | ) | (38,836 | ) | ||||
|
|
|
|
|
|||||
| CASH FLOWS FROM FINANCING ACTIVITIES: |
||||||||
| Proceeds from borrowings on credit facilities |
242,500 | 553,000 | ||||||
| Repayments of borrowings on credit facilities |
(190,250 | ) | (161,250 | ) | ||||
| Payment of debt issuance costs |
(3,677 | ) | (6,243 | ) | ||||
| Payment of contingent consideration |
— | (10,633 | ) | |||||
| Dividend paid |
— | (400,000 | ) | |||||
| Proceeds from issuance of stock |
— | 539 | ||||||
| Repurchase of stock |
— | (611 | ) | |||||
| Change in amounts due to Cox Enterprises, Inc |
— | 2,019 | ||||||
|
|
|
|
|
|||||
| Net cash provided by (used in) financing activities |
48,573 | (23,179 | ) | |||||
|
|
|
|
|
|||||
| NET CHANGE IN CASH |
— | — | ||||||
| CASH—Beginning of period |
— | — | ||||||
|
|
|
|
|
|||||
| CASH—End of period |
$ | — | $ | — | ||||
|
|
|
|
|
|||||
| SIGNIFICANT NON-CASH TRANSACTIONS: |
||||||||
| Settlement of long-term incentive compensation awards by issuance of Class A stock |
$ | 1,334 | $ | 5,061 | ||||
|
|
|
|
|
|||||
| Decrease in accrued capital expenditures—net |
$ | (6 | ) | $ | (761 | ) | ||
|
|
|
|
|
|||||
| Leasehold improvements funded by landlord |
$ | 5,561 | $ | 869 | ||||
|
|
|
|
|
|||||
| Contingent additional consideration for business acquired |
$ | 10,633 | $ | — | ||||
|
|
|
|
|
|||||
| SUPPLEMENTAL DISCLOSURES OF CASH FLOW INFORMATION: |
||||||||
| Cash paid during the period for: |
||||||||
| Interest |
$ | (18,277 | ) | $ | (15,225 | ) | ||
|
|
|
|
|
|||||
| Taxes |
$ | (8,123 | ) | $ | (26,102 | ) | ||
|
|
|
|
|
|||||
See notes to condensed consolidated financial statements.
F-36
Table of Contents
(Formerly AutoTrader.com, Inc.)
NOTES TO UNAUDITED CONDENSED CONSOLIDATED FINANCIAL STATEMENTS AS OF
DECEMBER 31, 2011 AND JUNE 30, 2012, AND FOR THE SIX MONTHS ENDED
JUNE 30, 2011 AND 2012
1. THE COMPANY
AutoTrader Group, Inc. (“ATG” or the “Company”) connects in-market car shoppers and sellers through its AutoTrader.com, Inc. (“ATC”) and KBB.com websites, which showcase car listings in local markets throughout the United States, as well as descriptive content relating to cars. It also offers car dealers software solutions to help them source, appraise, manage, price and market their inventory, and helps them manage their consumer relationships.
The Company is an indirect majority-owned subsidiary of Manheim, Inc. (“Manheim”), which in turn is a wholly-owned subsidiary of Cox Enterprises, Inc. (“CEI”). Noncontrolling interests are held by affiliates of Providence Equity Partners, LLC (“Providence”), affiliates of KPCB Holdings, Inc. (“KPCB”), current and former CEI executives, and Company employees.
In May 2012, a new Delaware corporation, ATG, was formed, and ATG, in turn, formed a wholly-owned subsidiary, (“Merger Sub”). In June 2012, pursuant to an agreement and plan of merger, Merger Sub merged with and into ATC, with ATC as the surviving corporation and, as a result, a wholly-owned subsidiary of ATG. Prior to the merger, shares of Class B common stock (non-voting) of ATC, in accordance with their terms, were converted into shares of Class A common stock (one vote per share) of ATC on a 1-for-1 share basis. In the merger, the previous stockholders of ATC received stock of ATG as consideration. Specifically, the holders of Class C common stock (ten votes per share) of ATC received Class B common stock (ten votes per share) of ATG on a 1-for-1 share basis, the holders of Class A common stock (one vote per share) of ATC received Class A common stock (one vote per share) of ATG on a 1-for-1 share basis.
In June 2012, the Company filed a registration statement on Form S-1 with the Securities and Exchange Commission (“SEC”) for a proposed initial public offering of its Class A common stock. The number of shares to be offered and the price range for the proposed offering have not yet been determined.
In July 2012, the Company acquired the assets of Auction Genius, a web-based software solution for auto dealers buying vehicles at auction, for $9.5 million, subject to a working capital adjustment.
The Company has no significant operations outside of the United States of America.
2. SUMMARY OF SIGNIFICANT ACCOUNTING POLICIES
The Company’s significant accounting policies are disclosed in the audited consolidated financial statements as of December 31, 2010 and 2011 and for the years ended December 31, 2009, 2010 and 2011. Since the date of those financial statements, there have been no material changes to the Company’s significant accounting policies, with the exception of the method of accounting for stock appreciation rights (see Note 10).
Basis of Presentation—The accompanying interim unaudited condensed consolidated financial statements have been prepared in accordance with accounting principles generally accepted in the United States (“GAAP”) for interim financial information and the rules and regulations of the Securities and Exchange Commission (the “SEC”). Accordingly, they do not include all of the information and notes required by generally accepted accounting principles for complete financial statements.
F-37
Table of Contents
The condensed consolidated financial statements include the accounts of the Company and its wholly-owned subsidiaries. All intercompany transactions and balances have been eliminated. The interim financial statements reflect all normal and recurring adjustments, which are, in the opinion of management, necessary for a fair presentation in conformity with GAAP. The interim financial statements should be read in conjunction with the audited financial statements as of December 31, 2010 and 2011 and for the years ended December 31, 2009, 2010 and 2011 and notes thereto. The Company has included results of operations of acquired companies from the date of acquisition. The results of operations for the interim periods should not be considered indicative of results to be expected for the full year.
Use of Estimates—The preparation of financial statements in conformity with GAAP requires management to make estimates and assumptions that affect the amounts reported in the financial statements and accompanying notes. Actual results could differ from those estimates.
Fair Value Measurements—The Financial Accounting Standards Board (“FASB”) authoritative guidance establishes a fair value hierarchy disclosure framework that prioritizes and ranks the level of inputs used in measuring assets and liabilities at fair value. This hierarchy prioritizes the inputs into three broad levels as follows:
Level 1—Quoted prices in active markets for identical assets or liabilities.
Level 2—Inputs other than level 1 that are derived principally from observable market data. These include quoted prices for similar assets or liabilities in active markets, quoted prices for identical assets or liabilities in inactive markets, inputs that are observable that are not quoted prices, and inputs that are derived from or corroborated by observable market data.
Level 3—Valuations developed from unobservable data reflecting the Company’s own assumptions.
The fair value of goodwill and intangible assets subject to impairment during the six months ended June 30, 2012 was determined using significant level 3 inputs (see note 4).
The redemption value of the Company’s redeemable common stock was based on the fair value of the Company’s common stock, which is determined using significant level 3 inputs in the form of a combination of the income approach and the market approach. The income approach utilizes a discounted cash flow model incorporating management’s expectations for future revenue, operating expenses, EBITDA, capital expenditures and an anticipated tax rate. The related cash flow forecasts are discounted using management’s estimate of the Company’s weighted-average cost of capital at the date of valuation. The market approach utilizes comparative market multiples in the valuation estimate. Multiples are derived by relating the value of guideline companies based on the market price of publicly traded shares to various measures of their earnings and cash flow. Such multiples are then applied to the Company’s historical and projected earnings and cash flow in developing the valuation estimate.
The carrying amounts of certain financial instruments, including cash, accounts receivable, accounts payable and accrued expenses, approximate fair value due to their short maturities. Borrowings under revolving credit agreements and floating-rate term loans approximate fair value because the borrowings incur interest at current market rates. The fair value of contingent consideration is estimated based on significant level 3 inputs primarily consisting of analyses using estimated cost of capital rates, which reflect interest rates currently available to the Company for debt with similar terms and estimates of the Company’s overall credit risk.
Revenue Recognition—The Company recognizes revenue when it is realized (or realizable) and earned, which generally occurs when each of the following criteria is met:
| a. | persuasive evidence of an arrangement exists |
F-38
Table of Contents
| b. | services have been rendered and delivered |
| c. | the price to the buyer from the seller is fixed and determinable |
| d. | collectability is reasonably assured |
The Company provides the following digital media and software solutions services to its customers.
| Ÿ | Digital media services are provided via websites operated by ATC and Kelley Blue Book Co., Inc. (“KBB”) and consist of online advertising sales to local and national sellers of automobiles and automotive-related products. |
| Ÿ | Dealer revenues are derived primarily from recurring monthly subscription-based advertising services sold to franchise and independent automobile dealers that allow the dealers to advertise their entire inventory on the Company’s websites. The Company offers a “pay for placement” model that sells tiered listings and premium advertising features that enhance the listings. Revenues from these services are recognized ratably over the subscription period in which the service is provided. |
| Ÿ | Brand advertising revenues are generated primarily from display advertising insertion orders placed by original equipment manufacturers (“OEMs”) and related advertising associations, in which the Company typically guarantees for a fixed fee a minimum number of impressions, or times that an advertisement appears in pages viewed by the users. These revenues are recognized ratably over the term of the agreement, provided that the total amount recognized does not exceed the amount that would be recognized based upon actual impressions delivered. Additional display advertising customers include automotive vendors, such as insurance, warranty and finance companies, automotive aftermarket retailers, and general advertisers who market their services on or integrate their product with the Company’s websites. Revenues from such customers are generally derived from transaction-based fees determined by contractually defined metrics, such as total site visitors, specific traffic referrals or transaction leads that originate on the Company’s websites and are recognized as the related fees are earned. In addition, other revenues generated from the sale of consumer and vehicle data gathered internally from the Company’s websites, such as vehicle values and visitor traffic trends, are included in this category and are recognized as the related fees are earned. |
| Ÿ | Private seller advertising revenues are generated from the sale of advertising services to private sellers desiring to list their automobiles for sale primarily on the ATC website, and are recognized ratably over the average life of the listing. |
| Ÿ | Software solutions services are generated by vAuto, Inc. (“vAuto”), HomeNet LLC (“HomeNet”), CDMdata, Inc. and CDM Dealer Services, Inc. (collectively, “CDM”), and VinSolutions, Inc. (“VinSolutions”) and consist of subscription sales to automobile dealers for a broad suite of dealership software tools for vehicle management, pricing and inventory optimization, online marketing and merchandising, and sales and service management. Generally, subscription fees are payable monthly and include training, support, and maintenance on an as-needed basis. Revenues are recognized ratably over the subscription period in which the services are provided. |
The Company does not customarily enter into barter advertising arrangements, and thus any revenue related to such arrangements is not material.
Goodwill and Intangible Assets—The Company evaluates goodwill and indefinite-lived intangible assets for impairment annually as of December 31 or more frequently if an event occurs or
F-39
Table of Contents
circumstances change that would more likely than not reduce the fair value of a reporting unit or indefinite-lived intangible asset below its carrying value. The goodwill impairment test consists of two steps. In the first step, the reporting unit’s carrying amount, including goodwill, is compared to its fair value which is measured based upon, among other factors, a discounted cash flow analysis as well as market multiples for comparable companies. If the carrying amount of the reporting unit is greater than its fair value, goodwill is considered potentially impaired and step two must be performed. Step two measures the impairment loss by comparing the implied fair value of the reporting unit’s goodwill with the carrying amount of that goodwill. The implied fair value of goodwill is determined by allocating the fair value of the reporting unit to all the assets and liabilities of that unit (including unrecognized intangibles) as if the reporting unit had been acquired in a business combination. The excess of fair value over the amounts allocated to the assets and liabilities of the reporting unit is the implied fair value of goodwill. The excess of the carrying amount over the implied fair value is the impairment loss.
In performing impairment tests of indefinite-lived intangible assets, the Company directly values the assets, rather than using a two-step approach. If the carrying value of the asset exceeds its estimated fair value, an impairment charge is measured and recorded in an amount equal to the excess.
The Company has six reporting units: ATC, vAuto, KBB, CDM, HomeNet and VinSolutions. The Company estimates the fair value of reporting units and indefinite-lived intangible assets using a combination of the income approach and the market approach. The income approach utilizes a discounted cash flow model incorporating management’s expectations for future revenue, operating expenses, EBITDA, capital expenditures and an anticipated tax rate. The related cash flow forecasts are discounted using management’s estimate of a weighted-average cost of capital for each reporting unit at the date of valuation. The market approach utilizes comparative market multiples in the valuation estimate. Multiples are derived by relating the value of guideline companies based on the market price of publicly traded shares to various measures of their earnings and cash flow. Such multiples are then applied to the historical and projected earnings and cash flow of the reporting unit in developing the valuation estimate. Preparation of forecasts and the selection of the discount rates involve significant judgments about expected future business performance and general market conditions. Significant changes in forecasts, the discount rates selected or the weighting of the income and market approach could affect the estimated fair value of one or more of the reporting units and could result in a goodwill impairment charge in a future period.
Other finite-lived intangible assets are amortized over their estimated useful lives in a manner reflecting the pattern in which the economic benefit of the assets are consumed.
Valuation of Long-Lived Assets—The Company regularly evaluates whether events and circumstances have occurred that indicate the carrying amount of property and equipment and finite-lived intangible assets may not be recoverable. Conditions that could indicate an impairment assessment is needed include a significant decline in the observable market value of an asset or asset group, a significant change in the extent or manner in which an asset or asset group is used, or a significant adverse change that would indicate that the carrying amount of an asset or asset group is not recoverable. When factors indicate that these long-lived assets or asset groups should be evaluated for possible impairment, we assess the potential impairment by determining whether the carrying value of such long-lived assets or asset groups will be recovered through the future undiscounted cash flows expected from use of the asset or asset group and its eventual disposition. If the carrying amount of the asset or asset group is determined not to be recoverable, an impairment charge is recorded based on the excess, if any, of the carrying amount over fair value. Fair values are determined based on quoted market values or discounted cash flows analyses as applicable. The Company regularly evaluates whether events and circumstances have occurred that indicate the useful lives of property and equipment and finite-life intangible assets may warrant revision.
F-40
Table of Contents
Net Income Per Common Share—Basic net income per common share is calculated by dividing net income available to common stockholders by the weighted average number of common shares outstanding during the year. Diluted net income per common share is similar to basic, except that the weighted average number of shares outstanding is increased by the potentially dilutive effect of outstanding stock options, stock appreciation rights and certain cash-based incentive awards that may be settled in shares of common stock, if applicable, during the year, using the treasury stock method.
The following table is a reconciliation of the numerator and denominator of basic net income per common share to the numerator and denominator of diluted net income per common share (in thousands, except per share amounts):
| Six Months Ended June 30, | ||||||||
| 2011 | 2012 | |||||||
| Numerator: |
||||||||
| Net income attributable to common stockholders |
$ | 32,145 | $ | 41,612 | ||||
|
|
|
|
|
|||||
| Denominator: |
||||||||
| Weighted average common stock outstanding—basic |
193,136 | 193,356 | ||||||
|
|
|
|
|
|||||
| Stock appreciation rights |
76 | 40 | ||||||
| Cash-based incentives |
— | 320 | ||||||
| Stock options |
— | 16 | ||||||
|
|
|
|
|
|||||
| Weighted average common stock outstanding—diluted |
193,212 | 193,732 | ||||||
|
|
|
|
|
|||||
| Basic net income per common share |
$ | 0.17 | $ | 0.22 | ||||
|
|
|
|
|
|||||
| Diluted net income per common share |
$ | 0.17 | $ | 0.21 | ||||
|
|
|
|
|
|||||
Diluted net income per common share for the periods presented does not reflect the following potential common shares, as the effect would be anti-dilutive (in thousands):
| Six Months Ended June 30, | ||||||||
| 2011 | 2012 | |||||||
| Stock options |
3,244 | 4,784 | ||||||
|
|
|
|
|
|||||
Subsequent Events—The Company has performed an evaluation of subsequent events through August 24, 2012, the date its financial statements were available to be issued.
3. ACQUISITIONS
VinSolutions—In June 2011, ATG acquired 100% of the assets of VinSolutions, Inc. (“VinSolutions”), a provider of end-to-end solution platforms for automobile dealers including customer relationship and internet lead management, inventory management tools, dealer websites, sales management and desking tools, social media and direct targeted marketing campaign tools, for $134.6 million in cash. In addition, the purchase agreement provided for maximum additional consideration of $15.0 million in the form of an earn-out payable in 2012, based upon the achievement of certain financial targets for 2011. The fair value of this earn-out was $10.6 million at the time of the acquisition and was accounted for as a current liability and considered additional purchase price. From January to March 2012, the fair value of the earn-out increased from $12.1 million to $13.0 million, and the corresponding $0.9 million increase was recognized as other operating expense. The Company paid $13.0 million in 2012 in settlement of the earn-out, of which $6.5 million was paid in February 2012 and the remaining $6.5 million was paid in April 2012. Also in April 2012, the Company received a final $1.2 million working capital settlement from the seller of VinSolutions, thereby reducing the overall purchase price to $144.1 million.
F-41
Table of Contents
The following supplemental unaudited pro forma information presents a summary of the operating results of the Company for the six months ended June 30, 2011, as if the Company had acquired VinSolutions as of January 1, 2011 (in thousands):
| Unaudited Pro Forma Consolidated Results | ||||||||||||
| Six Months Ended June 30, 2011 | ||||||||||||
| Historical ATG Consolidated |
VinSolutions | Pro Forma ATG Consolidated |
||||||||||
| Revenues |
$ | 489,965 | $ | 12,772 | $ | 502,737 | ||||||
| Operating expenses: |
||||||||||||
| Operations, sales and marketing, and general and administrative(1) |
350,829 | 11,021 | 361,850 | |||||||||
| Depreciation and amortization |
61,224 | 4,521 | 65,745 | |||||||||
| Impairment of goodwill |
— | — | — | |||||||||
| Other operating expense(2) |
6,043 | — | 6,043 | |||||||||
|
|
|
|
|
|
|
|||||||
| Total operating expenses |
418,096 | 15,542 | 433,638 | |||||||||
| Income (loss) from operations |
$ | 71,869 | $ | (2,770 | ) | $ | 69,099 | |||||
|
|
|
|
|
|
|
|||||||
| Net income (loss) |
$ | 32,145 | $ | (2,954 | ) | $ | 29,191 | |||||
|
|
|
|
|
|
|
|||||||
|
(1)Includes long-term incentive compensation expense of the following: |
$ | 8,521 | $ | — | $ | 8,521 | ||||||
|
|
|
|
|
|
|
|||||||
| (2) | Consists primarily of the post-acquisition changes in the fair value of the earn-outs associated with the vAuto and VinSolutions acquistions as well as gains and losses on the sale or disposal of assets. |
The unaudited pro forma consolidated results were prepared using the acquisition method of accounting and are based on the historical financial information of ATG and VinSolutions, reflecting in 2011 results of operations for a six month period. The historical financial information has been adjusted to give effect to the pro forma events that are: (i) directly attributable to the acquisition; (ii) factually supportable; and (iii) expected to have a continuing impact on the combined results. The unaudited pro forma consolidated results reflect primarily adjustments related to additional amortization expense, additional depreciation expense, additional interest expense and the corresponding tax benefits. The unaudited pro forma consolidated results are not necessarily indicative of what the Company’s consolidated results of operations actually would have been had this acquisition been completed on January 1, 2011. In addition, the unaudited pro forma consolidated results do not purport to project future results of operations of the combined company nor do they reflect the expected realization of any cost savings associated with the acquisition.
4. GOODWILL AND INTANGIBLE ASSETS
Subsequent to April 9, 2012, two events impacted HomeNet which the Company believed to be an indicator of further impairment for HomeNet as of June 30, 2012. These two events, which include a lower revenue outlook for HomeNet after experiencing significant customer migration issues during a late-April 2012 product launch and a higher expense outlook due to incremental recurring expenses expected from an imminent data license agreement, resulted in reduced future cash flow projections for HomeNet. As a result, the Company determined that certain of HomeNet’s long-lived assets were not recoverable and recorded an impairment charge of $4.5 million during the six months ended June 30, 2012. In addition, the Company determined that the remaining carrying value of goodwill attributable to HomeNet exceeded its implied fair value and, therefore, recognized an $11.1 million impairment of goodwill during the six months ended June 30, 2012.
F-42
Table of Contents
During the six months ended June 30, 2012, KBB experienced lower than expected cash flows relative to assumptions made in the Company’s annual impairment test as of December 31, 2011. Further declines in expected cash flows could result in impairment charges in a future period.
The estimated aggregate fair value of the long-lived assets impaired during the six months ended June 30, 2012 was approximately $1.5 million. These fair value estimates were determined using level 3 inputs derived primarily from discounted future cash flows. The risk adjusted rate of return used to discount these cash flows was 14.5%.
The primary purpose of the HomeNet acquisition was to enhance the Company’s internal technology development capabilities, not to provide significant incremental revenue.
The changes in the carrying amount of goodwill for the six months ended June 30, 2012 are summarized as follows (in thousands):
| Six Months Ended June 30, 2012 | ||||||||||||
| Digital Media | Software Solutions | Consolidated | ||||||||||
| Balance at January 1, 2012: |
||||||||||||
| Goodwill |
$ | 325,384 | $ | 338,681 | $ | 664,065 | ||||||
| Accumulated impairment losses |
(5,310 | ) | (36,216 | ) | $ | (41,526 | ) | |||||
|
|
|
|
|
|
|
|||||||
| 320,074 | 302,465 | 622,539 | ||||||||||
|
|
|
|
|
|
|
|||||||
| Impairments |
— | (11,112 | ) | (11,112 | ) | |||||||
|
|
|
|
|
|
|
|||||||
| Balance at June 30, 2012: |
||||||||||||
| Goodwill |
325,384 | 338,681 | 664,065 | |||||||||
| Accumulated impairment losses |
(5,310 | ) | (47,327 | ) | (52,637 | ) | ||||||
|
|
|
|
|
|
|
|||||||
| $ | 320,074 | $ | 291,354 | $ | 611,428 | |||||||
|
|
|
|
|
|
|
|||||||
Summarized below are the carrying values and accumulated amortization of intangible assets that continue to be amortized, as well as the carrying value of those intangible assets which are not subject to amortization as of December 31, 2011 and June 30, 2012 (in thousands).
| December 31, 2011 | June 30, 2012 | |||||||||||||||||||||||||||||||
| Weighted- Average Useful Lives |
Gross Carrying Value |
Accumulated Amortization |
Net Carrying Value |
Gross Carrying Value |
Accumulated Amortization |
Impairment | Net Carrying Value |
|||||||||||||||||||||||||
| Non-amortizable trade names |
NA | $ | 348,394 | $ | — | $ | 348,394 | $ | 348,394 | $ | — | $ | — | $ | 348,394 | |||||||||||||||||
| Customer relationships |
12.8 yrs | 222,518 | (146,303 | ) | 76,215 | 222,518 | (157,334 | ) | (3,022 | ) | 62,162 | |||||||||||||||||||||
| Web-based technology |
9.1 yrs | 214,957 | (130,948 | ) | 84,009 | 214,957 | (138,155 | ) | — | 76,802 | ||||||||||||||||||||||
| Amortizable brand and trademarks |
5.0 yrs | 37,013 | (4,460 | ) | 32,553 | 37,013 | (6,896 | ) | (571 | ) | 29,546 | |||||||||||||||||||||
| Patent licenses |
18.8 yrs | 6,730 | (6,707 | ) | 23 | 6,730 | (6,708 | ) | — | 22 | ||||||||||||||||||||||
| Non-compete agreements |
2.5 yrs | 3,956 | (436 | ) | 3,520 | 3,956 | (507 | ) | (951 | ) | 2,498 | |||||||||||||||||||||
| Other amortizable intangible assets |
4.1 yrs | 1,996 | (728 | ) | 1,268 | 1,996 | (1,268 | ) | — | 728 | ||||||||||||||||||||||
|
|
|
|
|
|
|
|
|
|
|
|
|
|
|
|||||||||||||||||||
| Total intangible assets |
$ | 835,564 | $ | (289,582 | ) | $ | 545,982 | $ | 835,564 | $ | (310,868 | ) | $ | (4,544 | ) | $ | 520,152 | |||||||||||||||
|
|
|
|
|
|
|
|
|
|
|
|
|
|
|
|||||||||||||||||||
Total amortization expense related to intangible assets with estimated useful lives was $20.8 million and $21.2 million for the six months ended June 30, 2011 and 2012, respectively.
F-43
Table of Contents
5. LONG-TERM DEBT
Long-term debt as of December 31, 2011 and June 30, 2012 consisted of the following (in thousands):
| December 31, 2011 |
June 30, 2012 |
|||||||
| Revolving bank credit borrowing, maturing 2015 (“Revolver”) |
$ | 65,000 | $ | 270,000 | ||||
| Senior secured bank credit borrowing, maturing 2015 (“Term Loan A”) |
432,500 | 421,250 | ||||||
| Senior secured bank credit borrowing, maturing 2017 (“Term Loan A-2”) |
— | 200,000 | ||||||
| Senior secured bank credit borrowing, maturing 2016 (“Term Loan B”) |
397,000 | 395,000 | ||||||
| Original issue discount on senior secured credit borrowings |
(2,064 | ) | (1,856 | ) | ||||
|
|
|
|
|
|||||
| Total debt |
892,436 | 1,284,394 | ||||||
| Less—current portion |
(26,500 | ) | (41,000 | ) | ||||
|
|
|
|
|
|||||
| Long-term debt |
$ | 865,936 | $ | 1,243,394 | ||||
|
|
|
|
|
|||||
In April 2012, ATC’s credit facilities were amended to, among other things, increase the aggregate term loan commitments by $200.0 million and increase the aggregate revolving credit commitments by $200.0 million in order to finance the April 2012 payment of a $400.0 million special dividend to the Company’s then-existing stockholders. The additional term loans mature in 2017 unless ATC has not repaid or refinanced the earlier maturing portion of the existing Term Loan A by 2015 or repaid or refinanced the Term Loan B by 2016 (or, in either case, ATC has not demonstrated to the reasonable satisfaction of the administrative agent that ATC has committed financing or cash available to repay or refinance such loans), in which case the additional loans made pursuant to the amendment in April 2012 shall mature in 2015 or 2016, as applicable.
The Revolver provides for London interbank offering rate (“LIBOR”) and base rate borrowings. At June 30, 2012, the Company had $270.0 million outstanding under the Revolver, resulting in unused capacity of $130.0 million of the total $400.0 million in revolving credit available under the facility. During the six month period ended June 30, 2012, total Revolver borrowings were $353.0 million, including $200.0 million drawn under the additional commitment made pursuant to the April 2012 amendment.
Under the terms of the credit facilities outstanding for the six months ended June 30, 2011 and 2012, interest on the outstanding balances resets and is payable quarterly in the case of base rate borrowings, and at the end of each interest period, in the case of LIBOR-based borrowings, and is determined as follows:
| Ÿ | Interest on the LIBOR-based Revolver borrowings is based on LIBOR, plus a basis point (“bps”) spread that has ranged from 300 bps to 175 bps, resulting in per annum interest rates ranging from 1.99% to 3.27%. The interest rate on the LIBOR-based borrowings was 2.50% at June 30, 2012. Interest on the base rate Revolver borrowings is determined using a 3.25% base rate plus a bps spread that has ranged from 200 bps to 75 bps, resulting in per annum interest rates ranging from 4.00% to 5.25%. The interest rate on the base rate borrowings was 4.50% at June 30, 2012. |
| Ÿ | Interest on the Term Loan A was based on LIBOR, plus a bps spread ranging from 300 bps to 175 bps, resulting in per annum interest rates ranging from 2.00% to 3.27%. The interest rate on the Term Loan A was 2.50% at June 30, 2012. |
| Ÿ | Interest on the Term Loan A-2 was based on LIBOR, plus a bps spread of 225 bps, resulting in per annum interest rates ranging from 2.49% to 2.50%. The interest rate on the Term Loan A-2 was 2.50% at June 30, 2012. |
F-44
Table of Contents
| Ÿ | Interest on the Term Loan B was based on a LIBOR floor, plus a bps spread ranging from 325 bps to 300 bps, resulting in per annum interest rates ranging from 4.00% to 4.75%. The interest rate on the Term Loan B was 4.00% at June 30, 2012. |
Debt Covenants—The Company’s credit facilities contain, among other provisions, specified leverage and debt service ratio requirements. Compliance with these ratios limits the Company’s ability to incur unlimited indebtedness. At December 31, 2011 and June 30, 2012, the Company was in compliance with all covenants under its credit facilities.
6. OTHER CURRENT AND NONCURRENT LIABILITIES
The Company’s other current liabilities as of December 31, 2011 and June 30, 2012 consist of the following (in thousands):
| December 31, 2011 |
June 30, 2012 |
|||||||
| Deferred revenue |
$ | 11,270 | $ | 9,227 | ||||
| Deferred contingent consideration |
12,077 | — | ||||||
| Other |
3,664 | 4,599 | ||||||
|
|
|
|
|
|||||
| Total other current liabilities |
$ | 27,011 | $ | 13,826 | ||||
|
|
|
|
|
|||||
Deferred revenue consists of the timing difference between payments by customers for subscription advertising services and set-up fees and the recognition as revenue of the services and fees based on the average life of the vehicle listing or customer, as applicable.
Deferred contingent consideration relates to the 2011 acquisition of VinSolutions, which was paid during the six months ended June 30, 2012.
The Company’s other noncurrent liabilities as of December 31, 2011 and June 30, 2012 consist of the following (in thousands):
| December 31, 2011 |
June 30, 2012 |
|||||||
| Deferred rent |
$ | 19,638 | $ | 22,793 | ||||
| Accrued employee benefits and other |
15,785 | 17,919 | ||||||
|
|
|
|
|
|||||
| Total other noncurrent liabilities |
$ | 35,423 | $ | 40,712 | ||||
|
|
|
|
|
|||||
Deferred rent consists of the timing difference between the contractual operating lease payments and the recognition of rent expense on a straight-line basis. Accrued employee benefits and other liabilities primarily reflect amounts payable under the Company’s Savings Plus and Executive Savings Plus Restoration Plans. At December 31, 2011 and June 30, 2012, respectively, $12.6 million and $14.7 million were payable under these Plans.
7. INCOME TAXES
The Company determines its income tax provision for interim periods by applying an estimate of its annual effective tax rate to pretax net income for the period, adjusted for discrete items that are taken into account in the respective periods.
The effective tax rate for the six months ended June 30, 2012 was 42.0%. The Company’s tax rate differs from the statutory tax rate primarily due to the effect of state income taxes and changes in
F-45
Table of Contents
valuation allowances against certain deferred tax assets. A valuation allowance of $4.4 million was recorded which partially offset the tax benefit from the impairment of goodwill and intangible assets that was treated as a discrete item during the first quarter.
The effective tax rate for the six months ended June 30, 2011 was 41.1%. The Company’s tax rate differs from the statutory tax rate primarily due to the effect of state income taxes and nondeductible expenses.
8. COMMITMENTS AND CONTINGENCIES
The Company is party to legal proceedings that are ordinary and incidental to the business. Management does not expect that any of these pending legal proceedings will have a material adverse effect on the Company’s consolidated financial position, results of operations, or cash flows.
9. EMPLOYEE BENEFIT PLANS
Certain full time employees of the Company participate in CEI’s funded, qualified, defined benefit pension plan, CEI’s unfunded, nonqualified, supplemental pension plan and CEI’s postretirement plan. Pension expense allocated to and paid by the Company under the qualified and nonqualified plans was $7.1 million and $7.6 million for the six months ended June 30, 2011 and 2012, respectively, which was recognized as operating expense and allocated based on the underlying departmental personnel and related compensation. Net periodic postretirement expense allocated to and paid by the Company was nominal for the six months ended June 30, 2011 and 2012, and was recognized as operating expense and allocated based on the underlying departmental personnel and related compensation.
In addition, certain of the Company’s employees are eligible to participate in the qualified 401(k) savings plan of CEI and the Company’s nonqualified Savings Plus and Executive Savings Plus Restoration Plans, whereby the Company matches 50% of employee contributions up to a maximum 6% of the employee’s eligible compensation. The Company’s expense under these plans was $2.8 million and $3.2 million for the six months ended June 30, 2011 and 2012, respectively. Amounts payable under the restoration plans represent general obligations of the Company.
Also, the Company provides eligible employees the opportunity to defer a percentage of annual compensation under the Company’s Savings Plus and the Executive Savings Plus Restoration Plans. The Company matches 50% of employee contributions up to a maximum 6% of the employee’s eligible compensation, reduced by the amount matched by the Company under the CEI 401(k) plan. Amounts payable under these plans represent unsecured general obligations of the Company, and the Company recorded $0.3 million and $0.4 million of expense related to these plans during the six months ended June 30, 2011 and 2012, respectively.
10. LONG-TERM INCENTIVE COMPENSATION
Long-term Incentive Compensation Expense—The Company’s long-term incentive plan (the “LTIP”) provides opportunities for employees and certain others to participate in the appreciation in the equity value of the Company or awards based on Company performance. Since the inception of the LTIP, the Company has granted various types of cash and stock-based awards to management-level employees on a discretionary basis.
F-46
Table of Contents
Long-term incentive compensation is included within operations, sales and marketing and general and administrative expenses in the condensed consolidated statements of income. Total recorded long-term incentive compensation expense was as follows:
| Six Months Ended June 30, |
||||||||
| 2011 | 2012 | |||||||
| Stock options and restricted stock |
$ | 931 | $ | 3,874 | ||||
| Stock appreciation rights |
38 | 1,307 | ||||||
|
|
|
|
|
|||||
| Stock-based subtotal |
969 | 5,181 | ||||||
| Performance Plan and other |
7,552 | 2,058 | ||||||
|
|
|
|
|
|||||
| Total long-term incentive compensation |
$ | 8,521 | $ | 7,239 | ||||
|
|
|
|
|
|||||
The LTIP permits the grant of nonqualified and incentive stock options, stock appreciation rights and restricted stock awards.
Stock Options—The Company maintains a stock option plan under which options are granted to purchase shares of the Company’s Class A common stock.
Persons earning the right to receive stock options are determined by the Compensation Committee, which is a subset of the Company’s Board of Directors. The options currently outstanding are generally exercisable at the end of the appreciation period, which is December 31, 2015. Half of the stock options granted are based on a time of service requirement, while the remaining half are based on the achievement of certain performance criteria. Stock option awards granted in 2011 vest 60% at December 31, 2013, 80% at December 31, 2014, and 100% at December 31, 2015; awards granted in 2012 vest 100% at December 31, 2015. In the event of a public offering of the Company’s stock prior to December 31, 2015, the options will vest 20% per year (the performance period for the 2012 awards is five years) and, once vested, the options granted in 2011 are exercisable during the 10-year period ended December 31, 2020, while the options granted in 2012 are exercisable within one year.
The options are net-settled in shares of the Company’s Class A common stock. The following is a reconciliation of options outstanding (number of options and aggregate intrinsic values in thousands):
| Options | Weighted- Average Exercise Price |
Weighted- Average Remaining Contractual Term (in years) |
Aggregate Intrinsic Value |
|||||||||||||
| Outstanding at December 31, 2011 |
3,842 | $ | 15.00 | 4.0 | $ | 19,065 | ||||||||||
| Granted |
1,182 | 19.96 | 3.5 | — | ||||||||||||
| Exercised |
— | — | — | — | ||||||||||||
| Forfeited/expired |
(220 | ) | 15.00 | — | (1,091 | ) | ||||||||||
|
|
|
|
|
|
|
|
|
|||||||||
| Outstanding at June 30, 2012 |
4,804 | $ | 16.22 | 3.5 | $ | 17,974 | ||||||||||
|
|
|
|
|
|
|
|
|
|||||||||
F-47
Table of Contents
Of the 4.8 million options outstanding at June 30, 2012, 4.4 million are expected to vest. The fair value of each option grant is estimated using the Black-Scholes pricing model. The weighted-average assumptions used and the calculated weighted-average fair value of the options granted in 2012 are as follows:
| Expected dividend yield |
0% | |||
| Risk-free interest rate |
0.8% | |||
| Expected life in years |
4.7 | |||
| Expected volatility |
51.8% | |||
| Weighted-average fair value of options granted |
$8.69 |
Expected volatilities are based on the median of the Company’s publicly traded peer companies’ most recent historical volatility commensurate with the expected life. The expected dividend yield is 0% since the Company does not plan to offer regular dividends. The risk-free interest rate is based on the yield at the date of grant of a U.S. Treasury security with a maturity period approximating the expected term. The expected life represents an estimate of the period of time options are expected to remain outstanding and reflects the vesting schedule of the options. The contractual and expected life of the options would increase if the Company were to pursue a public offering of its stock.
Restricted Stock Awards—The Company granted approximately 32,600 shares of restricted stock with a grant-date fair value of $15.00 per share and approximately 6,000 shares of restricted stock with a grant-date fair value of $19.96 per share in 2011 and the six months ended June 30, 2012, respectively. The 2011 awards vest 100% on December 31, 2013, while the 2012 awards vest 100% in June 2013. All such awards remained outstanding at June 30, 2012.
Stock Appreciation Rights—The Company granted stock appreciation rights that entitle the holder to receive a cash payment based upon the appreciation in the fair value of the Company’s stock. Employee awards granted in 2011 vest 60%, 80%, and 100% on the third, fourth, and fifth anniversaries, respectively, of the grant dates. Vested awards become payable on the earlier of the fifth anniversary of the grant date or date of termination. Employee awards granted in 2012 vest 100% at December 31, 2016. In the event of a public offering of the Company’s stock prior to the 100% vesting date, the stock appreciation rights will vest 20% per year and become payable in shares of Class A stock instead of cash.
The Company has recognized compensation expense for stock-based awards to be settled in cash based on estimates of the amount expected to be paid upon eventual settlement of the award. The Company previously determined interim estimates of these payments using the intrinsic value of the award as determined at each reporting period. Effective June 15, 2012, pursuant to filing a registration statement on Form S-1 with the SEC and in accordance with Accounting Standards Codification (“ASC”) 718, the Company changed its policy such that interim estimates of compensation expense are determined based upon the fair value of these awards as of each reporting date prior to settlement. This change in accounting principle, which resulted in an immaterial increase in expense during the six months ended June 30, 2012 versus application of the intrinsic value method, will be prospectively applied because retrospective application would require estimates of a prior period, which, due to hindsight, may vary significantly from estimates that were made contemporaneously in those periods.
F-48
Table of Contents
The following is a summary of stock appreciation rights activity (number of rights and aggregate intrinsic values in thousands):
| Stock Appreciation Rights |
Weighted- Average Exercise Price |
Weighted- Average Remaining Contractual Term (in years) |
Aggregate Intrinsic Value |
|||||||||||||
| Outstanding at December 31, 2011 |
715 | $ | 15.00 | 4.0 | $ | 3,547 | ||||||||||
| Granted |
516 | 19.96 | 4.5 | — | ||||||||||||
| Exercised |
— | — | — | — | ||||||||||||
| Forfeited/expired |
(20 | ) | 15.00 | — | (100 | ) | ||||||||||
|
|
|
|
|
|
|
|
|
|||||||||
| Outstanding at June 30, 2012 |
1,211 | $ | 17.11 | 3.9 | $ | 3,447 | ||||||||||
|
|
|
|
|
|
|
|
|
|||||||||
The fair value of each stock appreciation right grant is estimated using the Black-Scholes pricing model. The weighted-average assumptions used and the calculated weighted-average fair value of the 2011 and 2012 stock appreciation rights are as follows:
| 2011 | 2012 | |||||||
| Expected dividend yield |
0 | % | 0 | % | ||||
| Risk-free interest rate |
0.5 | % | 0.6 | % | ||||
| Expected life in years |
3.5 | 4.5 | ||||||
| Expected volatility |
42.8 | % | 51.8 | % | ||||
| Weighted-average fair value of stock appreciation rights granted |
$ | 8.36 | $ | 8.50 | ||||
Expected volatilities are based on the median of the Company’s publicly traded peer companies’ most recent historical volatility commensurate with the expected life. The expected dividend yield is 0% since the Company does not plan to offer regular dividends. The risk-free interest rate is based on the yield at the date of grant of a U.S. Treasury security with a maturity period approximating the expected term. The expected life represents an estimate of the period of time stock appreciation rights are expected to remain outstanding and reflects the vesting schedule of the stock appreciation rights. The contractual and expected life of the stock appreciation rights would increase if the Company were to pursue a public offering of its stock.
Performance Plan—In 2009 and 2010, the Company granted performance awards under the LTIP to executives and key employees that entitle the recipient to a cash payment generally based on growth in the Company’s cash flows and debt reduction over a three-year period. Awards vest 40% and 100% on the second and third anniversaries, respectively, of the grant date. Similar to the stock appreciation rights awards, certain executives are permitted to settle 15%–60% of the value of their awards through issuance of Class A stock. As of December 31, 2011 and June 30, 2012, amounts accrued for performance awards were $48.1 million and $15.8 million, respectively, of which $6.3 million was vested at June 30, 2012.
As discussed in Note 1, effective upon the merger of MergerSub with and into ATC in June 2012, any future stock settlement of long-term incentive compensation awards will be through the issuance of shares of Class A common stock of ATG.
11. SEGMENT INFORMATION
The Company operates in two reportable segments, defined as digital media and software solutions. The Company’s chief operating decision maker (the chief executive officer) evaluates performance and allocates resources based on the key performance measure of segment profit, which is defined as net income before depreciation and amortization, impairment of goodwill, other operating expense, other income (expense) and income tax expense. Other income (expense) and income tax
F-49
Table of Contents
expense are not allocated to individual segments, and the Company does not evaluate performance or allocate resources using segment asset data. All intercompany revenues and operating expenses are eliminated in consolidation and are not reviewed when evaluating segment performance. The accounting policies of the reportable segments are the same as those described in the summary of significant accounting policies in Note 2.
In the digital media segment, revenues are primarily generated via websites operated by ATC and KBB through digital media subscriptions that allow subscribing dealers to list their cars on these websites as well as through display advertising purchased by OEMs, dealers and other brand advertisers. In the software solutions segment, which started in fourth quarter 2010 after the acquisitions of vAuto, CDM and HomeNet and was later augmented with the second quarter 2011 acquisition of VinSolutions, revenues are generated by selling subscriptions to a portfolio of software solutions which help subscribing dealers manage their operations more efficiently. This portfolio includes solutions that address dealer inventory sourcing and management, customer relationship management, marketing tracking and value appraising.
Select financial information by reportable segment for the six months ended June 30, 2011 and 2012 is as follows (in thousands):
| Six Months Ended June 30, 2011 | ||||||||||||
| Digital Media |
Software Solutions |
Consolidated | ||||||||||
| Segment revenues |
$ | 446,753 | $ | 43,212 | $ | 489,965 | ||||||
| Segment operating expenses |
321,384 | 29,445 | 350,829 | |||||||||
|
|
|
|
|
|
|
|||||||
| Segment profit |
$ | 125,369 | $ | 13,767 | 139,136 | |||||||
|
|
|
|
|
|||||||||
| Depreciation and amortization |
61,224 | |||||||||||
| Other operating expense |
6,043 | |||||||||||
|
|
|
|||||||||||
| Income from operations |
71,869 | |||||||||||
| Other expense |
(17,321 | ) | ||||||||||
|
|
|
|||||||||||
| Income before income taxes |
$ | 54,548 | ||||||||||
|
|
|
|||||||||||
| Six Months Ended June 30, 2012 | ||||||||||||
| Digital Media |
Software Solutions |
Consolidated | ||||||||||
| Segment revenues |
$ | 486,103 | $ | 76,988 | $ | 563,091 | ||||||
| Segment operating expenses |
341,746 | 53,181 | 394,927 | |||||||||
|
|
|
|
|
|
|
|||||||
| Segment profit |
$ | 144,357 | $ | 23,807 | 168,164 | |||||||
|
|
|
|
|
|||||||||
| Depreciation and amortization |
63,919 | |||||||||||
| Impairment of goodwill |
11,112 | |||||||||||
| Impairment of intangible assets |
4,544 | |||||||||||
| Other operating expense |
873 | |||||||||||
|
|
|
|||||||||||
| Income from operations |
87,716 | |||||||||||
| Other expense |
(15,969 | ) | ||||||||||
|
|
|
|||||||||||
| Income before income taxes |
$ | 71,747 | ||||||||||
|
|
|
|||||||||||
Substantially all of our revenues were generated in the United States and substantially all of our long-lived assets reside in the United States for all periods presented.
F-50
Table of Contents
12. SUBSEQUENT EVENT
In September 2012, all of the Company’s outstanding stock options and stock appreciation rights were adjusted to reflect the April 2012 dividend to ATC’s then-existing stockholders by adjusting the exercise price and multiplying the number of awards granted to each recipient by 111.5567%. In September 2012, all of the Company’s outstanding stock options and stock appreciation rights were adjusted to reflect its four-for-one stock split by adjusting the exercise price and multiplying the number of awards granted to each recipient by four. Following these adjustments, the aggregate award to each recipient was rounded up to the nearest whole share. The adjustments, which preserved the intrinsic value of the awards, were made in accordance with and as required by the anti-dilution provisions of the Company’s 1999 Long-Term Incentive Plan and as such, will not result in the recognition of incremental compensation expense.
Effective September 30, 2012, the Company’s certificate of incorporation was amended to increase the number of authorized shares of its (i) Class A common stock from 250 million to 500 million and (ii) Class B common stock from 100 million to 200 million, and to effect a four-for-one stock split of its Class A common stock and its Class B common stock. Each holder of record of Class A common stock and Class B common stock on the close of business on the effective date received three additional shares for each share held. Except as otherwise indicated, all share and per share data presented in our financial statements and related notes thereto reflect the impact of the increase in authorized shares and the stock split.
In November 2012, the Company agreed to acquire a 21.8% interest in Bitauto Holdings Limited for $58.5 million, subject to specified closing conditions. Bitauto is a provider of internet content and marketing services for China’s automotive industry. In connection with this investment, the Company entered into an agreement with certain members of Bitauto’s senior management team, whereby the Company agreed to finance their purchase of $6.5 million of Bitauto shares. In exchange, they agreed to issue an aggregate principal amount of $6.5 million senior secured guaranteed exchangeable bonds to the Company. The exchangeable bonds will bear interest at 10% per annum and have a four year term. The Company will account for the investment in Bitauto using the equity method of accounting and has recorded a $6.5 million note receivable for the exchangeable bonds.
* * * * * *
F-51
Table of Contents
To the Stockholder of
Kelley Blue Book Co., Inc. and APJ Holdings Inc.
Irvine, California
We have audited the accompanying combined statements of income and cash flows of Kelley Blue Book Co., Inc. and APJ Holdings Inc. (the “Companies”) for the year ended December 31, 2009 and the period from January 1 to December 14, 2010. These combined financial statements are the responsibility of the Companies’ management. Our responsibility is to express an opinion on these combined financial statements based on our audits.
We conducted our audits in accordance with auditing standards generally accepted in the United States of America. Those standards require that we plan and perform the audit to obtain reasonable assurance about whether the combined financial statements are free of material misstatement. An audit includes consideration of internal control over financial reporting as a basis for designing audit procedures that are appropriate in the circumstances, but not for the purpose of expressing an opinion on the effectiveness of the Companies’ internal control over financial reporting. Accordingly, we express no such opinion. An audit also includes examining, on a test basis, evidence supporting the amounts and disclosures in the combined financial statements, assessing the accounting principles used and significant estimates made by management, as well as evaluating the overall financial statement presentation. We believe that our audits provide a reasonable basis for our opinion.
In our opinion, such combined financial statements present fairly, in all material respects, the results of operations and cash flows of the Companies for the year ended December 31, 2009 and the period from January 1 to December 14, 2010, in conformity with accounting principles generally accepted in the United States of America.
As discussed in Note 7 to the combined financial statements, on December 15, 2010 the outstanding stock of the Companies was acquired by AutoTrader Group, Inc. (“ATG”) resulting in the Companies becoming wholly-owned subsidiaries of ATG.
/s/ Deloitte & Touche LLP
June 15, 2012
F-52
Table of Contents
KELLEY BLUE BOOK CO., INC. and APJ HOLDINGS INC.
COMBINED STATEMENTS OF INCOME
FOR THE YEAR ENDED DECEMBER 31, 2009 AND
THE PERIOD FROM JANUARY 1 TO DECEMBER 14, 2010
(In thousands)
| Year Ended December 31, 2009 |
Period From January 1 To December 14, 2010 |
|||||||
| REVENUES |
$ | 122,774 | $ | 123,948 | ||||
|
|
|
|
|
|||||
| OPERATING EXPENSES: |
||||||||
| Operations |
24,759 | 27,736 | ||||||
| Selling, general and administrative |
66,714 | 85,724 | ||||||
| Depreciation and amortization |
5,987 | 5,049 | ||||||
| Loss (gain) on sale of assets |
51 | (2,325 | ) | |||||
| Legal settlement |
— | 22,944 | ||||||
| Other |
922 | 1,527 | ||||||
|
|
|
|
|
|||||
| Total operating expenses |
98,433 | 140,655 | ||||||
|
|
|
|
|
|||||
| INCOME (LOSS) FROM OPERATIONS |
24,341 | (16,707 | ) | |||||
|
|
|
|
|
|||||
| OTHER INCOME (EXPENSE): |
||||||||
| Interest expense—net |
(750 | ) | (753 | ) | ||||
| Other income—net |
387 | 97 | ||||||
|
|
|
|
|
|||||
| Total other expense |
(363 | ) | (656 | ) | ||||
|
|
|
|
|
|||||
| INCOME (LOSS) BEFORE INCOME TAXES |
23,978 | (17,363 | ) | |||||
| INCOME TAX EXPENSE |
212 | 177 | ||||||
|
|
|
|
|
|||||
| NET INCOME (LOSS) |
$ | 23,766 | $ | (17,540 | ) | |||
|
|
|
|
|
|||||
See notes to combined financial statements.
F-53
Table of Contents
KELLEY BLUE BOOK CO., INC. and APJ HOLDINGS INC.
COMBINED STATEMENTS OF CASH FLOWS
FOR THE YEAR ENDED DECEMBER 31, 2009 AND
THE PERIOD FROM JANUARY 1 TO DECEMBER 14, 2010
(In thousands)
| Year Ended December 31, 2009 |
Period From January 1 To December 14, 2010 |
|||||||
| CASH FLOWS FROM OPERATING ACTIVITIES: |
||||||||
| Net income (loss) |
$ | 23,766 | $ | (17,540 | ) | |||
| Adjustment to reconcile net income (loss) to cash provided by (used in) operating activities: |
||||||||
| Depreciation and amortization |
5,987 | 5,049 | ||||||
| Loss (gain) on the sale of assets |
51 | (2,325 | ) | |||||
| Accrued interest on contributed loans |
708 | 802 | ||||||
| Legal settlement |
— | 22,944 | ||||||
| Changes in assets and liabilities: |
||||||||
| Decrease (increase) in accounts receivable |
1,859 | (1,163 | ) | |||||
| Decrease (increase) in prepaid expenses and other assets |
711 | (596 | ) | |||||
| (Decrease) increase accounts payable, accrued expenses and other liabilities |
(1,821 | ) | 11,048 | |||||
|
|
|
|
|
|||||
| Net cash provided by (used in) operating activities |
31,261 | 18,219 | ||||||
|
|
|
|
|
|||||
| CASH FLOWS FROM INVESTING ACTIVITIES: |
||||||||
| Capital expenditures |
(3,159 | ) | (4,978 | ) | ||||
| Proceeds from sale of assets |
7 | 3,701 | ||||||
|
|
|
|
|
|||||
| Net cash used in investing activities |
(3,152 | ) | (1,277 | ) | ||||
|
|
|
|
|
|||||
| CASH FLOWS FROM FINANCING ACTIVITIES: |
||||||||
| Repayment of debt |
(5,000 | ) | (582 | ) | ||||
| Distributions to shareholders |
(22,500 | ) | (22,000 | ) | ||||
| Other |
— | (87 | ) | |||||
|
|
|
|
|
|||||
| Net cash (used in) provided by financing activities |
(27,500 | ) | (22,669 | ) | ||||
|
|
|
|
|
|||||
| NET INCREASE (DECREASE) IN CASH |
$ | 609 | $ | (5,727 | ) | |||
|
|
|
|
|
|||||
| CASH AND CASH EQUIVALENTS—Beginning of year |
8,046 | 8,655 | ||||||
|
|
|
|
|
|||||
| CASH AND CASH EQUIVALENTS—End of year |
$ | 8,655 | $ | 2,928 | ||||
|
|
|
|
|
|||||
| SIGNIFICANT NON-CASH TRANSACTIONS: |
||||||||
| Contribution of notes payable to shareholders to invested capital |
$ | — | $ | 10,759 | ||||
| Investment in capital leases |
— | 539 | ||||||
| SUPPLEMENTAL DISCLOSURES OF CASH FLOW INFORMATION: |
||||||||
| Cash paid during the period for: |
||||||||
| Interest |
$ | 30 | $ | 8 | ||||
| Taxes |
353 | 328 | ||||||
See notes to combined financial statements.
F-54
Table of Contents
KELLEY BLUE BOOK CO., INC. AND APJ HOLDINGS INC.
NOTES TO COMBINED FINANCIAL STATEMENTS
FOR THE YEAR ENDED DECEMBER 31, 2009 AND THE PERIOD FROM JANUARY 1 TO DECEMBER 14, 2010
1. THE COMPANIES
Kelley Blue Book Co., Inc. (“KBB”) is a vehicle pricing and information provider and marketing partner to the automotive industry. APJ Holdings Inc. (“APJ”) is a holding company that holds the stock of CDM data Inc. and CDM Dealer Services (collectively, “CDM”). CDM has developed proprietary hardware and software technology for the retail automotive industry that streamlines the collection, distribution and management of data on individual vehicles to aid in the marketing and sales process. CDM also provides full-service, on-the-lot vehicle data collection and web management services to its customers.
As discussed in Note 7, all of the outstanding stock of both KBB and APJ (collectively, the “Companies”) were sold and transferred to AutoTrader Group, Inc. (“ATG”) in connection with a single purchase business combination on December 15, 2010. Prior to their acquisition by ATG, the Companies were closely held and commonly controlled by a series of family trusts.
The Companies have no operations outside of the United States.
2. SUMMARY OF SIGNIFICANT ACCOUNTING POLICIES
Basis of Presentation—The accompanying financial statements present the results of operations and cash flows for the Companies on a combined basis for the year ended December 31, 2009 and the period from January 1, 2010 to December 14, 2010 (the date prior to the acquisition of the Companies by ATG). The effects of transactions between the Companies have been eliminated. The accompanying financial statements do not include any effects of applying the acquisition method of accounting from the acquisition of the Companies by ATG.
Use of Estimates—The preparation of financial statements in conformity with accounting principles generally accepted in the United States requires management to make estimates and assumptions that affect the reported amount of assets and liabilities and disclosure of contingent assets and liabilities at the date of the financial statements and the reported amounts of revenues and expenses during the reporting period. Estimates are evaluated based on outside information and experience, as well as other assumptions the Companies believe reasonable under the circumstances. Actual results could differ from those estimates.
Revenue Recognition—The Companies recognize revenue when it is realized (or realizable) and earned which generally occurs when each of the following criteria is met:
| a. | persuasive evidence of an arrangement exists, |
| b. | services have been rendered and delivered, |
| c. | the price to the buyer from the seller is fixed and determinable, and |
| d. | collectability is reasonably assured. |
The Companies’ revenues are derived from multiple sources, as follows:
| Ÿ | KBB’s brand advertising revenues are generated primarily from display advertising insertion orders placed by original equipment manufacturers (“OEMs”) and related advertising associations, in which the Companies typically receive a fee based upon number of impressions, or times that an advertisement appears and is viewed by the users. These |
F-55
Table of Contents
| revenues are recognized based upon delivery of the advertisement and the terms of the agreement, provided that the total amount recognized does not exceed the amount that would be recognized based upon actual impressions delivered. Revenues are presented net of advertising agencies commissions, advertiser discounts, and allowances. |
| Ÿ | KBB’s deferred internet revenue is principally comprised of billings in excess of revenue eligible for recognition relating to advertising agreements and other fees received pursuant to advertising or service agreements in advance of revenue recognition. |
| Ÿ | KBB’s advertising fees are also generated from automotive vendors such as insurance, warranty and finance companies, automotive aftermarket retailers and general advertisers who market their services on or integrate their product with the KBB website. Revenues from such customers are generally derived from advertising and transaction-based fees determined by contractually defined metrics such as total site visitors, specific traffic referrals or transaction leads that originate on KBB’s website and are recognized as the related fees are earned. |
| Ÿ | KBB’s digital media and other revenues are derived from a range of industry or advertising services that are comprised of subscription, or pay for performance services. Subscription sales are generated from monthly, short-term contractual agreements with automobile dealers for leads, advertising, lead generating and software tools. Revenues from these services are recognized when delivered or based upon subscription agreements, ratably over the period in which the service is provided. |
| Ÿ | Revenues from KBB’s software and publications are sold on an annual subscription basis and revenue is recognized on a ratable basis over the service period. |
| Ÿ | Revenues from CDM are generated primarily through the leasing of devices over 12, 24 and 36 month lease terms. The hardware is sold without the right of return with software included that is subject to a license. At the initiation of the lease term, the fair value of the hardware is recognized as revenue with the remaining revenue generally being recognized over the term of the arrangement. |
The Companies do not customarily enter into barter advertising arrangements and thus any revenue related to such arrangements is not material.
Allowance for Doubtful Accounts—The Companies provide an allowance for doubtful accounts and customer credits that is determined by management’s expectations for probable future losses in accounts receivable based primarily on historical experience and other currently available evidence. The Companies recognized $183,000 and $41,000 in probable future losses for the year ended December 31, 2009 and the period from January 1, 2010 to December 14, 2010, respectively.
Concentration of Credit Risk—Financial instruments that potentially subject the Companies to significant concentrations of credit risk consist primarily of accounts receivable. To date, accounts receivable have primarily been derived from fees billed to subscribing OEMs, dealers and industry partners. The Companies generally require no collateral to support customer receivables. The Companies maintain reserves for potential credit losses. Historically, such losses have been within management’s expectations. For all periods presented in the accompanying combined statements of income, the Companies have an advertising agency that represents General Motors Corporation that accounts for greater than 10% of total revenues.
Cash and Cash Equivalents—Cash equivalents include highly liquid assets with original maturities of three months or less.
Property and Equipment—Property and equipment are carried at cost less accumulated depreciation. Depreciation is computed using the straight-line method over estimated useful lives as follows: three to five years for computer equipment and software and five to seven years for other
F-56
Table of Contents
property and equipment. Leasehold improvements are depreciated over the shorter of the asset’s useful life or the life of the applicable lease or contract, ranging from 3 to 27 years. Expenditures for maintenance and repairs are charged to expense as incurred.
Software Development Costs—The Companies capitalize costs of materials, consultants and payroll and payroll-related costs incurred by employees involved in developing internal use computer software. Costs incurred during the preliminary project and post-implementation stages are charged to expense. Software and website development costs are amortized on a straight-line basis over estimated useful lives ranging from three to five years. Software development costs related to software held for resale are capitalized when a product’s technological feasibility has been established by completion of a working model of the product and ending when a product is available for general release to customers.
Advertising and Marketing Costs—Advertising costs are expensed as incurred and totaled approximately $1.2 million and $0.8 million for the year ended December 31, 2009 and the period January 1—December 14, 2010, respectively. The Companies do not incur any significant direct-response advertising costs.
Income Taxes—The Companies have elected S-Corporation status for income tax purposes. As a result, the shareholders are taxed on their proportionate share of the Companies’ taxable income for both federal and state tax purposes. The Companies additionally pay a one and one-half percent state franchise tax on taxable income in its domiciled state and files returns in various other states.
Recent Accounting Pronouncements—In October 2009, the FASB issued guidance on multiple-deliverable revenue arrangements. The main provisions of the guidance address how to separate deliverables and how to measure and allocate arrangement consideration to one or more units of accounting. The amendments are effective for revenue arrangements entered into or materially modified in fiscal years beginning on or after June 15, 2010. The Companies do not believe this guidance will have a material impact on its financial position, results of operations or cash flows.
3. LONG-TERM DEBT
KBB has an $11.0 million revolving credit facility. The facility calls for interest payments on a monthly basis at the bank’s “reference rate” and all outstanding principal is due on demand, but no later than June 1, 2011. The facility is secured by the property and equipment of KBB. The facility also calls for various covenants which have been met by KBB as of December 31, 2009 and December 14, 2010. As of December 31, 2009 and December 14, 2010, KBB had no outstanding borrowings under this revolving credit facility. This revolving credit facility was retired in December 2010 when the outstanding stock of the Companies was acquired by ATG (see Note 7).
APJ has two promissory notes with interest at 8.5% per annum from its shareholders. The first is a demand note of $6.5 million and the second is a demand note of $4.25 million. All outstanding principal and interest is due on both notes on June 30, 2011 and are secured by all of APJ’s assets. Both of the notes allowed for revolving payments of not less than $50,000. As of December 31, 2009, outstanding borrowings on these notes were $10.0 million. In November 2010, the outstanding borrowings of these two notes were satisfied in full through the contribution of the notes, including accrued interest, to invested capital of the shareholders of APJ with a release of further obligations by APJ.
APJ has a promissory note from a company in which the shareholders are majority owners. The promissory note is a demand note with interest based upon a floating reference rate plus three percent. As of December 31, 2009, the outstanding borrowings were $0.5 million with an interest rate of 6.22% per annum. The outstanding borrowings of the note were paid in full in November 2010.
F-57
Table of Contents
4. INCOME TAXES
Income tax expense for the year ended December 31, 2009 and the period January 1— December 14, 2010, is summarized as follows (in thousands):
| Year Ended December 31, 2009 |
Period January 1 – December 14, 2010 |
|||||||
| State: |
||||||||
| Current tax provision |
$ | 244 | $ | 55 | ||||
| Deferred tax provision |
(32 | ) | 122 | |||||
|
|
|
|
|
|||||
| Total income tax expense |
$ | 212 | $ | 177 | ||||
|
|
|
|
|
|||||
Unrecognized tax benefits are immaterial at December 14, 2010 and December 31, 2009. While it is reasonably possible that the amount of unrecognized tax benefits will increase or decrease within the next 12 months due to the settlement of ongoing audits or the lapse of statutes of limitations, the Company does not expect any change in the amount of unrecognized tax benefits to be material to the consolidated financial statements. The Company classifies interest and penalties associated with its unrecognized tax benefits as a component of income tax expense. In 2009 and the period from January 1 to December 31, 2010, any interest expense accrued or liabilities for potential interest recorded were nominal.
5. COMMITMENTS AND CONTINGENCIES
Lease Commitment—In September 2007, KBB entered into a lease agreement for office space in Irvine, California. In January 2008, this agreement was amended to include additional office space. The lease had provisions for increases in annual rent and requires KBB to pay its proportional share of property operating expenses. The lease, as amended, expires in March 2013.
In January 2008, KBB entered into a lease agreement for office space in Troy, Michigan. The lease has provisions for increases in annual rents and requires KBB to pay its proportional share of property utility costs. This lease expires in June 2013.
In August 2004, CDM entered into a lease agreement for office space in Scottsdale, Arizona through August 2009, and the lease was subsequently renewed through December 2011. The lease had provisions for annual rent increases.
As of December 14, 2010, future minimum lease payments under non-cancelable operating leases are as follows (in thousands):
| 2011 |
$ | 2,250 | ||
| 2012 |
1,777 | |||
| 2013 |
1,365 | |||
| Thereafter |
— | |||
|
|
|
|||
| $ | 5,392 | |||
|
|
|
Total rental expense was $1.8 million and $2.0 million for the year ended December 31, 2009 and the period January 1—December 14, 2010, respectively.
F-58
Table of Contents
Other Agreements—
Rental Commitment Receivables—KBB leased a company-owned building to a non-related party. The lease had provisions for rent increases and required the lessee to pay all maintenance, repairs, insurance, property taxes and utilities. This lease was terminated in April 2010, and the building was subsequently sold in July 2010.
Settlement Agreement—KBB had previously entered into a management agreement with Kelley Management Companies (“KMC”) that was terminated in December 1999. In connection with the termination of the management agreement, KMC and KBB entered into a Settlement Agreement whereby it was agreed that upon the occurrence certain “Triggering Events,” including the sale or other disposition of any of KBB’s equity shares to a buyer other than a current shareholder, KBB would pay KMC’s shareholders an amount equal to five percent of the net proceeds received by the shareholders from such event. The sale of substantially all of the Companies’ outstanding stock to ATG on December 15, 2010 (see Note 7) qualified as a “Triggering Event,” as defined in the Settlement Agreement, thereby obligating KBB to pay $22.9 million to KMC’s shareholders. This $22.9 million payment, which was paid subsequent to December 14, 2010, is reflected as legal settlement within the accompanying Combined Statements of Income.
Other Contingencies—
Commitments and Contingencies—The Companies entered into various employment agreements with certain employees. As a part of the agreements, employees terminated without cause were entitled to receive, in a lump sum, six months to two years of severance pay. Any severance paid in connection with these agreements was expensed in the period the severance was paid
The Companies are party to other legal proceedings that are ordinary and incidental to the business. Management does not expect that any of these other currently pending legal proceedings will have a material adverse effect on the Companies’ financial position, results of operations, or cash flows.
Deferred Compensation—KBB entered into deferred compensation agreements with two retired employees. Fixed payments are paid twice monthly and are payable for life. Such costs are based upon the assumed life expectancy of eighty-five.
The following is a summary of the principal maturity under the agreements which have been accrued and reflected in the accounting records as deferred compensation as of December 14, 2010 (in thousands):
| 2010. |
$ | 87 | ||
| 2011 |
93 | |||
| 2012 |
98 | |||
| 2013 |
104 | |||
| 2014 |
111 | |||
| Thereafter |
178 | |||
|
|
|
|||
| $ | 671 | |||
|
|
|
6. EMPLOYEE BENEFITS PLANS
The Companies maintain a qualified cash or deferred compensation plan under section 401(k) of the Internal Revenue Code. Under the plan, employees may elect to defer up to 20% of their salary subject to Internal Revenue Code limitations. The Companies contribute a discretionary matching
F-59
Table of Contents
amount determined annually by management. The Companies provided matching at 25% of employee contributions up to a maximum of 8% of annual compensation subject to federal guidelines. The Companies’ expense under this plan was $0.4 million and $0.6 million for the year ended December 31, 2009 and the period from January 1 to December 14, 2010, respectively.
7. SUBSEQUENT EVENTS
On December 15, 2010, the outstanding stock of the Companies was acquired by ATG in a single purchase business combination transaction that resulted in the Companies becoming wholly-owned subsidiaries of ATG. Expenses of $17.9 million, including employee bonuses of $10.2 million, incurred by the Companies related to this transaction during the period January 1, 2010 to December 14, 2010 are included as a component of selling, general and administrative expenses within the accompanying Combined Statements of Income.
In June 2011, KBB entered into a new lease for additional office space in Irvine. The lease is co-terminus with other leases in which the Companies are headquartered. The lease expires in March 2013.
In May 2011, CDM entered into a new lease agreement commencing in July 2011 for its home office and vacated its previous location with no penalties. The lease is for a two-year period.
The Companies have evaluated events that occurred subsequent to December 14, 2010, for potential recognition and disclosure. Any applicable subsequent events have been evaluated through June 15, 2012, the date the financial statements were available to be issued.
* * * * * *
F-60
Table of Contents
REPORT OF INDEPENDENT AUDITORS
Board of Directors
vAuto, Inc.
We have audited the accompanying statements of income and cash flows of vAuto, Inc. for the period from January 1, 2010 through October 15, 2010. These financial statements are the responsibility of the Company’s management. Our responsibility is to express an opinion on these financial statements based on our audit.
We conducted our audit in accordance with auditing standards generally accepted in the United States of America. Those standards require that we plan and perform the audit to obtain reasonable assurance about whether the financial statements are free of material misstatement. An audit includes examining, on a test basis, evidence supporting the amounts and disclosures in the financial statements. An audit also includes assessing the accounting principles used and significant estimates made by management, as well as evaluating the overall financial statement presentation. We believe that our audit provides a reasonable basis for our opinion.
In our opinion, the financial statements referred to above present fairly, in all material respects, the results of operations and cash flows of vAuto, Inc. for the period from January 1, 2010 through October 15, 2010 in conformity with accounting principles generally accepted in the United States of America.
/s/ Crowe Horwath LLP
Oak Brook, Illinois
May 12, 2011
F-61
Table of Contents
STATEMENT OF INCOME
For the period from January 1, 2010 through October 15, 2010
(Dollar amounts in thousands)
| Sales |
$ | 35,085 | ||
| Cost of sales |
3,569 | |||
|
|
|
|||
| Gross profit |
31,516 | |||
| Operating expenses |
||||
| General and administrative |
14,416 | |||
| Selling and delivery |
2,810 | |||
| Operations |
1,222 | |||
|
|
|
|||
| Total operating expenses |
18,448 | |||
|
|
|
|||
| Operating income |
13,068 | |||
| Interest income |
40 | |||
|
|
|
|||
| Income before income tax provision |
13,108 | |||
| Income tax provision |
6,377 | |||
|
|
|
|||
| Net income |
$ | 6,731 | ||
|
|
|
See accompanying notes to financial statements.
F-62
Table of Contents
STATEMENT OF CASH FLOWS
For the period from January 1, 2010 through October 15, 2010
(Dollar amounts in thousands)
| Cash flows from operating activities |
||||
| Net income |
$ | 6,731 | ||
| Adjustments to reconcile net income to net cash from operating activities |
||||
| Depreciation and amortization |
193 | |||
| Provision for bad debts |
(12 | ) | ||
| Compensation expense related to stock options |
185 | |||
| Excess income tax benefit from stock options |
2,474 | |||
| Deferred income tax provision |
247 | |||
| Change in assets and liabilities |
||||
| Trade accounts receivable |
(1,875 | ) | ||
| Prepaid expenses and other current assets |
183 | |||
| Accrued interest receivable |
40 | |||
| Other long-term assets |
(67 | ) | ||
| Accounts payable |
106 | |||
| Accrued expenses |
(517 | ) | ||
| Accrued wages and other payroll liabilities |
587 | |||
| Deferred revenue |
4,043 | |||
| Other long-term liabilities |
(5 | ) | ||
| Income taxes payable |
(108 | ) | ||
|
|
|
|||
| Net cash from operating activities |
12,205 | |||
| Cash flows from investing activities |
||||
| Additions to property, plant, and equipment, net |
(44 | ) | ||
| Capitalized software |
(166 | ) | ||
| Cash received on stockholder notes receivable |
200 | |||
| Maturities of certificates of deposit |
487 | |||
|
|
|
|||
| Net cash from investing activities |
477 | |||
| Cash flows from financing activities |
||||
| Payment of cash dividends |
(26,984 | ) | ||
| Proceeds from issuance of common stock in conjunction with exercised stock options |
80 | |||
|
|
|
|||
| Net cash from financing activities |
(26,904 | ) | ||
|
|
|
|||
| Net change in cash and cash equivalents |
(14,222 | ) | ||
| Cash and cash equivalents as of beginning of period |
14,880 | |||
|
|
|
|||
| Cash and cash equivalents as of end of period |
$ | 658 | ||
|
|
|
|||
| Supplemental disclosures of cash flow information: |
||||
| Income taxes paid |
$ | 3,824 |
See accompanying notes to financial statements.
F-63
Table of Contents
NOTES TO FINANCIAL STATEMENTS
October 15, 2010
(Dollar amounts in thousands except share data)
NOTE 1—SUMMARY OF SIGNIFICANT ACCOUNTING POLICIES
Nature of Business: vAuto, Inc. (hereinafter referred to as the “Company”) is incorporated in the state of Delaware as a C corporation. The Company provides market-specific competitive information to automotive dealerships. The Company’s product consists of a web interface allowing automotive dealerships to obtain timely market information pertaining to the pre-owned vehicles market to appraise, price, and stock used vehicles more efficiently.
Basis of Presentation: These financial statements intend to reflect the results of operations and cash flows of the Company immediately preceding the event described in Note 8.
Allowance for Doubtful Accounts: Management of the Company estimates the allowance for doubtful accounts based on specific customer circumstances, historical loss experience, and general economic conditions. Specific accounts receivable are charged off when they are considered uncollectible. Management of the Company considers accounts receivable delinquent when payment has not met specific terms.
Revenue Recognition: The Company recognizes revenue in the period web interface subscription services are rendered. Deferred revenue related to initial setup charges is recognized on the balance sheet when the customer subscribes to the Company’s service. Deferred revenue is recognized as revenue on a straight-line basis over one year.
Property, Plant, and Equipment: Property, plant, and equipment are stated at cost less accumulated depreciation. Depreciation is provided by use of the straight-line method over the estimated useful lives of the assets. Leasehold improvements are amortized over the shorter of the lease term or the assets’ useful life. When properties are retired or otherwise disposed of, the appropriate accounts are relieved of cost and accumulated depreciation, and any resulting gain or loss is recognized.
Capitalized Software Cost: The Company accounts for software, website development costs, and hosting arrangements based on the website development activity in relation to the development of its on-demand application service. The Company capitalizes qualifying computer software costs, which are incurred during the application development stage. Costs related to preliminary project activities and post-implementation activities are expensed as incurred. The Company capitalized $166 of costs for the period from January 1, 2010 through October 15, 2010. Amortization expense totaled $104 for the period from January 1, 2010 through October 15, 2010. These capitalized costs are amortized on a straight-line basis over the expected useful life of the software, which is three years.
Letter of Credit: During the year ended December 31, 2008, the Company established an irrevocable letter of credit agreement with a bank for $375 related to an operating lease for office space in Oak Brook, Illinois. The letter of credit agreement expired June 30, 2010, but automatically renews for an additional period of one year without amendment until the final expiration date on June 30, 2013. Under the terms of this agreement, the Company has pledged cash as collateral in accordance with the following schedule:
| March 24, 2008 through March 31, 2011 |
$ | 375 | ||
| April 1, 2011 through March 31, 2012 |
250 | |||
| April 1, 2011 through June 30, 2013 |
125 |
(Continued)
F-64
Table of Contents
vAUTO, INC.
NOTES TO FINANCIAL STATEMENTS
October 15, 2010
(Dollar amounts in thousands except share data)
NOTE 1—SUMMARY OF SIGNIFICANT ACCOUNTING POLICIES (Continued)
Stock-Based Employee Compensation: The Company accounts for its stock-based employee compensation cost using a fair value-based method. Compensation expense of $185 is included as a component of general and administrative expenses for the period from January 1, 2010 through October 15, 2010.
Estimates: The preparation of financial statements in conformity with accounting principles generally accepted in the United States of America requires management of the Company to make estimates and assumptions that affect the reported amounts of assets and liabilities and disclosure of contingent assets and liabilities as of the date of the financial statements and the reported amounts of sales and expenses during the reporting period. Actual results could differ from those estimates. Significant estimates include valuation of trade accounts receivable, deferred revenue, capitalized software, deferred income taxes, and stock-based employee compensation expense.
Sales Tax: The Company records sales net of taxes. Sales tax collected is not included in sales and remittances are not included in expenses. Sales tax collected is recorded as a liability with the liability relieved upon payment.
Income Taxes: Income taxes are accounted for under the asset and liability method. Deferred tax assets and liabilities are recognized for the future tax consequences attributable to differences between the financial statement carrying amounts of existing assets and liabilities and their respective tax bases. Deferred tax assets and liabilities are measured using enacted tax rates expected to apply to taxable income in the periods in which those temporary differences are expected to be recovered or settled. The effect on deferred tax assets and liabilities of a change in tax rates is recognized as a component of income tax expenses in the period that includes the enactment date. A valuation allowance, when necessary, adjusts deferred tax assets to the net amount that is more likely than not to be realized.
The Company recognizes a tax position as a benefit only if it is “more likely than not” that the tax position would be sustained in a tax examination, with a tax examination being presumed to occur. The amount recognized is the largest amount of tax benefit that is greater than 50.0% likely of being realized on examination. For tax positions not meeting the “more likely than not” test, no tax benefit is recorded. No tax benefits have been recorded as of October 15, 2010.
The Company recognizes interest and/or penalties related to income tax matters as a component of general and administrative expenses. The Company recognized and accrued no amounts for interest and penalties as of October 15, 2010 and for the period from January 1, 2010 through October 15, 2010.
The Company’s major tax jurisdictions include the government of the United States of America and the State of Illinois. The tax years from the year ended December 31, 2007 through the year ended December 31, 2009 remain open and subject to examination.
The Company does not expect the total amount of unrecognized tax benefits to significantly change in the next 12 months.
(Continued)
F-65
Table of Contents
vAUTO, INC.
NOTES TO FINANCIAL STATEMENTS
October 15, 2010
(Dollar amounts in thousands except share data)
NOTE 1—SUMMARY OF SIGNIFICANT ACCOUNTING POLICIES (Continued)
Significant Transactions: For the period from January 1, 2010 through October 15, 2010, the Company incurred $3,061 in costs related to the transaction described in Note 8. These costs are included as a component of general and administrative expenses. A substantial portion of these costs are nondeductible for income tax purposes.
Subsequent Events: Management of the Company has evaluated the activities and transactions subsequent to October 15, 2010 to determine the need for any adjustment to and/or disclosures within the financial statements as of October 15, 2010 and for the period from January 1, 2010 through October 15, 2010. Management of the Company has performed its analysis through May 12, 2011, the date the financial statements were available to be issued.
NOTE 2—STOCK OPTIONS
The Company maintains a stock option plan (the “Plan”) under which certain eligible employees have the ability to purchase shares of common stock of the Company with an exercise price designated by the Board of Directors of the Company at issuance. Under the Plan, the Company can grant up to 3,293,697 options for shares of common stock of the Company. The stock options granted under the Plan have vesting based on the passage of time. The options generally vest over a three to five-year period. Vesting of the options is contingent upon the recipient’s continuous employment with the Company, and stock options granted under the Plan expire not more than 10 years from the grant date. During the period from January 1, 2010 to October 15, 2010, the Company accelerated the vesting of options, as permitted under the Plan in contemplation of the event described in Note 8. As a result of the accelerated vesting, compensation expense was increased by $138.
During the period from January 1, 2010 to October 15, 2010, the Company granted 2,000 options at an exercise price of $2.69 per share. The fair value of the options granted was estimated as of the grant date using a Black-Scholes option pricing model using the following assumptions: a risk-free rate of 0.23%, an expected term of 0.5 years, expected dividends of 0.00%, and volatility of 55.00%.
The following summarizes information with respect to the Company’s Plan:
| Options | Weighted Average Exercise Price |
Weighted Average Remaining Contractual Term |
||||||||||
| Outstanding as of January 1, 2010 |
751,045 | $ | 0.17 | 6.81 | ||||||||
| Granted for the period from January 1, 2010 through October 15, 2010 |
2,000 | 2.69 | ||||||||||
| Exercised for the period from January 1, 2010 through October 15, 2010 |
(659,338 | ) | 0.17 | |||||||||
| Forfeited for the period from January 1, 2010 through October 15, 2010 |
(93,707 | ) | 0.24 | |||||||||
|
|
|
|
|
|||||||||
| Outstanding as of October 15, 2010 |
— | $ | — | — | ||||||||
|
|
|
|
|
|
|
|||||||
(Continued)
F-66
Table of Contents
vAUTO, INC.
NOTES TO FINANCIAL STATEMENTS
October 15, 2010
(Dollar amounts in thousands except share data)
NOTE 2—STOCK OPTIONS (Continued)
| Options | Weighted Average Grant Date Fair Value |
|||||||
| Nonvested as of January 1, 2010 |
546,422 | $ | 0.40 | |||||
| Granted for the period from January 1, 2010 through October 15, 2010 |
2,000 | — | ||||||
| Vested for the period from January 1, 2010 through October 15, 2010 |
(454,715 | ) | 0.41 | |||||
| Forfeited for the period from January 1, 2010 through October 15, 2010 |
(93,707 | ) | 0.37 | |||||
|
|
|
|
|
|||||
| Nonvested as of October 15, 2010 |
— | $ | — | |||||
|
|
|
|
|
|||||
As of October 15, 2010, there was no unrecognized compensation cost related to non-vested options granted under the Plan.
NOTE 3—STOCKHOLDERS’ EQUITY TRANSACTIONS
Series A Redeemable Convertible Preferred Stock: During the period from January 1, 2010 through October 15, 2010, holders of the Series A redeemable convertible preferred stock of the Company waived their right to receive accumulated and unpaid dividends, and instead elected to receive a cash dividend on their outstanding shares of the Company as if the shares were converted to common stock of the Company. For the period from January 1, 2010 through October 15, 2010, dividends in the amount of $1.25 per share were paid to the preferred and common stockholders, which aggregated to total dividends paid of $10,831 and $16,153 to the preferred and common stockholders, respectively.
Common Stock: All shares of common stock of the Company have voting rights and are subject to a Stockholders’ Agreement, which includes restrictions on transferability. As of October 15, 2010, 3,293,697 additional shares of common stock of the Company were reserved for issuance upon exercise of outstanding stock options, as discussed above. For the period from January 1, 2010 through October 15, 2010, options to purchase 659,338 shares of common stock of the Company were exercised.
Stockholders’ Agreement: Effective October 15, 2010, the stockholders of the Company elected to amend the Stockholders’ Agreement pursuant to a pending transaction, such that the rights associated with the Series A redeemable convertible preferred stock of the Company have been substantially terminated. See Note 8 for further information.
NOTE 4—RESTRICTED STOCK
On September 7, 2006, the Company entered into restricted stock subscription agreements with three of its employees. The agreements were for 2,662,406 shares of common stock of the Company, which have a $0.01 par value per share. In consideration for these shares of common stock of the Company, three promissory stockholder notes were issued with recourse. The stockholders’ rights in restricted share of common stock of the Company vested at 25.0% on the initial vesting date, as
(Continued)
F-67
Table of Contents
vAUTO, INC.
NOTES TO FINANCIAL STATEMENTS
October 15, 2010
(Dollar amounts in thousands except share data)
NOTE 4—RESTRICTED STOCK (Continued)
defined in the subscription agreement, with the remaining shares of restricted common stock of the Company vesting in equal monthly installments over the 36 months following the initial vesting date, on the first of each month. During period from January 1, 2010 through October 15, 2010, 41,171 shares of the restricted common stock of the Company vested and were converted into common stock of the Company.
NOTE 5—LEASE COMMITMENTS
The Company has operating lease agreements for office space in Oak Brook, Illinois and Austin, Texas.
Total rent expense for the period from January 1, 2010 through October 15, 2010 was $213.
Minimum lease commitments as of October 15, 2010 are as follows:
| 2010 (remainder) |
$ | 44 | ||
| 2011 |
216 | |||
| 2012 |
187 | |||
| 2013 |
95 | |||
|
|
|
|||
| $ | 542 | |||
|
|
|
NOTE 6—INCOME TAXES
The income tax provision for the period from January 1, 2010 through October 15, 2010 consists of the following components:
| Current |
$ | 6,130 | ||
| Deferred |
247 | |||
|
|
|
|||
| Income tax provision |
$ | 6,377 | ||
|
|
|
Income tax expense computed using the federal statutory rates is reconciled to the reported income tax provision for the period from January 1, 2010 to October 15, 2010 as follows:
| Income taxes at the federal statutory rate |
$ | 4,457 | ||
| State taxes, net of federal benefit |
615 | |||
| Permanent differences |
1,003 | |||
| Other |
302 | |||
|
|
|
|||
| Income tax provision |
$ | 6,377 | ||
|
|
|
Permanent differences primarily consist of certain transaction costs that are nondeductible for income tax purposes.
(Continued)
F-68
Table of Contents
vAUTO, INC.
NOTES TO FINANCIAL STATEMENTS
October 15, 2010
(Dollar amounts in thousands except share data)
NOTE 7—CONTINGENCIES
During the year ended December 31, 2009, the Company began a process to register and collect sales tax in states where management of the Company believes they have a responsibility to do so. As part of this registration process, the Company has requested to participate in voluntary disclosure programs to file sales tax returns in certain states for periods open under the statute of limitations. As a result of this process, the Company has included a liability of $378 as a component of accrued expenses as of October 15, 2010.
The Company also began a voluntary disclosure program for income tax returns in states where the Company’s activities are considered to create an income tax filing obligation. The Company believes that years prior to the year ended December 31, 2007 will be limited to franchise taxes and minimum tax levels because of the tax operating losses in prior years.
From time to time, the Company experiences litigation arising in the ordinary course of its business operations. These matters are evaluated for possible exposure by management of the Company and their legal counsel. Management of the Company is not aware of any litigation as of October 15, 2010 that would require accrual in the Company’s balance sheet.
NOTE 8—SUBSEQUENT EVENT
Effective as of the end of the business day on October 15, 2010, the Company sold 100.0% of its outstanding common and Series A redeemable convertible preferred stock of the Company to an unaffiliated entity.
F-69
Table of Contents
Shares
Class A Common Stock
| Goldman, Sachs & Co. |
Morgan Stanley |
| Allen & Company LLC |
Barclays | Citigroup | ||
| Deutsche Bank Securities |
SunTrust Robinson Humphrey |
Wells Fargo Securities | ||
| RBC Capital Markets Raymond James | ||||
| Evercore Partners |
Guggenheim Securities | Mizuho Securities | ||
| Needham & Company |
SMBC Nikko | The Williams Capital Group, L.P. | ||||
You should rely only on the information contained in this prospectus. We have not authorized anyone to provide you with information different from that contained in this prospectus. We are offering to sell, and seeking offers to buy, shares of our Class A common stock only in jurisdictions where offers and sales are permitted. The information contained in this prospectus is accurate only as of the date of this prospectus, regardless of the time of delivery of this prospectus or of any sale of shares of our Class A common stock.
No action is being taken in any jurisdiction outside the United States to permit a public offering of shares of Class A common stock or possession or distribution of this prospectus in that jurisdiction. Persons who come into possession of this prospectus in jurisdictions outside the United States are required to inform themselves about and to observe any restrictions as to this offering and the distribution of this prospectus applicable to that jurisdiction.
Through and including , 2012 (the 25th day after the date of this prospectus), all dealers effecting transactions in these securities, whether or not participating in this offering, may be required to deliver a prospectus. This is in addition to a dealer’s obligation to deliver a prospectus when acting as an underwriter and with respect to an unsold allotment or subscription.
, 2012
Table of Contents
PART II
INFORMATION NOT REQUIRED IN PROSPECTUS
ITEM 13. Other Expenses of Issuance and Distribution.
The expenses, other than underwriting commissions, expected to be incurred by us in connection with the issuance and distribution of the securities being registered under this Registration Statement are estimated to be as follows:
| SEC Registration Fee |
$ | 34,380 | ||
| Financial Industry Regulatory Authority, Inc. Filing Fee |
30,500 | |||
| Exchange Listing Fee |
* | |||
| Printing and Engraving |
* | |||
| Legal Fees and Expenses |
* | |||
| Accounting Fees and Expenses |
* | |||
| Blue Sky Fees and Expenses |
* | |||
| Transfer Agent and Registrar Fees |
* | |||
| Miscellaneous |
* | |||
|
|
|
|||
| Total |
$ | * | ||
|
|
|
| * | To be completed by amendment. |
ITEM 14. Indemnification of Directors and Officers.
The Registrant is governed by the Delaware General Corporation Law, or DGCL. Section 145 of the DGCL provides that a corporation may indemnify any person, including an officer or director, who was or is, or is threatened to be made, a party to any threatened, pending or completed legal action, suit or proceeding, whether civil, criminal, administrative or investigative (other than an action by or in the right of such corporation), by reason of the fact that such person was or is an officer, director, employee or agent of such corporation or is or was serving at the request of such corporation as a director, officer, employee or agent of another corporation or enterprise. The indemnity may include expenses (including attorneys’ fees), judgments, fines and amounts paid in settlement actually and reasonably incurred by such person in connection with such action, suit or proceeding, provided such officer, director, employee or agent acted in good faith and in a manner such person reasonably believed to be in, or not opposed to, the corporation’s best interest and, for criminal proceedings, had no reasonable cause to believe that such person’s conduct was unlawful. A Delaware corporation may indemnify any person, including an officer or director, who was or is, or is threatened to be made, a party to any threatened, pending or contemplated action or suit by or in the right of such corporation, under the same conditions, except that such indemnification is limited to expenses (including attorneys’ fees) actually and reasonably incurred by such person, and except that no indemnification is permitted without judicial approval if such person is adjudged to be liable to such corporation. Where an officer or director of a corporation is successful, on the merits or otherwise, in the defense of any action, suit or proceeding referred to above, or any claim, issue or matter therein, the corporation must indemnify that person against the expenses (including attorneys’ fees) which such officer or director actually and reasonably incurred in connection therewith.
The Registrant’s second amended and restated bylaws authorize the indemnification of its officers and directors, consistent with Section 145 of the Delaware General Corporation Law, as amended. The Registrant intends to enter into indemnification agreements with each of its directors and executive officers. These agreements, among other things, will require the Registrant to indemnify each director and executive officer to the fullest extent permitted by Delaware law, including indemnification of expenses such as attorneys’ fees, judgments, fines and settlement amounts actually
II-1
Table of Contents
and reasonably incurred by the director or executive officer in any action or proceeding, including any action or proceeding by or in right of the Registrant, arising out of the person’s services as a director or executive officer.
Reference is made to Section 102(b)(7) of the DGCL, which enables a corporation in its original certificate of incorporation or an amendment thereto to eliminate or limit the personal liability of a director for violations of the director’s fiduciary duty, except (i) for any breach of the director’s duty of loyalty to the corporation or its stockholders, (ii) for acts or omissions not in good faith or which involve intentional misconduct or a knowing violation of law, (iii) pursuant to Section 174 of the DGCL, which provides for liability of directors for unlawful payments of dividends of unlawful stock purchase or redemptions or (iv) for any transaction from which a director derived an improper personal benefit.
The Registrant expects to maintain standard policies of insurance that provide coverage (i) to its directors and officers against loss rising from claims made by reason of breach of duty or other wrongful act and (ii) to the Registrant with respect to indemnification payments that it may make to such directors and officers.
The proposed form of Underwriting Agreement to be filed as Exhibit 1.1 to this Registration Statement provides for indemnification to the Registrant’s directors and officers by the underwriters against certain liabilities.
ITEM 15. Recent Sales of Unregistered Securities.
On May 29, 2012, the AutoTrader Group, Inc., or the Registrant, a Delaware corporation, was formed, and on June 13, 2012, in accordance with the terms of the Class B common stock of AutoTrader.com, Inc., all such shares of Class B common stock were converted into shares of Class A common stock of AutoTrader.com, Inc. on a share-for-share basis. On June 14, 2012, a wholly-owned subsidiary of the Registrant merged with and into AutoTrader.com, Inc., with AutoTrader.com, Inc. as the surviving corporation and, as a result, AutoTrader.com, Inc. became a wholly owned subsidiary of the Registrant. As part of the merger:
| Ÿ | The Registrant issued 72,118,748 shares of its Class A common stock for 72,118,748 shares of the Class A common stock of AutoTrader.com, Inc. |
| Ÿ | The Registrant issued 121,351,424 shares of its Class B common stock for 121,351,424 shares of the Class C common stock of AutoTrader.com, Inc. |
The foregoing transactions were exempt from registration pursuant to Section 4(2) of the Securities Act, as they were transactions by an issuer that did not involve a public offering of securities.
The following sets forth information regarding all unregistered securities sold by AutoTrader.com, Inc. since June 1, 2009.
The following transactions were exempt from registration pursuant to Rule 701 promulgated under the Securities Act, as offers and sales of securities pursuant to certain compensatory benefit plans and contracts relating to compensation in compliance with Rule 701.
| Ÿ | From March 2011 through May 2012, the Registrant granted options to purchase an aggregate of 5,024,056 shares of Class B common stock to employees, at exercise prices ranging from $15.00 to $19.96 per share. |
| Ÿ | From June 2011 through May 2012, the Registrant granted stock appreciation rights to purchase an aggregate of 1,236,716 shares of Class B common stock to employees, at exercise prices ranging from $15.00 to $19.96 per share, which rights will be settled in Class A common stock upon consummation of the offering. |
II-2
Table of Contents
| Ÿ | From June 1, 2009 to the date of this Registration Statement, the Registrant issued deferred compensation obligations totaling $9,913,245 to employees. |
| Ÿ | From March 2010 through March 2012, the Registrant sold an aggregate of 483,048 shares of its Class A common stock, at purchase prices ranging from $12.08 to $19.96 per share, to certain of its employees and executive officers. |
| Ÿ | From July 2011 through March 2012, the Registrant sold an aggregate of 34,336 shares of its Class A common stock, at purchase prices ranging from $15.00 to $19.96 per share, to an executive officer. |
| Ÿ | In May 2011, the Registrant issued 32,612 shares of restricted Class A common stock valued at $15.00 per share to an executive officer at a purchase price of $14.99 per share. |
| Ÿ | In June 2012, the Registrant issued 6,012 shares of restricted Class A common stock, valued at $19.96 per share, to a newly-appointed director. |
In September 2012, all of the Registrant’s outstanding stock options and stock appreciation rights were adjusted to reflect the April 2012 dividend to ATC’s then-existing stockholders by adjusting the exercise price and multiplying the number of awards granted to each recipient by 111.5567%. In September 2012, all of the Registrant’s outstanding stock options and stock appreciation rights were adjusted to reflect the Registrant’s four-for-one stock split by adjusting the exercise price and multiplying the number of awards granted to each recipient by four. Following these adjustments, the aggregate award to each recipient was rounded up to the nearest whole share. All share and per share data presented in this Registration Statement do not reflect the adjustment to stock options and stock appreciation rights for the impact of the April 2012 dividend.
Effective September 30, 2012, the Registrant’s certificate of incorporation was amended to increase the number of authorized shares of (i) Class A common stock from 250.0 million to 500.0 million and (ii) Class B common stock from 100.0 million to 200.0 million, and to effect a four-for-one stock split of the Registrant’s common stock. Each stockholder of record of the Registrant on the close of business on the effective date received three additional shares of common stock for each share held. All share and per share data presented in this Registration Statement, except where otherwise noted, reflects the impact of the increase in authorized shares and the stock split, as appropriate.
The following transactions were exempt from registration pursuant to Section 4(2) of the Securities Act, as it was a transaction by an issuer that did not involve a public offering of securities.
| Ÿ | In October 2010, in connection with its acquisition of vAuto, the Registrant sold 2,206,844 shares of its Class A common stock and 4,368,928 shares of its Class C common stock to existing holders for $12.78 per share. |
| Ÿ | In December 2010, in connection with its acquisitions of Kelley Blue Book and HomeNet, the Registrant sold 6,100,076 shares of its Class A common stock and 12,101,696 shares of its Class C common stock to then-existing holders for $12.78 per share. |
None of the foregoing transactions involved any underwriters, underwriting discounts or commissions, or any public offering. The recipients of securities in such transactions represented their intention to acquire the securities for investment only and not with a view to or for sale in connection with any distribution thereof, and appropriate legends were affixed to the share certificates and instruments issued in such transactions.
II-3
Table of Contents
ITEM 16. Exhibits and Financial Statement Schedules
(a) Exhibits
| Exhibit |
Description of Exhibits | |
| 1.1 | Form of Underwriting Agreement. | |
| 2.1* | Stock Purchase Agreement, dated May 5, 2010, by and among AutoTrader.com, Inc., Providence Equity Partners VI, L.P., Providence Equity Partners VI-A, L.P., Cox Auto Trader, L.L.C., KPCB Holdings, Inc. and other sellers named therein. | |
| 3.1* | Second Amended and Restated Certificate of Incorporation of AutoTrader Group, Inc. | |
| 3.2† | First Amendment to the Second Amended and Restated Certificate of Incorporation of AutoTrader Group, Inc. | |
| 3.3† | Second Amended and Restated Bylaws of AutoTrader Group, Inc. | |
| 4.1 | Form of Class A Common Stock Certificate. | |
| 4.2* | Form of Registration Rights Agreement. | |
| 4.3* | Amended and Restated Stockholders Agreement of AutoTrader.com, Inc., dated June 15, 2010, by and among AutoTrader.com, Inc., Manheim ATC, Inc., Cox Auto Trader, L.L.C., Providence Equity Partners VI, L.P., PEP VI-A AutoTrader AIV L.P., KPCB Holdings, Inc. and the other stockholders named therein. | |
| 4.4* | First Amendment to Amended and Restated Stockholders Agreement of AutoTrader.com, Inc., dated October 14, 2010, by and among AutoTrader.com, Inc., Manheim ATC, Inc. and Providence Equity Partners VI, L.P. | |
| 4.5* | Second Amendment to Amended and Restated Stockholders Agreement of AutoTrader.com, Inc., dated June 14, 2012, by and among AutoTrader.com, Inc., AutoTrader Group Inc., Manheim ATC, Inc. and Providence Equity Partners VI, L.P. | |
| 4.6* | Agreement and Consent, dated June 14, 2012, by and among AutoTrader Group, Inc., Manheim ATC, Inc., Providence Equity Partners VI, L.P. and PEP VI-A AutoTrader AIV L.P. | |
| 4.7* | Amended and Restated Registration Rights Agreement, dated August 20, 1999, by and among AutoTrader.com, LLC, Manheim Auctions, Inc., ADP, Inc., TPI, Inc., LTM Company, L.P., KPCB Holdings, Inc. and ATC Holdings, Inc. | |
| 5.1 | Opinion of Dow Lohnes PLLC. | |
| 10.1* | Credit and Guarantee Agreement, dated as of December 15, 2010, between AutoTrader.com, Inc. and Wells Fargo Bank National Association, as administrative agent and collateral agent. | |
| 10.2* | Amendment No. 1 to Credit and Guarantee Agreement, dated as of June 14, 2011, among AutoTrader.com, Inc., Wells Fargo Securities, LLC, as administrative agent, and Wells Fargo Bank National Association, as administrative agent and collateral agent. | |
| 10.3* | Amendment No. 2 to Credit and Guarantee Agreement, dated as of April 30, 2012, between AutoTrader.com, Inc., Wells Fargo Securities, LLC, as administrative agent, and Wells Fargo Bank National Association, as administrative agent and collateral agent. | |
| 10.4* | Amended and Restated Revolving Promissory Note of Cox Enterprises, Inc. issued to AutoTrader.com, Inc., dated as of December 15, 2010. | |
| 10.5* | Amended and Restated Revolving Promissory Note of AutoTrader.com, Inc. issued to Cox Enterprises, Inc., dated as of December 15, 2010. | |
II-4
Table of Contents
| Exhibit |
Description of Exhibits | |
| 10.6* | Amended and Restated Cash Management Agreement with Revolving Credit Facility, dated as of December 15, 2010, between AutoTrader.com, Inc. and Cox Enterprises, Inc. | |
| 10.7* | Intercompany Services Agreement, dated as of May 4, 2010, between Cox Enterprises, Inc. and AutoTrader.com, Inc. | |
| 10.8* | License Agreement, dated as of September 10, 2006, between TPI Holdings, Inc. and Cox Auto Trader, Inc. | |
| 10.9* | Assignment and Assumption Agreement, dated as of August 31, 2009, between Cox Auto Trader, L.L.C. and AutoTrader.com, Inc. | |
| 10.10* | Assignment and Assumption Agreement, dated as of June 11, 2010, between AutoTrader.com, Inc. and ATC IP License Holdings, LLC. | |
| 10.11* | Sublicense Agreement, dated as of June 11, 2010, between ATC IP License Holdings, LLC and AutoTrader.com, Inc. | |
| 10.12* | Settlement Agreement, dated April 29, 2010, among Trader Publishing Limited, AutoTrader.com, Inc., Portfolio Europe Limited, Manheim Auctions Limited and Digital Vehicle Marketing Limited. | |
| 10.13* | Employment and Non-Competition Agreement, dated as of September 15, 2010, between AutoTrader.com and Keith A. Jezek. | |
| 10.14* | Employment and Non-Competition Agreement, dated as of September 15, 2010, between AutoTrader.com and Dale Pollak. | |
| 10.15* | Amended and Restated Employment Agreement, dated as of October 3, 2011, between AutoTrader.com, Inc. and Chip Perry. | |
| 10.16* | Restrictive Covenant and Confidentiality Agreement, dated as of August 27, 2010, between AutoTrader.com, Inc. and Jared Rowe. | |
| 10.17* | AutoTrader.com 1999 Long-Term Incentive Plan. | |
| 10.18 | AutoTrader Group 2012 Long-Term Incentive Plan. | |
| 10.19 | AutoTrader Group Savings Plus Restoration Plan. | |
| 10.20* | Cox Executive Supplemental Plan, as amended and restated January 1, 2011. | |
| 10.21* | AutoTrader Group, Inc. Restricted Stock Plan for Non-Employee Directors | |
| 10.22* | Lease Agreement, dated as of January 11, 2010, between Perimeter Summit Parcel 3 Limited Partnership and AutoTrader.com, Inc. | |
| 10.23* | First Amendment to Lease Agreement, dated as of June 30, 2010, between Perimeter Summit Parcel 3 Limited Partnership and AutoTrader.com, Inc. | |
| 10.24* | Second Amendment to Lease Agreement, dated as of January 3, 2011, between Perimeter Summit Parcel 3 Limited Partnership and AutoTrader.com, Inc. | |
| 10.25* | Third Amendment to Lease Agreement, dated September 30, 2011, between Perimeter Summit Parcel 3 Limited Partnership and AutoTrader.com, Inc. | |
| 10.26* | Lease Agreement, dated as of September 29, 2004, between The Irvine Company and Kelley Blue Book Co., Inc. | |
| 10.27* | First Amendment to Lease Agreement, dated as of February 21, 2007, between The Irvine Company LLC, formerly The Irvine Company, and Kelley Blue Book Co., Inc. | |
| 10.28* | Second Amendment to Lease Agreement, dated as of January 21, 2008, between The Irvine Company LLC, formerly The Irvine Company, and Kelley Blue Book Co., Inc. | |
II-5
Table of Contents
| Exhibit |
Description of Exhibits | |
| 10.29* | Related Party Agreement effective as of June 14, 2012, by and among AutoTrader Group, Inc., Cox Enterprises, Inc., Cox Digital Exchange, LLC and Manheim, Inc. | |
| 10.30 | Removed and reserved. | |
| 10.31* | Director Nomination Agreement, dated as of June 14, 2012, by and among AutoTrader Group, Inc., Providence Equity Partners VI, L.P. and PEP VI-A AutoTrader AIV L.P. | |
| 10.32* | Director Nomination Agreement, dated as of June 14, 2012, by and among AutoTrader Group, Inc. and Manheim, Inc. | |
| 10.33 | Cross-License Agreement, dated as of June 14, 2012, by and among AutoTrader Group, Inc., Cox Digital Exchange, L.L.C. and Manheim, Inc. | |
| 10.34* | Amendment to Amended and Restated Cash Management Agreement, dated as of June 14, 2012, by and between Cox Enterprises, Inc. and AutoTrader.com, Inc. | |
| 10.35* | Amendment to Intercompany Services Agreement, dated as of June 14, 2012, by and between Cox Enterprises, Inc. and AutoTrader.com, Inc. | |
| 21.1* | List of Subsidiaries of the Registrant. | |
| 23.1† | Consent of Deloitte & Touche, LLP, Independent Registered Public Accounting Firm for AutoTrader Group, Inc. and its subsidiaries. | |
| 23.2† | Consent of Deloitte & Touche, LLP, Independent Registered Public Accounting Firm for Kelley Blue Book Co., Inc. and APJ Holdings Inc. | |
| 23.3† | Consent of Crowe Horwath LLP, Independent Registered Public Accounting Firm for vAuto, Inc. and its subsidiaries. | |
| 23.4* | Consent of KS&R, Inc. | |
| 23.5* | Consent of Millward Brown, Inc. | |
| 23.6* | Consent of R. L. Polk & Co. | |
| 24.1* | Power of Attorney. | |
| * | Previously filed. |
| † | Filed herewith. |
(b) Financial statement schedules.
None.
ITEM 17. Undertakings
The undersigned registrant hereby undertakes to provide to the underwriters at the closing specified in the underwriting agreement, certificates in such denominations and registered in such names as required by the underwriters to permit prompt delivery to each purchaser.
Insofar as indemnification for liabilities arising under the Securities Act of 1933 may be permitted to directors, officers and controlling persons of the registrant pursuant to the provisions referenced in Item 14 of this registration statement, or otherwise, the registrant has been advised that in the opinion of the SEC such indemnification is against public policy as expressed in the Securities Act and is, therefore, unenforceable. In the event that a claim for indemnification against such liabilities (other than the payment by the registrant of expenses incurred or paid by a director, officer, or controlling person of the registrant in the successful defense of any action, suit or proceeding) is asserted by such
II-6
Table of Contents
director, officer or controlling person in connection with the securities being registered hereunder, the registrant will, unless in the opinion of its counsel the matter has been settled by controlling precedent, submit to a court of appropriate jurisdiction the question of whether such indemnification by it is against public policy as expressed in the Securities Act and will be governed by the final adjudication of such issue.
The undersigned registrant hereby undertakes that:
| (1) | For purposes of determining any liability under the Securities Act of 1933, the information omitted from the form of prospectus filed as part of this registration statement in reliance upon Rule 430A and contained in a form of prospectus filed by the registrant pursuant to Rule 424(b)(1) or (4) or 497(h) under the Securities Act shall be deemed to be part of this registration statement as of the time it was declared effective. |
| (2) | For the purpose of determining any liability under the Securities Act of 1933, each post-effective amendment that contains a form of prospectus shall be deemed to be a new registration statement relating to the securities offered therein, and the offering of such securities at that time shall be deemed to be the initial bona fide offering thereof. |
| (3) | For the purpose of determining liability under the Securities Act of 1933 to any purchaser, if the registrant is subject to Rule 430C, each prospectus filed pursuant to Rule 424(b) as part of a registration statement relating to an offering, other than registration statements relying on Rule 430B or other than prospectuses filed in reliance on Rule 430A, shall be deemed to be part of and included in the registration statement as of the date it is first used after effectiveness. Provided, however, that no statement made in a registration statement or prospectus that is part of the registration statement or made in a document incorporated or deemed incorporated by reference into the registration statement or prospectus that is part of the registration statement will, as to a purchaser with a time of contract of sale prior to such first use, supersede or modify any statement that was made in the registration statement or prospectus that was part of the registration statement or made in any such document immediately prior to such date of first use. |
| (4) | For the purpose of determining liability of the registrant under the Securities Act of 1933 to any purchaser in the initial distribution of the securities, the undersigned registrant undertakes that in a primary offering of securities of the undersigned registrant pursuant to this registration statement, regardless of the underwriting method used to sell the securities to the purchaser, if the securities are offered or sold to such purchaser by means of any of the following communications, the undersigned registrant will be a seller to the purchaser and will be considered to offer or sell such securities to such purchaser. |
(a) Any preliminary prospectus or prospectus of the undersigned registrant relating to the offering required to be filed pursuant to Rule 424;
(b) Any free writing prospectus relating to the offering prepared by or on behalf of the undersigned registrant or used or referred to by the undersigned registrant;
(c) The portion of any other free writing prospectus relating to the offering containing material information about the undersigned registrant or its securities provided by or on behalf of the undersigned registrant; and
(d) Any other communication that is an offer in the offering made by the undersigned registrant to the purchaser.
II-7
Table of Contents
SIGNATURES
Pursuant to the requirements of the Securities Act of 1933, as amended, the registrant has duly caused this registration statement to be signed on its behalf by the undersigned, thereunto duly authorized, in the City of Atlanta, State of Georgia, on November 13, 2012.
| AUTOTRADER GROUP, INC. | ||||
| By: |
/s/ Dallas S. Clement | |||
| Name: | Dallas S. Clement | |||
| Title: | Executive Vice President and Chief Financial Officer | |||
Pursuant to the requirements of the Securities Act of 1933, this registration statement has been signed by the following persons in the capacities and on the dates indicated.
| Signature |
Title |
Date | ||
| * Chip Perry |
President, Chief Executive Officer and Director (Principal Executive Officer) |
November 13, 2012 | ||
| /s/ Dallas S. Clement Dallas S. Clement |
Executive Vice President and Chief Financial Officer (Principal Financial Officer) |
November 13, 2012 | ||
| * David B. Amundsen |
Vice President, Finance and Accounting (Principal Accounting Officer) |
November 13, 2012 | ||
| * Albert J. Dobron |
Director | November 13, 2012 | ||
| * Michael J. Dominguez |
Director | November 13, 2012 | ||
| * John M. Dyer |
Director | November 13, 2012 | ||
| * Jimmy W. Hayes |
Director | November 13, 2012 | ||
| * John Olin |
Director | November 13, 2012 | ||
| * James C. Kennedy Jr. |
Director | November 13, 2012 | ||
| * Sanford H. Schwartz |
Director | November 13, 2012 | ||
| * Alexander C. Taylor |
Director | November 13, 2012 | ||
| *By: |
/s/ Dallas S. Clement | |
| Dallas S. Clement Attorney-in-fact | ||
Table of Contents
EXHIBIT INDEX
| Exhibit |
Description of Exhibits | |
| 1.1 | Form of Underwriting Agreement. | |
| 2.1* | Stock Purchase Agreement, dated May 5, 2010, by and among AutoTrader.com, Inc., Providence Equity Partners VI, L.P., Providence Equity Partners VI-A, L.P., Cox Auto Trader, L.L.C., KPCB Holdings, Inc. and other sellers named therein. | |
| 3.1* | Second Amended and Restated Certificate of Incorporation of AutoTrader Group, Inc. | |
| 3.2† | First Amendment to the Second Amended and Restated Certificate of Incorporation of AutoTrader Group, Inc. | |
| 3.3† | Second Amended and Restated Bylaws of AutoTrader Group, Inc. | |
| 4.1 | Form of Class A Common Stock Certificate. | |
| 4.2* | Form of Registration Rights Agreement. | |
| 4.3* | Amended and Restated Stockholders Agreement of AutoTrader.com, Inc., dated June 15, 2010, by and among AutoTrader.com, Inc., Manheim ATC, Inc., Cox Auto Trader, L.L.C., Providence Equity Partners VI, L.P., PEP VI-A AutoTrader AIV L.P., KPCB Holdings, Inc. and the other stockholders named therein. | |
| 4.4* | First Amendment to Amended and Restated Stockholders Agreement of AutoTrader.com, Inc., dated October 14, 2010, by and among AutoTrader.com, Inc., Manheim ATC, Inc. and Providence Equity Partners VI, L.P. | |
| 4.5* | Second Amendment to Amended and Restated Stockholders Agreement of AutoTrader.com, Inc., dated June 14, 2012, by and among AutoTrader.com, Inc., AutoTrader Group Inc., Manheim ATC, Inc. and Providence Equity Partners VI, L.P. | |
| 4.6* | Agreement and Consent, dated June 14, 2012, by and among AutoTrader Group, Inc., Manheim ATC, Inc., Providence Equity Partners VI, L.P. and PEP VI-A AutoTrader AIV L.P. | |
| 4.7* | Amended and Restated Registration Rights Agreement, dated August 20, 1999, by and among AutoTrader.com, LLC, Manheim Auctions, Inc., ADP, Inc., TPI, Inc., LTM Company, L.P., KPCB Holdings, Inc. and ATC Holdings, Inc. | |
| 5.1 | Opinion of Dow Lohnes PLLC. | |
| 10.1* | Credit and Guarantee Agreement, dated as of December 15, 2010, between AutoTrader.com, Inc. and Wells Fargo Bank National Association, as administrative agent and collateral agent. | |
| 10.2* | Amendment No. 1 to Credit and Guarantee Agreement, dated as of June 14, 2011, among AutoTrader.com, Inc., Wells Fargo Securities, LLC, as administrative agent, and Wells Fargo Bank National Association, as administrative agent and collateral agent. | |
| 10.3* | Amendment No. 2 to Credit and Guarantee Agreement, dated as of April 30, 2012, between AutoTrader.com, Inc., Wells Fargo Securities, LLC, as administrative agent, and Wells Fargo Bank National Association, as administrative agent and collateral agent. | |
| 10.4* | Amended and Restated Revolving Promissory Note of Cox Enterprises, Inc. issued to AutoTrader.com, Inc., dated as of December 15, 2010. | |
| 10.5* | Amended and Restated Revolving Promissory Note of AutoTrader.com, Inc. issued to Cox Enterprises, Inc., dated as of December 15, 2010. | |
| 10.6* | Amended and Restated Cash Management Agreement with Revolving Credit Facility, dated as of December 15, 2010, between AutoTrader.com, Inc. and Cox Enterprises, Inc. | |
| 10.7* | Intercompany Services Agreement, dated as of May 4, 2010, between Cox Enterprises, Inc. and AutoTrader.com, Inc. | |
Table of Contents
| Exhibit |
Description of Exhibits | |
| 10.8* | License Agreement, dated as of September 10, 2006, between TPI Holdings, Inc. and Cox Auto Trader, Inc. | |
| 10.9* | Assignment and Assumption Agreement, dated as of August 31, 2009, between Cox Auto Trader, L.L.C. and AutoTrader.com, Inc. | |
| 10.10* | Assignment and Assumption Agreement, dated as of June 11, 2010, between AutoTrader.com, Inc. and ATC IP License Holdings, LLC. | |
| 10.11* | Sublicense Agreement, dated as of June 11, 2010, between ATC IP License Holdings, LLC and AutoTrader.com, Inc. | |
| 10.12* | Settlement Agreement, dated April 29, 2010, among Trader Publishing Limited, AutoTrader.com, Inc., Portfolio Europe Limited, Manheim Auctions Limited and Digital Vehicle Marketing Limited. | |
| 10.13* | Employment and Non-Competition Agreement, dated as of September 15, 2010, between AutoTrader.com and Keith A. Jezek. | |
| 10.14* | Employment and Non-Competition Agreement, dated as of September 15, 2010, between AutoTrader.com and Dale Pollak. | |
| 10.15* | Amended and Restated Employment Agreement, dated as of October 3, 2011, between AutoTrader.com, Inc. and Chip Perry. | |
| 10.16* | Restrictive Covenant and Confidentiality Agreement, dated as of August 27, 2010, between AutoTrader.com, Inc. and Jared Rowe. | |
| 10.17* | AutoTrader.com 1999 Long-Term Incentive Plan. | |
| 10.18 | AutoTrader Group 2012 Long-Term Incentive Plan. | |
| 10.19 | AutoTrader Group Savings Plus Restoration Plan. | |
| 10.20* | Cox Executive Supplemental Plan, as amended and restated January 1, 2011. | |
| 10.21* | AutoTrader Group, Inc. Restricted Stock Plan for Non-Employee Directors | |
| 10.22* | Lease Agreement, dated as of January 11, 2010, between Perimeter Summit Parcel 3 Limited Partnership and AutoTrader.com, Inc. | |
| 10.23* | First Amendment to Lease Agreement, dated as of June 30, 2010, between Perimeter Summit Parcel 3 Limited Partnership and AutoTrader.com, Inc. | |
| 10.24* | Second Amendment to Lease Agreement, dated as of January 3, 2011, between Perimeter Summit Parcel 3 Limited Partnership and AutoTrader.com, Inc. | |
| 10.25* | Third Amendment to Lease Agreement, dated September 30, 2011, between Perimeter Summit Parcel 3 Limited Partnership and AutoTrader.com, Inc. | |
| 10.26* | Lease Agreement, dated as of September 29, 2004, between The Irvine Company and Kelley Blue Book Co., Inc. | |
| 10.27* | First Amendment to Lease Agreement, dated as of February 21, 2007, between The Irvine Company LLC, formerly The Irvine Company, and Kelley Blue Book Co., Inc. | |
| 10.28* | Second Amendment to Lease Agreement, dated as of January 21, 2008, between The Irvine Company LLC, formerly The Irvine Company, and Kelley Blue Book Co., Inc. | |
| 10.29* | Related Party Agreement effective as of June 14, 2012, by and among AutoTrader Group, Inc., Cox Enterprises, Inc., Cox Digital Exchange, LLC and Manheim, Inc. | |
| 10.30 | Removed and reserved. | |
| 10.31* | Director Nomination Agreement, dated as of June 14, 2012, by and among AutoTrader Group, Inc., Providence Equity Partners VI, L.P. and PEP VI-A AutoTrader AIV L.P. | |
Table of Contents
| Exhibit |
Description of Exhibits | |
| 10.32* | Director Nomination Agreement, dated as of June 14, 2012, by and among AutoTrader Group, Inc. and Manheim, Inc. | |
| 10.33 | Cross-License Agreement, dated as of June 14, 2012, by and among AutoTrader Group, Inc., Cox Digital Exchange, L.L.C. and Manheim, Inc. | |
| 10.34* | Amendment to Amended and Restated Cash Management Agreement, dated as of June 14, 2012, by and between Cox Enterprises, Inc., and AutoTrader.com, Inc. | |
| 10.35* | Amendment to Intercompany Services Agreement, dated as of June 14, 2012, by and between Cox Enterprises, Inc. and AutoTrader.com, Inc. | |
| 21.1* | List of Subsidiaries of the Registrant. | |
| 23.1† | Consent of Deloitte & Touche, LLP, Independent Registered Public Accounting Firm for AutoTrader Group, Inc. and its subsidiaries. | |
| 23.2† | Consent of Deloitte & Touche, LLP, Independent Registered Public Accounting Firm for Kelley Blue Book Co., Inc. and APJ Holdings Inc. | |
| 23.3† | Consent of Crowe Horwath LLP, Independent Registered Public Accounting Firm for vAuto, Inc. and its subsidiaries. | |
| 23.4* | Consent of KS&R, Inc. | |
| 23.5* | Consent of Millward Brown, Inc. | |
| 23.6* | Consent of R. L. Polk & Co. | |
| 24.1* | Power of Attorney. | |
| * | Previously filed. |
| † | Filed herewith. |