Attached files
| file | filename |
|---|---|
| 8-K - FORM 8-K - Apollo Global Management, Inc. | d438863d8k.htm |
 Bank of America Merrill Lynch Banking and Financial Services
Conference: Josh Harris –Managing Partner
November 13, 2012
Not
for
distribution
in
whole
or
in
part
without
the
express
consent
of
Apollo
Global
Management,
LLC.
It
should
not
be
assumed
that
investment
made
in
the
future
will
be
profitable
or
will equal the performance of the investments in this
document. Exhibit 99.1 |
 1
1
1
1
Forward Looking Statements and Other Important
Disclosures
This presentation may contain forward looking statements that are
within the meaning of Section 27A of the Securities Act of 1933 and Section 21E of the
Securities Exchange Act of 1934. These statements include, but
are not limited to, discussions related to Apollo Global Management, LLC’s and its subsidiaries’
(collectively “Apollo”) expectations regarding the
performance of its business, its liquidity and capital resources and the other non-historical statements. These
forward-looking statements are based on management’s
beliefs, as well as assumptions made by, and information currently available to, management. When
used
in
this
presentation,
the
words
“believe,”
“anticipate,”
“estimate,”
“expect,”
“intend”
and
similar
expressions
are
intended
to
identify
forward-looking
statements. Although management believes that the expectations
reflected in these forward-looking statements are reasonable, it can give no assurance that
these
expectations
will
prove
to
have
been
correct.
These
statements
are
subject
to
certain
risks,
uncertainties
and
assumptions.
We
believe
these
factors
include
but
are
not
limited
to
those
described
under
the
section
entitled
“Risk
Factors”
in
the
Company’s
Annual
Report
on
Form
10-K
for
the
year
ended
December 31, 2011 filed with the Securities and Exchange Commission
(“SEC”) on March 9, 2012, as such factors may be updated from time to time in our
periodic filings with the SEC, which are accessible on the SEC’s
website at www.sec.gov. These factors should not be construed as exhaustive and should be read
in
conjunction
with
the
other
cautionary
statements
that
are
included
in
this
presentation
in
other
SEC
filings.
We
undertake
no
obligation
to
publicly
update
or
review any forward-looking statements, whether as a result of new
information, future developments or otherwise. “Gross
IRR” of a fund represents the cumulative
investment-related cash flows for all of the investors in the fund on the basis of the actual timing of investment
inflows
and
outflows
(for
unrealized
investment
assuming
disposition
of
the
respective
“as
of”
dates
referenced)
aggregated
on
a
gross
basis
quarterly,
and
the
return
is
annualized
and
compounded
before
management
fees,
carried
interest
and
certain
other
fund
expenses
(including
interest
incurred
by
the
fund
itself)
and measures the returns on the fund’s investments as a whole
without regard to whether all of the returns would, if distributed, be payable to the fund’s
investors.
“Net IRR”
of a fund means the gross IRR applicable to all investors, including
related parties which may not pay fees, net of management fees,
organizational
expenses,
transaction
costs,
and
certain
other
fund
expenses
(including
interest
incurred
by
the
fund
itself)
and
realized
carried
interest
all
offset
to the extent of interest income, and measures returns based on
amounts that, if distributed, would be paid to investors of the fund; to the extent that an Apollo
private
equity
fund
exceeds
all
requirements
detailed
within
the
applicable
fund
agreement,
the
estimated
unrealized
value
is
adjusted
such
that
a
percentage
of
up to 20.0% of the unrealized gain is allocated to the general
partner, thereby reducing the balance attributable to fund investors.
This presentation is for informational purposes only and does not
constitute an offer to sell, or the solicitation of an offer to buy, any security, product, service of
Apollo
as
well
as
any
Apollo
sponsored
investment
fund,
whether
an
existing
or
contemplated
fund
(“Apollo
Fund”),
for
which
an
offer
can
be
made
only
by
such
fund's
Confidential
Private
Placement
Memorandum
and
in
compliance
with
applicable
law.
It should not be assumed that investments made in the future will be
profitable or will equal the performance of investments in this document. |
 2
Apollo Global Management, LLC
Apollo Global Management, LLC is a leading
global alternative investment manager in
private equity, credit and real estate
Ticker (NYSE):
APO
Market Capitalization
(1)
$5.5 billion
Total Assets Under Management
(2)
$110 billion
L12M Dividend Yield
(3)
9.5%
2013E PE Multiple
(4)
4.9x
AUM CAGR (2004 –
9/30/12)
34%
1.
As of November 12, 2012.
2.
As of September 30, 2012.
3.
Based
on
closing
price
on
November
12,
2012
and
LTM
dividends
as
of
and
for
the
period
ended
September
30,
2012.
4.
Based on mean First Call estimate as of November 9, 2012.
|
 3
Agenda
1.
Overview of Apollo
2.
Market Overview
3.
Selected Opportunities Across Apollo’s Integrated Platform
|
 4
Apollo’s Integrated Global Platform
Private Equity
$39bn
AUM
Credit
(2)
$60bn
AUM
Principal Investment Businesses
(1)
Real Estate
$8bn
AUM
Los Angeles
New York
London
Singapore
Frankfurt
Luxembourg
Mumbai
Hong Kong
Houston
Firm Profile
(1)
Founded:
1990
AUM:
$110 bn
Employees:
624
Inv. Prof.:
250
Global Footprint
Investment Approach
Value-oriented
Contrarian
Opportunistic across
market cycles and capital
structures
Integrated platform across
asset classes and
geographies
Deep industry knowledge
1.
As of September 30, 2012.
2.
Includes three funds that are denominated in Euros and translated into
U.S. dollars at an exchange rate of €1.00 to $1.29 as of September 30, 2012. |
 5
Apollo’s Total AUM Has Grown By More Than 10x Over the Last
Decade $495
$6,469
$7,971
$8,129
$2,483
2002
2003
2004
2005
2006
2007
2008
2009
2010
2011
Sept 2012
Unallocated Strategic Account AUM
Real Estate AUM
Capital Markets AUM
Private Equity AUM
1990-2002:
PE Only
Significant Growth and Diversification
($ in millions)
Apollo AUM CAGR: 34%
Total
AUM:
$110
bn
(1)
$8,163
$9,200
$9,765
$18,734
$20,186
$30,237
$29,094
$34,002
$38,799
$35,384
$38,983
$529
$1,557
$2,463
$4,392
$10,533
$15,108
$19,112
$22,283
$31,867
$60,107
1.
AUM as of September 30, 2012 includes the acquisitions of Stone Tower
Capital LLC and its related management companies ($18bn of AUM) and Gulf Stream Asset Management. LLC ($3bn of AUM). |
 6
Secular Tailwinds Favor Alternatives
6
1.
Source: Towers Watson Global Pension Assets Study 2012.
Portfolio Allocations to Alternatives Have
Quadrupled
Since
1995
(1)
49%
51%
41%
46%
37%
39%
5%
12%
20%
0%
10%
20%
30%
40%
50%
60%
1995
2003
2011E
Equities
Alternatives
Fixed Income / Cash
“Cash-strapped US Pension Funds Ditch
Stocks For Alternatives”
—
Reuters (8/18/12)
“Alternatives Becoming Mainstream”
—
Asset Allocation News (7/27/12)
“In Search of Diversification and Alpha,
Investors Seek Alts…”
—
Asset International (6/19/12)
“Alts Poised to Gain Significant Market
Share…”
—
Fundfire (5/7/12) |
 7
Consistent, Simple Strategy
Every strategy across our platform
is about one thing only:
“VALUE”
Note: As of September 30, 2012. Past performance is not indicative of
future results. (1) Apollo creation multiples may incorporate pro
forma or other adjustments based on investment teams’ estimates and/or calculations. “Industry average” is based on S&P LCD data as of September 30, 2012.
Over
the
last
decade
we
have
created
our
investments
at
almost
2
turns
below
the
industry
average
(1) |
 8
(2)
(3)
(5)
(5)
(1)
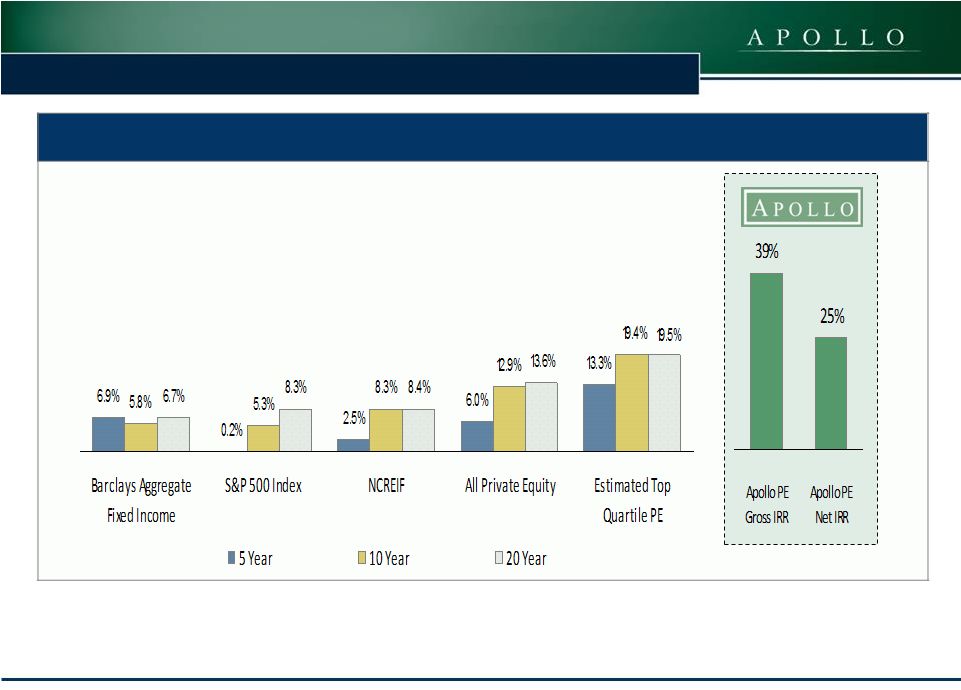
Long Track Record of Success in Private Equity
(1)
(4)
8
Apollo’s Private Equity Funds: 39% Gross & 25% Net IRR Since
Inception Note: Past performance is not indicative nor a
guarantee of future results. See the last page for an “Important Note Regarding the Use of Index Comparisons.” (1) Data as of June 30, 2012. (2) National Council of
Real Estate Investment Fiduciaries (“NCREIF”) as of June 30,
2012. (3) Cambridge Associates LLC U.S. Private Equity Index and Benchmark Statistics, June 30, 2012, the most recent data available. Returns
represent End-to-End Pooled Mean Net to Limited Partners (net
of fees, expenses and carried interest) for all U.S. Private Equity. (4) Cambridge Associates LLC U.S. Private Equity Index and Benchmark Statistics,
June 30, 2012, the most recent data available. Estimated Top Quartile
PE numbers are calculated by taking the 5 year, 10 year and 20 year return metrics as described above and adding the average of the delta
between Top Quartile IRRs and the Pooled Mean Net to Limited Partners
for each vintage year in the selected timeframe. (5) Represents returns of all Apollo Private Equity funds since inception in 1990 through
September 30, 2012.
|
 9
European
Principal Finance
Fund I
Structured Credit:
Structured
Credit
Recovery
Fund
I
(5)
Opportunistic:
Credit
Strategies
Fund
(2,3)
Net IRR Since Inception
Annualized Net Return
Performing US Credit:
Credit
Opportunity
Funds
I
&
II
(1)
Dedicated Europe:
AIE II
(6,8)
& EPF I
(7,8)
Subordinated Credit:
Apollo
Investment
Corporation
(AINV)
(4)
Weighted Average Yield
Net IRR
Note: Past performance is not indicative nor a guarantee of future
results. See second to last slide for a full listing of Apollo’s Credit Funds, which may have different or worse performance than the Funds illustrated on this slide. See last slide for an “Important Note Regarding
the Use of Indices in this Presentation.”
(1) Since inception of COF I & II in April 2008 through
September 30, 2012. (2) Since inception in February 2011 through September 30, 2012 (note February 2011 was a partial month of performance). (3) Track record was
accumulated by the investment committee, of which two members are no
longer at the firm as of June 30, 2012. (4) Weighted average yield as of September 30, 2012, excludes non-accrual and non-yielding equity investments. AINV annualized net NAV return of 4.83% since
inception in 2004 through September 30, 2012. (5) Since inception in
October 2008 through June 30, 2012. Fund is currently liquidating. (6) Net IRR for Apollo Investment Europe II (“AIE II”) from inception in June 2008 through September 30, 2012. Prospective investors
should be aware that AP Investment Europe Limited (“AIE I”),
which was managed from inception through April 2009 by a portfolio manager who is no longer associated or affiliated with Apollo or AIE I, experienced significant losses. AIE I was formed on July 2, 2006 and was
designed to invest in subordinated credit, employing the use of leverage
in these investments. (7) Net IRR for European Principal Finance Fund, L.P. (EPF) from inception in 2007 through June 30, 2012. (8) Fund is denominated in Euros and translated into U.S. dollars at an
exchange rate of €1.00 to $1.29 as of September 30, 2012.
Net IRR
27.2%
11.7%
6.4%
Credit
Opportunity
Fund I
Credit
Opportunity
Fund II
CS Leveraged
Loan Index
24.6%
14.7%
Structured Credit
Recovery Fund I
Merril Lynch High
Yield II Index
10.1%
8.0%
Credit Strategies Fund
Merril Lynch High Yield
II Index
15.5%
5.0%
Apollo
Investment
Europe II
CS Western
European
Leveraged Loan
Index
11.9%
Apollo Investment Corporation (AINV)
EPF
11.2%
Strong Credit Performance Across Asset Classes |
 10
Significant Progress Since Our IPO
10
10
Increased
total AUM by over 55%
from $70 billion to $110 billion
Raised
$11.1 billion
of third party capital across the Apollo platform
Deployed
$5.3 billion
of private equity capital
Distributed $2.01 per share
of cash to our shareholders
Acquired two alternative credit managers
(Stone Tower, Gulf Stream) with
approximately $21 billion of assets under management
Since its IPO in March, 2011, Apollo has continued to execute against
its growth plan |
 11
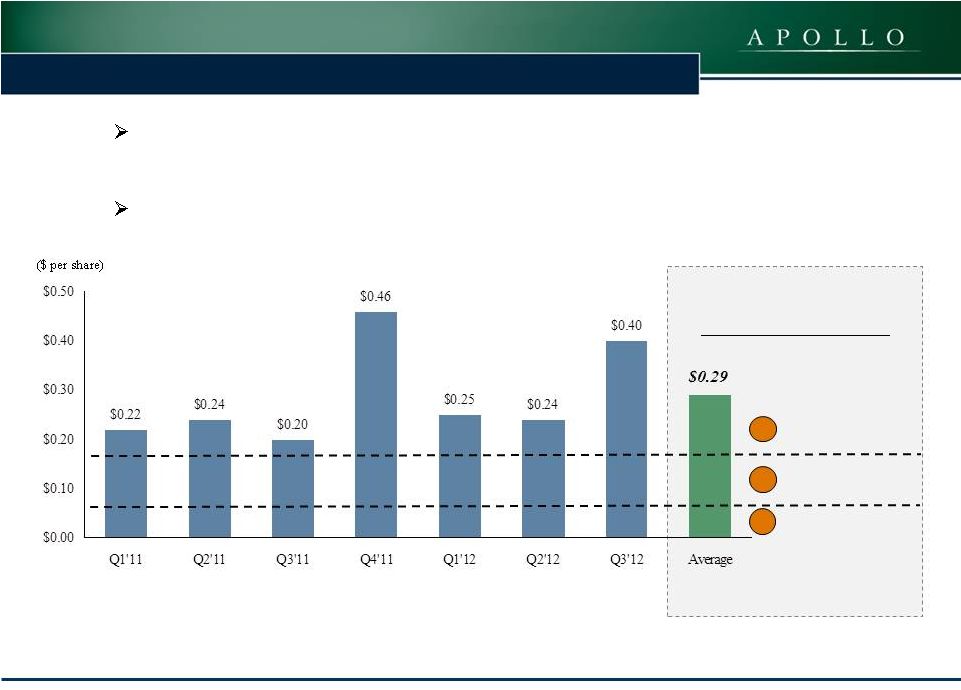
Delivering Cash Distributions to Shareholders
Since the beginning of 2011, Apollo has distributed an average
quarterly cash distribution of $0.29 per share
(1)
Industry-leading
dividend
yield
of
9.5%
versus
4.4%
peer
average
(2)
3
2
1
Average Cash Distribution
Comprises 3 Components
$0.14 from one-
time realizations
$0.08 from interest
and dividends
$0.07 regular
distribution
1.
Past performance is not indicative of future results.
2.
Based on LTM dividend yield for publicly traded alternative asset
managers (BX, KKR, CG, OAK, OZM, FIG) whose yields range from 2.5% to 5.8% based on closing stock prices as of 11/9/12 and LTM dividends
as of and for the quarter ended September 30, 2012.
|
 12
Attractive Growth Strategies
12
12
Scale Existing Businesses
New Product Development
Geographic Expansion
Expand Distribution Channels
Strategic Acquisitions and Alliances
Apollo will continue to identify opportunities to leverage its
existing platform and expand into areas with meaningful
synergies with our core business |
 13
Agenda
1.
Overview of Apollo
2.
Market Overview
3.
Selected Opportunities Across Apollo’s Integrated Platform
|
 14
600
800
1,000
1,200
1,400
1,600
1,800
2,000
2,200
2,400
2,600
2,800
3,000
3,200
Sep-05
Sep-06
Sep-07
Sep-08
Sep-09
Sep-10
Sep-11
Sep-12
0
2,000
4,000
6,000
8,000
10,000
12,000
14,000
16,000
NASDAQ
S&P 500
DOW
(1)
Source: Yahoo Finance. As of September 17, 2012.
(2)
Source: Bloomberg. As of September 13, 2012.
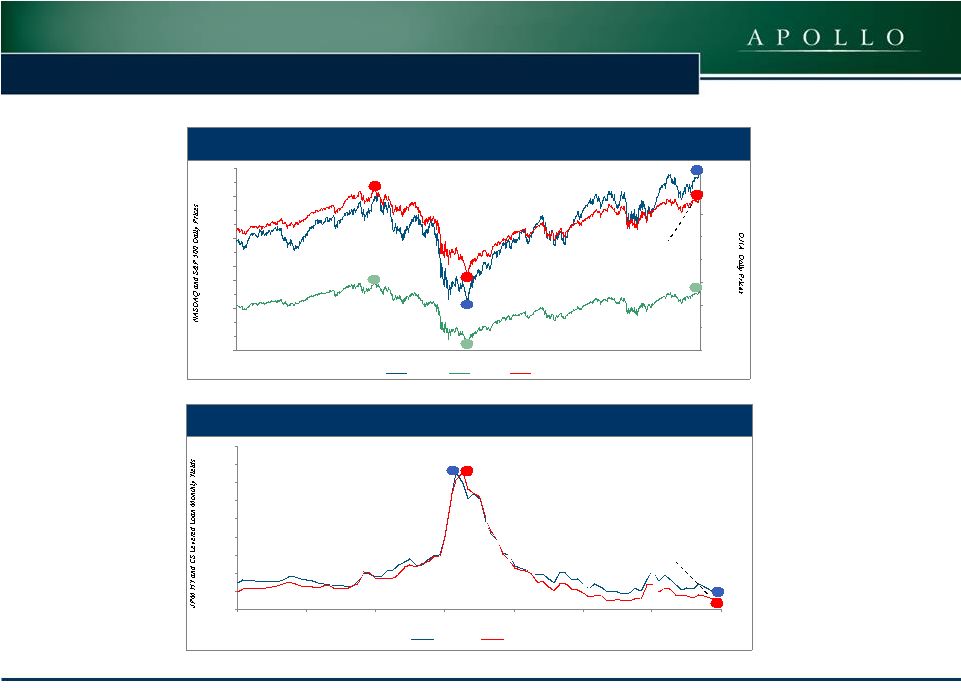
Stock Markets are Close to All-Time Highs;
Levered Credit at All-Time Low Yields
High
Yield
Bond
and
Leveraged
Loan
Yields
NASDAQ,
S&P
500
and
Dow
5%
7%
9%
11%
13%
15%
17%
19%
21%
23%
Sep-05
Sep-06
Sep-07
Sep-08
Sep-09
Sep-10
Sep-11
Sep-12
JPMHY
CSLevLoan
Peak 10/9/07: 1,565.2
Peak 9/14/12: 3,184.0
Trough 3/9/09:
NASDAQ: 1,268.6
S&P: 676.5
Dow: 6,547.1
9/17/12: 1,461.2
Trough 9/13/12:
JPMHY: 6.55%; CSLevLoan: 6.00%
Peak 11/28/2008: 20.15%
Peak 12/31/2008: 20.27%
Peak 10/9/07: 14,164.5
9/17/12: 13,553.1
(2)
(1) |
 15
General Consensus Is That Growth Will Be Muted
United States
Euro Area
Emerging Markets
Sources: Bloomberg and International Monetary Fund. As of November 9,
2012. Developed economies continue to experience low growth
rates, while growth in the emerging markets has softened Forecast
GDP Forecast GDP
Global
Forecast GDP
Forecast GDP
2.7%
1.9%
-0.3%
-3.1%
2.4%
1.8%
2.1%
2.0%
-8%
-6%
-4%
-2%
0%
2%
4%
6%
8%
10%
12%
14%
16%
2006
2007
2008
2009
2010
2011
2012
2013
3.2%
2.9%
0.4%
-4.4%
2.0%
1.4%
-0.5%
0.3%
-8%
-6%
-4%
-2%
0%
2%
4%
6%
8%
10%
12%
14%
16%
2006
2007
2008
2009
2010
2011
2012
2013
-8%
-6%
-4%
-2%
0%
2%
4%
6%
8%
10%
12%
14%
16%
2006
2007
2008
2009
2010
2011
2012
2013
Brazil
Russia
India
China
Developing Asia
4.0%
4.0%
1.5%
-2.4%
4.0%
2.9%
2.2%
2.6%
-8%
-6%
-4%
-2%
0%
2%
4%
6%
8%
10%
12%
14%
16%
2006
2007
2008
2009
2010
2011
2012
2013 |
 16
16
Significant Tail Risk Remains
Bank deleveraging
Fiscal cliff
Geopolitical tension
Europe in crisis
Oil price volatility
Slower growth in China |
 17
17
Source: JPMorgan. FRB, BEA, ECB, Eurostat, BoE, UK Office for
National Statistics, BoJ, Japan Cabinet Office. Monetary Policy is Driving
Global Recovery Efforts U.S.
18%
U.K.
25%
Japan
32%
ECB
33%
•
TARP
•
QE1
•
Fannie/Freddie
•
AIG
•
Bear Stearns
•
EFSF / EU / IMF
Bailout
•
LTRO
•
TWIST
•
MBS Reinvestment
Program
•
QE3
•
TWIST
Extension
•
QE2
Key Monetary Policy Actions:
Global Governments Continue to Print Money to Stimulate Economies
5%
10%
15%
20%
25%
30%
35%
2007
2008
2009
2010
2011
2012 |
 18
-150
-100
-50
0
50
100
150
Jan-09
Jul-09
Jan-10
Jul-10
Jan-11
Jul-11
Jan-12
Jul-12
(1)
Source: Yahoo Finance. As of September 14, 2012.
(2)
Source: Bloomberg. As of August 31, 2012.
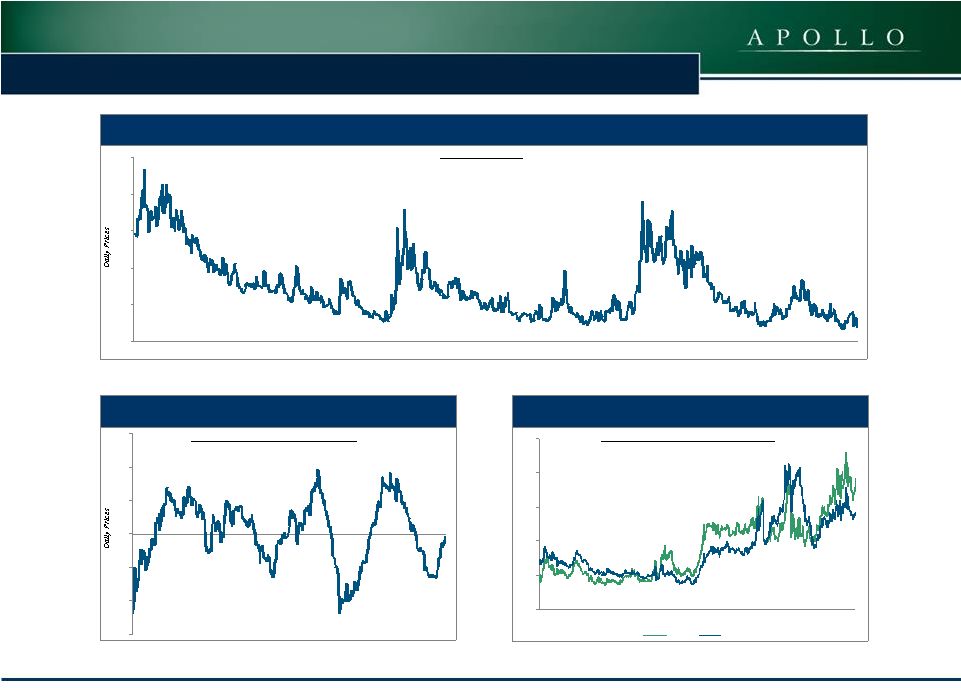
Volatility Comes and Goes…
Citi
U.S.
Economic
Surprise
Index
(2)
VIX
(1)
European
Sovereign
Risk
(2)
Spanish and Italian 10 Yr. Govt. Bond Yields
Standard Deviation of Economic Surprises
Volatility of S&P 500
3%
4%
5%
6%
7%
8%
Jan-09
Jul-09
Jan-10
Jul-10
Jan-11
Jul-11
Jan-12
Jul-12
Spain
Italy
10
20
30
40
50
60
Jan-09
Jul-09
Jan-10
Jul-10
Jan-11
Jul-11
Jan-12
Jul-12 |
 19
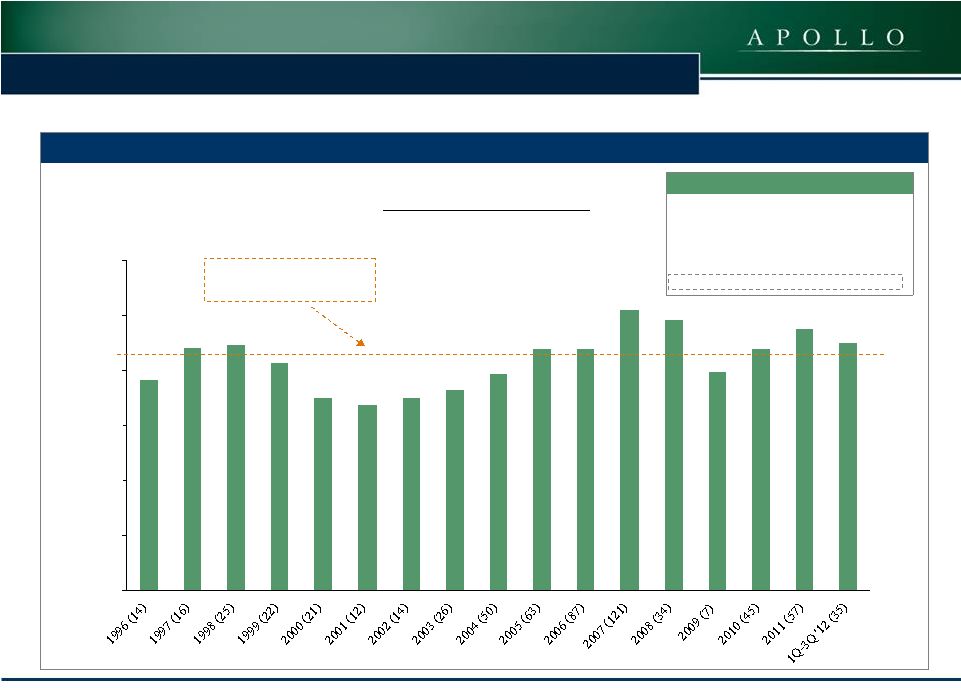
Private Equity Valuations are Fully Priced
Private Equity Valuations Remain High Despite Underlying
Uncertainty 7.7x
8.8x
8.9x
8.3x
7.0x
6.7x
7.0x
7.3x
7.9x
8.8x
8.8x
10.2x
9.8x
8.0x
8.8x
9.5x
9.0x
0x
2x
4x
6x
8x
10x
12x
LBO
Purchase
Price
Multiples
(1)
Transactions over $500 million
Average purchase price:
8.5x
Recent
Transactions
(2)
JDA Software Group
10.5x
Ancestry.com
11.2x
Apex Tool Group
7.1x
Samson
8.0x
EP Energy
5.6x
(1)
Source:
Standard
&
Poor’s
LCD’s
Leveraged
Buyout
Review
–
3Q
12.
(2)
Source: Preqin. Most recent buyout deals announced or closed with
publicly available transaction multiples as of November 1, 2012 as well as Apollo estimates for Samson, EP Energy’s closest comparable transaction. |
 20
Agenda
1.
Overview of Apollo
2.
Market Overview
3.
Selected Opportunities Across Apollo’s Integrated Platform
|
 Apollo PE Fund VI
I
Apollo PE Fund V
Value-Oriented Philosophy
Vintage:
2001
Total Commitments:
$3.7 bn
Apollo
Entry Multiple
Industry Entry
Multiple
Composition
Apollo
Entry Multiple
(1) (3)
Industry Entry
Multiple
Composition
Apollo
Entry Multiple
Industry Entry
Multiple
Vintage:
2006
Total Commitments:
$10.1 bn
Vintage:
2008
Total Commitments:
$14.7 bn
(2)
(2)
(2)
Creation Multiple
Creation Multiple
Creation Multiple
Distressed
27%
Opportunistic
Buyouts
42%
Opportunistic
Buyouts
51%
Distressed
23%
Opportunistic
Buyouts
27%
Distressed
62%
Corporate
Carve-outs
11%
Corporate
Carve-outs
26%
Corporate
Carve-outs
31%
(1)
(1)
6.6x
7.7x
7.7x
9.6x
6.2x
9.0x
Note: As of September 30, 2012. Composition of pie charts is based on
Total Invested Capital as per Apollo’s initial investment strategy at time of acquisition. Distressed investments include Credit and Distressed Buyouts. Past
performance is not indicative of future results.
(1) Creation multiples may incorporate pro forma or other adjustments
based on investment team’s estimates and/or calculations.
(2) Source: S&P LCD database.
(3) Where Fund VI invested in the equity and debt of a portfolio
company, a capital weighted average creation multiple was used.
21
Composition |
 22
Longstanding Expertise in Distressed Investing
As of 9/30/12
$ in millions
# of
Companies
Total Capital
Invested
Total
Value
MOIC
(2)
Gross
IRR
(2)
Apollo’s Distressed Investments Since Inception
Distressed Buyouts (obtained control)
14
$5,059
$14,149
2.8x
28.9%
Did Not Obtain Control
233
$5,954
$7,936
1.3x
73.2%
Total Distressed Investments
247
$11,013
$22,085
2.0x
49.1%
Apollo’s Distressed Investing Expertise
Distressed
Investments
Include
:
(3)
(1)
(1) Private Equity investment examples selected based on
non-performance criteria. Information for Apollo’s distressed investment experience is provided to illustrate the Firm’s experience making distressed investments since the Firm’s inception. While Apollo
believes the performance represents all such distressed investments,
there can be no assurance as to the validity of such methodology or determination. (2) Gross IRRs and MOIC are computed prior to management fees, incentive compensation, certain expenses and
taxes, which, if given effect to, would reduce such returns and, in the
aggregate, are expected to be substantial. Gross IRRs are based on actual cash flows to and from the respective Apollo fund in accordance with the applicable provisions within the partnership
agreement of the relevant Apollo fund, as well as the valuations for
unrealized investments as of September 30, 2012. (3) Contains companies which are not currently held in any Apollo portfolio. (4) Based on dollars invested in non-control and control positions acros
all Apollo private equity funds where MOIC as of June 30, 2012 is
<1.0x, exclusive of unrealized investments where we are actively accumulating positions.
|
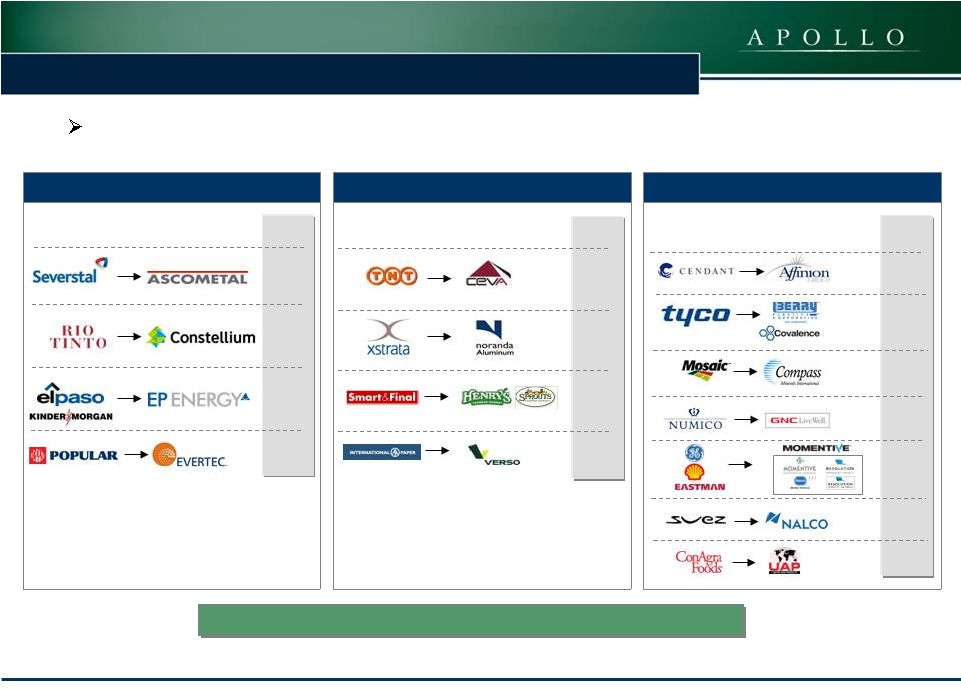 23
Fund VII
Fund VI
Fund V
Apollo is a Market Leader in Corporate Carve-Outs
Apollo has a history of completing complex carve-outs from leading
global corporations, which are designed to achieve mutual
objectives for both parties Creation
Multiple
Creation
Multiple
Creation
Multiple
5.2x
2.9x
5.6x
7.5x
6.7x
4.1x
8.4x
6.5x
7.1x
7.7x
5.0x
5.7x
7.6x
4.8x
Apollo Portfolio
Company
Parent
Company
Apollo Portfolio
Company
Parent
Company
Apollo Portfolio
Company
Parent
Company
Average
Creation
Multiple:
6.1x
(1)
Average
Creation
Multiple:
6.1x
(1)
6.7x
Note: Investment examples selected based on non-performance
criteria. Investment examples are included as they are the “Carve-Outs” that Apollo has previously completed within its private equity Funds VII, VI and V. Past
performance is not indicative of future results. Listed companies
are not representative of all companies recommended for advisory clients. It should not be assumed investment in such companies was or will be profitable. It
contains companies which are not currently held in any Apollo portfolio.
There can be no guarantees that any similar investment opportunities will be available or pursued by Apollo in the future. Creation multiples may
incorporate pro forma or other adjustments based on investment
team’s estimates and/or calculations. (1) Average creation multiple for investment examples in Funds V, VI,
VII represents arithmetic mean. (2) The acquisition of Borden Chemical was a part of the formation of Momentive but not specifically a carve-out.
|
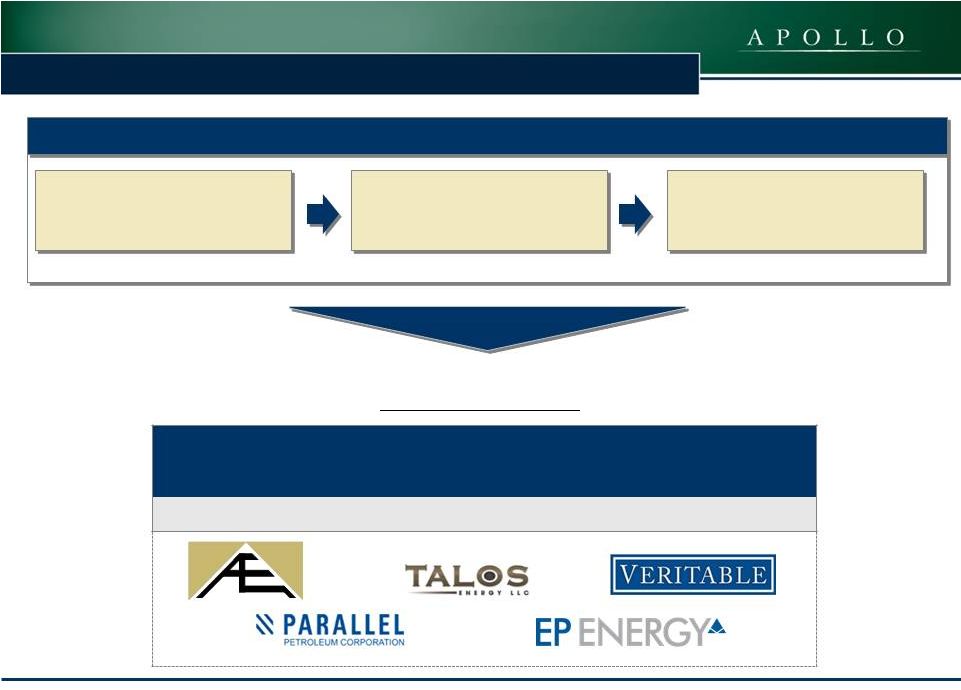 24
24
Opportunistic
Buyouts: Physical Asset Acquisitions
Examples of Apollo’s
Physical Asset Acquisitions:
# of
Companies
Average
Purchase
Multiple
Total Capital
Invested
Average
Life
5
5.4x
$2,186.2
1.4 yrs
Acquire physical assets at
discounts to financial
market prices
Lock-in value arbitrage through
hedging programs
Upside through operational
enhancements at asset level
Benefits of Physical Asset Acquisitions
Note: Examples represent all past investments in natural
resources-related companies made by Apollo within its private equity funds V, VI and VII that are of the respective transaction type (i.e., corporate carve-outs,
distressed investments, build-up and asset acquisitions) and
includes companies which are not currently held in any Apollo portfolio. Apollo believes the categorization of each investment example to be accurate, but
there can be no assurance as to the accuracy of such classifications nor
the methodology with which Apollo made such categorization determinations.
|
 25
Apollo’s Broad Credit Capabilities
(1) As of September 30, 2012.
Performing US
Credit
Structured
Credit
Private
Credit
Opportunistic
Dedicated
Europe
Senior Loans
High Yield
Private Market
Debt
Asia Private Credit
Event Driven
Long/Short Credit
Distressed
Corporate Credit
Sub-
& Non-
Performing Loans
CLOs
RMBS, CMBS, ABS
Multi-Asset
Longevity
Broad platform, adaptable to evolving market conditions and different
risk tolerances Corporate Credit
•$41.3 bn in AUM
(1)
•90 Inv. Professionals
•~900 credits
Structured Credit
•$18.8 bn in AUM
(1)
•45 Inv. Professionals
•~2,650 credits
Broad, Customized Managed Accounts |
 26
26
26
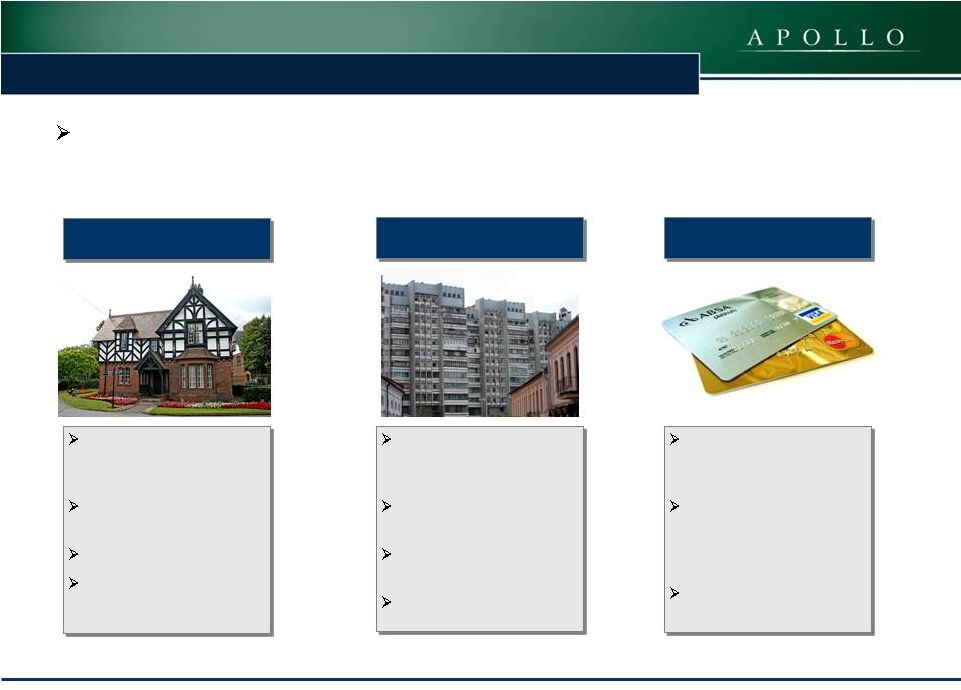
Apollo
leverages
its
integrated
platform
to
pursue
opportunities
that
may
be
less
traditional
and have less competition as a result
–
Select examples include:
Residential Loans
NPLs
Credit Card
Receivables
Portfolio
of
11,000
loans
secured by residential
properties in the U.K.
Average purchase price of
57% of par
Attractive seller financing
Target ~25% gross IRR
€2.4 billion portfolio of
European commercial real
estate loans
Purchase price of less than
€1 billion
Preferred return structure
mitigates downside risk
Target ~30% gross IRR
Irish credit card platform
of major U.S. bank with
250+ employees
Live portfolio with over
200,000 customer accounts
and €650 million of
receivables
Target ~20% gross IRR
Case Study: European Non-Performing & Performing Loans
The target return is based upon estimates and assumptions that a
potential investment will yield a return equal or greater than the target. There can be no assurance that Apollo's projections will be realized or that Apollo will be successful in finding investment
opportunities that meet these anticipated return parameters.
Apollo’s estimate of potential return from a potential investment is not a guarantee as to the quality of the investment or a representation as to the adequacy of Apollo’s methodology for estimating returns.
The target return information is presented gross and does not reflect
the effect of management fees, incentive compensation, certain expenses and taxes.
|
 27 |
 28
Appendix: Capital Markets’
Fund Summary
Apollo / Artus Investors 2007 –
1
2007
Apollo Asia Opportunity Fund
2007
Apollo Asia Private Credit Fund
2012
Apollo Credit Liquidity Fund
2007
Apollo Credit Opportunity Fund I
2008
Apollo Credit Opportunity Fund II
2008
Apollo Senior Loan Fund
2010
Apollo European Principal Finance
2007
Apollo Investment Corporation (NASDAQ: AINV)
2004
AP Investment Europe Limited
(1)
2006
Apollo Investment Europe II
2008
Apollo European Credit Fund
2011
Apollo Residential Mortgage, Inc. (NYSE: AMTG)
2011
Apollo Senior Floating Rate Fund Inc (NYSE: AFT)
2011
Apollo Strategic Value Fund
2006
Apollo Value Investment Fund
2003
Credit Fund
(2)
2005
Credit Strategies Fund
(2)
2011
Structured Credit Recovery Fund I
2008
Structured Credit Recovery Fund II
2012
Credit Solutions Fund
2011
ALM I
2010
ALM III
2010
ALM IV
2011
ALM V
2012
ALM VI
2012
Compass 2002
2002
Compass 2003
(1)
2003
Compass 2004
2004
Compass 2005-I
2005
Compass 2005-II
2006
Compass 2007
2007
Cornerstone CLO
2007
Granite Ventures I
2005
Granite Ventures II
2005
Granite Ventures III
2006
Neptune
2008
Rampart CLO 2006-I
2006
Rampart CLO 2007-I
2007
Rashinban
2006
Sextant 2006
2006
Sextant 2007
2007
Stone Tower CLO
2003
Stone Tower CLO II
(1)
2004
Stone Tower CLO III
2005
Stone Tower CLO IV
2006
Stone Tower CLO V
2006
Stone Tower CLO VI
2007
Stone Tower CLO VII
2007
It should not be assumed that future Capital Markets funds or CLOs will
equal the performance of the funds and CLOs on this list, nor should it be assumed that the past performance of the funds and CLOs on this list are indicative or a guarantee of future performance of such
funds and CLOs. Note that performance information is not being provided
due to potential issues relating to Regulation FD with respect to Apollo Global Management (NYSE:APO). (1) Fund is currently winding down. (2) Track record was accumulated by the investment
committee, of which two members are no longer at the firm as of June 30,
2012. Apollo Fund
Year of Inception |
 29
Risk Factors and Definitions |