Attached files
| file | filename |
|---|---|
| 8-K - 8-K - ASHFORD HOSPITALITY TRUST INC | investorslideshow8-k111212.htm |
torreypinesv4
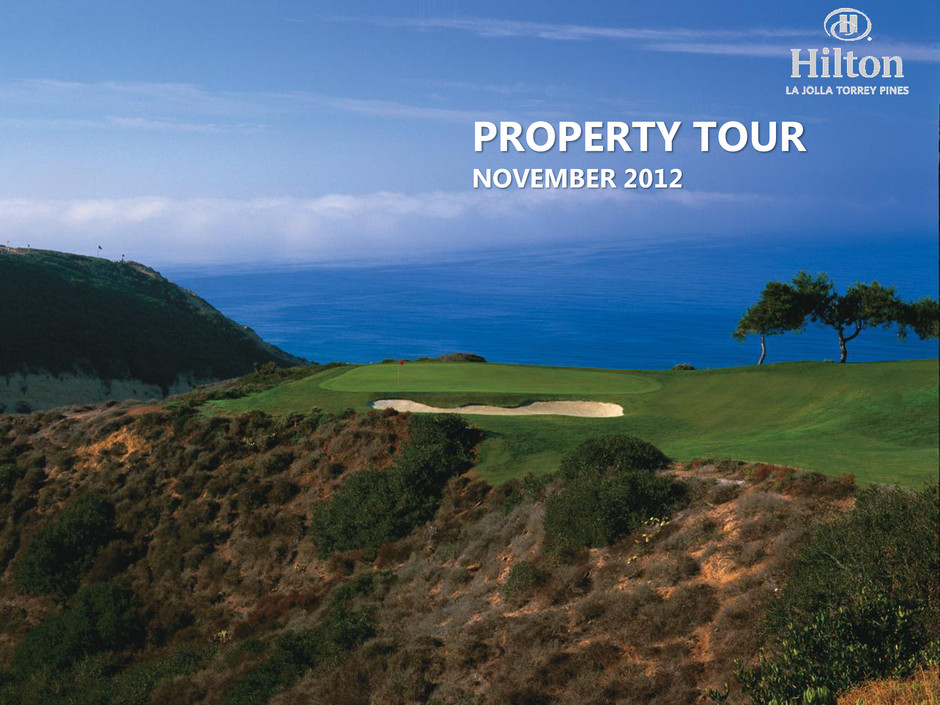
PROPERTY TOUR NOVEMBER 2012
Safe Harbor In keeping with the SEC’s “Safe Harbor” guidelines, certain statements made during this presentation could be considered forward-looking and subject to certain risks and uncertainties that could cause results to differ materially from those projected. When we use the words “will likely result,” “may,” “anticipate,” “estimate,” “should,” “expect,” “believe,” “intend,” or similar expressions, we intend to identify forward-looking statements. Such forward-looking statements include, but are not limited to, our business and investment strategy, our understanding of our competition, current market trends and opportunities, projected operating results, and projected capital expenditures. These forward-looking statements are subject to known and unknown risks and uncertainties, which could cause actual results to differ materially from those anticipated including, without limitation: general volatility of the capital markets and the market price of our common stock; changes in our business or investment strategy; availability, terms and deployment of capital; availability of qualified personnel; changes in our industry and the market in which we operate, interest rates or the general economy, and the degree and nature of our competition. These and other risk factors are more fully discussed in the Company’s filings with the Securities and Exchange Commission. EBITDA is defined as net income before interest, taxes, depreciation and amortization. EBITDA yield is defined as trailing twelve month EBITDA divided by the purchase price. EBITDA, FFO, AFFO, CAD and other terms are non-GAAP measures, reconciliations of which have been provided in prior earnings releases and filings with the SEC. This overview is for informational purposes only and is not an offer to sell, or a solicitation of an offer to buy or sell, any securities of Ashford Hospitality Trust, Inc. and may not be relied upon in connection with the purchase or sale of any such security.
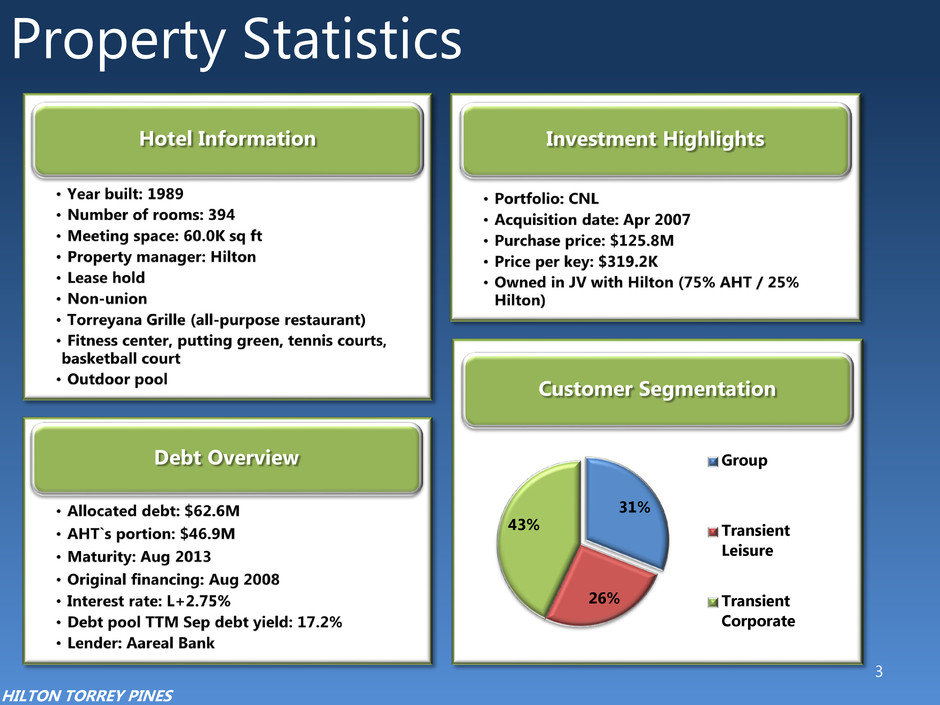
Investment Highlights Property Statistics Debt Overview Customer Segmentation 31% 26% 43% Group Transient Leisure Transient Corporate Hotel Information 3 HILTON TORREY PINES

4 HILTON TORREY PINES Property Pictures
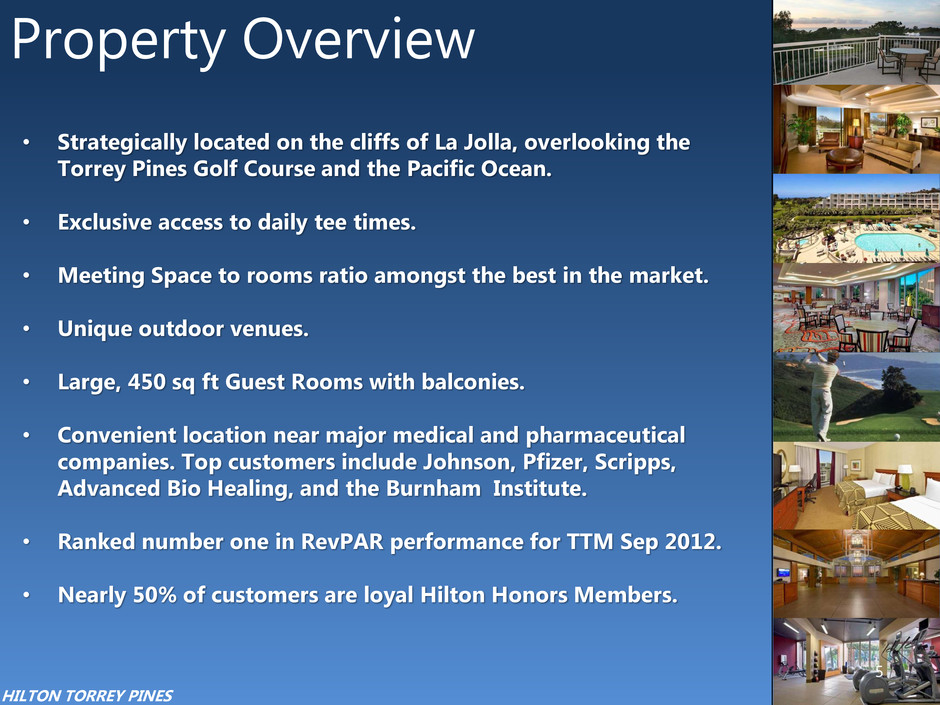
Property Overview • Strategically located on the cliffs of La Jolla, overlooking the Torrey Pines Golf Course and the Pacific Ocean. • Exclusive access to daily tee times. • Meeting Space to rooms ratio amongst the best in the market. • Unique outdoor venues. • Large, 450 sq ft Guest Rooms with balconies. • Convenient location near major medical and pharmaceutical companies. Top customers include Johnson, Pfizer, Scripps, Advanced Bio Healing, and the Burnham Institute. • Ranked number one in RevPAR performance for TTM Sep 2012. • Nearly 50% of customers are loyal Hilton Honors Members. HILTON TORREY PINES 5
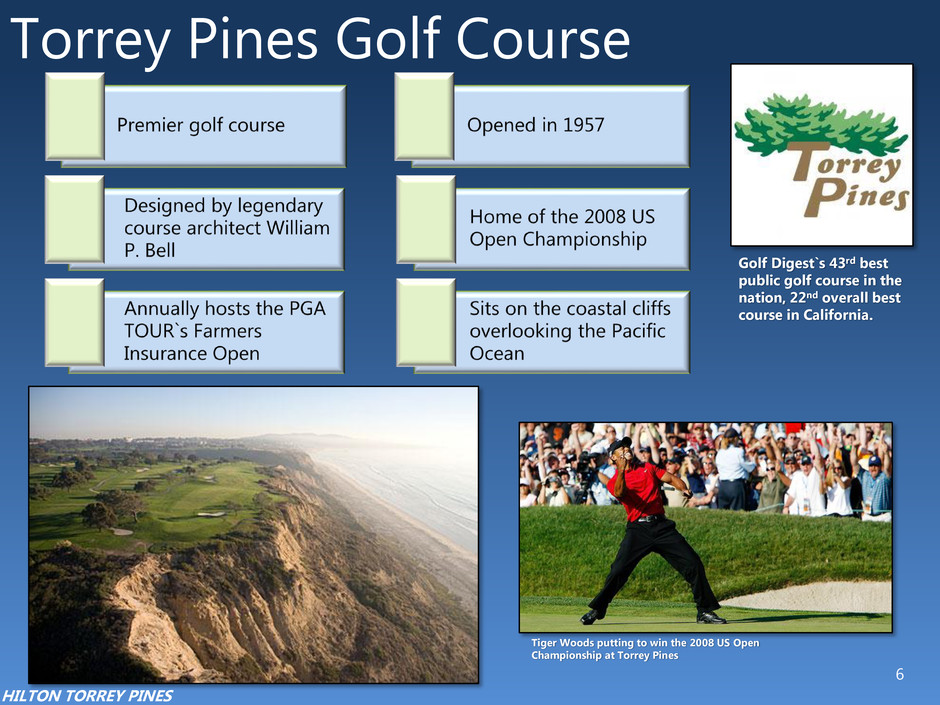
Torrey Pines Golf Course Tiger Woods putting to win the 2008 US Open Championship at Torrey Pines HILTON TORREY PINES 6 Golf Digest`s 43rd best public golf course in the nation, 22nd overall best course in California.

RevPAR: San Diego Market $40 $60 $80 $100 2007 2008 2009 2010 2011 TTM Sep 2012 San Diego Total US HILTON TORREY PINES 7
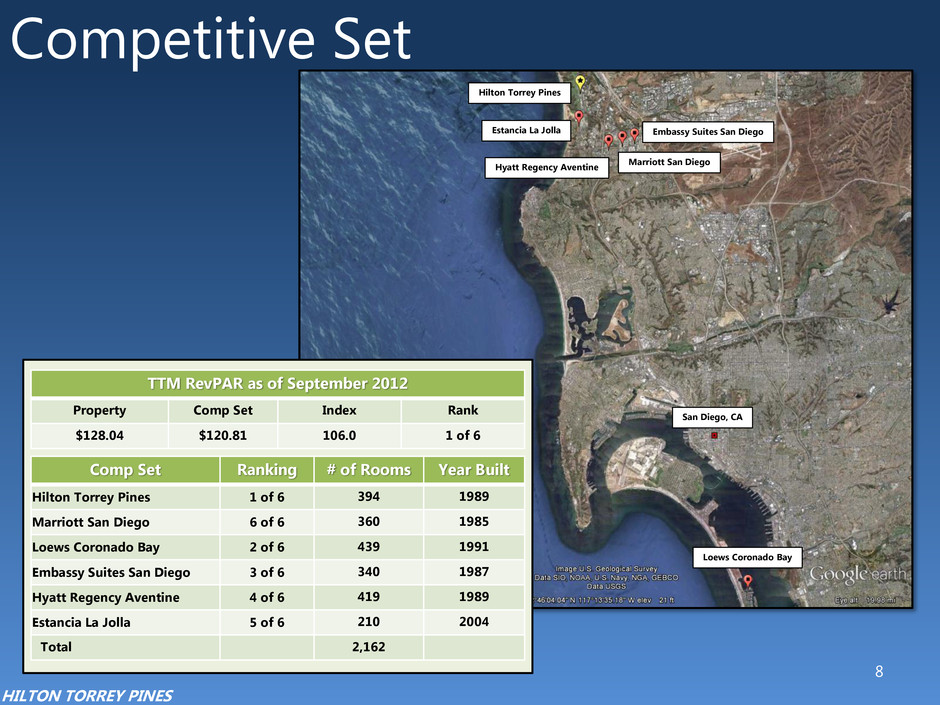
Competitive Set 8 Comp Set Ranking # of Rooms Year Built Hilton Torrey Pines 1 of 6 394 1989 Marriott San Diego 6 of 6 360 1985 Loews Coronado Bay 2 of 6 439 1991 Embassy Suites San Diego 3 of 6 340 1987 Hyatt Regency Aventine 4 of 6 419 1989 Estancia La Jolla 5 of 6 210 2004 Total 2,162 TTM RevPAR as of September 2012 Property Comp Set Index Rank $128.04 $120.81 106.0 1 of 6 HILTON TORREY PINES Hilton Torrey Pines Estancia La Jolla Hyatt Regency Aventine Marriott San Diego Embassy Suites San Diego Loews Coronado Bay San Diego, CA
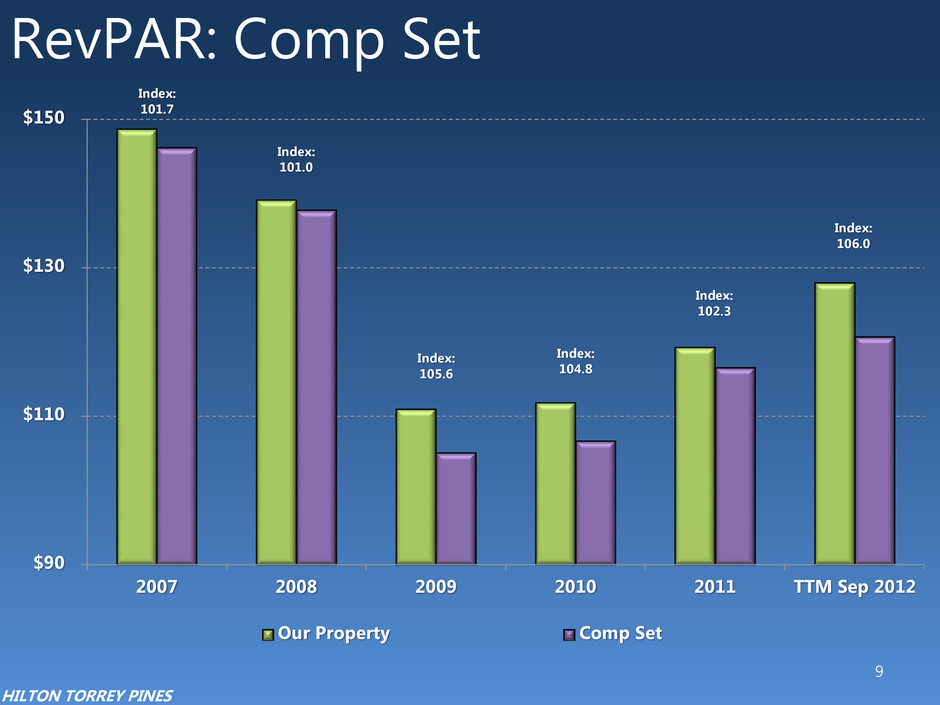
RevPAR: Comp Set $90 $110 $130 $150 2007 2008 2009 2010 2011 TTM Sep 2012 Our Property Comp Set HILTON TORREY PINES Index: 101.7 Index: 101.0 Index: 105.6 Index: 104.8 Index: 102.3 Index: 106.0 9

Capex Projects 10 HILTON TORREY PINES BEFORE AFTER Restaurant Renovation Bar Renovation SALT score: 10% (2009) SALT score: 74% (2012)

Capex Projects Cont. 11 HILTON TORREY PINES BEFORE AFTER Pavilion Renovation Suite Lounge Renovation
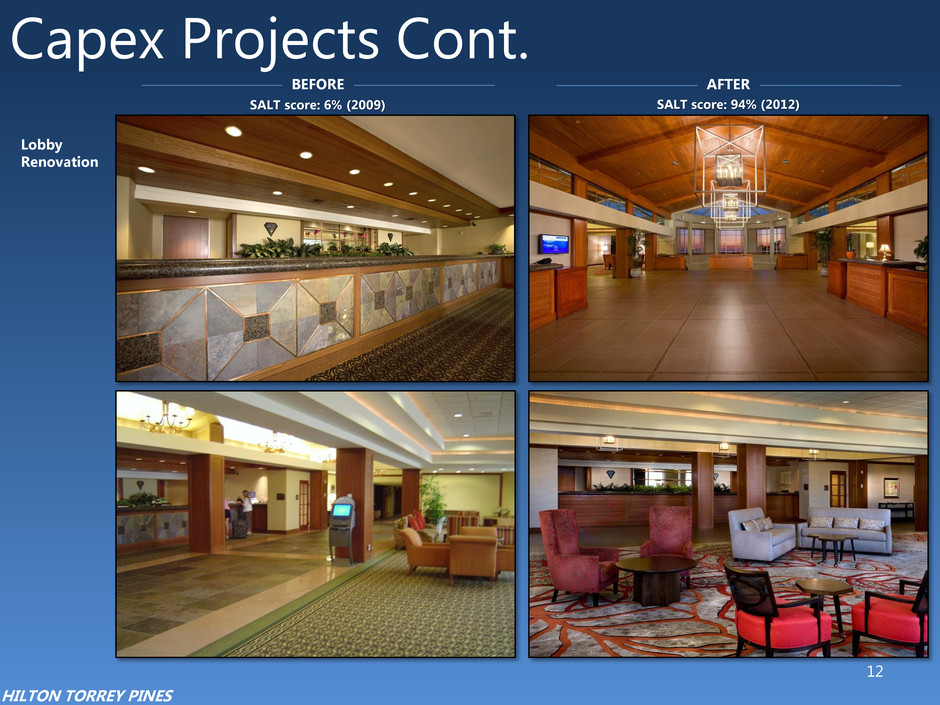
12 HILTON TORREY PINES Capex Projects Cont. BEFORE AFTER Lobby Renovation SALT score: 6% (2009) SALT score: 94% (2012)
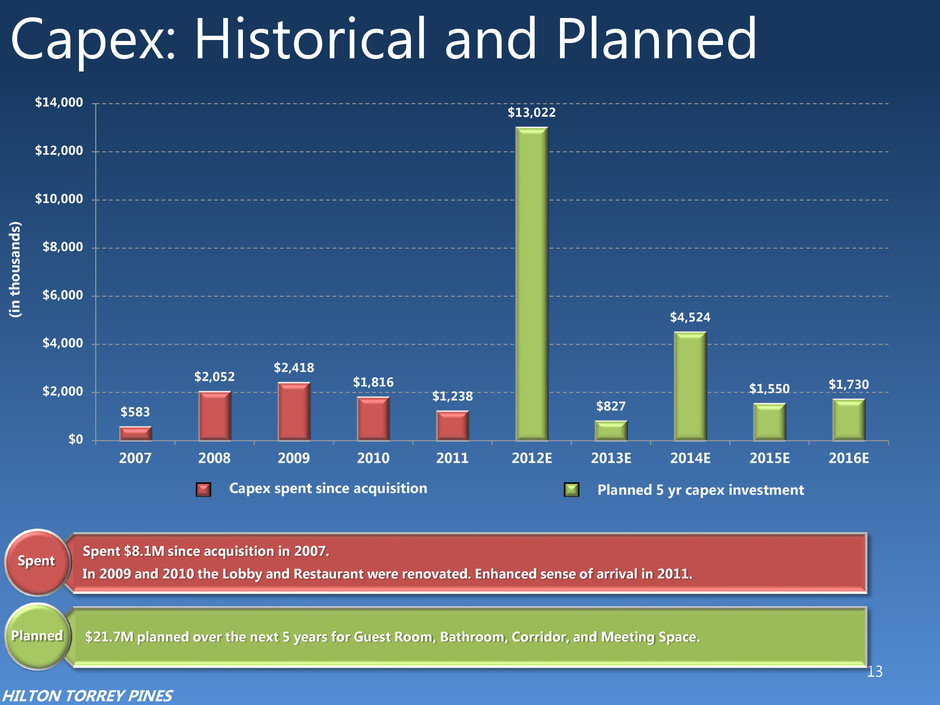
Capex: Historical and Planned $583 $2,052 $2,418 $1,816 $1,238 $13,022 $827 $4,524 $1,550 $1,730 $0 $2,000 $4,000 $6,000 $8,000 $10,000 $12,000 $14,000 2007 2008 2009 2010 2011 2012E 2013E 2014E 2015E 2016E (in t h ou sa n d s) Capex spent since acquisition Planned 5 yr capex investment 13 Spent $8.1M since acquisition in 2007. In 2008 and 2009 the Lobby and Restaurant were renovated. Enhanced sense of arrival in 2011. $21.7M planned over the next 5 years for Guest Room, Bathroom, Corridor, and Meeting Space. Spent Planned HILTON TORREY PINES . . 9 10 the Lo st r t re vate . a ce sense f arrival in 2011. or, ce
PROPERTY TOUR NOVEMBER 2012
