Attached files
| file | filename |
|---|---|
| 8-K - 8-K - Thompson Creek Metals Co Inc. | a12-26519_18k.htm |
| EX-99.1 - EX-99.1 - Thompson Creek Metals Co Inc. | a12-26519_1ex99d1.htm |
Exhibit 99.2
|
|
Third Quarter 2012 Financial Results Investor Call November 9, 2012 |
|
|
Cautionary Statements This document contains “forward-looking statements” within the meaning of the United States Private Securities Litigation Reform Act of 1995, Section 27A of the Securities Act of 1933, as amended, Section 21E of the Securities Act of 1934, as amended and applicable Canadian securities legislation, which are intended to be covered by the safe harbor created by those sections and other applicable laws. These forward-looking statements generally are identified by the words "believe," "project," "expect," "anticipate," "estimate," "intend," "future," "opportunity," "plan," "may," "should," "will," "would," "will be," "will continue," "will likely result," and similar expressions. Our forward-looking statements include statements with respect to: future financial or operating performance of the Company or its subsidiaries and its projects; future inventory, production, sales, cash costs, capital expenditures and exploration expenditures; future earnings and operating results; expected concentrate and recovery grades; statements as to the projected development of Mt. Milligan and other projects, including expected production commencement dates; Mt. Milligan development costs; future operating plans and goals; and future molybdenum prices. Where we express an expectation or belief as to future events or results, such expectation or belief is expressed in good faith and believed to have a reasonable basis. However, our forward-looking statements are based on current expectations and assumptions that are subject to risks and uncertainties which may cause actual results to differ materially from future results expressed, projected or implied by those forward-looking statements. Important factors that could cause actual results and events to differ from those described in such forward-looking statements can be found in the section entitled “Risk Factors” in Thompson Creek’s Annual Report on Form 10-K for the year ended December 31, 2011, Quarterly Reports on Form 10-Q and other documents filed on EDGAR at www.sec.gov and on SEDAR at www.sedar.com. Although we have attempted to identify those material factors that could cause actual results or events to differ from those described in such forward-looking statements, there may be other factors, currently unknown to us or deemed immaterial at the present time, that could cause results or events to differ from those anticipated, estimated or intended. Many of these factors are beyond our ability to control or predict. Given these uncertainties, the reader is cautioned not to place undue reliance on our forward-looking statements. We undertake no obligation to update or revise publicly any forward-looking statements, whether as a result of new information, future events, or otherwise, and investors should not assume that any lack of update to a previously issued forward-looking statement constitutes a reaffirmation of that statement. |
|
|
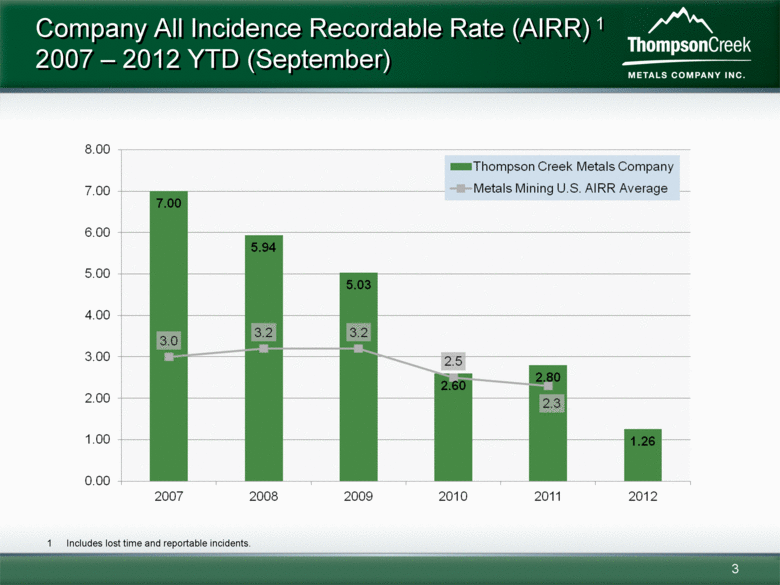
Company All Incidence Recordable Rate (AIRR) 1 2007 – 2012 YTD (September) Includes lost time and reportable incidents. |
|
|
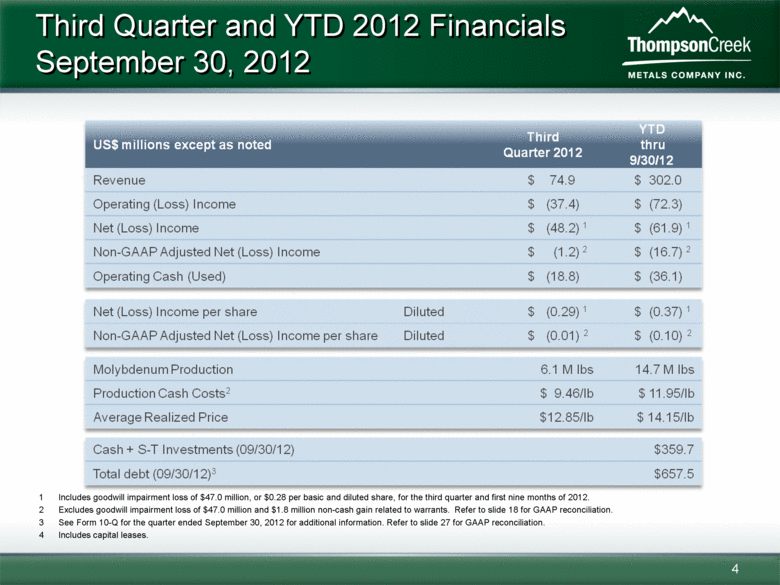
Third Quarter and YTD 2012 Financials September 30, 2012 US$ millions except as noted Third Quarter 2012 YTD thru 9/30/12 Revenue $74.9 $302.0 Operating (Loss) Income $(37.4) $(72.3) Net (Loss) Income $ (48.2)1 $(61.9)1 Non-GAAP Adjusted Net (Loss) Income $(1.2) 2 $(16.7)2 Operating Cash (Used) $ (18.8) $(36.1) Net (Loss) Income per share Diluted $ (0.29)1 $ (0.37) 1 Non-GAAP Adjusted Net (Loss) Income per share Diluted $(0.01)2 $(0.10)2 Molybdenum Production 6.1M lbs 14.7M lbs Production Cash Costs2 $9.46/lb $11.95/lb Average Realized Price $12.85/lb $14.15/lb Cash+S-T Investments (09/30/12) $359.7 Total debt (09/30/12)3 $657.5 1 Includes goodwill impairment loss of $47.0 million, or $0.28 per basic and diluted share, for the third quarter and first nine months of 2012. 2 Excludes goodwill impairment loss of $47.0 million and $1.8 million non-cash gain related to warrants. Refer to slide 18 for GAAP reconciliation. 3 See Form 10-Q for the quarter ended September 30, 2012 for additional information. Refer to slide 27 for GAAP reconciliation. 4 Includes capital leases. 4 |
|
|
|
|
|
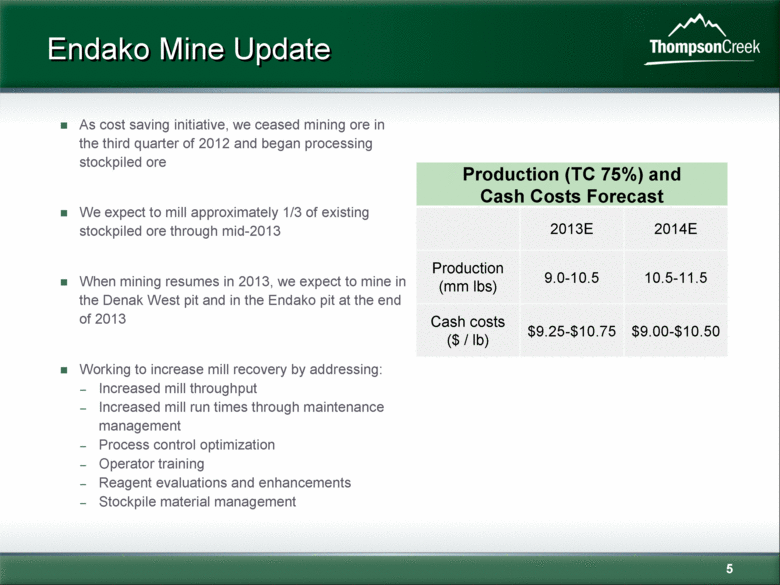
As cost saving initiative, we ceased mining ore in the third quarter of 2012 and began processing stockpiled ore We expect to mill approximately 1/3 of existing stockpiled ore through mid-2013 When mining resumes in 2013, we expect to mine in the Denak West pit and in the Endako pit at the end of 2013 Working to increase mill recovery by addressing: Increased mill throughput Increased mill run times through maintenance management Process control optimization Operator training Reagent evaluations and enhancements Stockpile material management Production (TC 75%) and Cash Costs Forecast 2013E 2014E Production (mm lbs) 9.0-10.5 10.5-11.5 Cash costs ($ / lb) $9.25-$10.75 $9.00-$10.50 Endako Mine Update 5 |
|
|
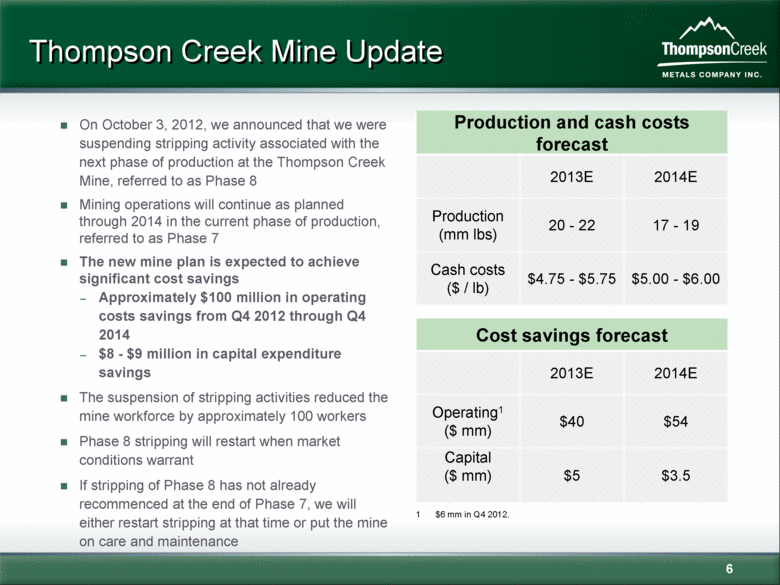
Thompson Creek Mine Update Production and cash costs forecast 2013E 2014E Production (mm lbs) 20 - 22 17 - 19 Cash costs ($ / lb) $4.75 - $5.75 $5.00 - $6.00 On October 3, 2012, we announced that we were suspending stripping activity associated with the next phase of production at the Thompson Creek Mine, referred to as Phase 8 Mining operations will continue as planned through 2014 in the current phase of production, referred to as Phase 7 The new mine plan is expected to achieve significant cost savings Approximately $100 million in operating costs savings from Q4 2012 through Q4 2014 $8 - $9 million in capital expenditure savings The suspension of stripping activities reduced the mine workforce by approximately 100 workers Phase 8 stripping will restart when market conditions warrant If stripping of Phase 8 has not already recommenced at the end of Phase 7, we will either restart stripping at that time or put the mine on care and maintenance Cost savings forecast 2013E 2014E Operating1 ($ mm) $40 $54 Capital ($ mm) $5 $3.5 1 $6 mm in Q4 2012. |
|
|
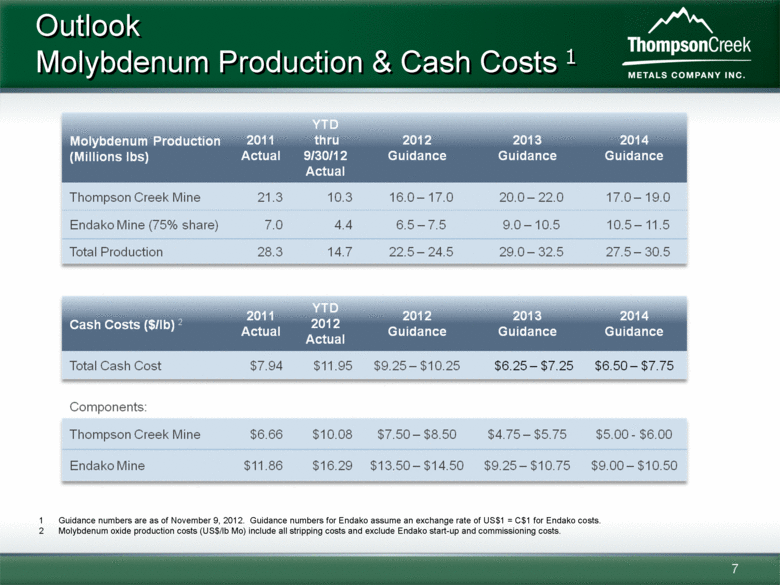
1 Guidance numbers are as of November 9, 2012. Guidance numbers for Endako assume an exchange rate of US$1 = C$1 for Endako costs. 2 Molybdenum oxide production costs (US$/lb Mo) include all stripping costs and exclude Endako start-up and commissioning costs. Outlook Molybdenum Production & Cash Costs 1 Thompson Creek Mine Thompson Creek Mine 21 3 21.3 10 3 10.3 16 0 17 0 16.0 – 17.0 20 0 22 0 20.0 – 22.0 17 0 19 0 17.0 – 19.0 Endako Mine (75% share) 7.0 4.4 6.5 – 7.5 9.0 – 10.5 10.5 – 11.5 Total Production 28.3 14.7 22.5 – 24.5 29.0 – 32.5 27.5 – 30.5 Total Cash Cost $7.94 $11.95 $9.25 – $10.25 $6.25 – $7.25 $6.50 – $7.75 Components: Thompson Creek Mine $6.66 $10.08 $7.50 – $8.50 $4.75 – $5.75 $5.00 -$6.00 Endako Mine $11.86 $16.29 $13.50 – $14.50 $9.25 – $10.75 $9.00 – $10.50 |
|
|
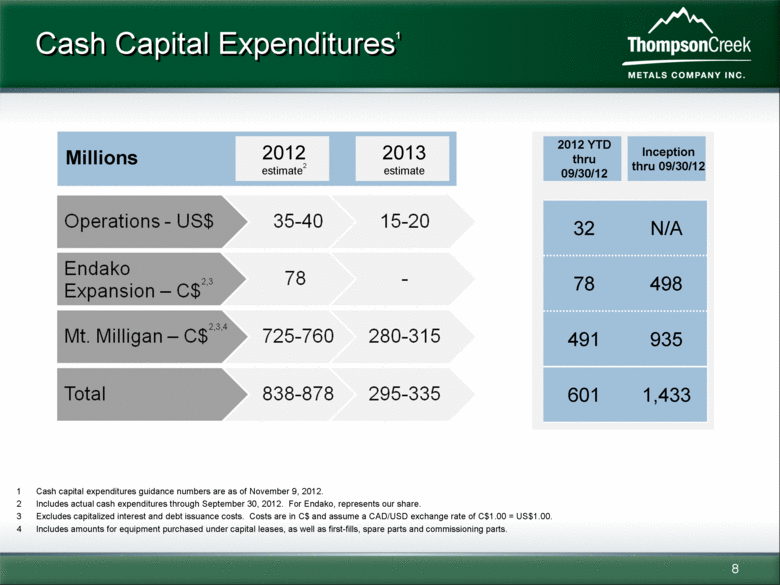
1 Cash capital expenditures guidance numbers are as of November 9, 2012. 2 Includes actual cash expenditures through September 30, 2012. For Endako, represents our share. 3 Excludes capitalized interest and debt issuance costs. Costs are in C$ and assume a CAD/USD exchange rate of C$1.00 = US$1.00. 4 Includes amounts for equipment purchased under capital leases, as well as first-fills, spare parts and commissioning parts. Cash Capital Expenditures1 2012 estimate2 2013 estimate 32 N/A 78 498 491 935 601 1,433 2012 YTD thru 09/30/12 Inception thru 09/30/12 Millions Operations -US$ 35-40 15-20 Endako Expansion – C$2,3 78 - 234 Mt. Milligan – C$2,3,4 725-760 280-315 Tot lTotal 838 878838-878 295 335295-335 |
|
|
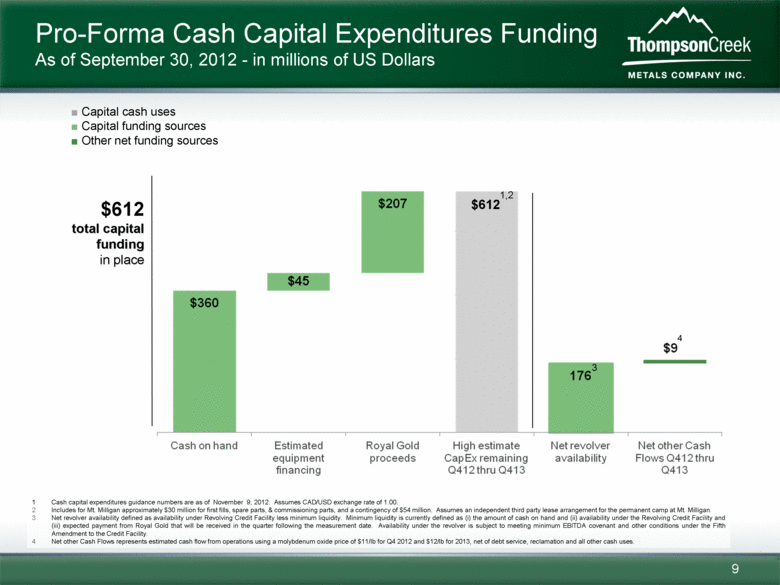
Pro-Forma Cash Capital Expenditures Funding As of September 30, 2012 - in millions of US Dollars 1 Cash capital expenditures guidance numbers are as of November 9, 2012. Assumes CAD/USD exchange rate of 1.00. 2 Includes for Mt. Milligan approximately $30 million for first fills, spare parts, & commissioning parts, and a contingency of $54 million. Assumes an independent third party lease arrangement for the permanent camp at Mt. Milligan. 3 Net revolver availability defined as availability under Revolving Credit Facility less minimum liquidity. Minimum liquidity is currently defined as (i) the amount of cash on hand and (ii) availability under the Revolving Credit Facility and (iii) expected payment from Royal Gold that will be received in the quarter following the measurement date. Availability under the revolver is subject to meeting minimum EBITDA covenant and other conditions under the Fifth Amendment to the Credit Facility. 4 Net other Cash Flows represents estimated cash flow from operations using a molybdenum oxide price of $11/lb for Q4 2012 and $12/lb for 2013, net of debt service, reclamation and all other cash uses. Capital cash uses Capital funding sources Other net funding sources $612 3 4 1,2 |
|
|
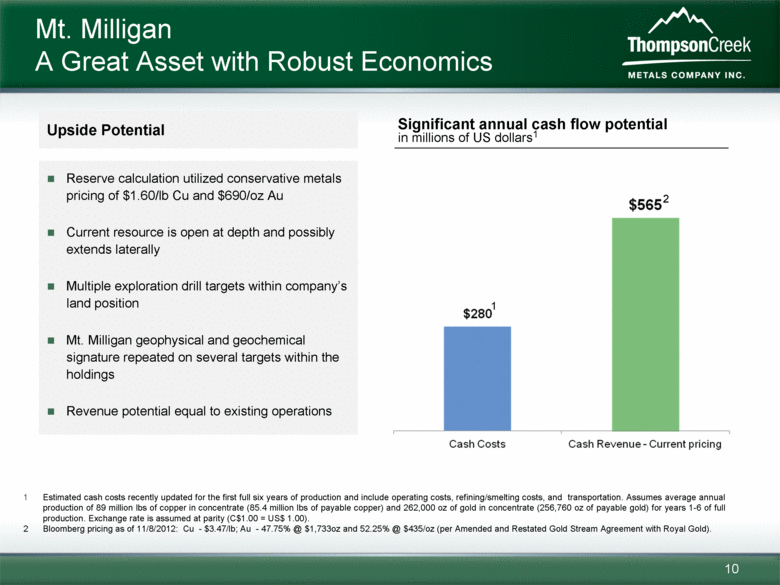
Mt. Milligan A Great Asset with Robust Economics Reserve calculation utilized conservative metals pricing of $1.60/lb Cu and $690/oz Au Current resource is open at depth and possibly extends laterally Multiple exploration drill targets within company’s land position Mt. Milligan geophysical and geochemical signature repeated on several targets within the holdings Revenue potential equal to existing operations 1 Estimated cash costs recently updated for the first full six years of production and include operating costs, refining/smelting costs, and transportation. Assumes average annual production of 89 million lbs of copper in concentrate (85.4 million lbs of payable copper) and 262,000 oz of gold in concentrate (256,760 oz of payable gold) for years 1-6 of full production. Exchange rate is assumed at parity (C$1.00 = US$ 1.00). 2 Bloomberg pricing as of 11/8/2012: Cu - $3.47/lb; Au - 47.75% @ $1,733oz and 52.25% @ $435/oz (per Amended and Restated Gold Stream Agreement with Royal Gold). 2 Significant annual cash flow potential in millions of US dollars1 Upside Potential 1 |
|
|
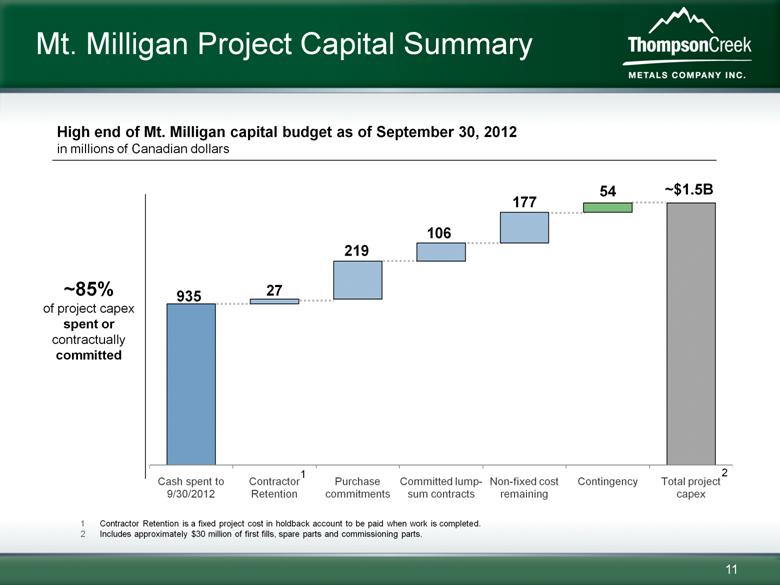
High end of Mt. Milligan capital budget as of September 30, 2012 in millions of Canadian dollars Mt. Milligan Project Capital Summary 11 ~$1.5B Contractor Retention is a fixed project cost in holdback account to be paid when work is completed. Includes approximately $30 million of first fills, spare parts and commissioning parts. ~85% of project capex spent or contractually committed 1 2 |
|
|
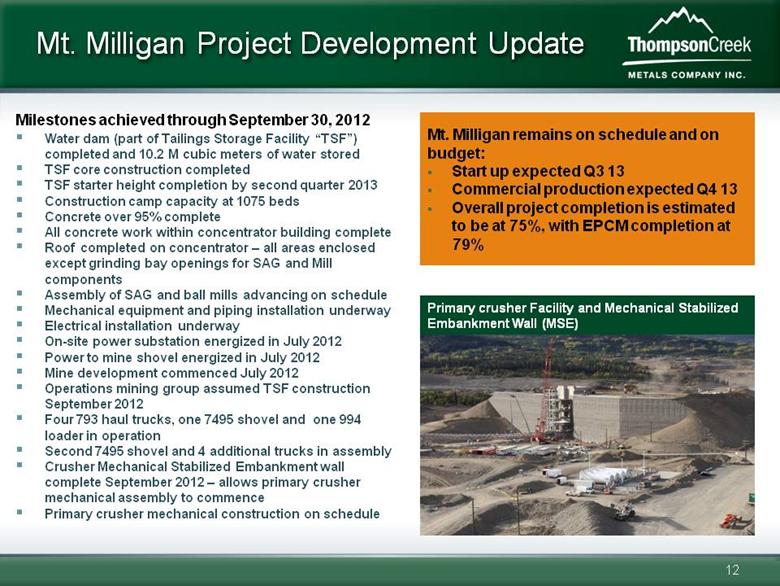
Mt. Milligan Project Development Update Milestones achieved through September 30, 2012 Water dam (part of Tailings Storage Facility “TSF”) completed and 10.2 M cubic meters of water stored TSF core construction completed TSF starter height completion by second quarter 2013 Construction camp capacity at 1075 beds Concrete over 95% complete All concrete work within concentrator building complete Roof completed on concentrator – all areas enclosed except grinding bay openings for SAG and Mill components Assembly of SAG and ball mills advancing on schedule Mechanical equipment and piping installation underway Electrical installation underway On-site power substation energized in July 2012 Power to mine shovel energized in July 2012 Mine development commenced July 2012 Operations mining group assumed TSF construction September 2012 Four 793 haul trucks, one 7495 shovel and one 994 loader in operation Second 7495 shovel and 4 additional trucks in assembly Crusher Mechanical Stabilized Embankment wall complete September 2012 – allows primary crusher mechanical assembly to commence Primary crusher mechanical construction on schedule Primary crusher Facility and Mechanical Stabilized Embankment Wall (MSE) Mt. Milligan remains on schedule and on budget: Start up expected Q3 13 Commercial production expected Q4 13 Overall project completion is estimated to be at 75%, with EPCM completion at 79% |
|
|
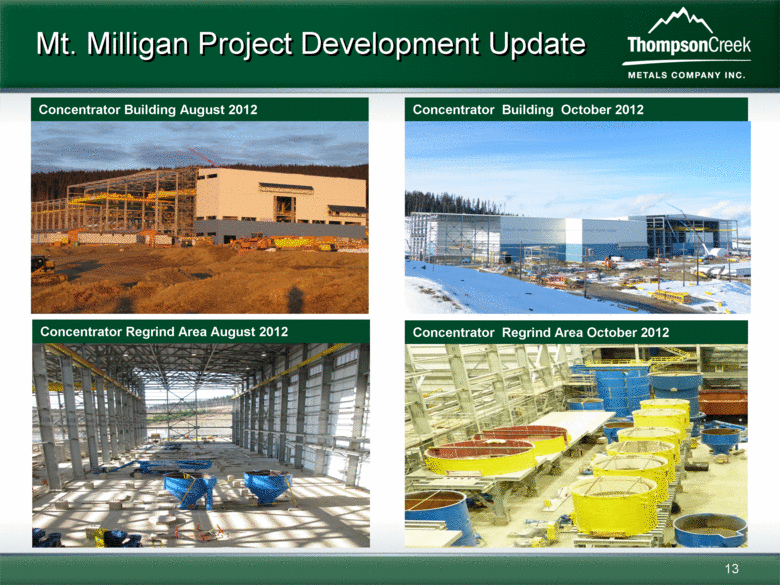
Mt. Milligan Project Development Update Concentrator Building October 2012 Concentrator Regrind Area August 2012 Concentrator Building August 2012 Concentrator Regrind Area October 2012 |
|
|
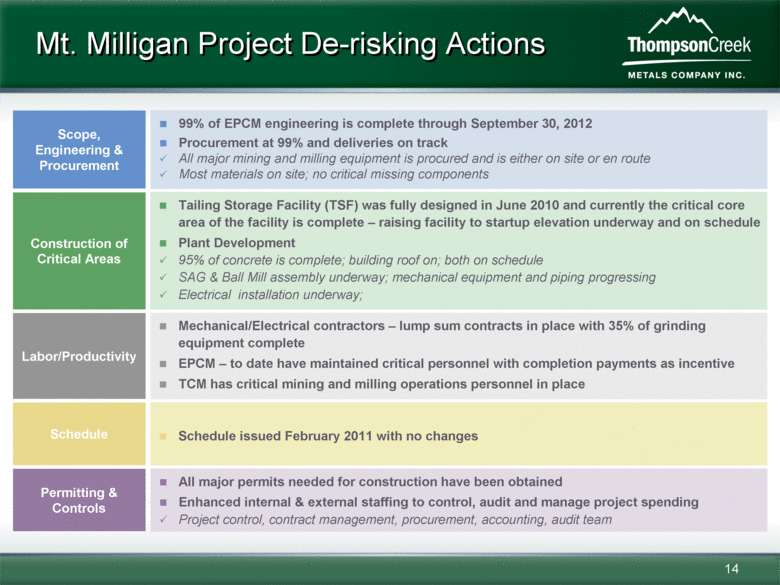
Mt. Milligan Project De-risking Actions All major permits needed for construction have been obtained Enhanced internal & external staffing to control, audit and manage project spending Project control, contract management, procurement, accounting, audit team 99% of EPCM engineering is complete through September 30, 2012 Procurement at 99% and deliveries on track All major mining and milling equipment is procured and is either on site or en route Most materials on site; no critical missing components Scope, Engineering & Procurement Construction of Critical Areas Tailing Storage Facility (TSF) was fully designed in June 2010 and currently the critical core area of the facility is complete – raising facility to startup elevation underway and on schedule Plant Development 95% of concrete is complete; building roof on; both on schedule SAG & Ball Mill assembly underway; mechanical equipment and piping progressing Electrical installation underway; Permitting & Controls Schedule Schedule issued February 2011 with no changes Labor/Productivity Mechanical/Electrical contractors – lump sum contracts in place with 35% of grinding equipment complete EPCM – to date have maintained critical personnel with completion payments as incentive TCM has critical mining and milling operations personnel in place |
|
|
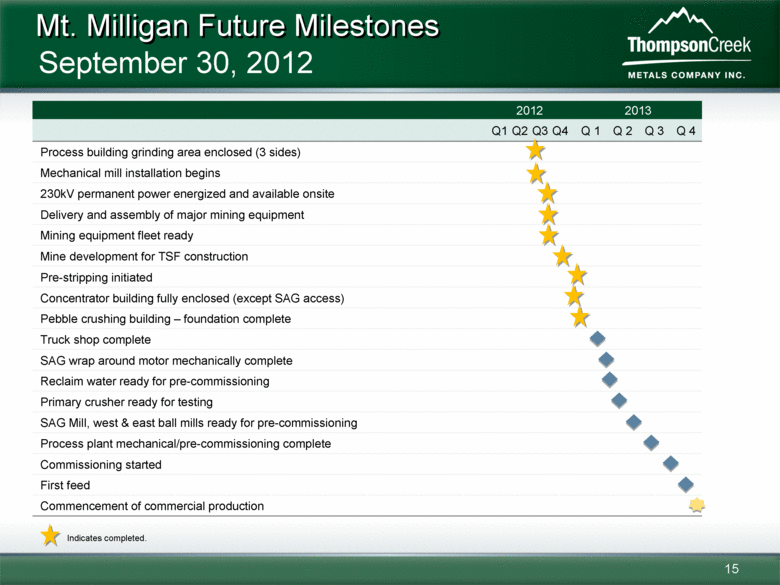
Mt. Milligan Future Milestones 2012 2013 Q1 Q2 Q3 Q4 Q 1 Q 2 Q 3 Q 4 Process building grinding area enclosed (3 sides) Mechanical mill installation begins 230kV permanent power energized and available onsite Delivery and assembly of major mining equipment Mining equipment fleet ready Mine development for TSF construction Pre-stripping initiated Concentrator building fully enclosed (except SAG access) Pebble crushing building – foundation complete Truck shop complete SAG wrap around motor mechanically complete Reclaim water ready for pre-commissioning Primary crusher ready for testing SAG Mill, west & east ball mills ready for pre-commissioning Process plant mechanical/pre-commissioning complete Commissioning started First feed Commencement of commercial production Indicates completed. September 30, 2012 15 |
|
|
Appendix |

|
|
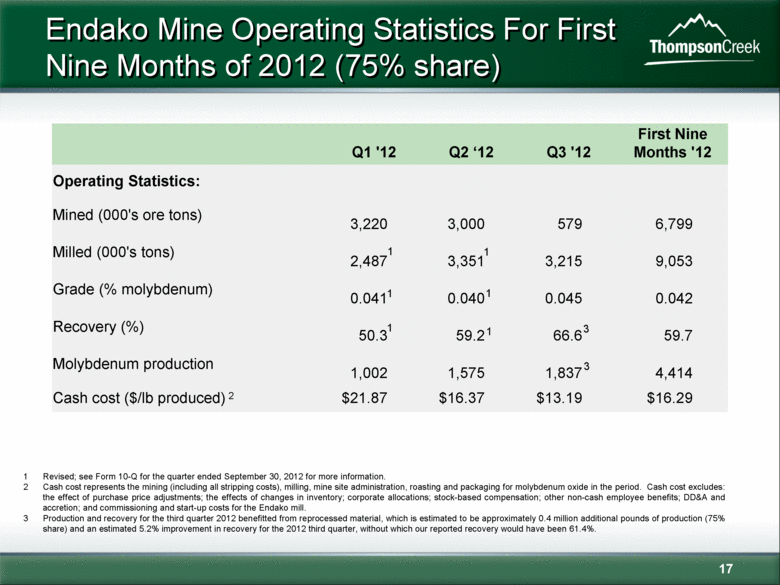
Endako Mine Operating Statistics For First Nine Months of 2012 (75% share) Q1 '12 Q2 ‘12 Q3 '12 First Nine Months '12 Operating Statistics: Mined (000's ore tons) 3,220 3,000 579 6,799 Milled (000's tons) 2,487 3,351 3,215 9,053 Grade (% molybdenum) 0.041 0.040 0.045 0.042 Recovery (%) 50.3 59.2 66.6 59.7 Molybdenum production 1,002 1,575 1,837 4,414 Cash cost ($/lb produced) 2 $21.87 $16.37 $13.19 $16.29 1 Revised; see Form 10-Q for the quarter ended September 30, 2012 for more information. 2 Cash cost represents the mining (including all stripping costs), milling, mine site administration, roasting and packaging for molybdenum oxide in the period. Cash cost excludes: the effect of purchase price adjustments; the effects of changes in inventory; corporate allocations; stock-based compensation; other non-cash employee benefits; DD&A and accretion; and commissioning and start-up costs for the Endako mill. 3 Production and recovery for the third quarter 2012 benefitted from reprocessed material, which is estimated to be approximately 0.4 million additional pounds of production (75% share) and an estimated 5.2% improvement in recovery for the 2012 third quarter, without which our reported recovery would have been 61.4%. 17 1 1 3 3 1 1 1 1 |
|
|
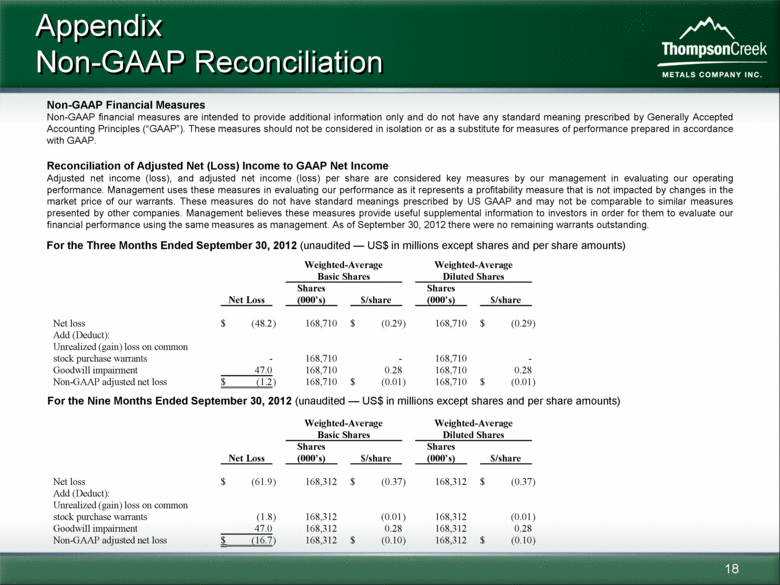
Appendix Non-GAAP Reconciliation Non-GAAP Financial Measures Non-GAAP financial measures are intended to provide additional information only and do not have any standard meaning prescribed by Generally Accepted Accounting Principles (“GAAP”). These measures should not be considered in isolation or as a substitute for measures of performance prepared in accordance with GAAP. Reconciliation of Adjusted Net (Loss) Income to GAAP Net Income Adjusted net income (loss), and adjusted net income (loss) per share are considered key measures by our management in evaluating our operating performance. Management uses these measures in evaluating our performance as it represents a profitability measure that is not impacted by changes in the market price of our warrants. These measures do not have standard meanings prescribed by US GAAP and may not be comparable to similar measures presented by other companies. Management believes these measures provide useful supplemental information to investors in order for them to evaluate our financial performance using the same measures as management. As of September 30, 2012 there were no remaining warrants outstanding. For the Three Months Ended September 30, 2012 (unaudited — US$ in millions except shares and per share amounts) For the Nine Months Ended September 30, 2012 (unaudited — US$ in millions except shares and per share amounts) Weighted-Average Basic Shares Weighted-Average Diluted Shares Net Loss Shares (000’s) $/share Shares (000’s) $/share Net loss $ (48.2 ) 168,710 $ (0.29 ) 168,710 $ (0.29 ) Add (Deduct): Unrealized (gain) loss on common stock purchase warrants - 168,710 - 168,710 - Goodwill impairment 47.0 168,710 0.28 168,710 0.28 Non-GAAP adjusted net loss $ (1.2 ) 168,710 $ (0.01 ) 168,710 $ (0.01 ) Weighted-Average Basic Shares Weighted-Average Diluted Shares Net Loss Shares (000’s) $/share Shares (000’s) $/share Net loss $ (61.9 ) 168,312 $ (0.37 ) 168,312 $ (0.37 ) Add (Deduct): Unrealized (gain) loss on common stock purchase warrants (1.8 ) 168,312 (0.01 ) 168,312 (0.01 ) Goodwill impairment 47.0 168,312 0.28 168,312 0.28 Non-GAAP adjusted net loss $ (16.7 ) 168,312 $ (0.10 ) 168,312 $ (0.10 ) 18 |
|
|
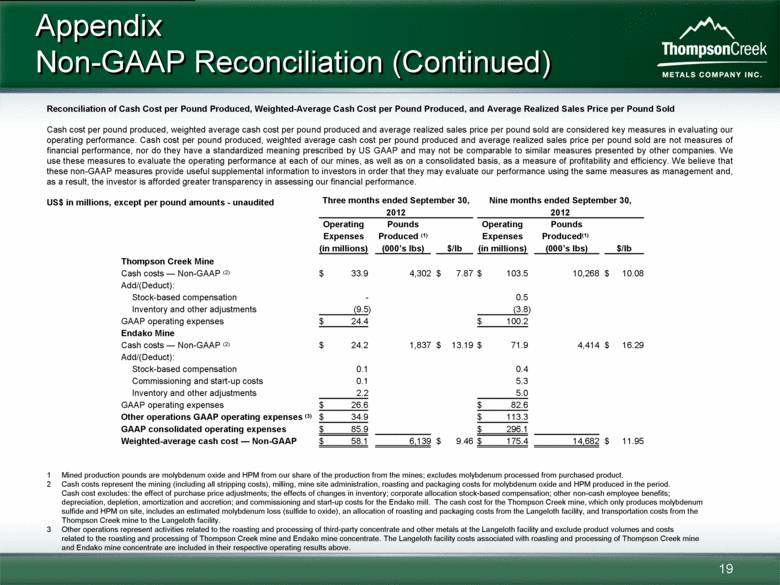
19 Appendix Non-GAAP Reconciliation (Continued) Reconciliation of Cash Cost per Pound Produced, Weighted-Average Cash Cost per Pound Produced, and Average Realized Sales Price per Pound Sold Cash cost per pound produced, weighted average cash cost per pound produced and average realized sales price per pound sold are considered key measures in evaluating our operating performance. Cash cost per pound produced, weighted average cash cost per pound produced and average realized sales price per pound sold are not measures of financial performance, nor do they have a standardized meaning prescribed by US GAAP and may not be comparable to similar measures presented by other companies. We use these measures to evaluate the operating performance at each of our mines, as well as on a consolidated basis, as a measure of profitability and efficiency. We believe that these non-GAAP measures provide useful supplemental information to investors in order that they may evaluate our performance using the same measures as management and, as a result, the investor is afforded greater transparency in assessing our financial performance. US$ in millions, except per pound amounts - unaudited 1 Mined production pounds are molybdenum oxide and HPM from our share of the production from the mines; excludes molybdenum processed from purchased product. 2 Cash costs represent the mining (including all stripping costs), milling, mine site administration, roasting and packaging costs for molybdenum oxide and HPM produced in the period. Cash cost excludes: the effect of purchase price adjustments; the effects of changes in inventory; corporate allocation stock-based compensation; other non-cash employee benefits; depreciation, depletion, amortization and accretion; and commissioning and start-up costs for the Endako mill. The cash cost for the Thompson Creek mine, which only produces molybdenum sulfide and HPM on site, includes an estimated molybdenum loss (sulfide to oxide), an allocation of roasting and packaging costs from the Langeloth facility, and transportation costs from the Thompson Creek mine to the Langeloth facility. 3 Other operations represent activities related to the roasting and processing of third-party concentrate and other metals at the Langeloth facility and exclude product volumes and costs related to the roasting and processing of Thompson Creek mine and Endako mine concentrate. The Langeloth facility costs associated with roasting and processing of Thompson Creek mine and Endako mine concentrate are included in their respective operating results above. Three months ended September 30, 2012 Nine months ended September 30, 2012 Operating Expenses (in millions) Pounds Produced (1) (000’s lbs) $/lb Operating Expenses (in millions) Pounds Produced(1) (000’s lbs) $/lb Thompson Creek Mine Cash costs — Non-GAAP (2) $ 33.9 4,302 $ 7.87 $ 103.5 10,268 $ 10.08 Add/(Deduct): Stock-based compensation - 0.5 Inventory and other adjustments (9.5) (3.8) GAAP operating expenses $ 24.4 $ 100.2 Endako Mine Cash costs — Non-GAAP (2) $ 24.2 1,837 $ 13.19 $ 71.9 4,414 $ 16.29 Add/(Deduct): Stock-based compensation 0.1 0.4 Commissioning and start-up costs 0.1 5.3 Inventory and other adjustments 2.2 5.0 GAAP operating expenses $ 26.6 $ 82.6 Other operations GAAP operating expenses (3) $ 34.9 $ 113.3 GAAP consolidated operating expenses $ 85.9 $ 296.1 Weighted-average cash cost — Non-GAAP $ 58.1 6,139 $ 9.46 $ 175.4 14,682 $ 11.95 |
|
|
Thompson Creek Metals Company NYSE:TC TSX:TCM www.thompsoncreekmetals.com Pamela Solly Director, Investor Relations Phone: (303) 762-3526 Email: psolly@tcrk.com |