Attached files
| file | filename |
|---|---|
| 8-K - FORM 8-K - OCEANFIRST FINANCIAL CORP | d436480d8k.htm |
 NASDAQ: OCFC
1
OceanFirst Financial Corp.
John
R.
Garbarino
–
Chairman,
CEO
Michael
J.
Fitzpatrick
–
Executive
Vice
President,
CFO
SANDLER O’NEILL + PARTNERS, L.P.
EAST COAST FINANCIAL SERVICES CONFERENCE
NOVEMBER 15, 2012
Exhibit 99.1 |
 2
OceanFirst Financial Corp.
OceanFirst Financial Corp.
Forward Looking Statements:
NASDAQ: OCFC
This presentation contains certain forward-looking statements within the meaning of the Private
Securities Reform Act of 1995, which are based on certain assumptions and describe future
plans, strategies and expectations of the Company. These forward-looking statements
are generally identified by use of the words “believe”, “expect”,
“intend”, “anticipate”, “estimate”, “project”, “will”,
“should”, “may”, “view”, “opportunity”,
“potential”, or similar expressions or expression of confidence. The
Company’s ability to predict results or the actual effect of future plans or strategies is inherently
uncertain. Factors which could have a material adverse effect on the operations of the Company
and the subsidiaries include, but are not limited to, changes in interest rates, general
economic conditions, levels of unemployment in the Bank’s lending area, real estate
market values in the Bank’s lending area, legislative/regulatory changes, monetary and
fiscal policies of the U.S. Government including policies of the U.S. Treasury and the Board
of Governors of the Federal Reserve System, the quality or composition of the loan or
investment portfolios, demand for loan products, deposit flows, competition, demand for
financial services in the Company’s market area and accounting principles and
guidelines. These risks and uncertainties are further discussed in the Company’s Annual Report
on Form 10-K for the year ended December 31, 2011 and its subsequent securities filings and
should be considered in evaluating forward-looking statements and undue reliance should
not be placed on such statements. The Company does not undertake – and specifically
disclaims any obligation – to publicly release the result of any revisions which may be
made to any forward-looking statements to reflect events or circumstances after the date
of such statements or to reflect the occurrence of anticipated or unanticipated events. |
 3
110 Years of Growth and Capital Management
110 Years of Growth and Capital Management
Began the redeployment of the excess capital rebuilt since 2008 with an October 2011
5% share repurchase plan. As of September 30, 2012, 58,899 shares
remain available for repurchase under the current authorization.
NASDAQ: OCFC
Founded in Point Pleasant, NJ, in 1902, OceanFirst has grown from a small
one-town savings and loan to a full-service community bank serving
the Central New Jersey shore. OceanFirst issued stock for the first time in
1996 and over the ensuing ten years generated value for our
shareholders, largely through the successful implementation and execution of
our community bank model, and the strategic repurchase of 62.4% of original IPO
shares. Rebuilt capital through the Great Recession with retained earnings and
completion of a follow-on common stock offering in November
2009. |
 4
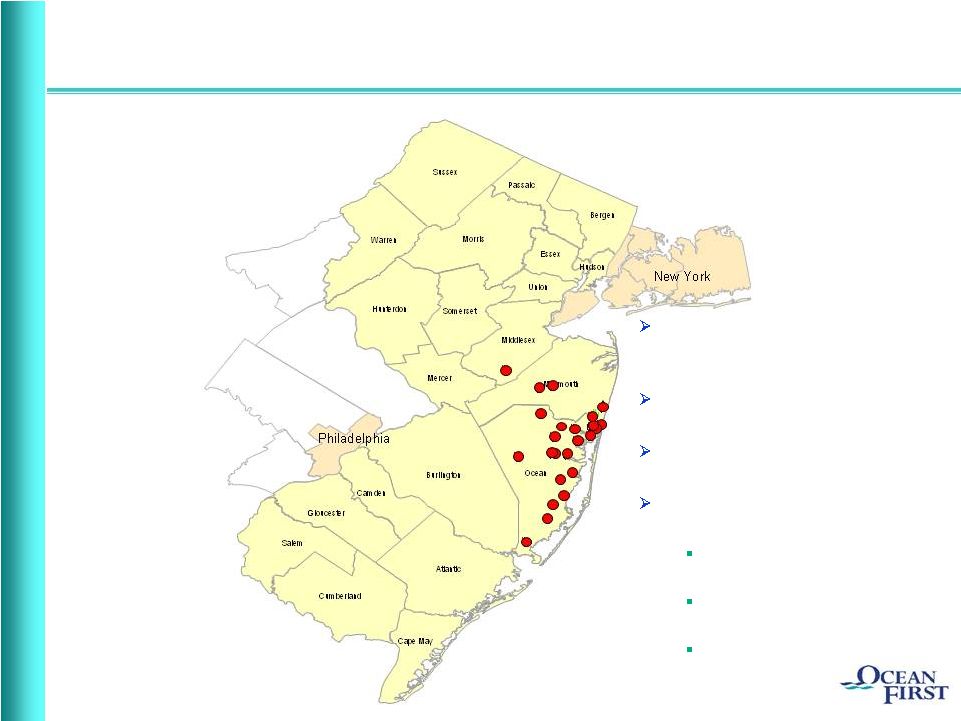
Community Bank serving the
Central
Jersey
Shore
-
$2.3
billion
in assets and 24 branch offices
Market Cap $238.6 million (as of
November 7, 2012)
Core
deposit
funded
–
86.5%
of
total deposits
Locally originated loan portfolio
with no brokered loans
Residential and commercial
mortgages
Consumer equity loans and
lines
C&I loans and lines
Corporate Profile
Corporate Profile
Note: See Appendix 1 for Market Demographic information.
NASDAQ: OCFC |
 5
Experienced Executive Management Team
Experienced Executive Management Team
Executive search initiated in August for the recently vacated position of
President/COO Furthering Senior Management Succession Planning
Insider
ownership
of
25.7%
is
substantial
–
aligned
with
shareholders’
interest
OceanFirst Bank ESOP 10.2%
Directors & Current Senior Executive Officers 8.5% (CEO 5.1%)
Director and Proxy Officer Stock Ownership Guidelines
OceanFirst Foundation 7.0%
As
of
the
March
15,
2012
proxy
record
date.
Name
Position
# of Years in
Banking
# of Years
at OCFC
John R. Garbarino
Chairman, Chief Executive Officer
41
41
Michael J. Fitzpatrick
Executive Vice President, Chief Financial Officer
31
20
NASDAQ: OCFC |
 6
Our Strategy
Our Strategy
Positioned as the leading Community Bank in attractive Central
Jersey
Shore
market
–
growing
revenue
and
creating
additional
value for our shareholders
Offering a full range of consumer and commercial banking products
generating diversified income streams
Guarding
credit
quality
in
ALL
business
cycles
Transitioning the balance sheet with emphasis on core deposit
funding and commercial lending growth
On the watch for roll-up opportunities presented by in-market
“regulatory fatigued”
competitors
NASDAQ: OCFC |
 NASDAQ: OCFC
7
Solid core operating earnings of $0.31 per share, a 10.7% increase over the
prior year quarter (excludes non-recurring severance expense)
Strong
capital
position
–
tangible
common
equity
of
9.5%
of
assets
Return on average stockholders’
equity was 9.1%
Tangible book value continues to grow, increasing 5.0% YTD to $12.19
Nearing completion of October 2011 5% Stock Repurchase Plan
Improved credit quality with NPL’s decreasing $2.8 million, or 6.4% YTD
Grew core deposits (i.e. all deposits excluding time deposits)
$67.2 million
YTD, now comprising 86.5% of total deposits
Highlights –
Highlights –
Third Quarter 2012
Third Quarter 2012
NASDAQ: OCFC |
 NASDAQ: OCFC
8
Substantial Primary Market Deposit Share
Substantial Primary Market Deposit Share
June 30, 2012
# of
Dep. In Mkt.
Mkt. Shr.
Rank
Institution
Branches
($000)
(%)
Ocean County, NJ
1
Hudson City Bancorp Inc. (NJ)
14
2,610,613
18.65
2
Wells Fargo Bank NA (CA)
26
2,360,712
16.87
3
TD Bank, National Association (Canada)
21
2,149,131
15.36
4
OceanFirst Financial Corp. (NJ)
19
1,477,780
10.56
5
Banco Santander S.A. (Spain)
25
1,321,262
9.44
6
Bank of America Corp. (NC)
22
1,161,899
8.30
7
Investors Bancorp Inc. (MHC) (NJ)
8
654,369
4.68
8
PNC Financial Services Group (PA)
14
436,177
3.12
9
Manasquan Savings Bank (NJ)
3
252,922
1.81
10
JPMorgan Chase Bank, National Association (OH)
10
230,732
1.65
Total For Institutions In Market
200
13,996,221
Source: FDIC |
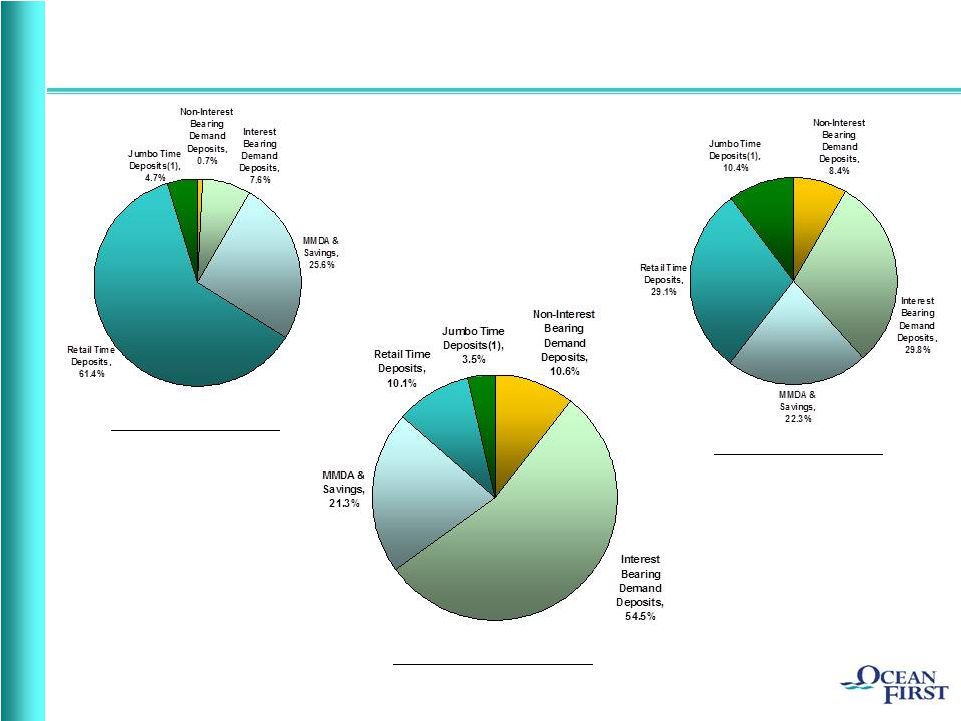 9
Strategic Deposit Composition Transition
Strategic Deposit Composition Transition
(1) Jumbo CDs have a balance of $100,000 or greater.
December 31, 2006
September 30, 2012
December 31, 1996
NASDAQ: OCFC |
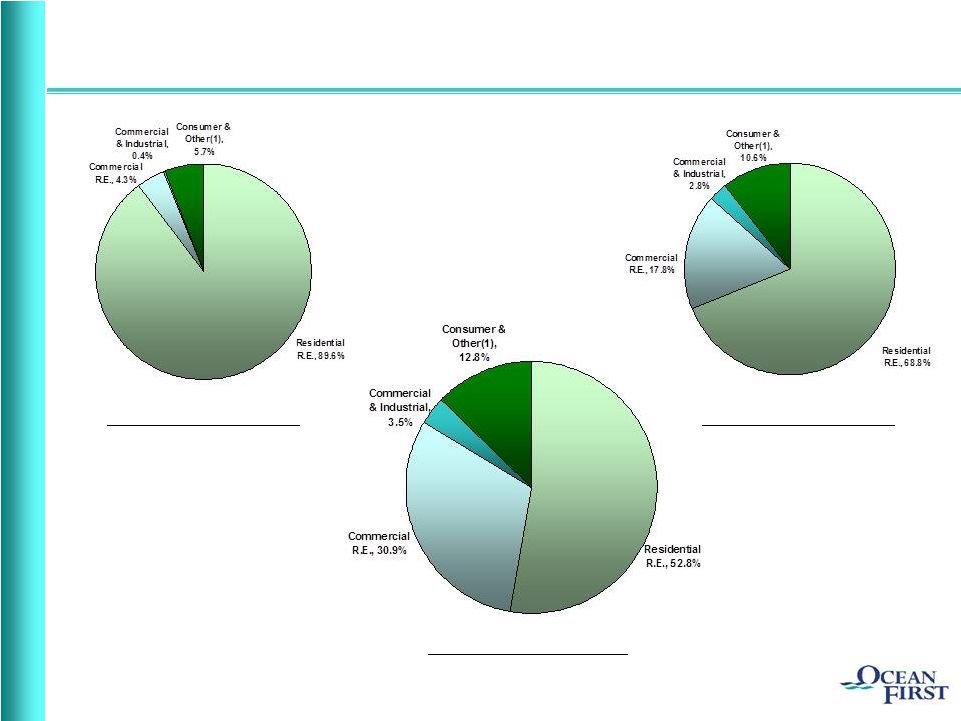 10
Strategic Loan Composition Transition
Strategic Loan Composition Transition
(1)
Consumer and other loans primarily consist of home equity lines and loans.
Note:
See Appendix 2 for specific portfolio metrics and commercial portfolio
segmentation. December 31, 2006
September 30, 2012
December 31, 1996
NASDAQ: OCFC |
 NASDAQ: OCFC
11
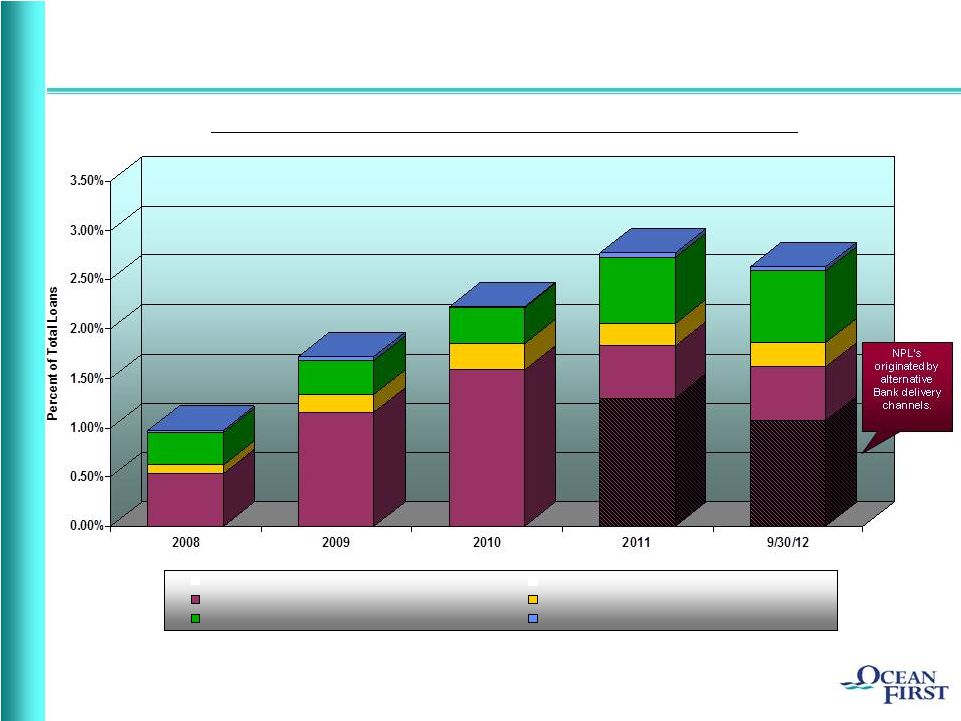
Decreasing NPL’s in a Diversified Portfolio
Decreasing NPL’s in a Diversified Portfolio
Non-performing loan (“NPL”).
Data as of December 31, unless otherwise noted.
Exposure Concentrated in Lower Risk One-to-Four Family
Residential -
Primary Bank delivery channel
Consumer
Commercial Real Estate and Construction
Commercial |
 NASDAQ: OCFC
12
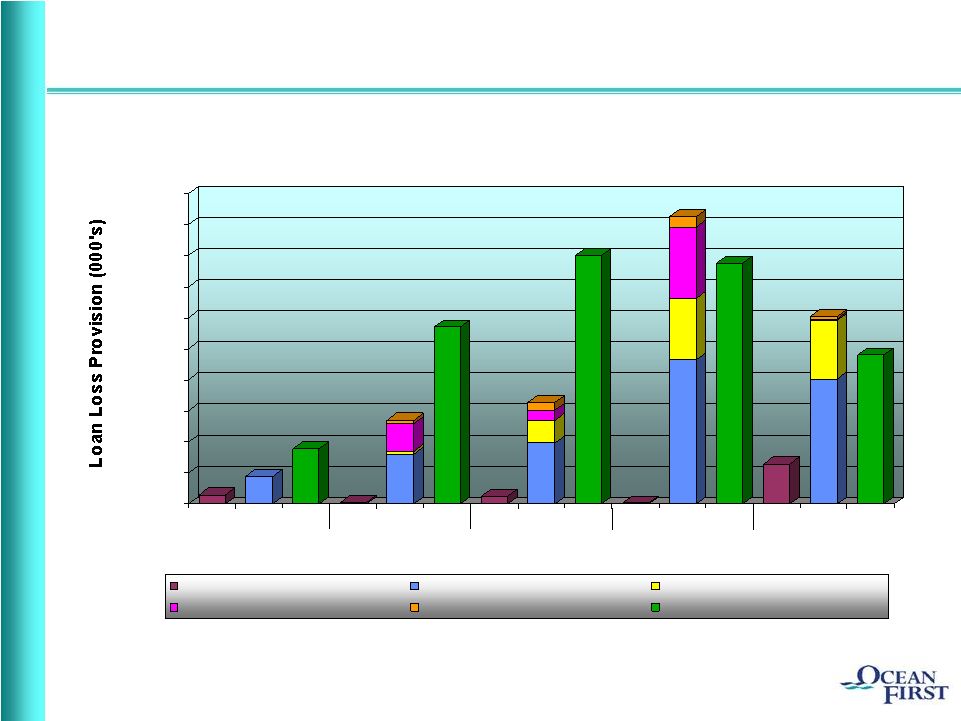
Prudently Provisioning for Credit Costs
Prudently Provisioning for Credit Costs
$0
$1,000
$2,000
$3,000
$4,000
$5,000
$6,000
$7,000
$8,000
$9,000
$10,000
Total Recoveries
Charge-Offs - One-to-Four Family
Charge-Offs - Consumer
Charge-Offs - Commercial Real Estate
Charge-Offs - Commercial
Provision for Loan Losses
12/31/08
12/31/09
12/31/10
12/31/11
(1)
(1)
Increase in charge-offs was primarily due to a change in the Company’s
charge-off policy to recognize the charge-off when the loan is
deemed uncollectible rather than when the foreclosure process is complete.
The additional charge-off relating to the change in policy through 2011 was
$5.7 million, all of which was previously specifically reserved for by the
Company. 9/30/12
(1) |
 NASDAQ: OCFC
13
Effective Disaster Contingency Plan minimized office closures
32% operating the day after the storm
100% operational within 7 days
Leadership presence in market –
meeting customer needs ASAP
OceanFirst Foundation Relief and Recovery Program
Pledged
$500,000
in
grants
through
local
partner
non-profit
agencies
targeting human needs
Traditional Risk Management mitigates exposure to credit loss
Prudent underwriting in markets we have understood for 110 years
Federal flood insurance, private coverage, business interruption
Current ALLL provisioning viewed as adequate in spite of storm
Assessing
exposure
on
a
loan-by-loan
basis,
as
a
community
bank
should
(1)
What About Sandy?
What About Sandy?
(1)
Refer to flood hazard area portfolio data in Appendix 2.
|
 14
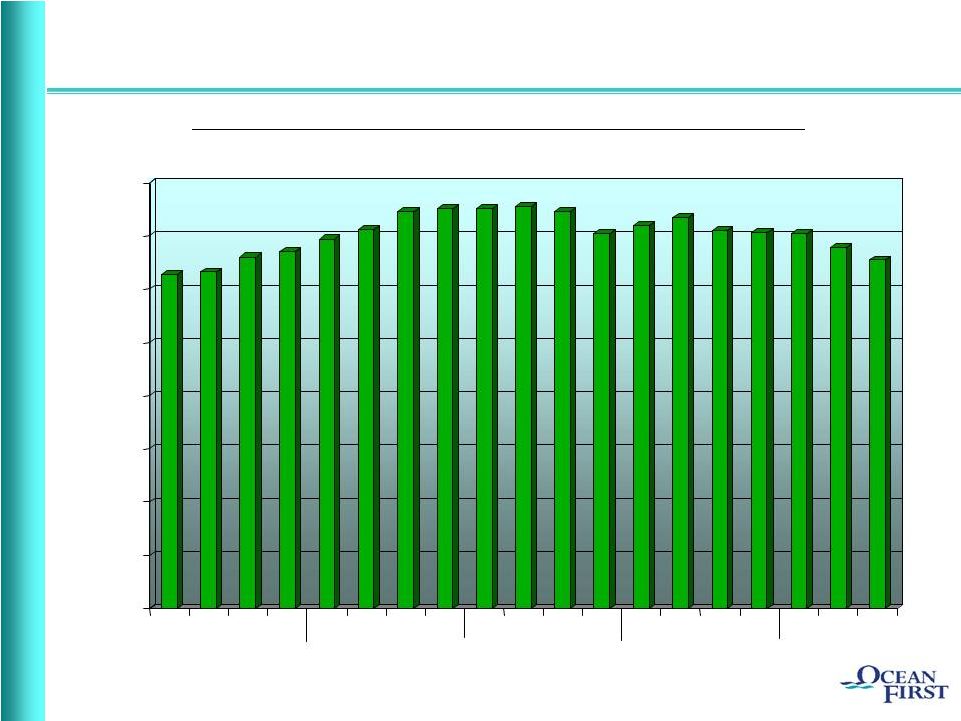
Net Interest Margin
Net Interest Margin
Remaining Under Pressure in Low Interest Rate Environment
2008
2009
2010
2011
2012
0.00%
0.50%
1.00%
1.50%
2.00%
2.50%
3.00%
3.50%
4.00%
NASDAQ: OCFC |
 NASDAQ: OCFC
15
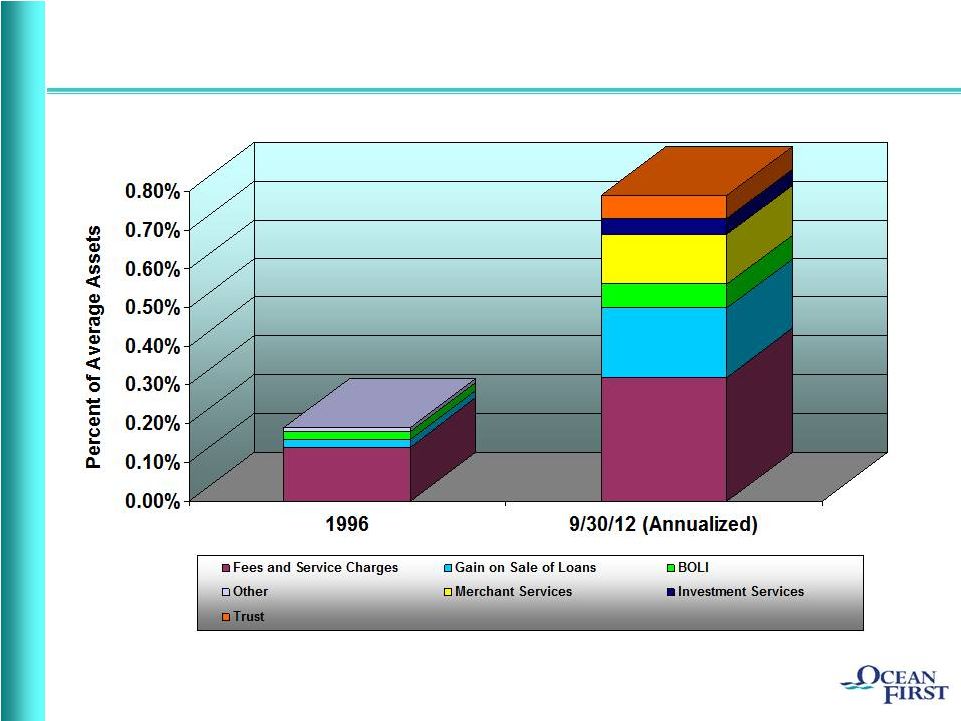
Diversified Streams of Non-Interest Income
Diversified Streams of Non-Interest Income
2011
Non-Interest Income excludes loss from other real estate operations and gain
on sale of equity securities. |
 16
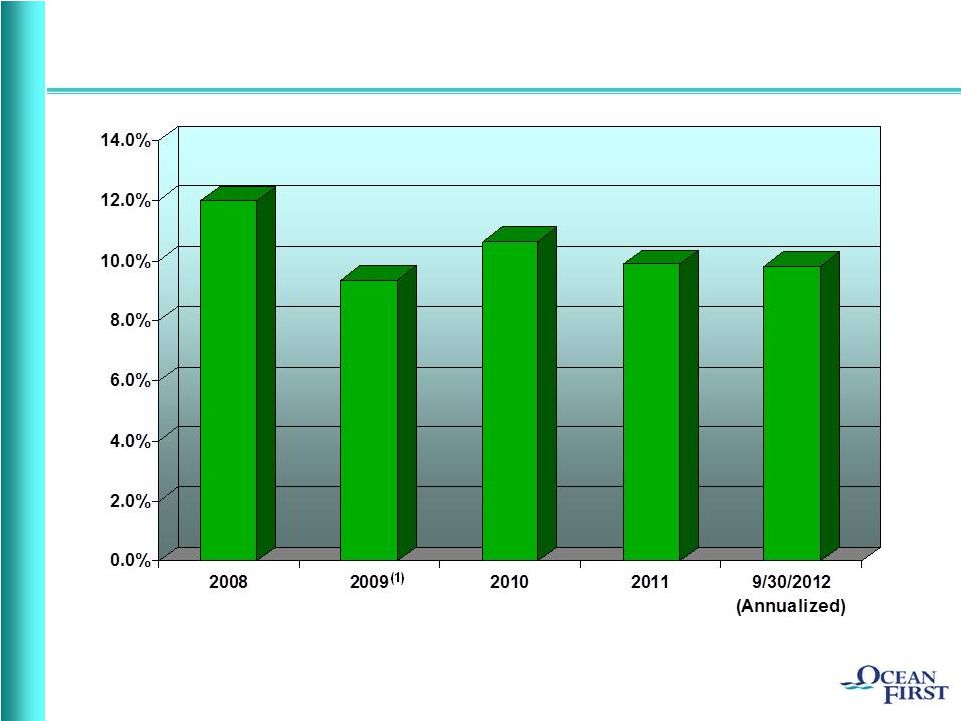
(1) Secondary capital raise restrained ROE
Maintaining Attractive Return on Equity
Maintaining Attractive Return on Equity
NASDAQ: OCFC |
 NASDAQ: OCFC
17
Challenge Today is to Grow Revenue
Challenge Today is to Grow Revenue
Build Shareholder Value
Build Shareholder Value
Target
growth
within
existing
footprint
–
building
market
share
Thirteen
de
novo
branches
since
2000
have
performed
well
–
still
present opportunity for additional growth
Expanding presence in Monmouth County with a full service
Financial Solutions Center in Red Bank to open in Spring 2013
Non-interest income streams have been diversified, ever more
important as margin remains under pressure
Assessing opportunistic roll-up of community banks in market
Share repurchases safely deploy excess capital in the short term
Financial performance to Plan builds value and preserves the right
to remain independent |
 NASDAQ: OCFC
18
(1)
Peers include: DCOM, FFIC, FLIC, HVB, LBAI, ORIT, PBNY, PGC, RCKB, SNBC, STL,
SUBK, UVSP and WSFS Note:
Financial data as of the most recent period available; market data as of November
7, 2012. Source: Sandler O’Neill.
Attractive Valuation Metrics
Attractive Valuation Metrics
OCFC
Peers
(1)
Valuation
Price / Tang. Book Value
109%
118%
Price / LQA EPS
11.8x
12.8x
Price / Estimated EPS
11.4x
12.5x
Cash Dividend Yield
3.6%
3.3% |
 NASDAQ: OCFC
19
Why OCFC…?
Why OCFC…?
Fundamental
franchise
value
–
superior
market
demographics
Experienced crisis tested management team with substantial insider
ownership
–
interests
aligned
with
shareholders
Attractive deposit mix and market share
Conservative credit culture and profile
Solid
financial
performance
–
developing
shareholder
value
Strong balance sheet and capital base
Attractive current valuations |
 20
THANK YOU
FOR YOUR INTEREST IN
OCEANFIRST FINANCIAL CORP.
NASDAQ: OCFC |
 NASDAQ: OCFC
21
Market Demographics
Market Demographics
APPENDIX 1
Ocean
Monmouth
Middlesex
New Jersey
National
Number of Offices
19
4
1
% of OceanFirst Deposits
85.7
11.1
3.2
Market Rank
4
18
34
Market Share (%)
10.6
1.0
0.2
Population
578,728
649,429
794,605
Projected 2010-2015
Population Growth (%)
4.0
2.0
1.8
1.2
3.8
Median Household Income ($)
60,936
82,974
78,561
72,519
54,442
Projected 2010-2015 Median
Household Income Growth (%)
15.5
14.3
17.5
14.7
12.4
Deposit data as of June 30, 2012.
Demographic data as of June 30, 2010.
Source: SNL Financial |
 NASDAQ: OCFC
22
APPENDIX 2
Residential Portfolio Metrics
Residential Portfolio Metrics
As of September 30, 2012, unless
otherwise noted.
One-to-Four Family (1-4)
Average size of mortgage loans
$184,000
Interest-only loans - Amount
$41.4 million
- % of total 1-4 family loans
4.9%
- Weighted average loan-to-value ratio
(using original appraisal) 64%
Stated income loans - Amount
$46.8 million
- % of total 1-4 family
loans 5.6%
Loans in flood hazard area
$213.6 million
- % of total loans
25.8%
- Weighted average loan-to-value ratio
(using latest appraisal) 42%
Portfolio weighted average loan-to-value ratio (using original appraisal)
57%
- Originated for the year ended December 31,
2011 61%
- Originated for the nine months ended September
30, 2012 59%
Average FICO score
747
- Loans originated for the year ended December
31, 2011 764
- Loans originated for the nine months ended
September 30, 2012 766
% of loans outside the New York/New Jersey market
4.9%
% of loans outside Ocean/Monmouth Counties
37.2%
% of jumbo loans at time of origination
44.4%
% of loans for second homes
7.5%
Home equity loan and line balances in flood hazard area
$38.8 million
- % of total equity balances
19.1% |
 NASDAQ: OCFC
23
APPENDIX 2
(Cont’d)
Commercial Portfolio Metrics
Commercial Portfolio Metrics
As of September 30, 2012.
Commercial Real Estate
(CRE)
Average size of CRE loans
$765,000
Largest CRE loan
$17.8
million
(Secured by local university dormitory housing)
Total exposure to CRE in flood hazard area
$91.5
million
-
% Total CRE Portfolio
19.2%
-
Weighted average loan-to-value ratio (using latest appraisal)
44%
Commercial Loans
Average size of commercial loan
$224,000
Largest commercial loan
$5.1
million |
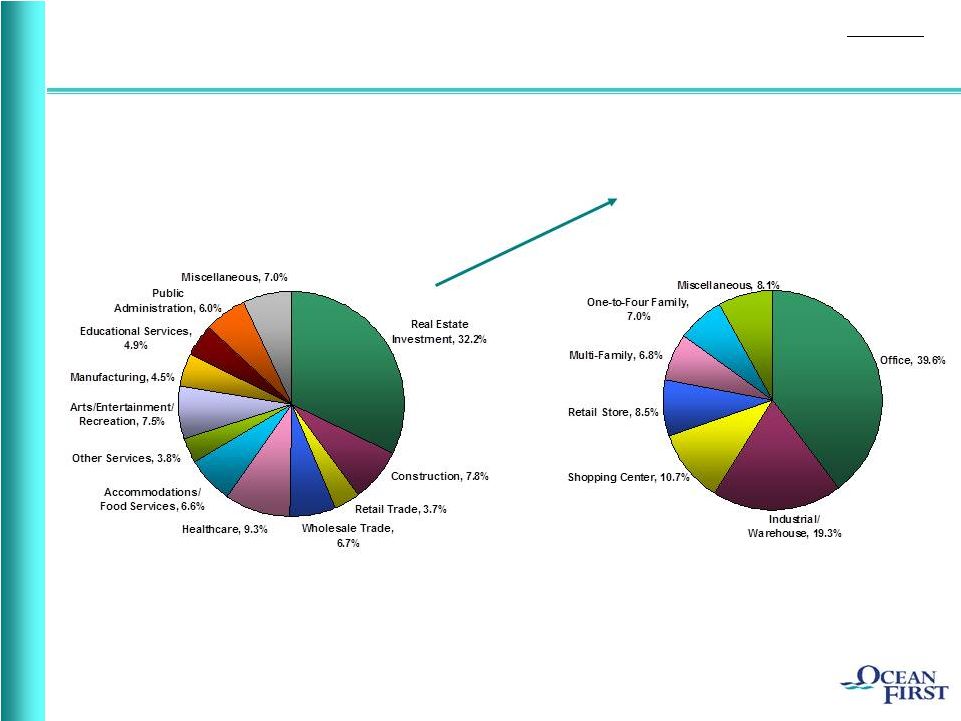 24
Commercial Portfolio Segmentation
Commercial Portfolio Segmentation
Total Commercial Loan Exposure
by Industry Concentration
Real Estate Investment by
Property Concentration
As of September 30, 2012.
APPENDIX 2
(Cont’d)
NASDAQ: OCFC |