Attached files
| file | filename |
|---|---|
| 8-K - FORM 8-K - DORAL FINANCIAL CORP | d435005d8k.htm |
| EX-99.1 - PRESS RELEASE DATED NOVEMBER 9, 2012 - DORAL FINANCIAL CORP | d435005dex991.htm |
 Doral Financial Corporation
Q3 2012 Investor Presentation
November 9, 2012
Exhibit 99.2 |
 Disclaimer
2
This presentation may include forward-looking statements as defined in the
Private Securities Litigation Reform Act of 1995 (the
“PSLRA”). These include comments with respect to our objectives and
strategies, and the results of our operations and our business.
Forward-looking statements can be identified by the fact that they do not relate strictly to historical or current facts.
They
often
include
words
such
as
“expects,”
“anticipates,”
“intends,”
“plans,”
“believes,”
“seeks,”
“estimates,”
or
words
of
similar
meaning,
or
future
or
conditional
verbs
such
as
“will,”
“would,”
“should,”
“could”
or
“may.”
We
intend
these
forward-looking
statements to be covered by the safe harbor provisions of the PSLRA.
Forward-looking statements provide our expectations or predictions of future
conditions, events or results. They are, by their nature, subject to risks
and uncertainties. They are not guarantees of future performance, and actual results may differ materially.
By their nature, these forward-looking statements involve numerous assumptions
and uncertainties, both general and specific, including those discussed in
Doral Financial Corporation’s 2011 Annual Report on Form 10-K and other filings we make with the
Securities and Exchange Commission. Risk factors and uncertainties that could cause
the Company's actual results to differ materially from those described in
forward-looking statements can be found in the Company's 2011 Annual Report on Form 10-K,
which
is
available
in
the
Company's
website
at
www.doralfinancial.com,
as
they
may
be
updated
from
time
to
time
in
the
Company’s periodic and other reports filed with the Securities and Exchange
Commission. The statements in this presentation speak only as of the date
they are made. We do not undertake to update forward-looking
statements
to
reflect
the
impact
of
circumstances
or
events
that
arise
after
the
date
the
forward-looking
statements
were
made,
other than as required by law, including requirements of applicable securities
laws.. |
 Q3
Highlights 3
H
21% quarter over quarter growth in Puerto Rico mortgage originations
o
94% of originations are sold to the secondary market
Asset substitution continues to drive strong US growth
o
$12.4 MM of pre-tax income in Q3
o
Net Income
$(32.5) mm
o
Pre-Tax, Pre-Provision Income
$2.4mm
o
Provisions
$34.4 mm
o
Net Interest Margin
291Bps
o
Book Value per Share
$3.57
o
Tier-1 Leverage Ratio
9.32%
Higher credit costs and provisions overshadowed revenue gains in the quarter. |
 Doral
Financial Corporation Profile 4
Company Overview
Capital Ratios continue to exceed required levels:
o
Tier-1 Leverage Ratio: 9.3%
o
Total Risk-Based Capital Ratio: 13.3%
Book Value of $3.57 per share
o
A valuation allowance against Doral’s remaining deferred tax
asset represents an additional $2.61 per share ($335.7MM)
Business Segment Highlights:
1.
PR Residential:
A leading mortgage originator and servicer.
o
$254MM of mortgage origination, an increase of 21% versus
last quarter. Highest quarterly volume in the past 5-years.
2.
PR Commercial:
A shrinking $837MM portfolio.
o
41% modified coverage ratio against NPLs
3.
US:
A growing 2.5% ROAA business.
o
Net Interest Margin of 416 bps
o
Deposits grew $136 MM to $719 MM
o
NPAs currently at 26 bps
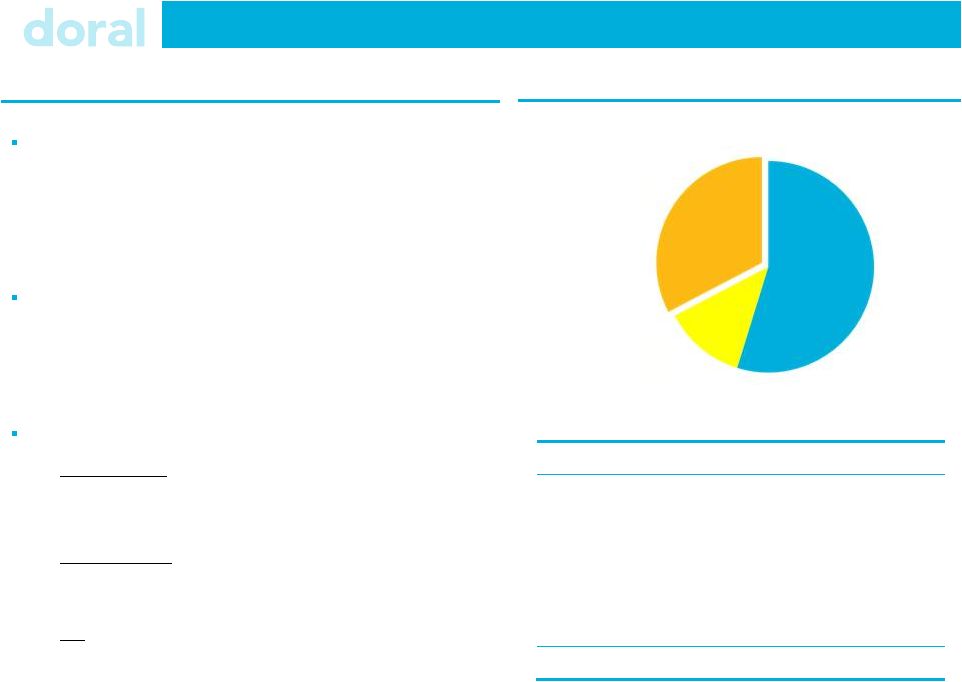
Loan Portfolio Composition ($6.2B)
Loan Portfolio by Geography
$ mm
Loan Category
PR
USA
Total
Residential
$3,602
$12
$3,614
CRE
542
586
1,128
C&I
146
1,431
1,577
Construction &
Development
149
116
265
Consumer / Other
27
-
27
Total
$4,466
$2,145
$6,611
PR Residential
(55%)
US
(33%)
PR Commercial
(12%) |
 Q3
Results Pro forma Income ($MM)
1
3Q ‘12
Net Interest Income
$55.6
Non Interest Income
20.6
Non-Credit, Non Interest Expense
58.2
Pre-Tax, Pre-Credit Income
18.0
Credit Expenses
50.0
Non-Interest Expense
15.6
Provision
34.4
Pre-Tax Income
$(32.0)
Tax
0.5
Reported Net Income
$(32.5)
$32.5MM Net Loss impacted by $50MM of credit
expenses
o
$22MM of provision on TDR residential mortgages
Net Revenue grew by $1.5MM over Q2 driven by
increased yield from asset substitution and lower
deposit costs.
o
Maintained 291 bps Net Interest Margin
o
Total revenue grew to $76.2MM
o
Mortgage loan originations totaled $254MM a 21%
increase over Q2
Non-credit, non-interest expenses include $5MM of
elevated compliance costs.
$50MM of credit expenses include provisions, OREO
and foreclosure expenses.
Credit costs on residential mortgages offset improvements in revenues
5
1
Non-GAAP presentation of financial results
Credit Costs
($ MM)
Provision
$34.4
OREO
7.3
Foreclosure & Legal
5.2
Appraisal, Inspections & Other Loan Costs
3.1
Total
$50.0 |
 Provisions & Credit Ratios
6
Coverage and Modified Coverage Ratios:
$ MM
Loan Balance
Coverage Ratio
1,2
NPL
1
Modified Coverage Ratio
1,3
Residential Mortgage
$3,614
3.2%
$453
40.1 %
Consumer
27
11.4%
-
825.6%
CRE
$1,128
1.9%
191
28.8%
C&I
$1,577
0.7%
2
576.0%
C&D
265
3.3%
107
52.0%
Total
$6,611
2.3%
$753
39.9%
1 Excludes Loans Held for Sale & FHA / VA Loans
2 Coverage Ratio: Reserves / Loan Receivable Balance
3 Modified Coverage Ratio : (Reserves + Partial Charge-offs) / (NPLs + Partial
Charge-offs) Increased provision providing strong coverage and modified
coverage ratios for the portfolio. Credit Provision Distribution by
Portfolio ($ MM)
Portfolio
New Volume
Valuation
Delinquency
Additional Reserve
Total
Residential Mortgage
-
$12.0
$9.8
$7.0
$28.8
Consumer
-
-
0.4
-
$0.4
PR Commercial
-
(0.9)
4.1
-
$3.2
US
$2.0
-
-
-
$2.0
Total
$2.0
$11.1
$14.3
$7.0
$34.4 |
 PR
Residential Mortgage Credit Provisions 7
Puerto Rico Mortgage Portfolio Distribution
($ MM)
Performing
Non-Performing
Total
Core
1
$2,396
$142
$2,538
TDR
1
$362
$267
$629
Total
$2,758
$409
$3,167
Mortgage Provision Distribution
($ MM)
Valuation
Delinquency
Additional
Reserve
Total
Core
$5.6
$1.2
-
$6.8
TDR
$6.4
$8.6
$7.0
$22.0
Total
$12.0
$9.8
$7.0
$28.8
Valuation: $12.0MM
1,181 appraisals processed for $141MM
91% of residential NPLs have received an updated
valuation in the past year.
81% of appraisals received in Q3 updated collateral
values that were greater than 1-year.
Delinquency: $9.8MM
$8.1MM provision driven by performance of $374MM of
Troubled Debt Restructure (TDR) loans that have reached
the payment reset.
$162MM of TDR loans have not yet reached the payment
reset.
Additional Reserve: $7.0MM
$7.0MM additional reserve to address potential future
defaults on $96MM of reset TDR loans that have not yet
reached 6-months post-reset.
Residential
mortgage
provision
driven
by
appraisals
and
TDR
loan
performance.
1
Excludes FHA/VA guaranteed loans and loans held for sale
|
 8
US Growth Platform
Income ($MM)
3Q ’12
Net Interest Income
$21.8
Non Interest Income
1.5
Non Interest Expense
8.9
Provision
2.0
Pre-Tax Income
$12.4
ROAA
2.4%
Net Interest Margin (bps)
416
NPA %
0.26%
Efficiency Ratio
38%
Doral operates a growing, high margin, low delinquency commercial platform in the
US Doral re-established its US operations in 2008
Since the merger of the US entity into Doral Bank in Q4 2011,
Doral’s US business has generated $43.8 MM in pre-tax income
During the past year Doral:
o
Grew loans from $1.4B to $2.1B
o
Grew deposits from $196MM to $719MM
o
Increased quarterly Net Interest Income by $8MM to $22MM
o
Maintained NPAs at $6MM (26 bps)
Loans now yield over 5.25%
Building scale by adding assets and profitability while lowering
the
US division’s efficiency ratio to below 40%
Doral Levered Asset Management (DLAM) has entered into a
partnership agreement to create a new Asset Management
company –
Redan Park Asset Management:
o
Redan Park to act as sub-adviser on over $1B of existing DLAM loans
o
DLAM retains all of its existing loans
o
New partnership creates a growing asset management company that
provides future earnings without significant investment by Doral
|
 9
Executive Summary
TDR residential mortgages drove credit cost volatility
Solid growth in affordable residential mortgage originations
Asset Substitution strategy continues to grow earnings power
Tier-1 Capital exceeds leverage ratio requirements by over $100MM
Additional upside in Book Value per Share through potential future recognition of
Deferred Tax Asset |
 Investor Relations Contact and Conference Replay Details
10
Investor Relations:
Christopher Poulton
212 / 329-3794
christopher.poulton@doralfinancial.com
Conference Call:
10.00 AM EDT November 10, 2012
(800)-230-1093 or (612) 288-0340
Conference Call Replay:
November 9, 2012 –
December 9, 2012
(800) 475-6701 or (320) 365-3844
Replay Code: 270528 |
 Exhibit A
Summary Financials |
 Summary Financials
12
($ mm)
30-Sep-12
30-Jun-12
31-Mar-12
31-
Dec –
11
30-Sep-11
Income Statement
Net Interest Income
55.6
54.1
52.1
49.4
$48.2
Provision for Credit Losses
34.4
5.2
115.2
9.9
41.7
NII After Provisions
21.2
48.9
(63.1)
39.4
6.5
Non-Interest Income
20.6
21.3
16.6
25.3
29.6
Non-Interest Expense
73.8
71.0
63.5
61.7
64.0
Pre-Tax Income
(32.0)
(0.8)
(110.0)
3.1
(27.8)
Taxes
0.5
0.8
(112.6)
(8.6)
2.3
Net Income
(32.5)
(1.6)
2.6
11.7
(30.2)
Pre-Tax Pre-Provision Income
2.4
4.4
5.2
13.0
13.9
Balance Sheet
Total Gross Loans (incl. HFS)
$6,611
$6,487
$6,355
$6,241
$6,111
Loan Loss Reserves
146
153
167
103
118
Total Deposits
4,614
4,538
4,560
4,395
4,349
Total Assets
8,371
8,345
8,093
7,975
8,014
Profitability Metrics
Net Interest Margin
2.91%
2.91%
2.85%
2.67%
2.60%
Capital & Credit Ratios
NPL / Loans
1
11.5%
11.4%
12.1%
9.8%
9.8%
Leverage Ratio
9.32%
9.92%
10.19%
9.13%
8.98%
1 Excludes Residential loans guaranteed by FHA / VA; NPL definition adjusted in Q1
2012 |