Attached files
| file | filename |
|---|---|
| 8-K - FORM 8-K - Cooper-Standard Holdings Inc. | d436108d8k.htm |
 Cooper Standard
Third Quarter 2012 Earnings Call
November 9, 2012
Exhibit 99.1 |
 cooperstandard
2
Forward-Looking Statements
This presentation includes forward-looking statements as contemplated by the
1995 Private Securities Litigation Reform Act, reflecting management’s
current analysis and expectations, based on what are believed to be
reasonable assumptions. The words “estimates,”
“expects,”
“anticipates,”
“projects,”
“plans,”
“intends,”
“believes,”
“forecasts,”
or future or conditional verbs,
such as “will,”
“should,”
“could,”
or “may,”
and variations of such words or similar expressions
are intended to identify forward-looking statements. Forward-looking
statements are not guarantees of future results and may involve known and
unknown risks and uncertainties that may cause actual results to differ
materially from those projected, including, without limitation, the risks
and uncertainties set forth in the Company’s most recent Annual Report on the Form
10-K, subsequent Quarterly Reports on Form 10Q, and other Securities and
Exchange Commission filings.
The forward-looking statements in this presentation are made as of the
date hereof, and the Company does not assume any obligation to update, amend or
clarify them to reflect events, new information or circumstances occurring
after the date hereof. |
 Jeff Edwards
President & CEO
Executive Overview
Third Quarter 2012 |
 cooperstandard
4
Jeff Edwards Introduction
•
Joined Cooper Standard October 15, 2012
•
Twenty-eight plus years in automotive industry
•
Progression of key roles with Johnson Controls, Inc.
including lead automotive positions in Asia and North
America |
 cooperstandard
5
First Hundred Day Plan
•
Global tour to uncover opportunities
•
Review technologies and innovation pipeline
•
Align organization structure
•
Prioritize and accelerate initiatives for growth
•
Grow Asian business
•
Accelerate European turnaround |
 Financial Overview
Third Quarter 2012
Allen Campbell
Chief Financial Officer |
 cooperstandard
Q3 and Year-to-Date 2012 Revenue
7
$ USD Millions
Q3 2011 Revenue: $708.5
Q3 2012 Revenue: $684.0
YTD 2011 Revenue: $2,157.8
YTD 2012 Revenue: $2,183.8
Note: Numbers subject to rounding |
 cooperstandard
Q3 and Year-to-Date 2012 Performance
8
$ USD Millions, except per share amounts
Q3 2011
Q3 2012
YTD 2011
YTD 2012
Sales
708.5
684.0
2,157.8
2,183.8
Gross Profit
108.6
103.1
353.0
339.2
SGA
64.4
65.4
190.9
206.4
Operating Profit
33.7
23.6
102.3
105.4
Net Income
15.7
11.6
79.6
112.7
Fully Diluted EPS
$0.58
$0.44
$3.08
$4.63
Adjusted EBITDA
73.4
69.8
257.5
227.1
% Margin
10.4%
10.2%
11.9%
10.4% |
 cooperstandard
9
Cooper Standard Non-consolidated Joint Venture Sales-
Q3 2012
34%
Joint Venture
Partner
Product
Country
Huayu-Cooper Sealing
SAIC/HASCO
Sealing
China
Nishikawa Cooper
Nishikawa Rubber
Sealing
U.S.
Nishikawa Tachaplalert Cooper
Nishikawa Rubber
Sealing
Thailand
Sujan CSF India
Magnum Elastomers
AVS
India
$0
$30
$60
$90
$120
Q3 2011
Q3 2012
$88
$118
Providing products to Japanese, Chinese and Indian OEMs
|
 cooperstandard
10
Q3 and Year-to-Date 2012 Cash Flow
Note: Numbers subject to rounding
($ USD Millions)
Q3 2012
YTD Q3 2012
Cash from business
42.4
165.4
Pension
funding
-
US
(3.3)
(26.8)
Changes in operating assets & liabilities
(26.3)
(160.6)
Cash provided by / (used in) operations
12.8
(22.0)
Capital expenditures
(33.0)
(91.5)
Cash used in operations including CAPEX
(20.2)
(113.5)
Acquisition of business, net cash acquired
-
(1.1)
Proceeds from sale of assets
0.7
9.0
Dividends –
Preferred Stock
(1.7)
(5.1)
Financing activities
(4.6)
(7.1)
Repurchase of preferred stock
-
(4.9)
Repurchase of common stock
(7.0)
(20.6)
Foreign exchange/other
(1.5)
(0.6)
Net cash used
(34.3)
(143.9)
Cash balance as of 12/31/2011
361.7
Cash balance as of 9/30/2012
217.8
Board of Directors authorizes $25 million share repurchase program
|
 cooperstandard
11
Liquidity as of September 30, 2012
Cash on Balance Sheet
$217.8
ABL Revolver
125.0
Letters of Credit
(27.6)
Total Liquidity
$315.2
Strong balance sheet and liquidity to support growth
•
ABL Revolver undrawn
•
Net leverage = $264.4 million
•
Net leverage ratio = 0.9
•
Interest coverage ratio = 6.8
•
No major debt maturity until 2018
($ USD Millions)
$0
$100
$200
$300
$400
$500
Debt
Cash
$482.2
$217.8 |
 cooperstandard
12
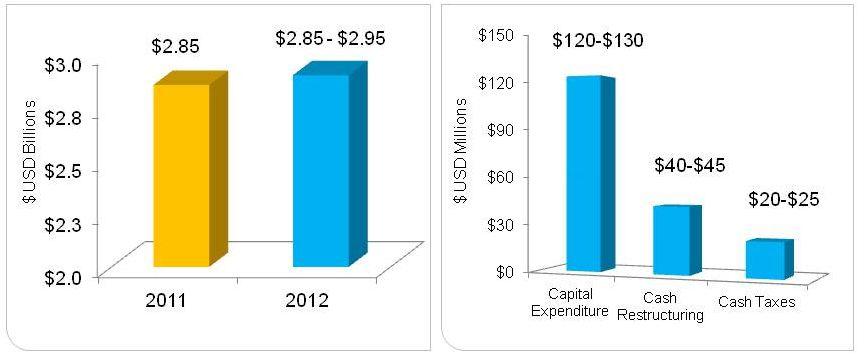
2012 Guidance
* Sales guidance is based on North American production of 15.1 million, and
Europe (including Russia) production of 19.0 million.
Revenue |
 Questions & Answers |
 Appendix |
 cooperstandard
Non-GAAP Financial Measures
15
EBITDA and adjusted EBITDA are measures not recognized under Generally Accepted
Accounting Principles (GAAP) which exclude certain non-cash and
non-recurring items. When analyzing the company’s operating
performance, investors should use EBITDA and adjusted
EBITDA
in
addition
to,
and
not
as
alternatives
for,
net
income
(loss),
operating
income,
or any other performance measure derived in accordance with GAAP, or as an
alternative to cash flow from operating activities as a measure of the
company’s performance. EBITDA and adjusted EBITDA have limitations as
analytical tools and should not be considered in isolation or as substitutes
for analysis of the company’s results of operations as reported under GAAP.
Other companies may report EBITDA and adjusted EBITDA differently and therefore
Cooper Standard’s results may not be comparable to other similarly
titled measures of other companies. |
 cooperstandard
EBITDA and Adjusted EBITDA Reconciliation
16
Note: Numbers subject to rounding
($ USD Millions)
2011
2012
2011
2012
Net income
$15.7
$11.6
$79.6
$112.7
Provision (benefit) for income tax expense
8.0
5.4
26.8
(32.8)
Interest expense, net of interest income
9.6
11.3
30.2
33.3
Depreciation and amortization
31.7
29.1
92.0
91.2
EBITDA
$65.0
$57.4
$228.6
$204.4
Restructuring
(1)
6.5
10.2
48.1
15.8
Noncontrolling
interest
restructuring
(2)
(1.3)
(0.2)
(19.0)
(0.5)
Net
gain
on
partial
sale
of
joint
venture
(3)
-
-
(11.4)
-
Stock-based
compensation
(4)
3.0
2.4
8.3
7.4
Inventory write-up
(5)
-
-
0.7
-
Acquisition costs
(6)
0.2
-
2.2
-
Adjusted EBITDA
$73.4
$69.8
$257.5
$227.1
Three Months
Ended September 30,
Nine Months
Ended September 30,
(1)
Includes non-cash restructuring.
(2)
Proportionate share of restructuring costs related to FMEA joint venture.
(3)
Net gain on partial sale of ownership percentage in joint venture.
(4)
Non-cash stock amortization expense and non-cash stock option expense for grants issued at
emergence from bankruptcy. (5)
Write-up
of
inventory
to
fair
value
for
the
USi,
Inc.
and
the
FMEA
joint
venture,
net
of
noncontrolling
interest.
(6)
Costs incurred in relation to the FMEA joint venture agreement. |
 cooperstandard
17
Net Leverage Ratio as of Sep 30, 2012 -
LTM
(1)
Includes cash and noncash restructuring.
(2)
Proportionate share of restructuring costs related to Cooper Standard France joint
venture. (3)
Non-cash stock amortization expense and non-cash stock option expense for
grants issued at emergence from bankruptcy. (4)
Costs related to corporate development activities.
Note: Numbers subject to rounding
($ USD Millions)
Three Months Ended
Twelve
Months
Ended
Dec 31,
2011
Mar 31,
2012
Jun 30,
2012
Sep 30,
2012
Sep 30,
2012
Net income
$ 23.2
$ 23.8
$ 77.3
$ 11.6
$ 135.9
Provision (benefit) for income tax expense
(6.0)
8.1
(46.2)
5.4
(38.7)
Interest expense, net of interest income
10.3
11.2
10.8
11.3
43.6
Depreciation and amortization
32.1
31.6
30.5
29.1
123.3
EBITDA
$ 59.6
$ 74.7
$ 72.4
$ 57.4
$ 264.1
Restructuring
(1)
4.1
6.1
(0.5)
10.2
19.9
Noncontrolling interest restructuring
(2)
(0.9)
(0.3)
-
(0.2)
(1.4)
Stock-based compensation
(3)
2.5
2.7
2.2
2.4
9.8
Other
(4)
1.3
-
-
-
1.3
Adjusted EBITDA
$ 66.6
$ 83.2
$ 74.1
$ 69.8
$ 293.7
Net Leverage
Debt payable within one year
$ 30.2
Long-term debt
452.0
Less: cash and cash equivalents
(217.8)
Net Leverage
$ 264.4
Net Leverage Ratio
0.9 |
 cooperstandard
18
Adjusted EBITDA as a percent of Sales -
LTM
Note: Numbers subject to rounding
(1)
Includes cash and noncash restructuring.
(2)
Proportionate share of restructuring costs related to Cooper Standard France joint
venture. (3)
Non-cash stock amortization expense and non-cash stock option expense for
grants issued at emergence from bankruptcy. (4)
Costs related to corporate development activities.
($ USD Millions)
Three Months Ended
Twelve
Months
Ended
Dec 31,
2011
Mar 31,
2012
Jun 30,
2012
Sep 30,
2012
Sep 30,
2012
Net income
$ 23.2
$ 23.8
$ 77.3
$ 11.6
$ 135.9
Provision (benefit)for income tax expense
(6.0)
8.1
(46.2)
5.4
(38.7)
Interest expense, net of interest income
10.3
11.2
10.8
11.3
43.6
Depreciation and amortization
32.1
31.6
30.5
29.1
123.3
EBITDA
$ 59.6
$ 74.7
$ 72.4
$ 57.4
$ 264.1
Restructuring
(1)
4.1
6.1
(0.5)
10.2
19.9
Noncontrolling interest restructuring
(2)
(0.9)
(0.3)
-
(0.2)
(1.4)
Stock-based compensation
(3)
2.5
2.7
2.2
2.4
9.8
Other
(4)
1.3
-
-
-
1.3
Adjusted EBITDA
$ 66.6
$ 83.2
$ 74.1
$ 69.8
$ 293.7
Sales
$ 695.7
$ 765.3
$ 734.5
$ 684.0
$ 2,879.5
Adjusted EBITDA as a percent of Sales
10.2% |