Attached files
| file | filename |
|---|---|
| 8-K - FORM 8-K - CONSUMERS ENERGY CO | d434964d8k.htm |
Exhibit 99.1
EEI 47th Annual Financial Conference
November 2012
Zeeland 2007
Foote Hydro 1918
Lake Winds 2012
This presentation is made as of the date hereof and contains “forward-looking statements” as defined in Rule 3b-6 of the Securities Exchange Act of 1934, as amended, Rule 175 of the Securities Act of 1933, as amended, and relevant legal decisions. The forward-looking statements are subject to risks and uncertainties. They should be read in conjunction with “FORWARD-LOOKING STATEMENTS AND INFORMATION” and “RISK FACTORS” sections of CMS Energy’s and Consumers Energy’s Form 10-K for the year ended December 31 and as updated in subsequent 10-Qs. CMS Energy’s and Consumers Energy’s “FORWARD-LOOKING STATEMENTS AND INFORMATION” and “RISK FACTORS” sections are incorporated herein by reference and discuss important factors that could cause CMS Energy’s and Consumers Energy’s results to differ materially from those anticipated in such statements. CMS Energy and Consumers Energy undertake no obligation to update any of the information presented herein to reflect facts, events or circumstances after the date hereof.
The presentation also includes non-GAAP measures when describing CMS Energy’s results of operations and financial performance. A reconciliation of each of these measures to the most directly comparable GAAP measure is included in the appendix and posted on our website at www.cmsenergy.com.
CMS Energy provides financial results on both a reported (Generally Accepted Accounting Principles) and adjusted (non-GAAP) basis. Management views adjusted earnings as a key measure of the company’s present operating financial performance, unaffected by discontinued operations, asset sales, impairments, regulatory items from prior years, or other items. Certain of these items have the potential to impact, favorably or unfavorably, the company’s reported earnings in 2012. The company is not able to estimate the impact of these matters and is not providing reported earnings guidance.
2
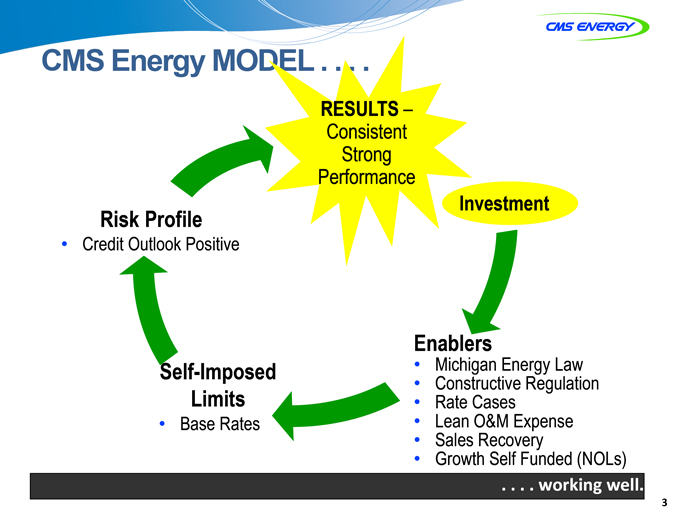
CMS Energy MODEL . . . .
RESULTS –
Consistent
Strong Performance
Risk Profile
Credit Outlook Positive
Investment
Self-Imposed Limits
Base Rates
Enablers
Michigan Energy Law
Constructive Regulation
Rate Cases
Lean O&M Expense
Sales Recovery
Growth Self Funded (NOLs)
....working well.
| 3 |
|
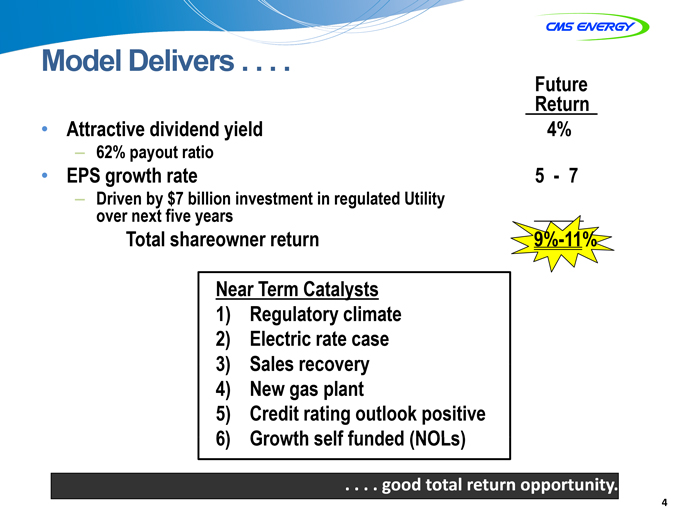
Model Delivers . . . .
Attractive dividend yield
– 62% payout ratio
EPS growth rate
– over Driven next by five $7 billion years investment in regulated Utility
Total shareowner return
Future Return 4%
| 5 |
|
—7 |
9%-11%
Near Term Catalysts
1) Regulatory climate
2) Electric rate case
3) Sales recovery
4) New gas plant
5) Credit rating outlook positive
6) Growth self funded (NOLs)
. . . . good total return opportunity.
| 4 |
|
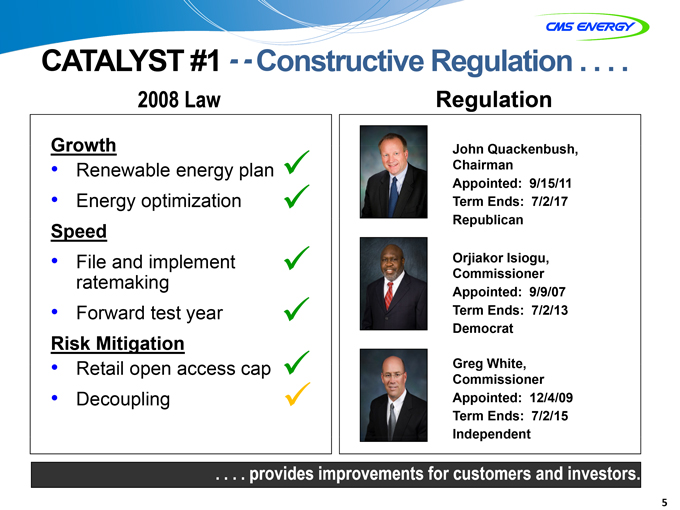
CATALYST #1— Constructive Regulation . . . .
2008 Law Regulation
Growth
Renewable energy plan
Energy optimization
Speed
File and implement ratemaking
Forward test year
Risk Mitigation
Retail open access cap
Decoupling
John Quackenbush, Chairman Appointed: 9/15/11 Term Ends: 7/2/17 Republican
Orjiakor Isiogu, Commissioner Appointed: 9/9/07 Term Ends: 7/2/13 Democrat
Greg White, Commissioner Appointed: 12/4/09 Term Ends: 7/2/15 Independent
. . . . provides improvements for customers and investors.
| 5 |
|
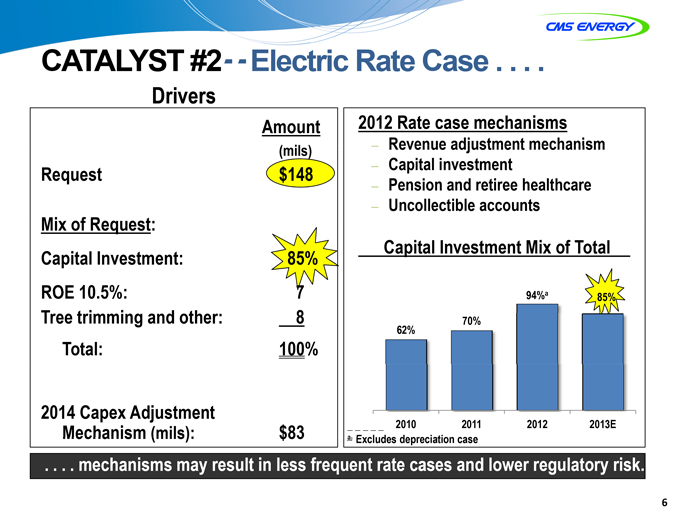
CATALYST #2— Electric Rate Case . . . .
Drivers
Request
Mix of Request: Capital Investment: ROE 10.5%: Tree trimming and other: Total:
2014 Capex Adjustment Mechanism (mils):
Amount
(mils)
$148
85% 7 8 100%
$83
2012 Rate case mechanisms
Revenue adjustment mechanism
– Capital investment
– Pension and retiree healthcare
– Uncollectible accounts
Capital Investment Mix of Total
94%a 85% 70% 62%
_ 2010 2011 2012 2013E
a Excludes depreciation case
. . . . mechanisms may result in less frequent rate cases and lower regulatory risk.
| 6 |
|
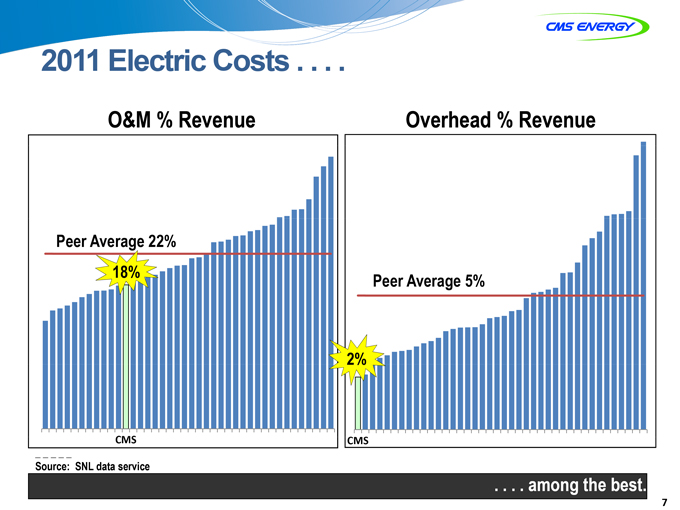
2011 Electric Costs . . . .
O&M % Revenue
Overhead % Revenue
Peer Average 22% 18%
Peer Average 5%
2%
CMS
CMS
Source: SNL data service
. . . . among the best.
| 7 |
|
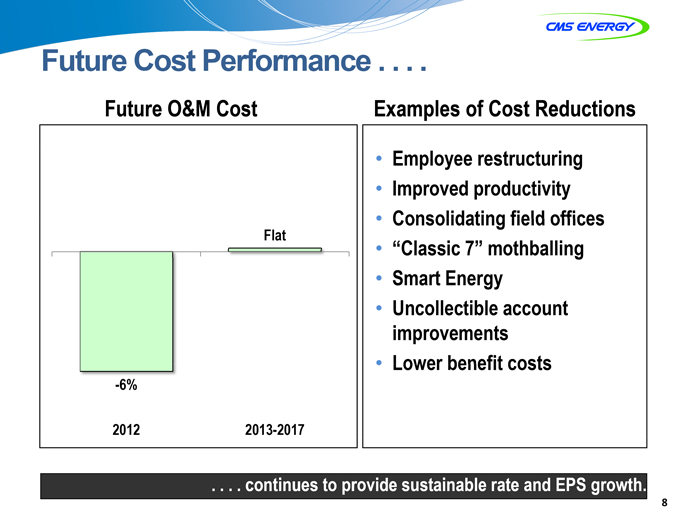
Future Cost Performance . . . .
Future O&M Cost
Examples of Cost Reductions
Flat
-6%
2012 2013-2017
Employee restructuring
Improved productivity
Consolidating field offices
“Classic 7” mothballing
Smart Energy
Uncollectible account improvements
Lower benefit costs
. . . . continues to provide sustainable rate and EPS growth.
| 8 |
|
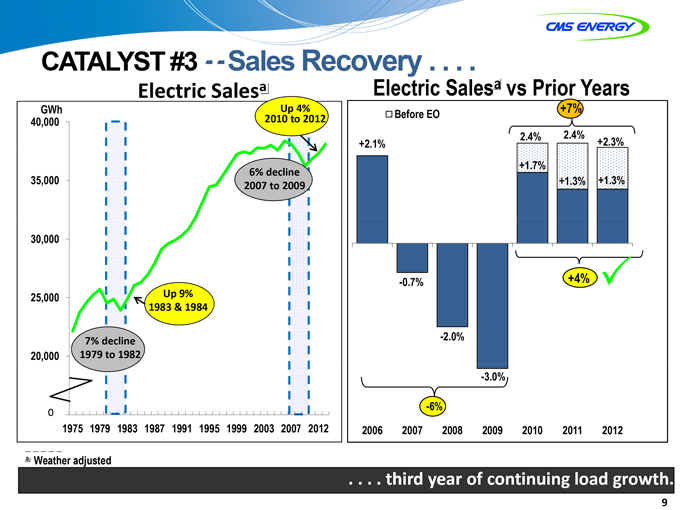
CATALYST #3 — Sales Recovery . . . .
Electric Salesa Electric Salesa vs Prior Years
Up 4% +7%
GWh
Up 4%
40,000 2010 to 2012
6% decline
35,000 2007 to 2009
30,000
25,000 Up 9%
1983 & 1984
7% decline
20,000 1979 to 1982
0
1975 1979 1983 1987 1991 1995 1999 2003 2007 2012
Before EO +7%
2.4% 2.4%
+2.1% +2.3%
+1.7%
+1.3% +1.3%
-0.7% +4%
-2.0%
-3.0%
-6%
2006 2007 2008 2009 2010 2011 2012
a Weather adjusted
. . . . third year of continuing load growth.
9
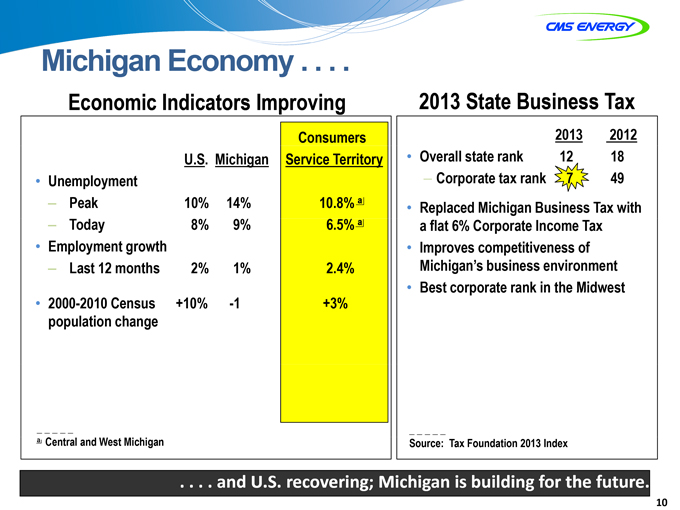
Michigan Economy . . . .
Economic Indicators Improving
2013 State Business Tax
Unemployment
Peak
Today
Employment growth
Last 12 months
2000-2010 Census
population change
U.S.
10%
8%
2%
+10%
Michigan
14%
9%
1%
-1
Consumers
Service Territory
10.8% a
6.5% a
2.4%
+3%
a Central and West Michigan
2013 2012
Overall state rank 12 18
– Corporate tax rank 7 49
Replaced Michigan Business Tax with
a flat 6% Corporate Income Tax
Improves competitiveness of
Michigan’s business environment
Best corporate rank in the Midwest
Source: Tax Foundation 2013 Index
. . . . and U.S. recovering; Michigan is building for the future.
10
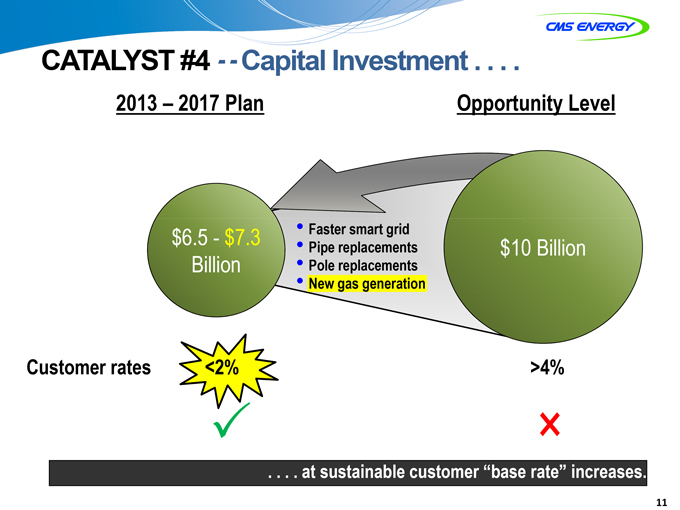
CATALYST #4 — Capital Investment . . . .
2013 – 2017 Plan
Opportunity Level
$6.5—$7.3 Billion
Faster smart grid Pipe replacements Pole replacements New gas generation
$10 Billion
Customer rates <2%
>4%
. . . . at sustainable customer “base rate” increases.
11
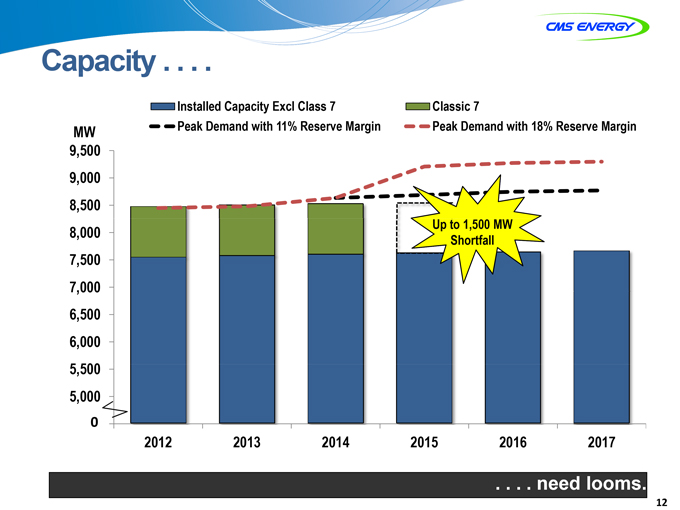
Capacity . . . .
Installed Capacity Excl Class 7 Classic 7
MW Peak Demand with 11% Reserve Margin Peak Demand with 18% Reserve Margin
MW 9,500 9,000 8,500 8,000 7,500 7,000 6,500 6,000 5,500 5,000
0
2012 2013 2014 2015 2016 2017
. . . . need looms.
12
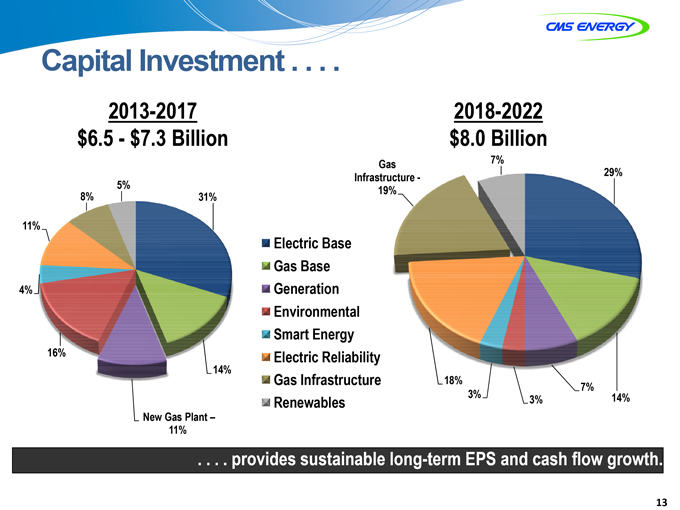
Capital Investment . . . .
2013-2017 $6.5—$7.3 Billion
2018-2022 $8.0 Billion
Electric Base Gas Base Generation Environmental Smart Energy Electric Reliability Gas Infrastructure Renewables
5%
8% 31% 11%
4%
16%
14%
New Gas Plant –11%
Gas 7%
Infrastructure—29% 19%
18%
7%
3% 14% 3%
. . . . provides sustainable long-term EPS and cash flow growth.
13
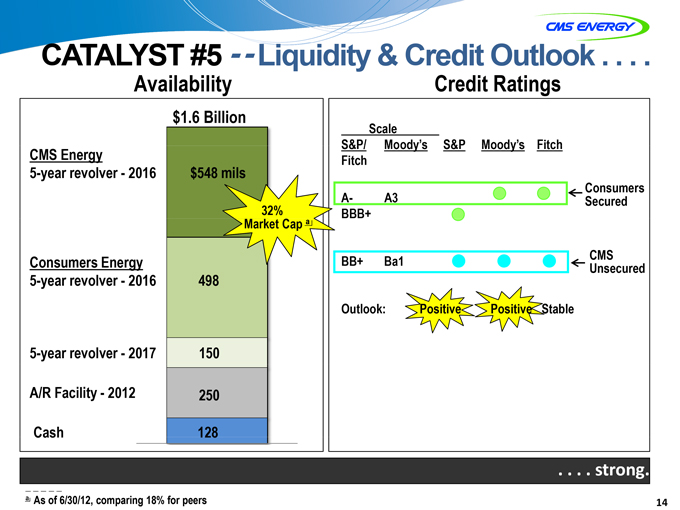
CATALYST #5 — Liquidity & Credit Outlook . . . .
Availability Credit Ratings
CMS Energy
5-year revolver—2016
Consumers Energy
5-year revolver—2016
5-year revolver—2017
A/R Facility—2012
Cash
$1.6 Billion
$548 mils
32%
Market Cap a
498
150
250
128
Scale
S&P/ Moody’s S&P Moody’s Fitch
Fitch
Consumers
A- A3 Secured
BBB+
BB+ Ba1 CMS
Unsecured
Outlook: Positive Positive Stable
. . . . strong.
a As of 6/30/12, comparing 18% for peers
14
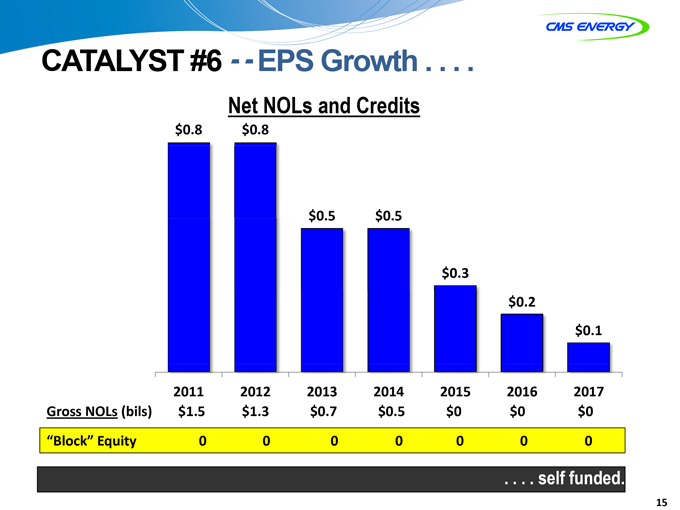
CATALYST #6 — EPS Growth . . . .
Net NOLs and Credits
$0.8 $0.8
$0.5 $0.5
$0.3
$0.2
$0.1
2011 2012 2013 2014 2015 2016 2017
$1.5 $1.3 $0.7 $0.5 $0 $0 $0
0 0 0 0 0 0 0
Gross NOLs (bils)
“Block” Equity
. . . . selfelf funded.
15
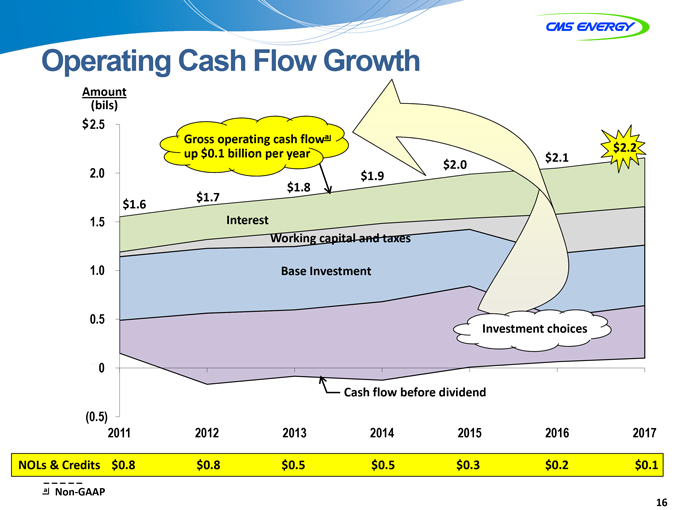
Operating Cash Flow Growth
Gross operating cash flowa up $0.1 billion per year
Investment choices
Amount (bils) $2.5
2.0
1.5
1.0
0.5 0 (0.5)
2011 2012 2013 2014 2015 2016 2017
$1.7
$1.8
$1.6
$1.9
$2.0
$2.2
Interest
Working capital and taxes
Business Investment
Cash flow before dividend
NOLs & Credits $0.8 $0.8 $0.5 $0.5 $0.3 $0.2 $0.1
a Non-GAAP
16
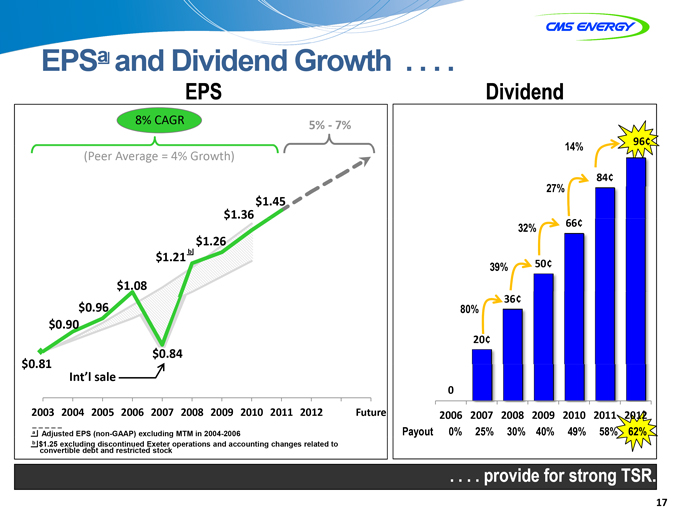
EPSa and Dividend Growth . . . .
EPS Dividend
8% CAGR
5% 7%
(Peer Average = 4% Growth)
$1.45 $1.36
$1.26
b
$1.21
$1.08 $0.96 $0.90
$0.81 $0.84 Int’I sale
2003 2004 2005 2006 2007 2008 2009 2010 2011 2012 Future
14% 96¢
84¢
27%
32% 66¢
39% 50¢
80% 36¢ 20¢
0
2006 2007 2008 2009 2010 2011 2012
Payout 0% 25% 30% 40% 49% 58% 62%
a Adjusted EPS (non-GAAP) excluding MTM in 2004-2006 b $1.25 excluding discontinued Exeter operations and accounting changes related to convertible debt and restricted stock
. . . . provide for strong TSR.
17
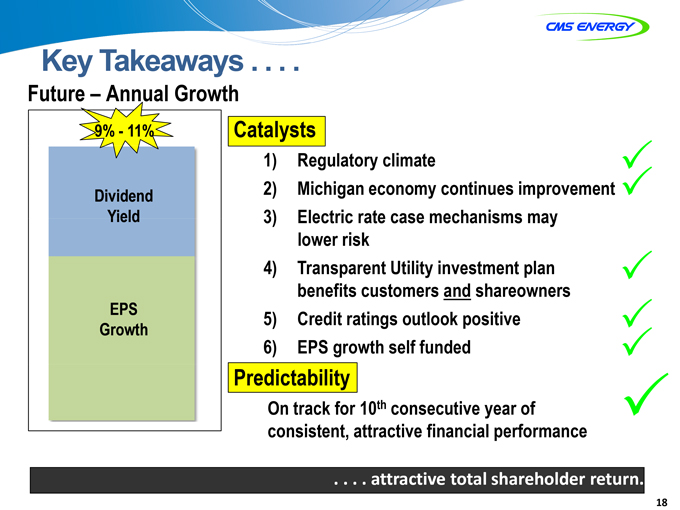
Key Takeaways . . . .
Future – Annual Growth
9%—11%
Dividend Yield
EPS Growth
Catalysts
1) Regulatory climate
2) Michigan economy continues improvement
3) Electric rate case mechanisms may lower risk
4) Transparent Utility investment plan benefits customers and shareowners
5) Credit ratings outlook positive
6) EPS growth self funded
Predictability
On track for 10th consecutive year of consistent, attractive financial performance
. . . . attractive total shareholder return.
18
APPENDIX
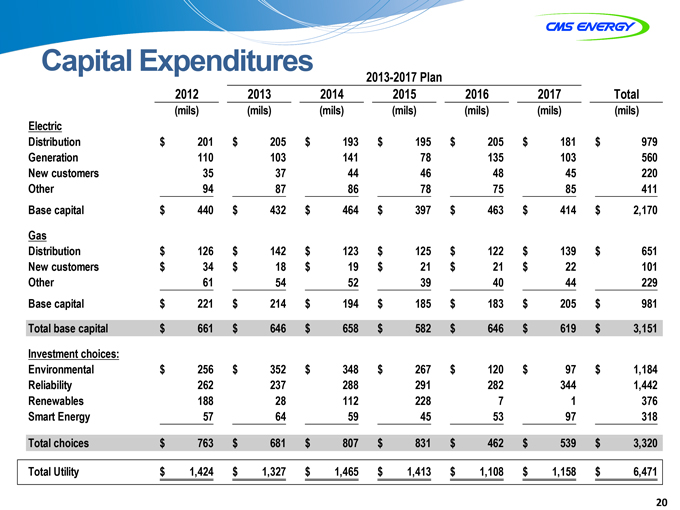
Capital Expenditures
2013-2017 Plan
Electric
Distribution
Generation
New customers
Other
Base capital
Gas
Distribution
New customers
Other
Base capital
Total base capital
Investment choices:
Environmental
Reliability
Renewables
Smart Energy
Total choices
Total Utility
2012
(mils)
$201
110
35
94
$ 440
$ 126
$ 34
61
$ 221
$ 661
$ 256
262
188
57
$ 763
$ 1,424
2013
(mils)
$ 205
103
37
87
$ 432
$ 142
$ 18
54
$ 214
$ 646
$ 352
237
28
64
$ 681
$ 1,327
2014
(mils)
$ 193
141
44
86
$ 464
$ 123
$ 19
52
$ 194
$ 658
$ 348
288
112
59
$ 807
$ 1,465
2015
(mils)
$ 195
78
46
78
$ 397
$ 125
$ 21
39
$ 185
$ 582
$ 267
291
228
45
$ 831
$ 1,413
2016
(mils)
$ 205
135
48
75
$ 463
$ 122
$ 21
40
$ 183
$ 646
$ 120
282
| 7 |
|
53
$ 462
$ 1,108
2017
(mils)
$ 181
103
45
85
$ 414
$ 139
$ 22
44
$ 205
$ 619
$ 97
344
| 1 |
|
97
$ 539
$ 1,158
Total
(mils)
$ 979
560
220
411
$ 2,170
$ 651
101
229
$ 981
$ 3,151
$ 1,184
1,442
376
318
$ 3,320
$ 6,471
20
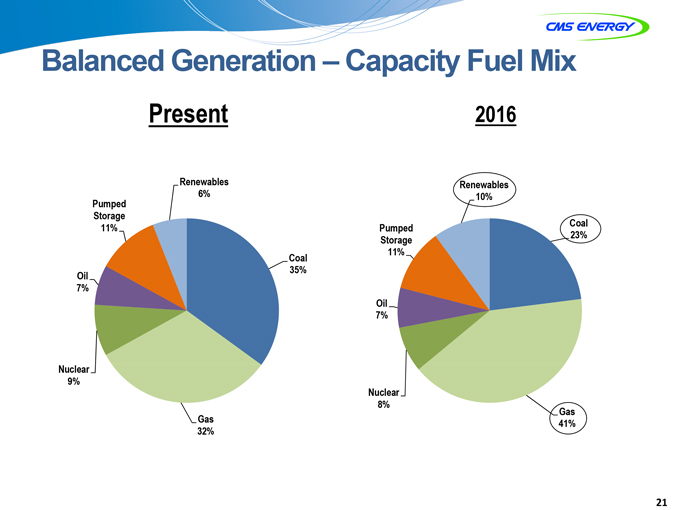
Balanced Generation – Capacity Fuel Mix
Present 2016
Renewables 6% Pumped
Storage 11%
Oil 7%
Nuclear 9%
Gas 32%
Coal 35%
Pumped Storage 11%
Oil 7%
Nuclear 8%
Renewables 10%
Coal 23%
Gas 41%
21
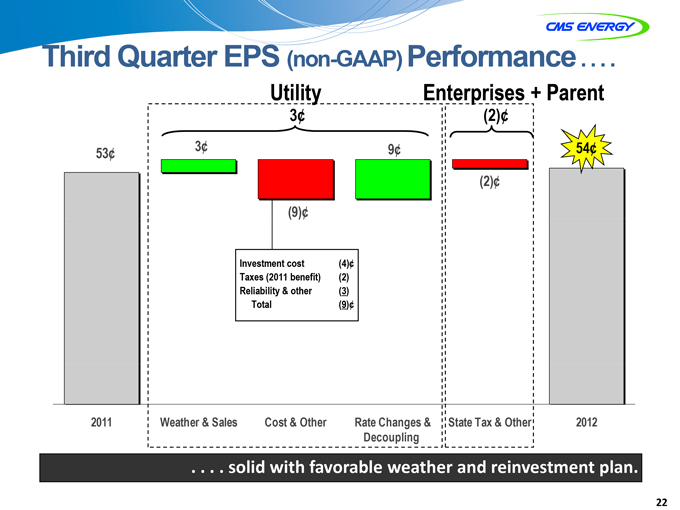
Third Quarter EPS (non-GAAP) Performance. . . .
Utility Enterprises + Parent
| 3¢ |
|
(2)¢ |
| 3¢ |
|
9¢ 53¢ |
| (2)¢ |
|
| (9)¢ |
|
54¢
Investment cost (4)¢ Taxes (2011 benefit) (2) Reliability & other (3) Total (9)¢
2011 Weather & Sales Cost & Other Rate Changes & State Tax & Other 2012 Decoupling
. . . . solid with favorable weather and reinvestment plan.
22
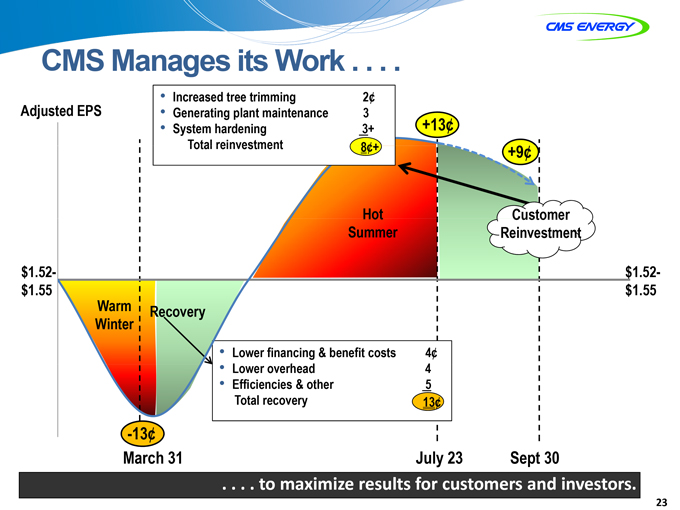
CMS Manages its Work . . . .
Adjusted EPS
Increased tree trimming
Generating plant maintenance
System hardening Total reinvestment
| 2¢ |
|
| 3 |
|
3+
| 8¢ |
|
+13¢
+9¢
Hot Summer
Customer Reinvestment
$1.52-$1.55
$1.52-
$1.55
Warm Winter
Recovery
Lower financing & benefit costs Lower overhead Efficiencies & other Total recovery
| 4¢ |
|
| 4 |
|
| 5 |
|
13 ¢
-13¢
March 31
July 23
Sept 30
. . . . to maximize results for customers and investors.
23
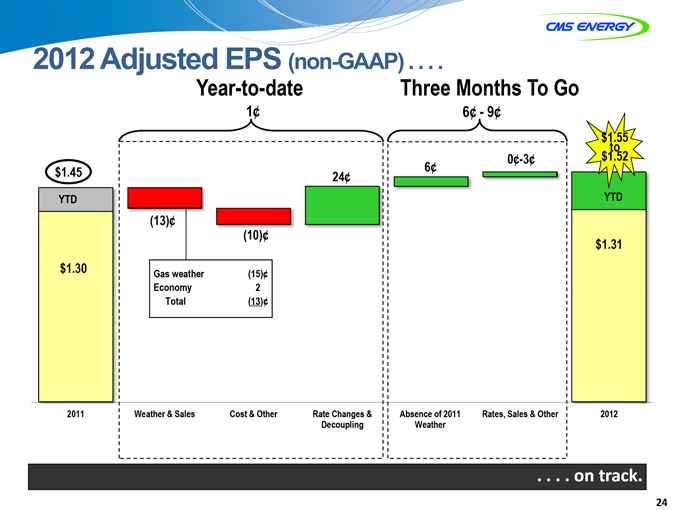
2012 Adjusted EPS (non-GAAP) . . . .
Year-to-date
Three Months To Go
| 1¢ |
|
6¢—9¢ |
$1.45
YTD
$1.30
2011
| (13)¢ |
|
Gas weather
Economy
Total
Weather & Sales
| (10)¢ |
|
| (15)¢ |
|
| 2 |
|
| (13)¢ |
|
Cost & Other
24¢
Rate Changes &
Decoupling
| 6¢ |
|
Absence of 2011
Weather
0¢-3¢
Rates, Sales & Other
$1.55
To
$1.52
YTD
$1.31
2012
. . . . on track.
24
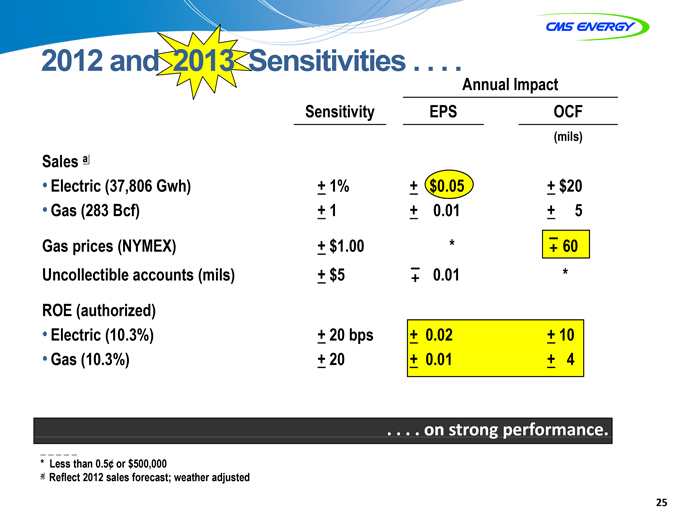
2012 and 2013 Sensitivities . . . .
Annual Impact
Sales a
Electric (37,806 Gwh)
Gas (283 Bcf)
Gas prices (NYMEX)
Uncollectible accounts (mils)
ROE (authorized)
Electric (10.3%)
Gas (10.3%)
Sensitivity
+ 1%
+ 1
+ $ 1.00
+ $ 5
+ 20 bps
+ 20
EPS
+ $0.05
+ 0.01
| * |
|
–+ 0.01
+ 0.02
+ 0.01
OCF
(mils)
+ $20
+ 5
+ 60
| * |
|
+ 10
+ 4
. . . . on strong performance.
| * |
|
Less than 0.5 or $500,000 a Reflect 2012 sales forecast; weather adjusted |
25

GAAP RECONCILIATION
CMS ENERGY CORPORATION
Earnings Per Share By Year GAAP Reconciliation
(Unaudited)
| 2003 |
2004 |
2005 |
2006 |
2007 |
2008 |
2009 |
2010 |
2011 |
||||||||||||||||||||||||||||
| Reported earnings (loss) per share - GAAP |
($ | 0.30 | ) | $ | 0.64 | ($ | 0.44 | ) | ($ | 0.41 | ) | ($ | 1.02 | ) | $ | 1.20 | $ | 0.91 | $ | 1.28 | $ | 1.58 | ||||||||||||||
| After-tax items: |
||||||||||||||||||||||||||||||||||||
| Electric and gas utility |
0.21 | (0.39 | ) | — | — | (0.07 | ) | 0.05 | 0.33 | 0.03 | 0.00 | |||||||||||||||||||||||||
| Enterprises |
0.74 | 0.62 | 0.04 | (0.02 | ) | 1.25 | (0.02 | ) | 0.09 | (0.03 | ) | (0.11 | ) | |||||||||||||||||||||||
| Corporate interest and other |
0.16 | (0.03 | ) | 0.04 | 0.27 | (0.32 | ) | (0.02 | ) | 0.01 | * | (0.01 | ) | |||||||||||||||||||||||
| Discontinued operations (income) loss |
(0.16 | ) | 0.02 | (0.07 | ) | (0.03 | ) | 0.40 | (*) | (0.08 | ) | 0.08 | (0.01 | ) | ||||||||||||||||||||||
| Asset impairment charges, net |
— | — | 1.82 | 0.76 | 0.60 | — | — | — | — | |||||||||||||||||||||||||||
| Cumulative accounting changes |
0.16 | 0.01 | — | — | — | — | — | — | — | |||||||||||||||||||||||||||
| Adjusted earnings per share, including MTM - non-GAA |
$ | 0.81 | $ | 0.87 | $ | 1.39 | $ | 0.57 | $ | 0.84 | $ | 1.21 | (a) | $ | 1.26 | $ | 1.36 | $ | 1.45 | |||||||||||||||||
| Mark-to-market impacts |
0.03 | (0.43 | ) | 0.51 | ||||||||||||||||||||||||||||||||
| Adjusted earnings per share, excluding MTM - non-GAA |
NA | $ | 0.90 | $ | 0.96 | $ | 1.08 | NA | NA | NA | NA | NA | ||||||||||||||||||||||||
| * | Less than $500 thousand or $0.01 per share. |
| (a) | $1.25 excluding discontinued Exeter operations and accounting changes related to convertible debt and restricted stock. |
2003-2011 EPS
CMS ENERGY CORPORATION
Earnings By Quarter and Year GAAP Reconciliation
(Unaudited)
| (In millions, except per share amounts) |
2011 |
|||||||||||||||||||
| 1Q |
2Q |
3Q |
4Q |
YTD Dec |
||||||||||||||||
| Reported net income - GAAP |
$ | 135 | $ | 100 | $ | 139 | $ | 41 | $ | 415 | ||||||||||
| After-tax items: |
||||||||||||||||||||
| Electric and gas utility |
— | — | — | — | — | |||||||||||||||
| Enterprises |
* | (28 | ) | * | 1 | (27 | ) | |||||||||||||
| Corporate interest and other |
— | (4 | ) | — | * | (4 | ) | |||||||||||||
| Discontinued operations income |
(2 | ) | * | * | * | (2 | ) | |||||||||||||
| Adjusted income - non-GAAP |
$ | 133 | $ | 68 | $ | 139 | $ | 42 | $ | 382 | ||||||||||
| Average shares outstanding, basic |
250.0 | 250.3 | 251.3 | 251.7 | 250.8 | |||||||||||||||
| Average shares outstanding, diluted |
261.7 | 261.9 | 263.9 | 265.5 | 263.4 | |||||||||||||||
| Reported earnings per share - GAAP |
$ | 0.52 | $ | 0.38 | $ | 0.53 | $ | 0.15 | $ | 1.58 | ||||||||||
| After-tax items: |
||||||||||||||||||||
| Electric and gas utility |
— | — | — | — | — | |||||||||||||||
| Enterprises |
* | (0.11 | ) | * | * | (0.11 | ) | |||||||||||||
| Corporate interest and other |
— | (0.01 | ) | — | * | (0.01 | ) | |||||||||||||
| Discontinued operations income |
(0.01 | ) | * | * | * | (0.01 | ) | |||||||||||||
| Adjusted earnings per share - non-GAAP |
$ | 0.51 | $ | 0.26 | $ | 0.53 | $ | 0.15 | $ | 1.45 | ||||||||||
| (In millions, except per share amounts) |
2012 |
|||||||||||
| 1Q |
2Q |
3Q |
||||||||||
| Reported net income - GAAP |
$ | 67 | $ | 100 | $ | 148 | ||||||
| After-tax items: |
||||||||||||
| Electric and gas utility |
36 | 7 | * | |||||||||
| Enterprises |
1 | 1 | (3 | ) | ||||||||
| Corporate interest and other |
— | — | — | |||||||||
| Discontinued operations income |
(7 | ) | * | * | ||||||||
| Adjusted income - non-GAAP |
$ | 97 | $ | 108 | $ | 145 | ||||||
| Average shares outstanding, basic |
255.6 | 261.2 | 262.9 | |||||||||
| Average shares outstanding, diluted |
266.9 | 268.2 | 269.0 | |||||||||
| Reported earnings per share - GAAP |
$ | 0.25 | $ | 0.37 | $ | 0.55 | ||||||
| After-tax items: |
||||||||||||
| Electric and gas utility |
0.14 | 0.03 | * | |||||||||
| Enterprises |
0.01 | * | (0.01 | ) | ||||||||
| Corporate interest and other |
— | — | — | |||||||||
| Discontinued operations income |
(0.03 | ) | * | * | ||||||||
| Adjusted earnings per share - non-GAAP |
$ | 0.37 | $ | 0.40 | $ | 0.54 | ||||||
Note: Year-to-date (YTD) EPS may not equal sum of quarters due to share count differences.
| * | Less than $500 thousand or $0.01 per share. |
2012 A-1
CMS Energy Corporation
Earnings Segment Results GAAP Reconciliation
(Unaudited)
| Three Months Ended |
Nine Months Ended |
|||||||||||||||
| September 30 |
2012 |
2011 |
2012 |
2011 |
||||||||||||
| Electric Utility |
||||||||||||||||
| Reported |
$ | 0.61 | $ | 0.61 | $ | 1.10 | $ | 1.18 | ||||||||
| Electric Decoupling Court Order |
— | — | 0.14 | — | ||||||||||||
| Downsizing Program |
* | — | 0.02 | — | ||||||||||||
| Adjusted |
$ | 0.61 | $ | 0.61 | $ | 1.26 | $ | 1.18 | ||||||||
| Gas Utility |
||||||||||||||||
| Reported |
$ | (0.01 | ) | $ | (0.02 | ) | $ | 0.23 | $ | 0.34 | ||||||
| Downsizing Program |
* | — | 0.01 | — | ||||||||||||
| Adjusted |
$ | (0.01 | ) | $ | (0.02 | ) | $ | 0.24 | $ | 0.34 | ||||||
| Enterprises |
||||||||||||||||
| Reported |
$ | 0.02 | $ | 0.02 | $ | 0.03 | $ | 0.14 | ||||||||
| Downsizing Program |
* | — | * | — | ||||||||||||
| Tax Changes |
— | — | — | (0.11 | ) | |||||||||||
| Restructuring Costs and Other |
(0.01 | ) | * | * | * | |||||||||||
| Adjusted |
$ | 0.01 | $ | 0.02 | $ | 0.03 | $ | 0.03 | ||||||||
| Corporate Interest and Other |
||||||||||||||||
| Reported |
$ | (0.07 | ) | $ | (0.08 | ) | $ | (0.22 | ) | $ | (0.24 | ) | ||||
| Tax Changes |
— | — | — | (0.01 | ) | |||||||||||
| Adjusted |
$ | (0.07 | ) | $ | (0.08 | ) | $ | (0.22 | ) | $ | (0.25 | ) | ||||
| Discontinued Operations |
||||||||||||||||
| Reported |
$ | ( | *) | $ | ( | *) | $ | 0.03 | $ | 0.01 | ||||||
| Discontinued Operations Income |
* | * | (0.03 | ) | (0.01 | ) | ||||||||||
| Adjusted |
$ | — | $ | — | $ | — | $ | — | ||||||||
| Totals |
||||||||||||||||
| Reported |
$ | 0.55 | $ | 0.53 | $ | 1.17 | $ | 1.43 | ||||||||
| Discontinued Operations Income |
* | * | (0.03 | ) | (0.01 | ) | ||||||||||
| Electric Decoupling Court Order |
— | — | 0.14 | — | ||||||||||||
| Downsizing Program |
* | — | 0.03 | — | ||||||||||||
| Tax Changes |
— | — | — | (0.12 | ) | |||||||||||
| Restructuring Costs and Other |
(0.01 | ) | * | * | * | |||||||||||
| Adjusted |
$ | 0.54 | $ | 0.53 | $ | 1.31 | $ | 1.30 | ||||||||
| Average Common Shares Outstanding-Diluted (in millions) |
269.0 | 263.9 | 268.1 | 262.3 | ||||||||||||
| * | Less than $0.01 per share. |
2012 A-2
CMS Energy
Reconciliation of Gross Operating Cash Flow to GAAP Operating Activities
(unaudited)
(mils)
| 2011 |
2012 |
2013 |
2014 |
2015 |
2016 |
2017 |
||||||||||||||||||||||
| Consumers Operating Income + Depreciation & Amortization |
$ | 1,527 | $ | 1,655 | $ | 1,729 | $ | 1,839 | $ | 1,951 | $ | 2,007 | $ | 2,100 | ||||||||||||||
| Enterprises Project Cash Flows |
24 | 15 | 25 | 33 | 38 | 44 | 56 | |||||||||||||||||||||
| Gross Operating Cash Flow |
$ | 1,551 | $ | 1,670 | $ | 1,754 | $ | 1,872 | $ | 1,989 | $ | 2,051 | $ | 2,156 | ||||||||||||||
| Other operating activities including taxes, interest payments and working capital |
(382 | ) | (409 | ) | (404 | ) | (422 | ) | (439 | ) | (801 | ) | (806 | ) | ||||||||||||||
| Net cash provided by operating activities |
$ | 1,169 | $ | 1,261 | $ | 1,350 | $ | 1,450 | $ | 1,550 | $ | 1,250 | $ | 1,350 | ||||||||||||||
OCF 2011-17