Attached files
| file | filename |
|---|---|
| 8-K - 8-K - CBRE GROUP, INC. | a12-26468_18k.htm |
Exhibit 99.1
|
|
CBRE Group, Inc. Investor Presentation November 2012 |

|
|
Forward Looking Statements This presentation contains statements that are forward looking within the meaning of the Private Securities Litigation Reform Act of 1995, including statements regarding our future growth momentum, operations, financial performance, and business outlook. These statements should be considered as estimates only and actual results may ultimately differ from these estimates. Except to the extent required by applicable securities laws, we undertake no obligation to update or publicly revise any of the forward-looking statements that you may hear today. Please refer to our third quarter earnings report filed on Form 8-K, our current annual report filed on Form 10-K and our current quarterly report filed on Form 10-Q, in particular any discussion of risk factors or forward-looking statements, which are filed with the SEC and available at the SEC’s website (www.sec.gov), for a full discussion of the risks and other factors that may impact any estimates that you may hear today. We may make certain statements during the course of this presentation, which include references to “non-GAAP financial measures,” as defined by SEC regulations. As required by these regulations, we have provided reconciliations of these measures to what we believe are the most directly comparable GAAP measures, which are attached hereto within the appendix. |
|
|
The Global Market Leader Includes affiliate offices. As of September 30, 2012. Based on 2011 revenues versus Jones Lang LaSalle. Scale and Diversity 1.6x nearest competitor3 Thousands of clients; approximately 80% of the Fortune 100 $159.0 billion of transaction activity in 2011 Broad Capabilities #1 leasing #1 investment sales #1 outsourcing #1 appraisal and valuation #1 commercial mortgage brokerage #1 commercial real estate investment manager $6.5 billion of development projects in process/pipeline2 Leading Global Brand 100+ years 400+ offices in over 60 countries1 #1 in virtually every major global business center Recognized Leadership S&P 500 Only commercial real estate services company in the S&P 500 FORTUNE Only commercial real estate services company in the Fortune 500 The Lipsey Company #1 brand for 11 consecutive years IAOP #1 real estate outsourcing firm Newsweek #1 real estate company in “green” rankings Wall Street Journal best brand reputation in subscriber survey Euromoney global real estate advisor of the year 1. 2. 3. |
|
|
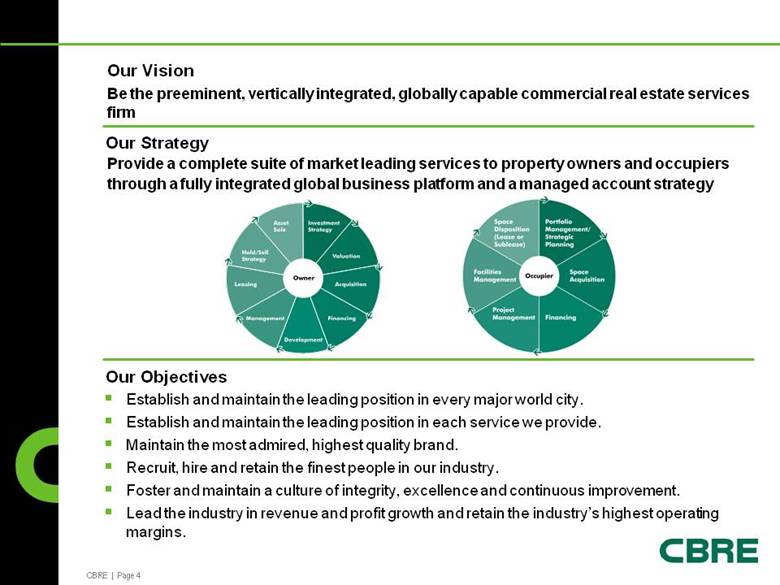
Our Objectives Provide a complete suite of market leading services to property owners and occupiers through a fully integrated global business platform and a managed account strategy Our Strategy Establish and maintain the leading position in every major world city. Establish and maintain the leading position in each service we provide. Maintain the most admired, highest quality brand. Recruit, hire and retain the finest people in our industry. Foster and maintain a culture of integrity, excellence and continuous improvement. Lead the industry in revenue and profit growth and retain the industry’s highest operating margins. Our Vision Be the preeminent, vertically integrated, globally capable commercial real estate services firm |
|
|
Diversified revenue spread across a broad base of clients Diverse Client Base 2011 Revenue by Client Type1 Includes activity from ING Clarion Real Estate Securities (CRES), ING REIM Asia and ING REIM Europe beginning July 1, October 3 and October 31, 2011, respectively. 1. |
|
|
Geographic Diversification #1 commercial real estate services firm in each of the major regions of the world LTM 9/30/12 revenue of $6.3 billion includes $4.4 million of revenue related to discontinued operations. Includes activity from ING REIM Asia and ING REIM Europe beginning October 3 and October 31, 2011, respectively. LTM 9/30/12 Revenue1,2 1. 2. |
|
|
Revenue Diversification Contractual revenue includes: Property & Facilities Management (14% in 2006 and 35% in LTM 9/30/12), Appraisal & Valuation (7% in 2006 and 6% in LTM 9/30/12), Investment Management (6% in 2006 and 7% in LTM 9/30/12), Development Services (1% in both 2006 and LTM 9/30/12) and Other (1% in both 2006 and LTM 9/30/12). Non-contractual revenue includes: Sales (31% in 2006 and 16% in LTM 9/30/12), Leasing (37% in 2006 and 30% in LTM 9/30/12) and Commercial Mortgage Brokerage (3% in 2006 and 4% in LTM 9/30/12). Reflects Trammell Crow Company’s revenue contributions beginning on December 20, 2006. LTM 9/30/12 revenue of $6.3 billion includes $4.4 million of revenue related to discontinued operations. Includes activity from ING REIM Asia and ING REIM Europe beginning October 3 and October 31, 2011, respectively. Contractual revenues1 represented 50% of LTM 9/30/12 revenue, up from 29% in 2006 LTM 9/30/12 Revenue3,4 2006 Revenue2 1. 2. 3. 4. |
|
|
Revenue Breakdown YTD 3rd Quarter 2012 Includes revenue from discontinued operations of $2.4 million for the nine months ended September 30, 2011. Contains recurring revenue aggregating approximately 62% and 60% of total revenue for the three and nine months ended September 30, 2012, respectively. 36% 29% 15% 7% 6% 4% 1% 2% ($ in millions) 2012 2011 USD Local Currency 2012 2011 1 USD Local Currency Property & Facilities Management 2 558.6 521.8 7 11 1,632.7 1,498.7 9 12 Leasing 2 452.6 493.3 -8 -6 1,290.0 1,318.1 -2 - Sales 236.0 254.5 -7 -4 673.7 640.4 5 8 Investment Management 2 105.0 68.4 54 62 335.8 155.2 116 125 Appraisal & Valuation 91.4 91.5 - 4 266.3 256.6 4 7 Commercial Mortgage Brokerage 2 74.4 66.9 11 11 199.5 156.0 28 28 Development Services 15.9 16.4 -3 -3 44.4 47.9 -7 -7 Other 23.2 21.7 7 9 65.9 71.3 -8 -6 Total 1,557.1 1,534.5 1 5 4,508.3 4,144.2 9 11 % Change Three months ended September 30, % Change Nine months ended September 30, 1. 2. |
|
|
Property and Facilities Management Revenue1 ($ in Millions) CAGR = 23% 2 Outsourcing Services Revenue includes property management, facilities management and project management fees. Does not include transaction revenue associated with outsourcing activities. Includes Trammell Crow Company’s revenue for the period from December 20, 2006 through December 31, 2006. Represents combined data for CBRE and Trammell Crow Company; does not include joint ventures and affiliates. Global Square Footage Managed3 (SF in Billions) CAGR = 13% 1. 2. 3. |
|
|
#1 Provider of Every Outsourced Real Estate Service Consulting Property/Facilities Management Project Management Transaction Management Global execution of transactions with a portfolio-wide focus Optimize portfolio Lease administration services Multiple-transaction focus Full service outsourcing Program management One-off integrated transaction management/ project management Moves, adds, changes Sourcing and procurement Operations and maintenance Energy services Health, safety and security Environmental sustainability Client accounting Organizational design Portfolio optimization Workplace strategy Land use analysis and strategy Fiscal and economic impact analysis Clients Total potential available market is estimated to be $50 to $60 billion. |
|
|
Key Facts Leasing Global Leasing Revenue ($ in Millions) Includes Trammell Crow Company’s revenue for the period from December 20, 2006 through December 31, 2006. As of December 31, 2011. Does not include affiliate offices. 1 Approximately 3,7002 leasing professionals worldwide Tailored service delivery by property type and industry/market specialization $66.5 billion global lease transactions in 2011 Occupiers have been deferring making decisions and commitments due to increased uncertainty globally. Generally the U.S. markets softened in Q3 2012 as a result of political/fiscal uncertainty but incremental recovery was still evident. Leasing activity declined in EMEA and Asia Pacific in Q3 2012. 2. |
|
|
Office Leasing Market Outlook forecast Office TW Rent Index; % change versus a year ago Office Vacancy rate; % U.S. Office Rent Forecast and Vacancy |
|
|
Sales Global Sales Revenue ($ in Millions) Includes Trammell Crow Company’s revenue for the period from December 20, 2006 through December 31, 2006. As of December 31, 2011. Does not include affiliate offices. 1 2 Key Facts Approximately 1,8002 investment sales specialists worldwide Specialization across all major property types $92.5 billion global sales in 2011 Investors grew more cautious in Q3 2012 in response to macro uncertainty. Markets seen as safe havens, such as the U.S. and U.K., continued to draw capital. Debt financing remained broadly available in these markets, especially for core assets. |
|
|
Global Transaction Volume Source: CBRE Research (EMEA and Asia Pacific), RCA (Americas); Data excludes Development sites. Updated for Q3 2012. |
|
|
Global Investment Management: CBRE Global Investors GIM Revenue1 ($ in Millions) CAGR =18% Assets Under Management4 ($ in Billions) CAGR =26% Highlights3 ING REIM integration substantially complete YTD Q3 2012 pro-forma normalized EBITDA margin of 32% $90.4 billion in assets under management; YTD 2012 impacted by a large disposal in Q2 $216.8 million of co-investments Includes revenues from discontinued operations. Includes activity from ING CRES, ING REIM Asia and ING REIM Europe, beginning July 1, October 3 and October 31, 2011, respectively. As of September 30, 2012. As of December 31 for each year presented except for Q3 2012, which is as of September 30, 2012. 2. Carried Interest Acquisition, Disposition & Incentive Investment Management 1. 3. 4. |
|
|
Global Investment Programs Description Assets Under Management1,2 ($ in billions) Typical Fee Structure Separate Accounts $23.1 Management fees Transaction fees Incentive fees Sponsored Funds $33.2 Management fees Transaction fees LP profits Carried interest Unlisted Securities $11.9 Management fees Incentive fees Listed Securities $22.2 Management fees Incentive fees As of September 30, 2012. Assets under management (AUM) refers to the fair market value of real estate-related assets with respect to which CBRE Global Investors provides, on a global basis, oversight, investment management services and other advice, and which generally consist of properties and real estate-related loans; securities portfolios; and investments in operating companies, joint ventures and in private real estate funds under its fund of funds program. This AUM is intended principally to reflect the extent of CBRE Global Investors' presence in the global real estate market, and its calculation of AUM may differ from the calculations of other asset managers. 1. 2. |
|
|
Development Services: Trammell Crow Company Revenue1 ($ in Millions) Includes Trammell Crow Company’s operations prior to the acquisition of Trammell Crow Company on December 20, 2006. Also includes revenue from discontinued operations. As of December 31 for each year presented except for Q3 2012, which is as of September 30, 2012. As of September 30, 2012. In Process figures include Long-Term Operating Assets (LTOA) of $1.6 billion for 3Q 12, $1.5 billion for 4Q 11, $1.6 billion for 4Q 10, $1.4 billion for 4Q 09 and $0.4 billion for both 4Q 08 and 4Q 07. LTOA are projects that have achieved a stabilized level of occupancy or have been held 18-24 months following shell completion or acquisition. $6.5 billion in process/pipeline $82.1 million of co-investments $15.7 million in recourse debt to CBRE and repayment guarantees Projects In Process/Pipeline2 ($ in Billions) Key Facts3 4 1. 2. 3. |
|
|
($ in Millions) No reimbursements are included for the period 1992 through 1996, as amounts were immaterial. Reimbursements for 1997 through 2001 have been estimated. For 2002 and forward, reimbursements are included. Includes Insignia activity for the period July 23, 2003 through December 31, 2003. Includes Trammell Crow Company activity for the period December 20, 2006 through December 31, 2006. Includes revenue from discontinued operations, which totaled $2.1 million for the year ended December 31, 2007, $1.3 million for the year ended December 31, 2008, $3.9 million for the year ended December 31, 2010 , $6.7 million for the year ended December 31, 2011 and $4.4 million for the twelve months ended September 30, 2012. Normalized EBITDA excludes merger-related and other non-recurring costs, integration and other costs related to acquisitions, cost containment expenses, one-time IPO-related compensation expense, gains/losses on trading securities acquired in the Trammell Crow Company acquisition and the write-down of impaired assets. Includes EBITDA related to discontinued operations of $6.5 million for the year ended December 31, 2007, $16.9 million for the year ended December 31, 2008, $16.4 million for the year ended December 31, 2010, $14.1 million for the year ended December 31, 2011 and $12.2 million for the twelve months ended September 30, 2012. Includes activity from ING REIM Asia and ING REIM Europe beginning October 3 and October 31, 2011, respectively. ($ in Millions) 1992 – 2011 CAGR = 16% Average Annual Organic Growth of 9% Revenue 1 Normalized EBITDA and Margin 5 1992 – 2011 CAGR = 21% Historical Performance 6 6 6 4 4 4 3 3 4,7 6,7 2 2 4,7 6,7 20 26 34 42 62 90 127 117 151 115 131 183 300 461 653 970 601 454 681 803 882 5.6% 6.6% 7.9% 8.9% 10.6% 11.9% 10.7% 8.4% 9.9% 8.4% 9.6% 10.1% 11.3% 14.4% 16.2% 16.1% 11.7% 10.9% 13.3% 13.6% 14.0% 1992 1993 1994 1995 1996 1997 1998 1999 2000 2001 2002 2003 2004 2005 2006 2007 2008 2009 2010 2011 LTM Q3 2012 Normalized EBITDA Normalized EBITDA Margin 1. 2. 3. 4. 5. 6. 7. |
|
|
Mandatory Amortization and Maturity Schedule $ millions $700.0 million revolver facility matures in May 2015. As of September 30, 2012, the outstanding revolver balance was $72.7 million. As of September 30, 2012 1 Global Cash Revolver Available 1,319 17 71 76 373 424 458 378 370 350 - 250.0 500.0 750.0 1,000.0 1,250.0 1,500.0 Q3 2012 2012 2013 2014 2015 2016 2017 2018 2019 2020 Term Loan A Term Loan A-1 Term Loan B Term Loan C Term Loan D Sr. Subordinated Notes Sr. Unsecured Notes Revolver Current Liquidity |
|
|
Capitalization Excludes $66.9 million and $208.1 million of cash in consolidated funds and other entities not available for Company use at September 30, 2012 and December 31, 2011, respectively. Net of original issue discount of $9.9 million and $11.0 million at September 30, 2012 and December 31, 2011, respectively. Represents notes payable on real estate in Development Services that are recourse to the Company. Excludes non-recourse notes payable on real estate of $352.0 million and $359.3 million at September 30, 2012 and December 31, 2011, respectively. Excludes $458.3 million and $713.4 million of aggregate warehouse facilities at September 30, 2012 and December 31, 2011, respectively. ($ in millions) 9/30/2012 12/31/2011 Variance Cash 1 709.4 885.1 (175.7) Revolving credit facility 72.7 44.8 27.9 Senior secured term loan A 280.0 306.2 (26.2) Senior secured term loan A-1 279.3 285.1 (5.8) Senior secured term loan B 294.0 296.3 (2.3) Senior secured term loan C 395.0 398.0 (3.0) Senior secured term loan D 395.0 398.0 (3.0) Senior subordinated notes 2 440.1 439.0 1.1 Senior unsecured notes 350.0 350.0 - Notes payable on real estate 3 13.6 13.6 - Other debt 4 9.1 0.1 9.0 Total debt 2,528.8 2,531.1 (2.3) Stockholders' equity 1,340.4 1,151.5 188.9 Total capitalization 3,869.2 3,682.6 186.6 Total net debt 1,819.4 1,646.0 173.4 As of |
|
|
Business Outlook We believe that the cyclical recovery in commercial real estate is continuing despite the pause in Q3 2012 Outsourcing is expected to deliver solid, consistent growth Transaction activity should follow confidence levels with regard to global economic recovery and employment growth Investment management comparisons will show a smaller benefit from the ING REIM acquisitions in Q4 2012, since they were largely included in Q4 2011 results We continue to expect solid improvement in normalized EBITDA margins for the full year 2012 We now expect full-year 2012 normalized EPS in the range of $1.15 to $1.20 per diluted share |
|
|
Appendix |
|
|
Reconciliation of Normalized EBITDA to EBITDA to Net Income (Loss) Notes: Includes EBITDA related to discontinued operations of $12.2 million for the twelve months ended September 30, 2012, $14.1 million for the year ended December 31, 2011, $16.4 million for the year ended December 31, 2010, $16.9 million for the year ended December 31, 2008 and $6.5 million for the year ended December 31, 2007. Includes interest income related to discontinued operations of $0.1 million for the year ended December 31, 2008 and $0.01 million for the year ended December 31, 2007. Includes depreciation and amortization related to discontinued operations of $0.7 million for the twelve months ended September 30, 2012, $1.2 million for the year ended December 31, 2011, $0.6 million for the year ended December 31, 2010, $0.1 million for the year ended December 31, 2008 and $0.4 million for the year ended December 31, 2007. Includes interest expense related to discontinued operations of $1.9 million for the twelve months ended September 30, 2012, $3.2 million for the year ended December 31, 2011, $1.6 million for the year ended December 31, 2010, $0.6 million for the year ended December 31, 2008 and $1.8 million for the year ended December 31, 2007. Includes provision for income taxes related to discontinued operations of $4.0 million for the twelve months ended September 30, 2012 and the year ended December 31, 2011, $5.4 million for the year ended December 31, 2010, $6.0 million for the year ended December 31, 2008 and $1.6 million for the year ended December 31, 2007. Includes revenue related to discontinued operations of $4.4 million for the twelve months ended September 30, 2012, $6.7 million for the year ended December 31, 2011, $3.9 million for the year ended December 31, 2010, $1.3 million for the year ended December 31, 2008 and $2.1 million for the year ended December 31, 2007. ($ in millions) LTM Q3 2012 2011 2010 2009 2008 2007 Normalized EBITDA 1 881.5 $ 802.6 $ 681.3 $ 453.9 $ 601.2 $ 970.1 $ Less: Integration and other costs related to acquisitions 78.3 68.8 7.2 5.7 16.4 45.2 Cost containment expenses 48.6 31.1 15.3 43.6 27.4 - Write-down of impaired assets 3.5 9.4 11.3 32.5 100.4 - Merger-related charges - - - - - 56.9 Loss on trading securities acquired in the Trammell Crow Company acquisition - - - - - 33.7 EBITDA 1 751.1 693.3 647.5 372.1 457.0 834.3 Add: Interest income 2 8.1 9.4 8.4 6.1 17.9 29.0 Less: Depreciation and amortization 3 161.3 116.9 109.0 99.5 102.9 113.7 Interest expense 4 177.2 153.5 192.7 189.1 167.8 164.8 Write-off of financing costs - - 18.1 29.3 - - Goodwill and other non-amortizable intangible asset impairments 19.8 - - - 1,159.4 - Provision for income taxes 5 178.5 193.1 135.8 27.0 56.9 194.3 Net income (loss) attributable to CBRE Group, Inc. 222.4 $ 239.2 $ 200.3 $ 33.3 $ (1,012.1) $ 390.5 $ Revenue 6 6,276.2 $ 5,912.1 $ 5,119.2 $ 4,165.8 $ 5,130.1 $ 6,036.3 $ Normalized EBITDA Margin 14.0% 13.6% 13.3% 10.9% 11.7% 16.1% Year Ended December 31, 1. 2. 3. 4. 5. 6. |
|
|
Reconciliation of Global Investment Management Pro-forma Normalized EBITDA Nine Months Ended ($ in millions) Septemer 30, 2012 EBITDA 77.9 Add Back: Integration and other costs related to acquisitions 33.3 Normalized EBITDA 111.2 Net accrual of incentive compensation expense related to carried interest revenue not yet recognized 2.3 Pro-forma Normalized EBITDA 113.5 Pro-forma Normalized EBITDA Margin 32% |