Attached files
| file | filename |
|---|---|
| 8-K/A - AMENDMENT NO. 1 TO FORM 8-K - Tower Group International, Ltd. | d436321d8ka.htm |
 1.
Third Quarter 2012
Earnings Call Presentation
Exhibit 99.1 |
 1
Forward-Looking Statements
The Private Securities Litigation Reform Act of 1995 provides a "safe
harbor" for forward-looking statements. This presentation and any
other written or oral statements made by or on behalf of Tower may
include forward-looking statements that reflect Tower's current
views with respect to future events and financial performance. All statements
other than statements of historical fact included in this presentation are
forward-looking statements. Forward-looking statements can
generally be identified by the use of forward-looking terminology such as "may," "will," "plan," "expect,"
"project," "intend," "estimate," "anticipate,"
"believe" and "continue" or their negative or variations or similar terminology.
All forward-looking statements address matters that involve risks and
uncertainties. Accordingly, there are or will be important factors that
could cause the actual results of Tower to differ materially from those indicated in these
statements. Please refer to Tower’s filings with the SEC, including
among others Tower’s Annual Report on Form 10-K for the year
ended December 31, 2011 and subsequent filings on Form 10-Q, for a description of the important factors that
could cause the actual results of Tower to differ materially from those
indicated in these statements. Forward-looking statements
speak only as of the date on which they are made, and Tower undertakes
no obligation to update publicly or revise any forward-looking
statement, whether as a result of new information, future developments or otherwise.
Notes on Non-GAAP Financial Measures
Operating income excludes realized gains and losses, acquisition-related
transaction costs and the results of the reciprocal business, net of
tax. This is a common measurement for property and casualty insurance companies. We
believe this presentation enhances the understanding of our results of
operations by highlighting the underlying profitability of our insurance
business. Additionally, these measures are a key internal management performance
standard. Operating earnings per share is operating income divided by diluted
weighted average shares outstanding. Operating return on equity is
annualized operating income divided by average common stockholders' equity.
Total premiums include gross premiums written through our insurance
subsidiaries and produced as managing general agent on behalf of other
insurance companies, including the reciprocal exchanges. |
 2
Overview of the Operating Results |
 3
Third Quarter Snapshot -
Strong Operating Results
Net Operating Income
•
Net
operating
income
of
$23.8
million
or
$0.62
per
diluted
share
compared
with
operating
loss
of
$15.3 million, or ($0.38) per diluted share same period last year
•
Previously disclosed litigation settlement of $2.9 million after-tax
($0.08 per share) charge was recorded against 3Q operating
results. »
Excluding
the
litigation
charge,
net
operating
income
would
have
been
$26.7
million
or
($0.70)
per diluted share
Gross premiums written and managed
•
$484.8
million,
representing
a
decrease
of
6.6%
primarily
due
to
the
termination
of
two
programs
($51.7
million
from
program
cancelled
in
3Q12
and
$23.3
million
of
assumed
reinsurance business, which was commuted in 4Q11)
•
Excluded these 2 programs, 3Q12 GWP and managed increased by 8.2%
Net loss ratio and combined ratio
•
The net loss ratio excluding the reciprocal exchanges improved to 60.8% from
77.6% •
Excluding the business that Tower manages on behalf of the reciprocal
exchanges, the net combined ratio improved to 96.3% from 112.0%
Continued positive market and pricing trends
•
4.3% premium increase on renewed business (4.0% increase for commercial
excluding programs; 4.5% for personal) |
 4
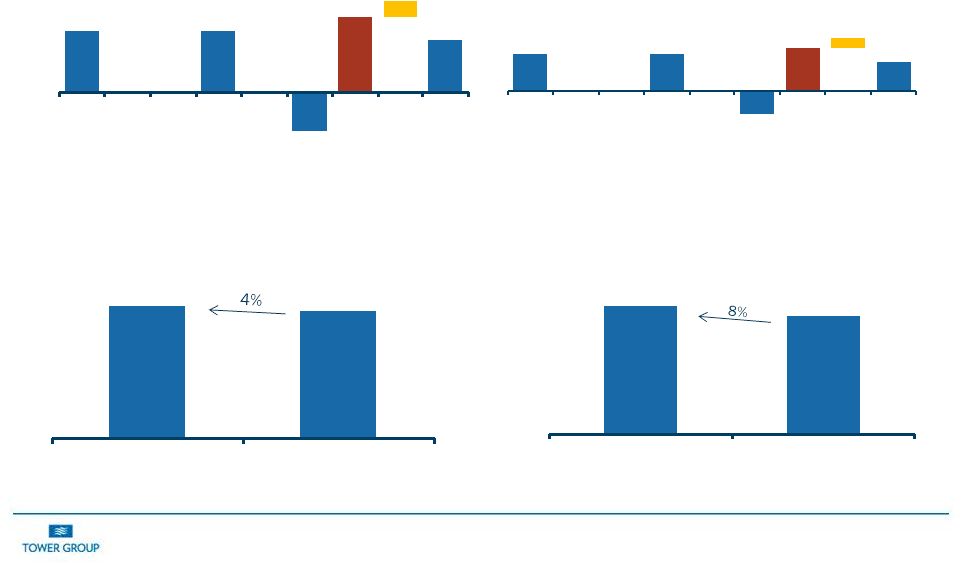
Third Quarter 2012 Highlights
*Stockholders equity reduced by $64.5 million from stock repurchases and
dividends since 3Q11 0.62
0.62
(0.38)
0.72
0.49
0.72
0.15
3Q12
Storms
Dev.
Pro -
Forma
3Q12
3Q11
Storms
Dev.
Pro -
Forma
3Q11
Operating EPS (Loss)
3Q12
3Q11
1,055
1,014
3Q12
3Q11
Stockholders' Equity ($ millions)*
27.49
25.42
3Q12
3Q11
Book Value per Share ($)*
23.8
23.8
(15.3)
29.2
20.2
29.2
6.3
3Q12
Storms
Dev.
Pro -
Forma
3Q12
3Q11
Storms
Dev.
Pro -
Forma
3Q11
Operating Earnings ($ millions)
3Q12
3Q11 |
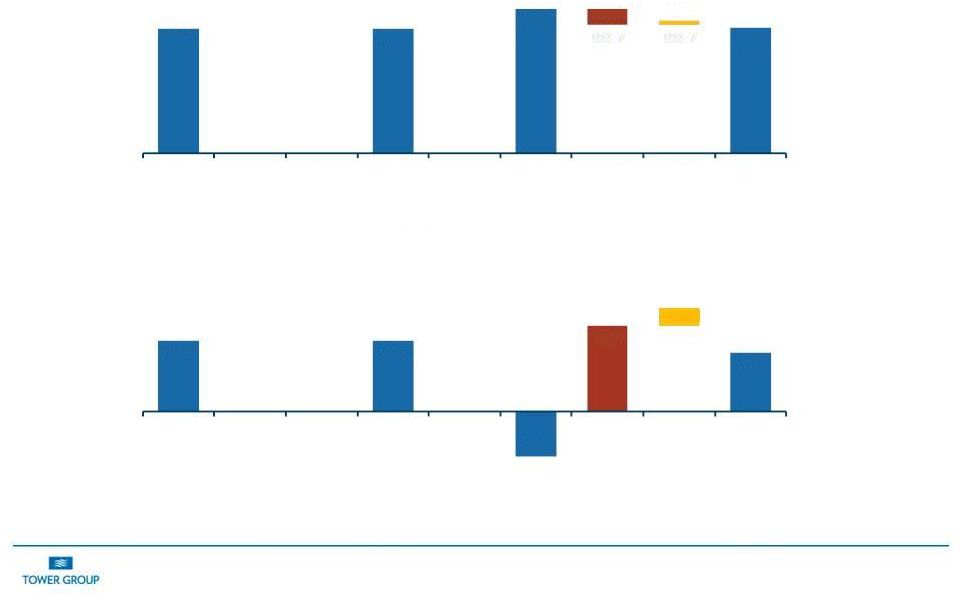 5
Third Quarter Highlights
96.3
96.3
112.0
97.1
-
12.3
-2.6
3Q12
Storms
Dev.
Pro
-
Forma
3Q12
3Q11
Storms
Dev.
Pro
-
Forma
3Q11
Combined Ratio (%)
3Q12
3Q11
9.2
9.2
(5.9)
7.7
11.2
2.4
3Q12
Storms
Dev.
Pro
-
Forma
3Q12
3Q11
Storms
Dev.
Pro
-
Forma
3Q11
Operating ROE (%)
3Q12
3Q11 |
 6
Organic Growth Initiative
Excluding the effects of terminated program and commutation of an assumed
reinsurance treaty GPW were up $40.7 million or 8.2% due to organic
growth initiatives. •
Continued
production
from
newly
created
businesses
including
Assumed
Reinsurance
($39
million of GWP in the third quarter), Customized Solutions and National
Commercial Property business units
•
Forming strategic alliances with Lloyd's syndicates to provide expertise and
to support customized solutions
•
Evaluating industries and customer groups such as construction and affluent
home owners •
Improving product manufacturing capabilities for core products
The Organic Growth Initiative is building momentum by investing in Product,
People and Process
•
Product: Identifying product opportunities from internal research and
customized solutions clients while forming strategic alliances with
companies with specialty product expertise •
People: Recruiting franchise leaders to expand our product offering.
Decentralizing and implementing franchise concept
•
Process: Investing in business development to deliver customized
solutions and in business intelligence
to
conduct
research.
Strengthening cross functional committees and practices.
Investing our processes and practices to improve and drive customer
experience |
 7
Business Segment Results
Commercial
Personal**
Insurance
General
Specialty
Services
Business Units / Products
Small Business;
Middle Market
National Programs, E&S,
Customized Solutions,
Transportation and
Assumed Reinsurance
Homeowners and
Private Passenger
Auto
3Q12 GPW* ($ millions)
$170
$142
$173
$9***
3Q11 GPW* ($ millions)
199
168
152
8***
3Q12 % of total GPW
35%
29%
36%
n/a
Commercial Consolidated
Loss Ratio
60.7%
60.9%
n/a
Expense Ratio
34.6%
38.3%
n/a
Combined Ratio
95.3%
99.2%
n/a
Retention
84%
89%
n/a
Renewal Premium Change
4.0%
4.5%
n/a
Segment
Summary
* Gross premiums written and managed
** Loss, Expense and Combined ratios exclude
reciprocal business ***Total revenue for the segment
Accelerated
focus
on
small
premium size segment
across all lines of business
Focus on eliminating or
improving
pricing
on
unprofitable middle market
business.
Plan
to
reduce
CA WC implemented
Termination of
unprofitable program
business with focus
on profitable
specialty programs
Growth driven
primarily by
assumed
reinsurance
business
Developing products
for affluent personal
lines market
Focus on
emphasizing
homeowners and
package policies and
deemphasizing
monoline auto
Expanding licensing
to expand writings
in other states and
thereby increasing
fee income |
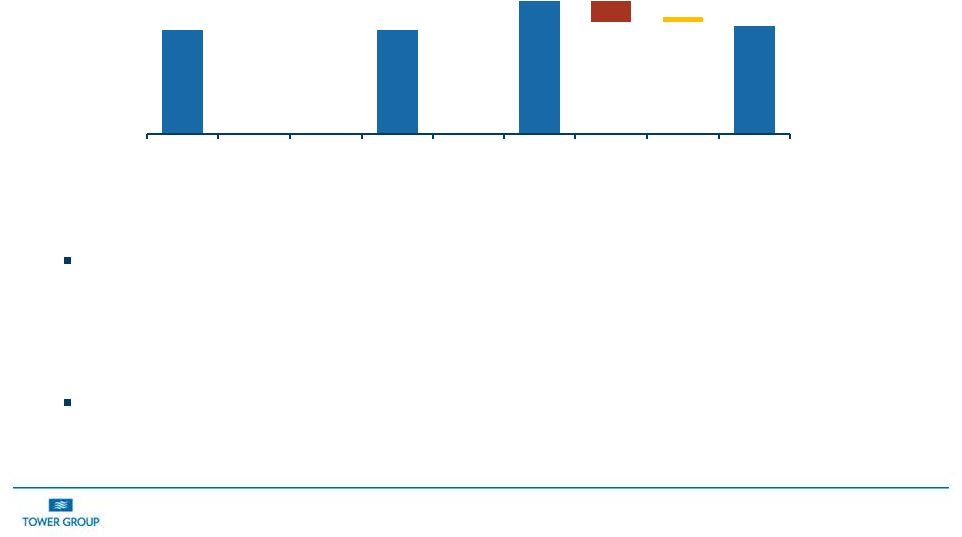 8
Net Loss and Loss Expense Ratio, Excluding Reciprocals
The net loss ratio was 60.8% for the third quarter of 2012 compared to 77.6%
for the third quarter of 2011.
•
Included in the third quarter 2011 loss ratio was 12.3 points associated with
Hurricane Irene and 2.6 points associated with reserve development.
Excluding
the
impact
of
severe
weather
and
reserve
development the
net
loss
ratio improved to 60.8% in 3Q12 compared to 62.7% in 3Q11.
60.8
60.8
77.6
65.3
65.3
62.7
-12.3
-2.6
3Q12
Storms
Dev.
Pro -
Forma
3Q12
3Q11
Storms
Dev.
Pro -
Forma
3Q11
Loss Ratio (%)
3Q12
3Q11 |
 9
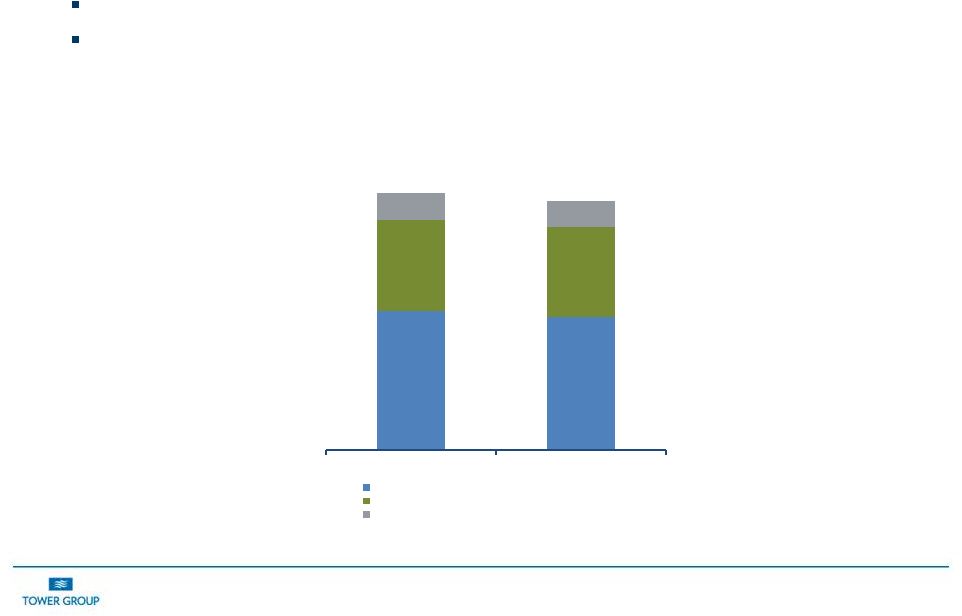
Expense Ratio Excluding Reciprocals
Commission rate higher year over year due to assumed reinsurance.
As
systems
initiatives
relating
to
personal
lines
are
completed,
we
expect
scale
advantage to drive expense ratio down
Note: Excludes reciprocals
19.2%
18.5%
12.5%
12.3%
3.8%
3.6%
35.5%
34.4%
3Q12
3Q11
Commissions, net of ceding commissions
OUE, net of fees
BB&T expenses |
 10
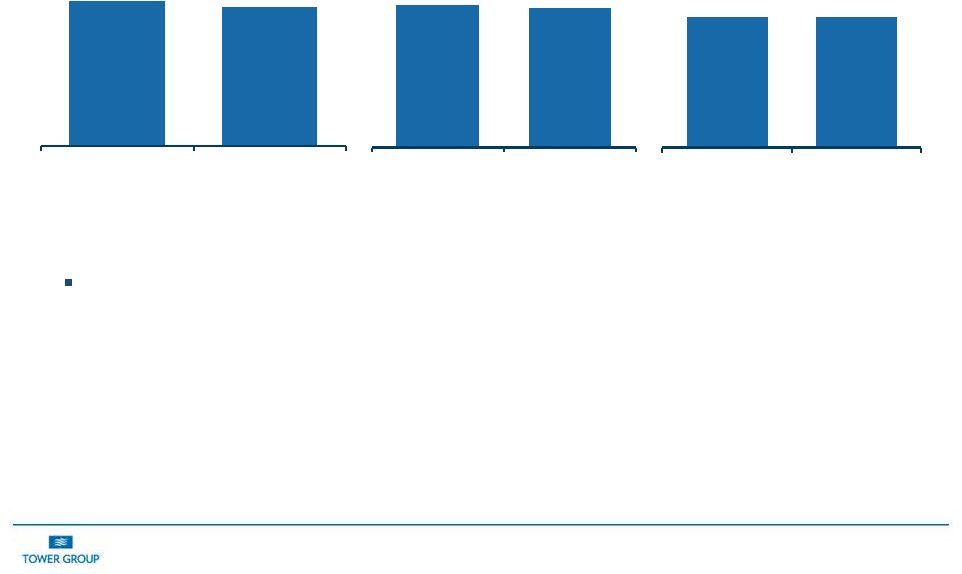
Improving Investment Performance
Note: Cash & Invested Assets, Tax–Equivalent Fixed Income Yield and
Net Investment Income exclude reciprocals $2,562
$2,436
9-30-2012
9-30-2011
Cash and Invested Assets ($millions)
4.6
4.5
9-30-2012
9-30-2011
Tax-
Equivalent Fixed Income
Yield (%)
$30
$30
9-30-2012
9-30-2011
Net Investment Income
($millions)
Alternative investment commitment remains modest but assets are
generating positive returns in 3Q12 and should provide higher yield and
diversification from interest rate risk inherent in fixed-income
investments, and reduce capital markets volatility |
 11
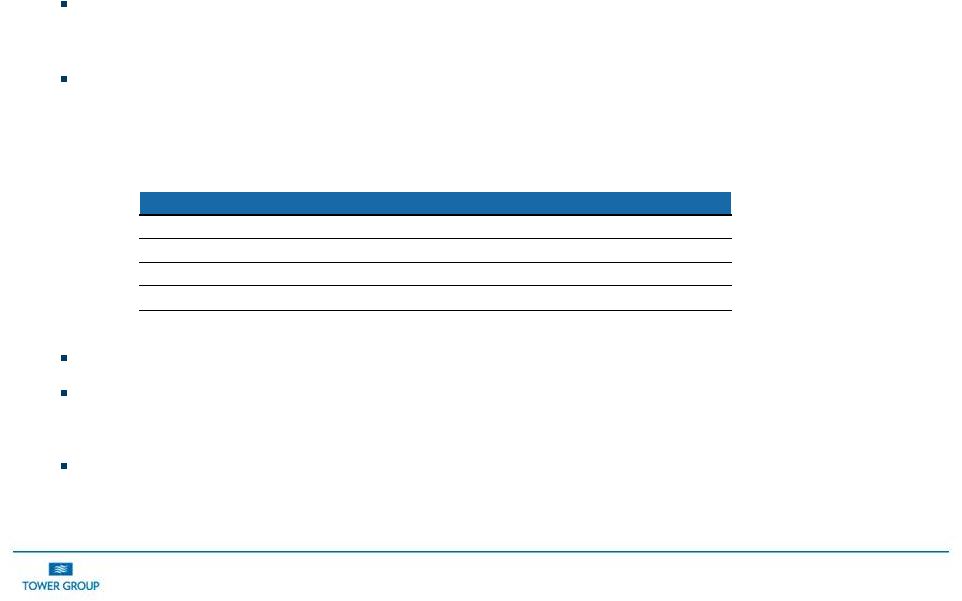
Superstorm Sandy Impact to be Limited due to Tower’s
Catastrophe Reinsurance Program
Tower’s current after-tax estimate of loss ranges from $55 million to
$68 million •
Tower has exposure to Superstorm Sandy through direct insurance operations,
reinsurance assumed businesses and two alternative investments
Tower
expects
its
direct
insurance
loss
to
be
contained
in
its
first
reinsurance
layer
•
Tower expects pre-tax net loss from direct insurance business to be $90 to
$95 million, including reinstatement premiums
•
Direct losses in excess of $75 million pre-tax are ceded to reinsurers as
shown in table below Assumed reinsurance pre-tax losses expected to
be between $15 and $20 million Tower expects to recover $10 million if
industry losses exceed $10 billion and an additional $10 million if
industry losses exceed $15 billion through industry loss warranties that it put
in place in July 2012 to manage risk associated with exposure in
the Northeast
Tower believes its alternative investments will not be materially affected by
the losses associated with Superstorm Sandy
Range of Loss
Retention
Tower Net Loss
$0 - $75 million
Retained by Tower
$75 million
$75 - $150 million
100% reinsured
$75 million
$150 - $225 million
70% reinsured
$75 - $97.5 million
$225 - $400 million
100% reinsured
$75 - $97.5 million |
 12
Update on Proposed Merger Transaction
Merger agreement announced July 30, 2012.
S-4 process is progressing with the SEC. Regulatory approval process is
progressing as well. We hope to be in a position to close the transaction
before year-end. |