Attached files
| file | filename |
|---|---|
| 8-K - FORM 8-K - Bristow Group Inc | d433411d8k.htm |
 Second Quarter FY 2013
Earnings Presentation
Bristow Group Inc.
November 8, 2012
Exhibit 99.1 |
 2
Fourth quarter earnings call agenda
Introduction
CEO remarks and operational highlights
Current and future financial performance
Closing remarks
Questions and answers
Linda McNeill, Director Investor Relations
Bill Chiles, President and CEO
Jonathan Baliff, SVP and CFO
Bill Chiles, President and CEO |
 3
Forward-looking statements
This presentation may contain “forward-looking statements” within the meaning of the
Private Securities Litigation Reform Act of 1995. Forward-looking statements include
statements about our future business, operations, capital expenditures, fleet composition,
capabilities and results; modeling information, earnings guidance, expected operating margins
and other financial projections; future dividends, share repurchase and other uses of excess
cash; plans, strategies and objectives of our management, including our plans and strategies to
grow earnings and our business, our general strategy going forward and our business model;
expected actions by us and by third parties, including our customers, competitors and
regulators; the valuation of our company and its valuation relative to relevant financial
indices; assumptions underlying or relating to any of the foregoing, including assumptions regarding
factors impacting our business, financial results and industry; and other matters. Our
forward-looking statements reflect our views and assumptions on the date of this
presentation regarding future events and operating performance. They involve known and unknown
risks, uncertainties and other factors, many of which may be beyond our control, that may cause
actual results to differ materially from any future results, performance or achievements
expressed or implied by the forward-looking statements. These risks, uncertainties and
other factors include those discussed under the captions “Risk Factors” and
“Management’s Discussion and Analysis of Financial Condition and Results of Operations” in our
Annual Report on Form 10-K for the fiscal year-ended March 31, 2012 and our Quarterly Report
on Form 10-Q for the quarter ended September 30, 2012. We do not undertake any obligation,
other than as required by law, to update or revise any forward-looking statements, whether
as a result of new information, future events or otherwise.
|
 4
Chief Executive Officer comments
Bill
Chiles,
President
and
CEO |
 5
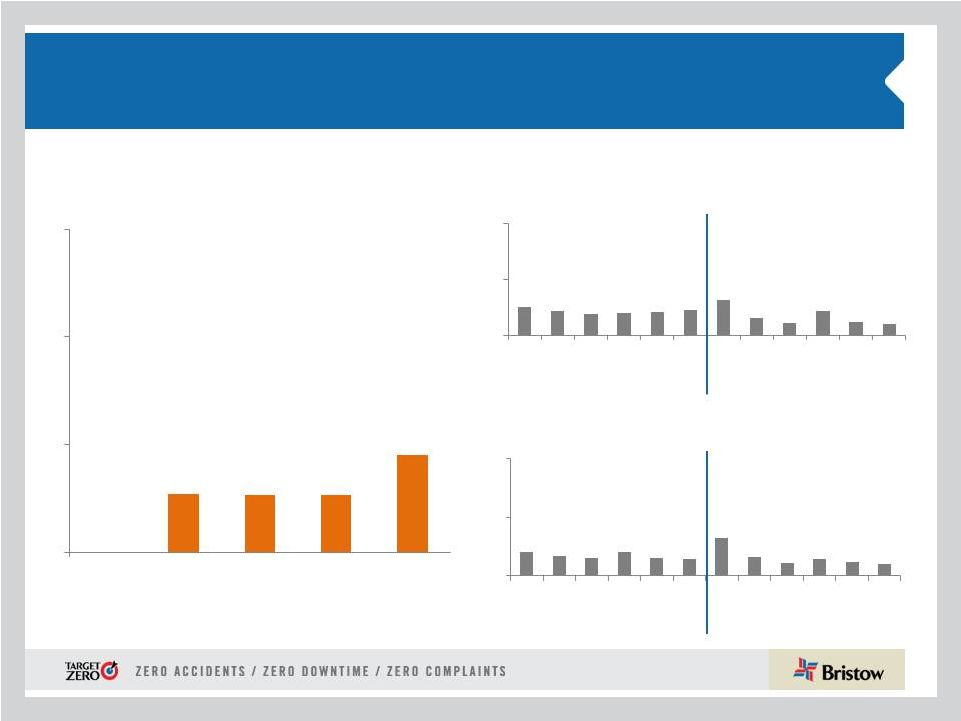
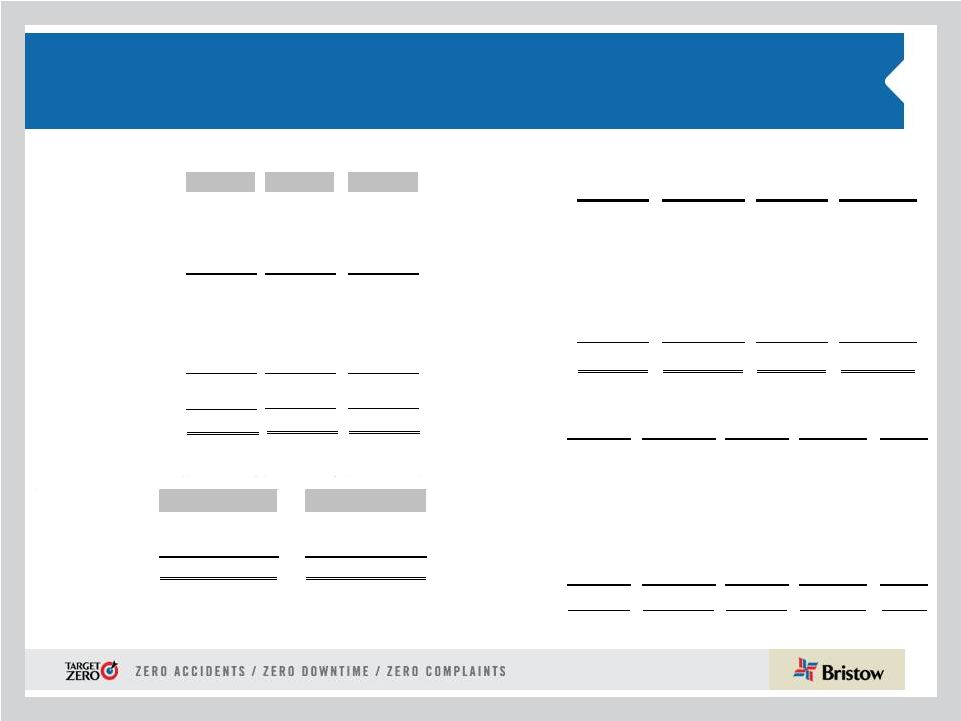
Operational safety review
* Includes consolidated commercial operations only
Total Recordable Injury Rate* per 200,000 man-
hours (cumulative)
Lost Work Case Rate* per 200,000
man-hours (cumulative)
Commercial Air Accident Rate* per 100,000
Flight Hours (Fiscal Year)
FY12
FY12
FY13
FY13
3
2
1
0
0
0.54
0.53
0.53
0.90
FY09
FY10
FY11
FY12
FY13 YTD
0.25
0.22
0.19
0.20
0.21
0.23
0.32
0.16
0.11
0.20
0.22
0.10
0
0.5
1
O
N
D
J
F
M
A
M
J
J
A
S
0
0.5
1
O
N
D
J
F
M
A
M
J
J
A
S
0.2
0.17
0.15
0.20
0.15
0.14
0.20
0.16
0.11
0.14
0.12
0.10 |
 6
Q2 FY13 Highlights
•
The
strong
operating
performance
in
Q1
FY13
continued
in
Q2
FY13
with
record
quarter
and
six
month
operating
revenue
of
$326
million
and
$647
million
•
Cash
flow
from
operations
of
$135
million
up
~
15%
year-over-year
•
Year
to
date
consolidated
BVA**
is
positive
$4
million
with
an
overall
increase
of
$19.4
million
over
FY12
from
increased
revenue
and
margin
improvement
•
The combination of Cougar transaction and recent AS332L/EC225 Super Puma
fleet
challenges
lead
to
FY13
EPS
guidance
being
reaffirmed
at
$3.25
-
$3.55***
•
Q2 operating revenue of $326M (9.7% increase from Q2 FY12, 1.6% increase from Q1
FY13) •
Q2 GAAP EPS of $0.82 (1,071.4% increase from Q2 FY12, 26.2% increase from Q1 FY13) •
Q2
adjusted
EPS*
of
$0.80
(27.0% increase from Q2 FY12, 1.2% decrease from Q1 FY13)
•
Q2
adjusted
EBITDAR*
of
$84.9M
(19.2%
increase
from
Q2
FY12,
0.8%
increase
from
Q1
FY13)
•
Adjusted EPS and adjusted EBITDAR amounts exclude gains and losses on dispositions
of assets and any special items during the period. See reconciliation of these items to GAAP measures in the
appendix hereto and in our earnings release for the quarter ended September 30,
2012. ** Bristow Value Added (BVA) is calculated by taking
Gross Cash Flow less the product of Gross Operating Assets times a capital charge of 10.5%.
*** Please see our earnings release for more information regarding
earnings guidance. |
 7
•
Global economic uncertainty is likely to prevail in the short term
and
we expect to see volatility in the price of
Brent centered around $95-
$110/bbl through 2015
•
A
cyclical
upturn
in
global
exploration
and
production
spending,
led
by international growth, particularly deepwater, is expected to again
be in the range of ~10% in CY13
•
The most active deepwater regions are expected to include areas
where we currently are most active, such as the Gulf of Mexico, Brazil,
and West Africa
•
Helicopter supply remains tight and is exacerbated by the recent
suspension of certain AS332L/EC225 Super Puma a/c operations by
the UK’s Civil Aviation Authority (CAA)
Current market environment |
 8
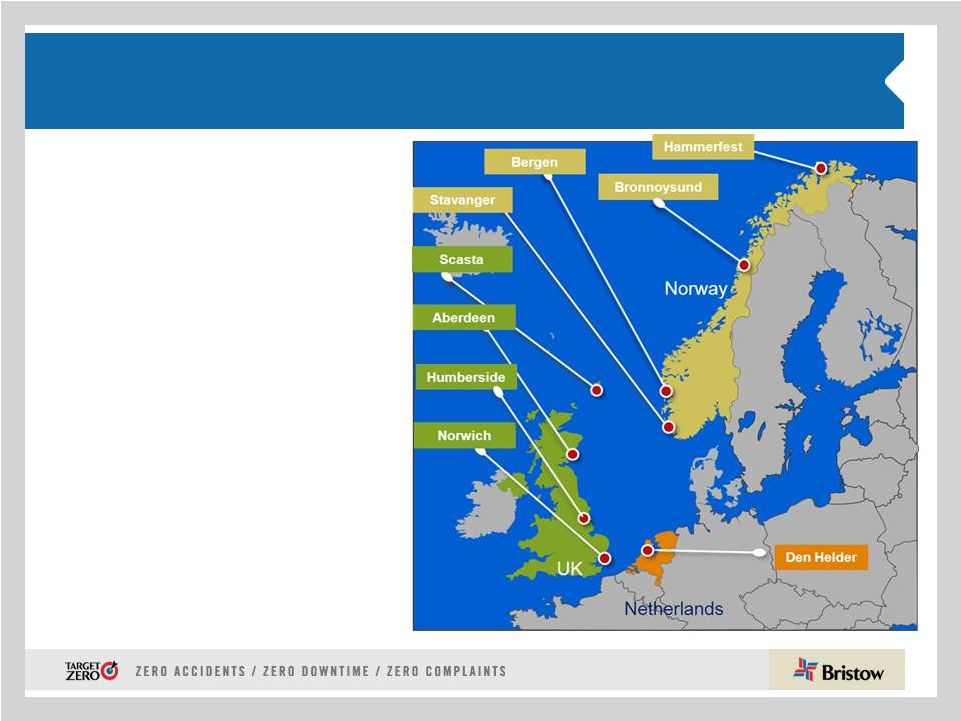
•
Europe represented 39% of Bristow operating
revenue and 44% of adjusted EBITDAR* in Q2
FY13
•
Operating revenue increased to $125.0M in Q2
FY13 from $113.7M in Q2 FY12 with the
addition of large aircraft and increased flying
activity
•
Adjusted EBITDAR increased to $43.2M in
Q2FY13 from $35.7M in Q2 FY12 and adjusted
EBITDAR margin increased to 34.6% in Q2
FY13 from 31.4% in Q2 FY12.
Outlook:
•
Increased demand continues from new and
existing clients in NNS and Norway and is
being managed given the Super Puma fleet
challenges
•
Bristow is shortlisted for UK SAR program
with results to be announced in early 2013
FY13 adjusted EBITDAR margin
expected to be ~ low thirties
Europe (EBU)
* Operating revenue and adjusted EBITDAR percentages exclude corporate and
other. |
 9
•
On October 22, 2012, during a flight to an offshore platform, the crew performed a
controlled ditching in an EC225 helicopter flown by another operator. No
one on board was injured and everyone was brought back to land safely.
•
The UK CAA issued a safety directive on October 25, 2012, requiring operators to
suspend operations of affected aircraft with certain main gear box
components. •
In response to the safety directive, Bristow currently is not flying a total of 16
large Eurocopter aircraft until further notice: 11 EC225 helicopters in the
UK, three EC225 helicopters
in
Australia,
one
EC225
in
Norway
and
one
AS332L2
in
Nigeria.
The
Company’s other aircraft, including search and rescue, continue to operate
globally. •
Bristow has increased utilization of other in-region aircraft and has moved,
or is moving, available aircraft to minimize or eliminate the impact to our
clients. •
Bristow has the financial strength to handle this challenge and thrive in this
environment and be proactive. The contract announced yesterday for ten
additional Sikorsky
S-92
large
helicopters
is
an
example
of
our
ability
to
manage
through
this
issue.
AS332L/EC225 Super Puma Fleet challenges |
 10
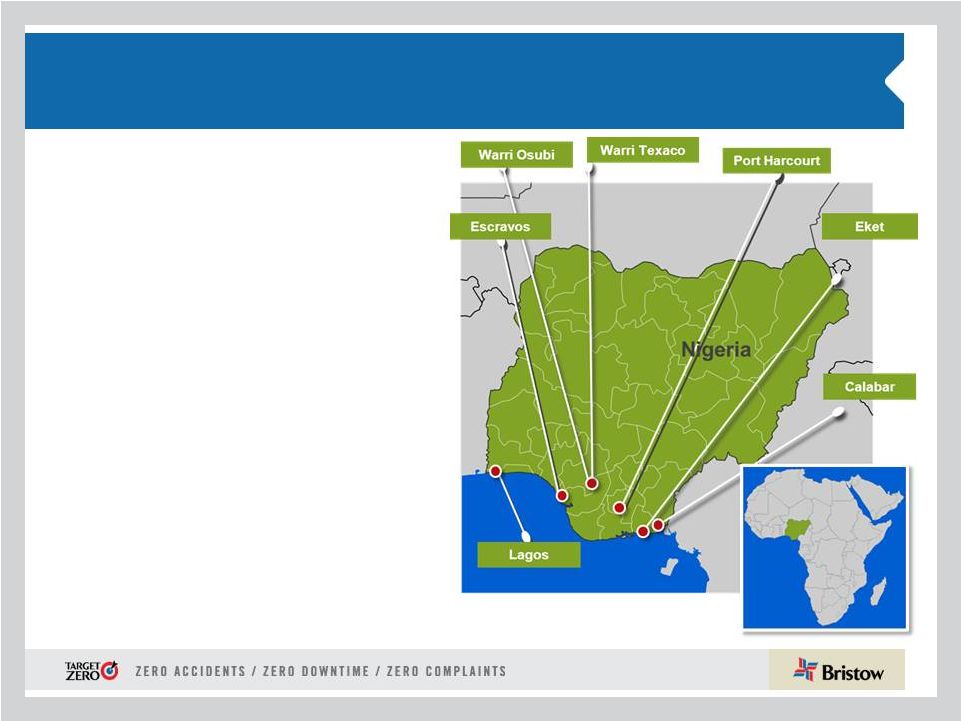
West Africa (WASBU)
•
Nigeria represented 21% of Bristow operating
revenue and 18% of adjusted EBITDAR* in Q2 FY13
•
Operating revenue increased by 7% to $65.3M in Q2
FY13 from $61.1M in Q2 FY12 due to improvement
in contract pricing with flight hours staying flat quarter
over quarter
•
The high volume of fleet major maintenance checks
offset these revenue gains in the short term
•
Adjusted EBITDAR decreased to $17.3M in Q2 FY13
from $21.7M in Q2 FY12 with adjusted EBITDAR
margin of 26.5% in Q2FY13 vs 35.5% in Q2 FY12
Outlook:
•
Heavy maintenance continues into Q3 FY13
•
A new entrant has obtained an Air Operator’s
Certificate (AOC)
•
Efficiency initiatives continue with process
standardization and inventory reductions
FY13 adjusted EBITDAR margin expected
to be ~ low thirties
* Operating revenue and adjusted EBITDAR percentages exclude corporate and
other. |
 11
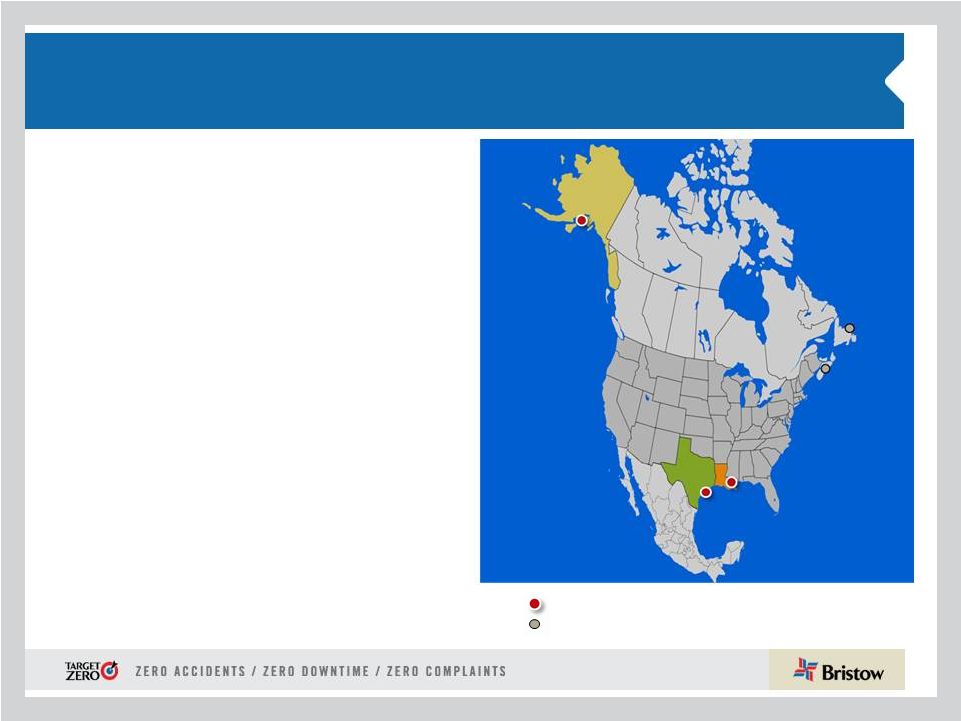
•
North America represented 18% of Bristow operating
revenue and 12% of adjusted EBITDAR* in Q2 FY13
•
Operating revenue increased 19% to $57.0M in Q2
FY13 from $47.9M resulting from the addition of the new
large a/c despite no significant change in the flight hours
•
Adjusted EBITDAR increased 19.5% to $11.8M in Q2
FY13 vs. $9.8M in Q2 FY12 and adjusted EBITDAR
margin stayed flat quarter over quarter at 20.7%
•
Results were impacted by an allowance of $2.6M
recorded against amounts due from ATP; excluding this
allowance, adjusted EBITDAR margin was 25.3%
Outlook:
•
Recent investment in Cougar Helicopters will be
reflected in this business unit’s operating results
starting in Q3 FY12
•
GoM is back to pre-Macondo permitting levels
•
We have secured an additional S-92 multi-year
contract supporting deepwater drilling at
increased rates and improved terms
FY13 adjusted EBITDAR margin expected to
be ~ low to mid twenties
North America (NABU)
* Operating revenue and adjusted EBITDAR percentages exclude corporate and
other. Consolidated in NABU
Unconsolidated Affiliate |
 12
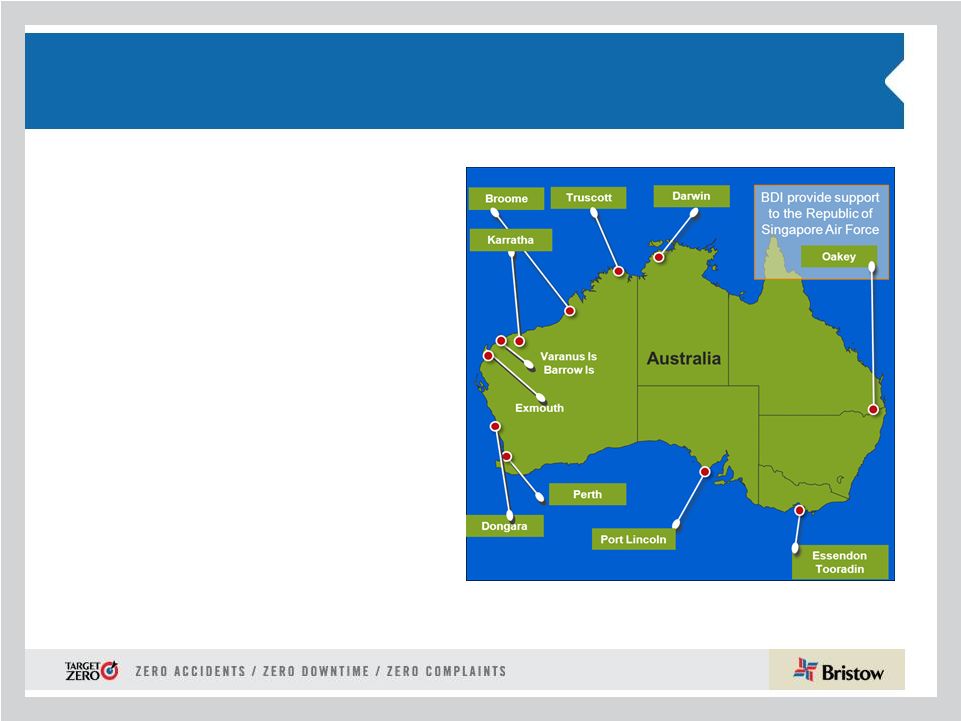
Australia (AUSBU)
•
Australia represented 12% of Bristow operating
revenue and 11% of adjusted EBITDAR* in Q2 FY13
•
Operating revenue increased 26.2% to $38.4M in Q2
FY13 from $30.5M in Q2 FY12 due to increased
flying activity driven by new contracts and ad hoc
work
•
Adjusted EBITDAR more than doubled to $10.8M in
Q2 FY13 from $4.4M in Q2 FY12 and adjusted
EBITDAR margin doubled as well to 28% in Q2 FY13
from 14.4% in Q2 FY12 reflecting combined effect of
improved revenue and reduced costs
Outlook:
•
INPEX award of a ten-year contract for
minimum six large aircraft with an option to
add a long term SAR aircraft (start in FY14)
•
Fleet rationalization is near complete
•
Aircraft will be redeployed as short term
contracts roll off.
* Operating revenue and adjusted EBITDAR percentages exclude corporate and
other. FY13 adjusted EBITDAR margin expected
to be ~ mid to high twenties |
 13
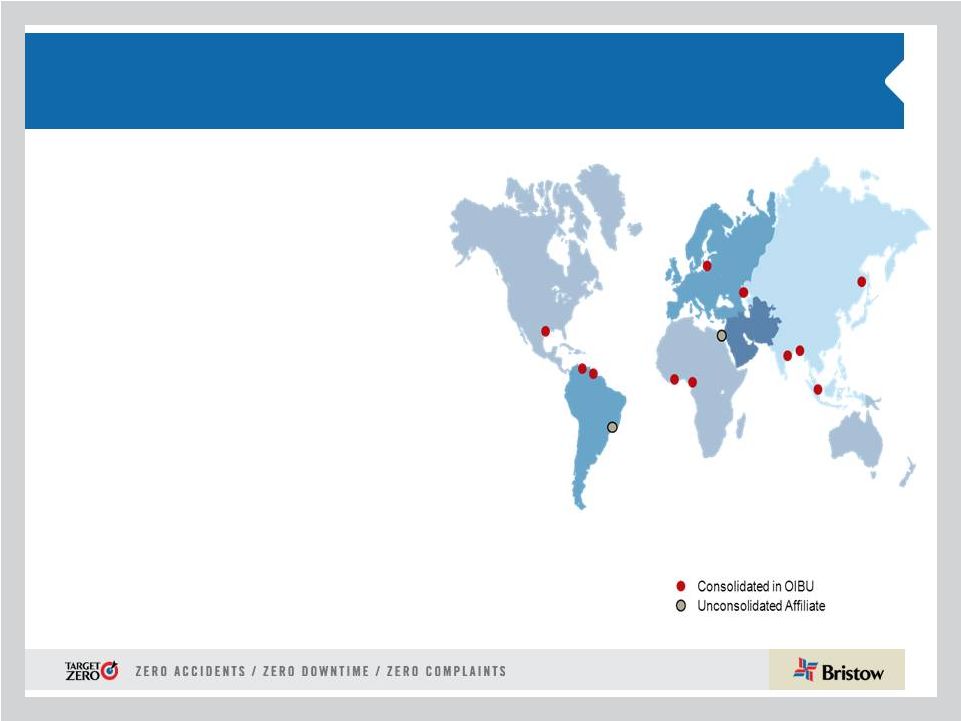
Other International (OIBU)
Other International (OIBU)
•
Other International represented 10% of Bristow
operating revenue and 15% of adjusted EBITDAR* in
Q2 FY13
•
Operating revenue decreased to $32.1M in Q2 FY13
vs. $35.2M in Q2 FY12 due to the end of short-term
contracts in Suriname and the Baltic Sea
•
Adjusted EBITDAR margin of 44.2% in Q2 FY13
doubled from 19.1% in Q2 FY12 due to increased
earnings from Lider
* Operating revenue and adjusted EBITDAR percentages exclude corporate and
other. Outlook:
•
Potential new opportunities in East and West Africa and the
Caribbean
•
Completing the BU restructuring to deliver operational
excellence and improved profitability
•
Lider’s second half of the year is expected to be better than the
first half as operations under new contracts begin. Currency
fluctuations make it difficult to predict if this will translate
into
higher equity earnings
FY13 adjusted EBITDAR margin expected to
be ~ low to mid forties |
 14
Financial discussion
Jonathan
Baliff,
SVP
and
CFO |
 15
Financial highlights Q2:
Adjusted EPS and EBITDAR Summary
Q2FY2012 to Q2FY2013 adjusted EPS bridge
Q2FY2012 to Q2FY2013 adjusted EBITDAR bridge (in millions)
$0.63
$0.80
$0.19
$0.13
$0.15
Q2FY2012
Operations
Corporate and Other
FX Changes
Q2FY2013
$71.2
$84.9
$11.5
$7.4
$5.2
Q2FY2012
Operations
Corporate and Other
FX Changes
Q2FY2013
* Adjusted EPS and EBITDAR amounts exclude gains and losses on dispositions of assets and any
special items during the quarter. See reconciliation of these items to GAAP in the appendix hereto and in our earnings release for the quarter
ended September 30, 2012.
|
   16
Financial highlights YTD:
Adjusted EPS and EBITDAR Summary
YTD FY2012 to YTD FY2013 adjusted EPS bridge
YTD FY2012 to YTD FY2013 adjusted EBITDAR bridge (in millions)
$1.18
$1.60
$0.40
$0.05
$0.03
YTD FY2012
Operations
Corporate and Other
FX Changes
YTD FY2013
$138.3
$168.7
$28.5
$3.0
$1.1
YTD FY2012
Operations
Corporate and Other
FX Changes
YTD FY2013
* Adjusted EPS and EBITDAR amounts exclude gains and losses on dispositions of assets and any
special items during the six months ended September 30, 2012. See reconciliation of these items to GAAP in the appendix hereto and in our
earnings release for the quarter ended September 30, 2012.
|
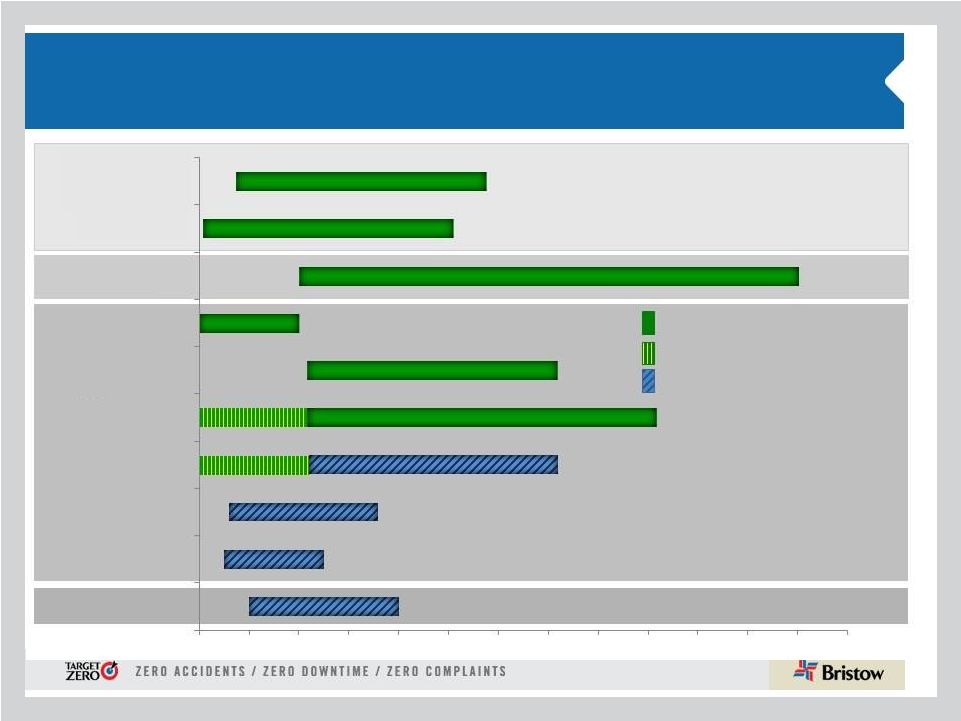 17
We continue to renew and add new multi-year
contracts for large aircraft with improved rates
4 X LARGE
1 X LARGE BRS LEASED TO LIDER
6 X LARGE WITH AN OPTION TO ADD A LONG TERM SAR A/C
1 X LARGE
1 X LARGE
2 X LARGE
PREVIOUSLY ANNOUNCED NEW
CONTRACTS WITH NEW IMPROVED RATES
PREVIOUSLY ANNOUNCED EXISTING
CONTRACTS WITH CURRENT RATES
UPDATED NEW CONTRACTS
WITH NEW IMPROVED RATES
2 X LARGE
3 X LARGE WITH 5 YR OPTION TO EXTEND
3 X LARGE
Jul-12
Jul-13
Jul-14
Jul-15
Jun-16
Jun-17
Jun-18
Jun-19
Jun-20
Jun-21
Jun-22
Jun-23
Jun-24
Jun-25
Gulf of Mexico
UK
UK
Norway
Norway
Norway SAR
UK North Sea
INPEX
Lider (Petrobras)
Lider (Petrobras)
AUSBU
OIBU
NABU
EBU
4 X LARGE WITH 5 YR OPTION TO EXTEND |
 18
LACE rate continues to increase as new aircraft
and contracts replace less productive aircraft
($ in millions)
•
** YTD FY13 LACE rate is annualized
295
290
279
268
253
164
159
153
149
142
0
50
100
150
200
250
300
350
FY09
FY10
FY11
FY12
YTD FY13
Consolidated commerical aircraft
Large Aircraft Equivalent (LACE)*
164
159
153
149
142
6.14
6.49
7.15
7.89
8.95
0
2
4
6
8
10
130
140
150
160
170
FY09
FY10
FY11
FY12
YTD FY13**
LACE*
LACE Rate *
YTD LACE Rate increased with the improvement in contract terms and
higher utilization of aircraft, especially in EBU and AUSBU
See appendix hereto for more information on LACE and LACE Rate. LACE and LACE Rate excludes Bristow
Academy, affiliate aircraft, aircraft held for sale, aircraft construction in progress, and
reimbursable revenue. |
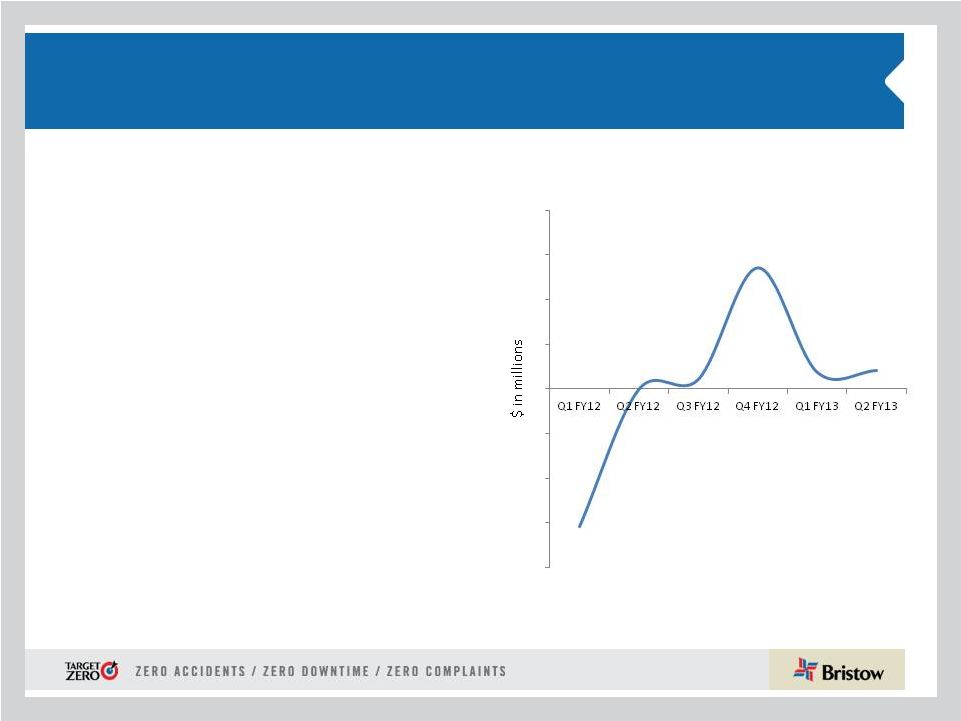 19
BVA –
Six Quarters
Year over year improvement for Q2 FY13
BVA* Q1 FY12 –
Q2 FY13
* Bristow
Value
Added
(BVA)
is
calculated
by
taking
Gross
Cash
Flow
less
the
product
of
Gross
Operating
Assets
times
a
capital
charge
of
10.5%.
Sample
calculation
for
Q2
FY12
and
Q2
FY13
can
be
found
in
the
appendix
hereto.
•
Q2 FY13 BVA is $2.1M, which is a
$2.1M improvement over Q2 FY12
•
YTD FY13 consolidated BVA is
positive $4.0M, a $19.4M increase
from same period FY12
•
Positive year-over-year change in
BVA is driven by:
•
Increase of ~$22M in Gross Cash
Flow partially offset by increase in
operating assets
•
AUSBU and NABU are key
performers this quarter
-15.4
0
1.1
13.6
1.9
2.1
-20
-15
-10
-5
0
5
10
15
20 |
 20
Our progress on BVA continues with stronger
operating cash flow generation in Q2 FY13
Net cash provided by operating activities*
* See 10-Q for more information on cash flow provided by operating
activities 55
94
69
117
135
128
195
151
231
0
50
100
150
200
250
300
FY09
FY10
FY11
FY12
YTD FY13
Full fiscal year
YTD (from Apr 1 to Sep 30) |
 21
Financial highlights:
FY13 guidance reaffirmed
•
* Assuming revenue earned in same regions and same mix
•
Seventh consecutive quarterly dividend since the end of FY11
•
Extended $100 million share repurchase program by 12
months LACE (Large AirCraft Equivalent)
152 -
156
Depreciation expense
~ $90 -
95M
LACE Rate
~ $8.25 -
8.55M
Interest expense
~ $38 -
43M
G & A expense (all inclusive)
~ $142 -
147M
Tax rate*
~ 20 -
24%
EPS guidance range of $3.25 - $3.55, excluding aircraft sales and special
items. We anticipate a better overall second half of FY13 compared to the first half
|
 22
Conclusions
•
Continued improvement in revenue generation through new
contract awards across all business units
•
Stronger year-over-year EBITDAR and BVA margins show
strength of business model and commercial leadership
•
Unmatched financial profile allows Bristow to capitalize on
consolidation (Cougar) and react swiftly to challenges (Super
Pumas) for our customers’
benefit
•
We are delivering a balanced shareholder return through
dividend increases (quarterly dividend of $0.20 per share or
33% increase from Q2 FY12) and reauthorization and
increase of opportunistic share repurchases ($100 million)
|
 23
Appendix |
 24
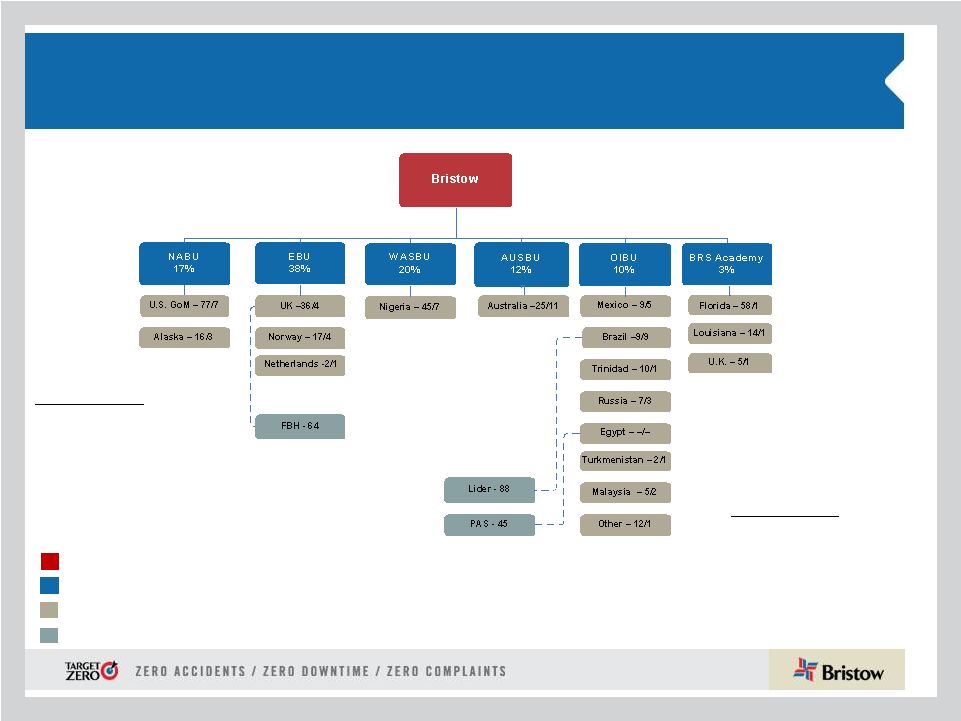
Organizational Chart -
as of September 30, 2012
Business
Unit
(%
of
FY13
Operating
Revenue)
Corporate
Region
( # of Aircraft / # of Locations)
Joint
Venture
(#
of
aircraft)
Key
Operated Aircraft
Bristow owned and/or operated
349 aircraft as of September 30,
2012
Affiliated Aircraft
Bristow affiliates and joint
ventures operated 197 aircraft
as of September 30, 2012 |
 25
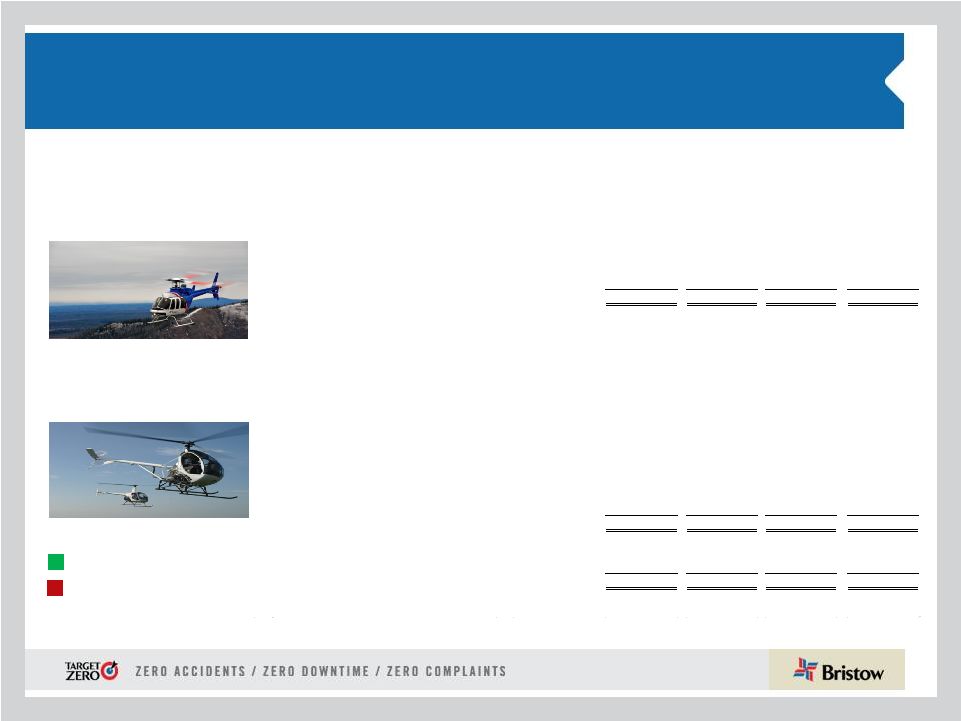
Aircraft Fleet –
Medium and Large
As of September 30, 2012
Next Generation Aircraft
Medium capacity 12-16 passengers
Large capacity 18-25 passengers
Mature Aircraft Models
Fair market value of our owned fleet is $1.7 billion and leased fleet is $400 million
Aircraft
Type
No. of PAX
Engine
Consl
Unconsl
Total
Ordered*
Large Helicopters
AS332L Super Puma
18
Twin Turbine
19
-
19
-
AW189
16
Twin Turbine
-
-
-
6
EC225
25
Twin Turbine
19
-
19
3
Mil MI 8
20
Twin Turbine
7
-
7
-
Sikorsky S-61
18
Twin Turbine
2
-
2
-
Sikorsky S-92
19
Twin Turbine
32
5
37
21
79
5
84
30
LACE
75
Medium Helicopters
AW139
12
Twin Turbine
7
2
9
-
Bell 212
12
Twin Turbine
1
14
15
-
Bell 412
13
Twin Turbine
32
20
52
-
EC155
13
Twin Turbine
1
-
1
-
Sikorsky S-76A/A++
12
Twin Turbine
15
5
20
-
Sikorsky S-76C/C++
12
Twin Turbine
51
33
84
-
107
74
181
-
LACE
46
* On November 7, 2012 we entered into an agreement to order 10 large Sikorsky
S-92 aircraft. |
 26
Aircraft Fleet –
Small, Training and Fixed
As of September 30, 2012 (continued)
Next Generation Aircraft
Mature Aircraft Models
Small capacity 4-7 passengers
Training capacity 2-6 passengers
•LACE does not include held for sale, training and fixed wing
helicopters Aircraft
Type
No. of PAX
Engine
Consl
Unconsl
Total
Ordered
Small Helicopters
Bell 206B
4
Turbine
1
2
3
-
Bell 206 L-3
6
Turbine
4
6
10
-
Bell 206 L-4
6
Turbine
29
1
30
-
Bell 407
6
Turbine
39
-
39
-
BK 117
7
Twin Turbine
2
-
2
-
BO-105
4
Twin Turbine
2
-
2
-
EC135
7
Twin Turbine
6
3
9
-
83
12
95
-
LACE
21
Training Helicopters
AW139
12
Twin Turbine
-
3
3
-
Bell 412
13
Twin Turbine
-
8
8
-
Bell 212
12
Twin Turbine
-
15
15
-
AS355
4
Twin Turbine
5
-
5
-
AS350BB
4
Turbine
-
36
36
-
Agusta 109
8
Twin Turbine
-
2
2
-
Bell 206B
6
Single Engine
12
-
12
-
Robinson R22
2
Piston
12
-
12
-
Robinson R44
2
Piston
2
-
2
-
Sikorsky 300CB/Cbi
2
Piston
45
-
45
-
Fixed Wing
1
-
1
-
77
64
141
-
Fixed Wing
3
42
45
-
Total
349
197
546
30
TOTAL LACE (Large Aircraft Equivalent)
142 |
 27
Operating lease strategy: lowering the cost and amount of
capital needed to grow
•
Of the 57 aircraft currently leased in our fleet, 30 are training and 27 are
commercial (19 LACE)
•
19 LACE aircraft represent approximately 13% of our commercial fleet
•
Our
goal
is
for
commercial
fleet
operating
leases
to
account
for
20-30%
of
our
LACE
Leased aircraft as of September 30, 2012
Small
Medium
Large
Total
EBU
-
-
7
7
7
45
16%
WASBU
-
1
-
1
1
22
2%
NABU
1
11
2
14
8
31
25%
AUSBU
2
-
3
5
4
17
21%
OIBU
-
-
-
-
-
28
0%
Total
3
12
12
27
19
142
13%
Leased LACE
Total LACE
% Leased
See 10-Q Note 6 “Commitments and contingencies” for more information on operating leases |
 28
Consolidated fleet changes and aircraft sales for
Q2 FY13
Small
Medium
Large
Total
EBU
-
2
3
5
WASU
-
1
-
1
NABU
-
-
-
-
AUSBU
-
2
1
3
OIBU
1
10
-
11
Total
1
15
4
20
Held for sale aircraft in consolidated fleet
Q 1 FY13
Q 2 FY13
YTD
Fleet Count Beginning
361
357
361
Delivered
-
S-92
2
2
EC225
1
1
Total Delivered
2
1
3
Removed
Sales
(4)
(5)
(9)
Other*
(2)
(4)
(6)
Total Removed
(6)
(9)
(15)
357
349
349
* Includes destroyed aircraft, lease returns and commencements
Fleet changes
# of A/C Sold
Received*
Q1 FY12
4
19.0
$
Q2 FY12
5
24.8
Totals
9
43.8
$
* Amounts stated in millions
Small
Medium
Large
Training
Total
EBU
-
-
7
-
7
WASU
-
1
-
-
1
NABU
1
11
2
-
14
AUSBU
2
-
3
-
5
OIBU
-
-
-
-
-
Academy
-
-
-
30
30
Total
3
12
12
30
57
Leased aircraft in consolidated fleet
See 10-Q Note 6 “Commitments and contingencies” for more information on operating leases |
 29
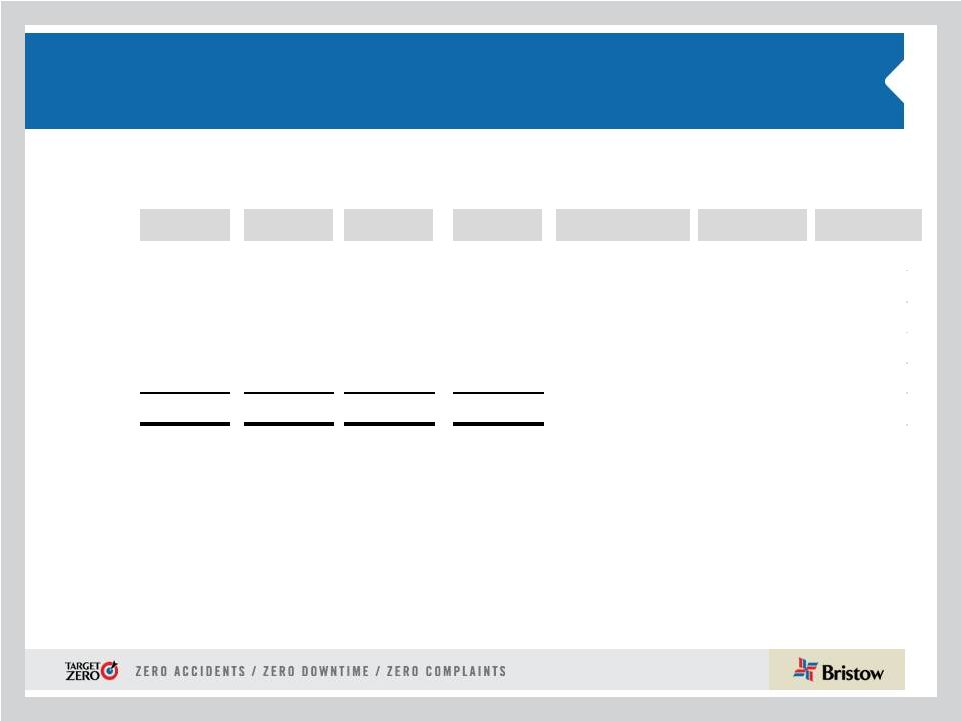
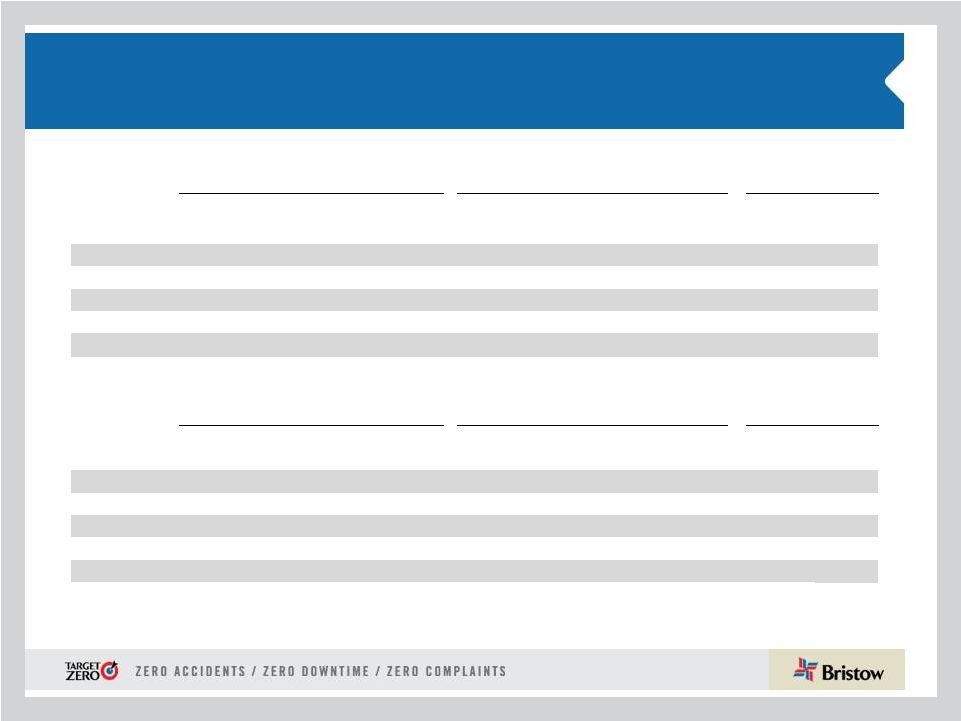
Operating revenue, LACE and LACE rate by BU
1) $ in millions
2) LACE Rate is annualized
3) $ in millions per LACE
Op revenue*
LACE
LACE Rate*
EBU
248
45
11.03
WASBU
132
22
12.24
NABU
109
31
7.11
AUSBU
77
17
9.29
IBU
65
28
4.62
Total
631
142
8.95
Operating Revenue, LACE, and LACE Rate by BU
YTD FY13 |
    30
Operating revenue, LACE and LACE rate by BU
1) $ in millions
2) LACE Rate is annualized
Q1
Q2
Q3
Q4
Q1
Q2
Q3
Q4
Q1
Q2
EBU
42
43
48
46
44
46
46
45
47
45
WASBU
24
24
21
22
23
22
22
22
22
22
NABU
39
35
34
29
30
29
30
30
30
31
AUSBU
20
23
24
20
19
20
20
19
18
17
OIBU
33
33
33
38
39
38
38
34
32
28
Consolidated
157
158
159
154
154
154
155
149
147
142
Q1
Q2
Q3
Q4
Q1
Q2
Q3
Q4
Q1
Q2
EBU
$8.20
$8.50
$7.90
$8.40
$9.80
$9.60
$9.63
$10.09
$10.60
11.03
WASBU
9.70
9.40
10.70
9.90
9.10
10.30
11.17
11.46
12.35
12.24
NABU
5.40
6.10
6.00
6.60
5.80
6.30
5.89
5.79
7.05
7.11
AUSBU
6.80
6.00
6.00
7.50
8.60
7.10
6.96
7.78
8.48
9.29
OIBU
3.90
4.10
4.40
3.90
3.50
3.70
3.78
4.22
4.22
4.62
Consolidated
6.70
6.90
6.90
7.10
7.30
7.40
7.43
7.89
8.55
8.95
2011
2012
LACE
LACE Rate
2011
2012
2013
2013
1,2 |
 31
Order and options book as of November 7, 2012
#
Helicopter
Class
Delivery Date
Location
Contracted
#
Helicopter
Class
Delivery Date
5
Large
December 2012
EBU
5 of 5
1
Large
June 2014
2
Large
March 2013
EBU
2 of 2
1
Large
September 2014
4
Large
September 2013
NABU
1 of 4
3
Large
December 2014
2
Large
December 2013
AUSBU
1 of 2
4
Large
March 2015
2
Large
December 2013
WASBU
3
Large
June 2015
2
Large
December 2013
EBU
3
Large
September 2015
1
Large
March 2014
AUSBU
3
Large
December 2015
1
Large
March 2014
EBU
2
Large
March 2016
1
Large
March 2014
WASBU
3
Large
June 2016
1
Large
June 2014
EBU
3
Large
September 2016
1
Large
June 2014
NABU
3
Large
December 2016
1
Large
September 2014
EBU
2
Large
March 2017
2
Large
September 2014
NABU
1 of 2
2
Large
June 2017
1
Large
December 2014
WASBU
2
Large
September 2017
1
Large
March 2015
OIBU
2
Large
December 2017
1
Large
June 2015
EBU
2
Medium
June 2014
1
Large
March 2016
EBU
1
Medium
September 2014
1
Large
June 2016
AUSBU
2
Medium
December 2014
30
10 of 30
1
Medium
March 2015
3
Medium
September 2015
* Six large ordered aircraft expected to enter service late
3
Medium
December 2015
calendar 2014 are subject to the successful development
49
and certification of the aircraft.
On November 7, 2012 we entered into an agreement
to order ten large Sikorsky S-92 aircraft and
obtain options for 16 large Sikorsky S-92 aircraft, which are
reflected in this table.
ORDER BOOK*
OPTIONS BOOK |
 32
Adjusted EBITDAR margin* trend
Q1
Q2
Q3
Q4
Full Year
Q1
Q2
Q3
Q4
Full Year
EBU
31.2%
31.7%
31.9%
28.0%
30.8%
29.8%
31.5%
34.6%
34.4%
32.7%
WASBU
31.7%
36.8%
33.7%
39.1%
36.0%
33.7%
36.9%
35.8%
34.3%
35.2%
NABU
18.3%
20.0%
14.9%
17.7%
17.8%
20.8%
25.8%
15.9%
8.5%
18.5%
AUSBU
26.5%
36.7%
34.4%
31.3%
32.4%
33.2%
26.1%
27.0%
31.1%
29.3%
OIBU
34.4%
37.6%
25.9%
25.1%
31.0%
18.3%
40.2%
37.4%
59.4%
39.3%
Consolidated
24.7%
27.8%
24.7%
23.9%
25.3%
23.8%
27.5%
25.9%
29.6%
26.7%
Q1
Q2
Q3
Q4
Full Year
Q1
Q2
EBU
33.0%
31.4%
30.7%
36.1%
32.9%
32.2%
34.6%
WASBU
29.5%
35.5%
37.2%
36.6%
35.0%
31.9%
26.5%
NABU
14.3%
20.6%
14.8%
19.4%
17.3%
23.2%
20.7%
AUSBU
20.2%
14.4%
23.5%
35.6%
24.3%
27.0%
28.0%
OIBU
48.1%
19.1%
47.8%
42.9%
39.5%
36.2%
44.2%
Consolidated
23.4%
24.0%
27.6%
31.2%
26.6%
26.3%
26.1%
2010
2011
2012
2013
* Adjusted EBITDAR excludes special items and asset dispositions and calculated by taking adjusted
EBITDAR divided by operating revenue |
 33
Adjusted EBITDAR* reconciliation
* Adjusted EBITDAR excludes special items and asset dispositions
($ in millions)
Q1
Q2
Q3
Q4
YTD
Q1
Q2
Q3
Q4
YTD
Net income
$24.0
$33.7
$27.1
$28.7
$113.5
$20.9
$38.8
$42.3
$31.2
$133.3
Income tax expense
9.5
11.2
5.7
2.6
29.0
8.5
3.3
-11.8
7.1
7.1
Interest expense
10.0
10.6
11.0
10.8
42.4
11.1
11.5
13.8
9.9
46.2
Gain on disposal of assets
-6.0
-4.9
-2.4
-5.3
-18.7
-1.7
-1.9
0.0
-5.1
-8.7
Depreciation and amortization
18.2
18.5
20.7
17.4
74.7
19.3
21.0
21.3
27.7
89.4
Special items
2.5
-2.4
-1.2
1.0
0.0
0.0
0.0
-1.2
2.4
1.2
EBITDA Subtotal
58.2
66.7
60.8
55.1
240.9
58.1
72.7
64.4
73.3
268.5
Rental expense
7.0
6.9
7.2
6.3
27.3
6.6
6.1
8.7
7.7
29.2
Adjusted EBITDAR
$65.2
$73.6
$0.1
$61.3
$268.2
$64.7
$78.8
$73.1
$81.1
$297.7
($ in millions)
Q1
Q2
Q3
Q4
YTD
Q1
Q2
Net income
$21.2
$3.0
$26.5
$14.6
$65.2
$24.2
$30.4
Income tax expense
6.6
-1.9
7.1
2.4
14.2
6.2
8.3
Interest expense
9.0
9.5
9.8
10.0
38.1
8.8
8.6
Gain on disposal of assets
-1.4
1.6
2.9
28.6
31.7
5.3
1.3
Depreciation and amortization
22.7
25.4
22.7
25.3
96.1
21.4
23.3
Special items
0.0
24.6
0.0
3.4
28.1
2.2
-2.3
EBITDA Subtotal
58.1
62.1
68.9
84.3
273.4
68.0
69.7
Rental expense
9.0
9.1
12.8
15.1
46.0
16.3
15.3
Adjusted EBITDAR
$67.0
$71.2
$81.8
$99.5
$319.5
$84.3
$84.9
3/31/2012
3/31/2013
3/31/2010
3/31/2011
Fiscal year ended, |
 34
Bristow Value Added (BVA)
Sample calculation for Q2 FY13 and Q2 FY12
Bristow Value Added = Gross Cash Flow –
(Gross Operating Assets X Capital Charge)
BVA
= GCF -
(
GOA X 10.5%** )
Bristow Value Added calculation for Q2 FY13
$2.1
=
$79* -
( $2,922*
X 2.625%** )
Bristow Value Added calculation for Q2 FY12
$0 =
$76*
-
(
$2,907*
X
2.625%**
)
* Reconciliation for these items follows right after
this slide ** Quarterly capital charge of 2.625% is based on
annual capital charge of 10.5% |
 35
Gross Cash Flow Presentation
Special items:
FY13
includes:
$2.2m
special
charge
for
severance
costs
related
to
the
termination
of
a
contract
in
the
Southern
North
Sea
(in millions)
Gross Cash Flow Reconciliation
FY12Q2
FY13Q2
Net Income
3
30
Depreciation and Amortization
25
23
Interest Expense
9
9
Interest Income
(0)
(0)
Rent
9
15
Other Income/expense-net
(1)
0
Earnings of Discontinued
Operations -
-
Gain/loss on Asset Sale
2
1
Special Items
25
0
Tax Effect from Special Items
(6)
0
Earnings (losses) from Unconsolidated
Affiliates, Net 4
(7)
Non-controlling Interests
0
1
Gross Cash Flow before Lider
$71
$72
Gross Cashflow -Lider proportional
6
7
Gross Cash Flow after Lider
$76
$79 |
 36
Gross Operating Asset Presentation
(in millions)
Adjusted Gross Operating Assets Reconciliation
Q2 FY12
Q2 FY13
Total Assets
2,700
2,785
Accumulated Depreciation
465
464
Capitalized Operating Leases
129
225
Cash and Cash Equivalents
(140)
(348)
Investment in Unconsolidated Entities
(202)
(215)
Goodwill
(29)
(30)
Intangibles
(6)
(4)
Assets Held for Sale: Net
(32)
(20)
Assets Held for Sale: Gross
75
83
Adj. for gains & losses on assets sales
34
120
Accounts Payable
(47)
(56)
Accrued Maintenance and Repairs
(14)
(19)
Other Accrued Taxes
(5)
(8)
Accrued Wages, Benefits and Related Taxes
(35)
(45)
Other Accrued Liabilities
(20)
(27)
Income Taxes Payable
(14)
(13)
Deferred Revenue
(12)
(13)
ST Deferred Taxes
(7)
(15)
LT Deferred Taxes
(145)
(144)
Adjusted Gross Operating Assets before Lider
$2,696
$2,723
Adjusted Gross Operating Assets-Lider proportional
212
199
Adjusted Gross Operating Assets after Lider
$2,907
$2,922 |
 37
GAAP reconciliation
Adjusted operating income
Loss on disposal of assets
Special items
Operating income
Adj
usted EBITDAR
Loss on disposal of assets
Special items
Depreciation and amortization
Rent expense
Interest expense
(Provision) benefit for income taxes
Net income
Adjusted net income
Loss on disposal of assets
Special items
Net income attributable to Bristow Group
Adjusted diluted earnings per share
Loss on disposal of assets
Special items
Diluted earnings per share
Three Months Ended
Six Months Ended
2012
2011
2012
2011
(In thousands)
$
46,274
(1,262)
2,316
47,328
$
84,922
(1,262)
2,316
(23,321)
(15,282)
(8,597)
(8,342)
30,434
$
29,153
(990)
1,505
29,668
$
0.80
(0.03)
0.04
0.82
September 30,
September 30,
$
$
$
38,493
93,276
73,482
(1,611)
(6,577)
(195)
(27,287)
622
(27,287)
9,595
87,321
46,000
71,235
168,727
138,260
(1,611)
(6,577)
(195)
(24,610)
622
(24,610)
(25,431)
(44,693)
(48,139)
(9,108)
(31,556)
(18,061)
(9,459)
(17,371)
(18,414)
1,945
(14,522)
(4,661)
2,961
54,630
24,180
23,287
58,425
43,227
(1,257)
(5,196)
(152)
(19,319)
101
(19,319)
2,711
53,330
23,756
0.63
1.60
1.18
(0.03)
(0.14)
—
(0.53)
—
(0.53)
0.07
1.46
0.65
$
$
$
$
$
$
$
$
$
$
$
$
$
$
$
$
$
$
$
$
$ |
 38
Leverage Reconciliation
*Adjusted EBITDAR exclude gains and losses on dispositions of assets
Debt
Investment
Capital
Leverage
(a)
(b)
(c) = (a) + (b)
(a) / (c)
(in millions)
As of September 30, 2012
734.7
$
1,580.2
$
2,314.9
$
31.7%
Adjust for:
Unfunded Pension Liability
112.2
112.2
NPV of Lease Obligations
224.8
224.8
Letters of credit
1.5
1.5
Adjusted
1,073.2
$
(d)
1,580.2
$
2,653.4
$
40.4%
Calculation of debt to adjusted EBITDAR multiple
Adjusted EBITDAR*:
TTM FY 2013
350.0
$
(e)
= (d) / (e)
3.07:1 |
 39
Bristow Group Inc. (NYSE: BRS)
2103
City
West
Blvd.,
4
th
Floor
Houston, Texas 77042
t
713.267.7600
f
713.267.7620
bristowgroup.com
Contact Us |