Attached files
| file | filename |
|---|---|
| 8-K - 8-K - Bridge Capital Holdings | v327623_8k.htm |
Daniel P. Myers President Chief Executive Officer Director Thomas A. Sa Executive Vice President Chief Financial Officer Chief Strategy Officer Investor Update 3 rd Quarter 2012 B R I D G E C A P I T A L H O L D I N G S NASDAQ: BBNK WWW.BRIDGECAPITALHOLDINGS.COM
Forward Looking Statements Certain matters discussed herein constitute forward - looking statements within the meaning of the Private Securities Litigation Reform Act of 1995, and are subject to the safe harbors created by that Act. Forward - looking statements describe future plans, strategies, and expectations, and are based on currently available information, expectations, assumptions, projections, and management's judgment about the Bank, the banking industry and general economic conditions. These forward looking statements are subject to certain risks and uncertainties that could cause the actual results, performance or achievements to differ materially from those expressed, suggested or implied by the forward looking statements. These risks and uncertainties include, but are not limited to: (1) competitive pressures in the banking industry; (2) changes in interest rate environment; (3) general economic conditions, nationally, regionally, and in operating markets; (4) changes in the regulatory environment; (5) changes in business conditions and inflation; (6) changes in securities markets; (7) future credit loss experience; (8) the ability to satisfy requirements related to the Sarbanes - Oxley Act and other regulation on internal control; (9) civil disturbances or terrorist threats or acts, or apprehension about the possible future occurrences of acts of this type; and (10) the involvement of the United States in war or other hostilities. The reader should refer to the more complete discussion of such risks in Bridge Capital Holdings reports on Forms 10 - K and 10 - Q on file with the SEC. 2
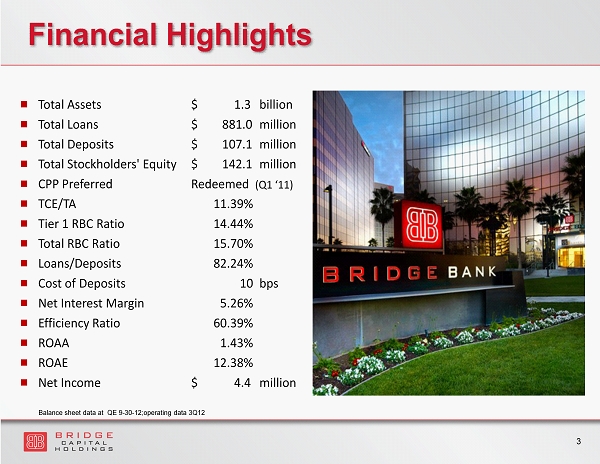
■ Total Assets $ 1.3 billion ■ Total Loans $ 881.0 million ■ Total Deposits $ 107.1 million ■ Total Stockholders' Equity $ 142.1 million ■ CPP Preferred Redeemed (Q1 ‘11) ■ TCE/TA 11.39% ■ Tier 1 RBC Ratio 14.44% ■ Total RBC Ratio 15.70% ■ Loans/Deposits 82.24% ■ Cost of Deposits 10 bps ■ Net Interest Margin 5.26% ■ Efficiency Ratio 60.39% ■ ROAA 1.43% ■ ROAE 12.38% ■ Net Income $ 4.4 million Financial Highlights 3 Balance sheet data at QE 9 - 30 - 12;operating data 3Q12
Bridge Bank Franchise ▪ True Business Bank ▪ Operating in attractive Silicon Valley and tech centric markets ▪ Full range of corporate banking products delivered through experienced advisors ▪ Core funding - driven approach to building the business ▪ 2 regional business centers + 5 business offices ▪ Unique & effective use of banking technology ▪ Experienced board and management ▪ Disciplined execution of our business plan 4
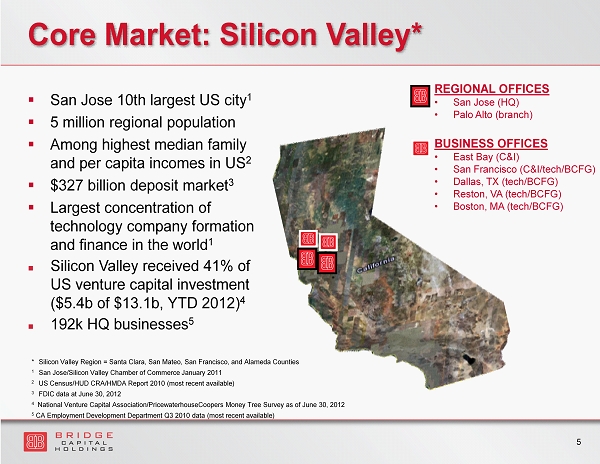
Core Market: Silicon Valley* REGIONAL OFFICES • San Jose (HQ) • Palo Alto (branch) BUSINESS OFFICES • East Bay (C&I) • San Francisco (C&I/tech/BCFG) • Dallas, TX (tech/BCFG) • Reston, VA (tech/BCFG) • Boston, MA (tech/BCFG) * Silicon Valley Region = Santa Clara, San Mateo, San Francisco, and Alameda Counties 1 San Jose/Silicon Valley Chamber of Commerce January 2011 2 US Census/HUD CRA/HMDA Report 2010 (most recent available) 3 FDIC data at June 30, 2012 4 National Venture Capital Association/PricewaterhouseCoopers Money Tree Survey as of June 30, 2012 5 CA Employment Development Department Q3 2010 data (most recent available) 5 ▪ San Jose 10th largest US city 1 ▪ 5 million regional population ▪ Among highest median family and per capita incomes in US 2 ▪ $327 billion deposit market 3 ▪ Largest concentration of technology company formation and finance in the world 1 Silicon Valley received 41% of US venture capital investment ($5.4b of $13.1b, YTD 2012) 4 192k HQ businesses 5
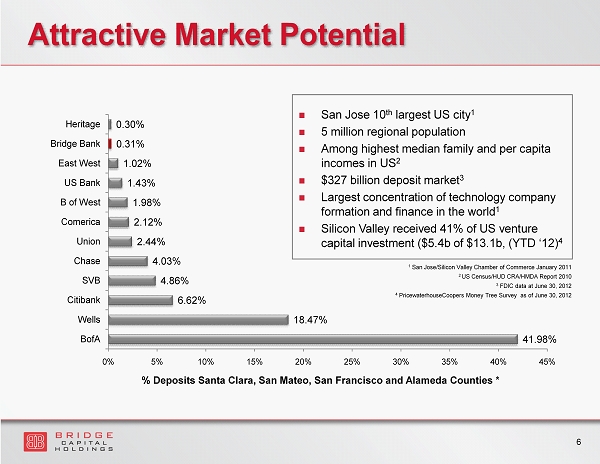
Attractive Market Potential 41.98% 18.47% 6.62% 4.86% 4.03% 2.44% 2.12% 1.98% 1.43% 1.02% 0.31% 0.30% 0% 5% 10% 15% 20% 25% 30% 35% 40% 45% BofA Wells Citibank SVB Chase Union Comerica B of West US Bank East West Bridge Bank Heritage % Deposits Santa Clara , San Mateo , San Francisco and Alameda Counties * San Jose 10 th largest US city 1 5 million regional population Among highest median family and per capita incomes in US 2 $327 billion deposit market 3 Largest concentration of technology company formation and finance in the world 1 Silicon Valley received 41% of US venture capital investment ($5.4b of $13.1b, (YTD ‘12) 4 6 1 San Jose/Silicon Valley Chamber of Commerce January 2011 2 US Census/HUD CRA/HMDA Report 2010 3 FDIC data at June 30, 2012 4 PricewaterhouseCoopers Money Tree Survey as of June 30, 2012
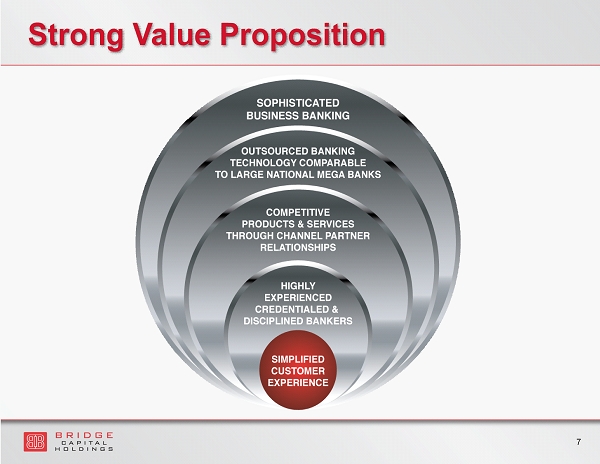
Strong Value Proposition 7
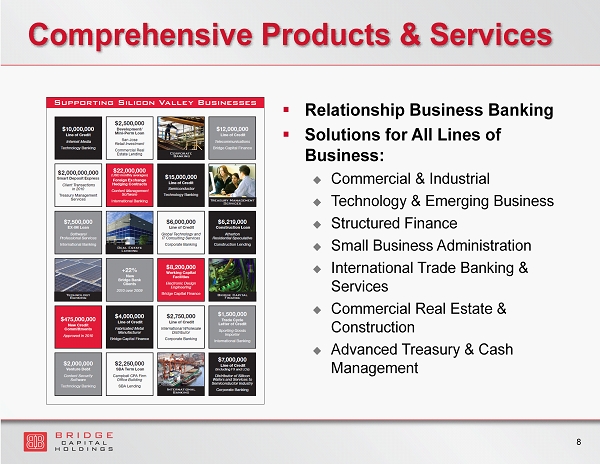
Comprehensive Products & Services ▪ Relationship Business Banking ▪ Solutions for All Lines of Business: Commercial & Industrial Technology & Emerging Business Structured Finance Small Business Administration I nternational Trade Banking & Services Commercial Real Estate & Construction Advanced Treasury & Cash Management 8
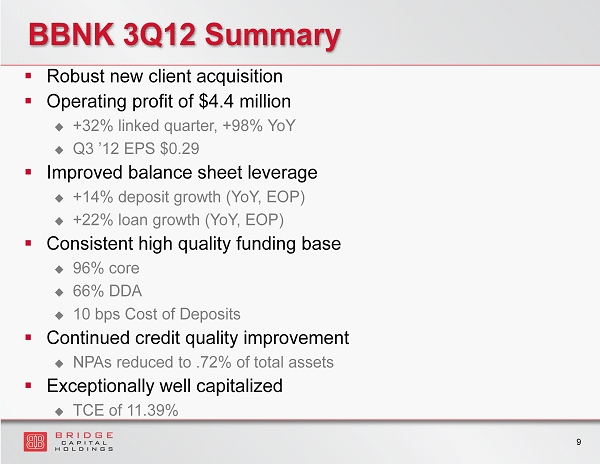
BBNK 3Q12 Summary ▪ Robust new client acquisition ▪ Operating profit of $4.4 million +32% linked quarter, +98% YoY Q3 ’12 EPS $0.29 ▪ Improved balance sheet leverage +14% deposit growth (YoY, EOP) +22% loan growth (YoY, EOP) ▪ Consistent high quality funding base 96% core 66% DDA 10 bps Cost of Deposits ▪ Continued credit quality improvement NPAs reduced to .72% of total assets ▪ Exceptionally well capitalized TCE of 11.39% 9
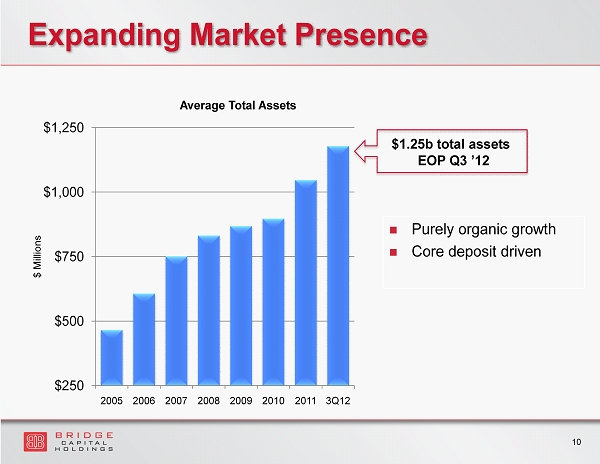
Expanding Market Presence $250 $500 $750 $1,000 $1,250 2005 2006 2007 2008 2009 2010 2011 3Q12 $ Millions Average Total Assets Purely organic growth Core deposit driven $1.25b total assets EOP Q3 ’12 10
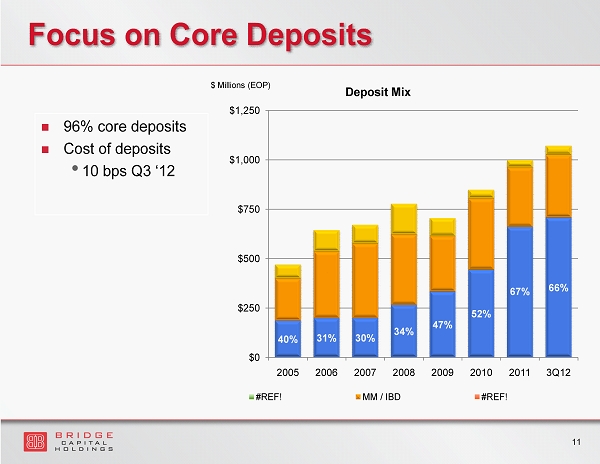
Focus on Core Deposits 40% 31% 30% 34% 47% 52% 67% 66% $0 $250 $500 $750 $1,000 $1,250 2005 2006 2007 2008 2009 2010 2011 3Q12 $ Millions (EOP) Deposit Mix #REF! MM / IBD #REF! 96% core deposits Cost of deposits • 10 bps Q3 ‘12 11
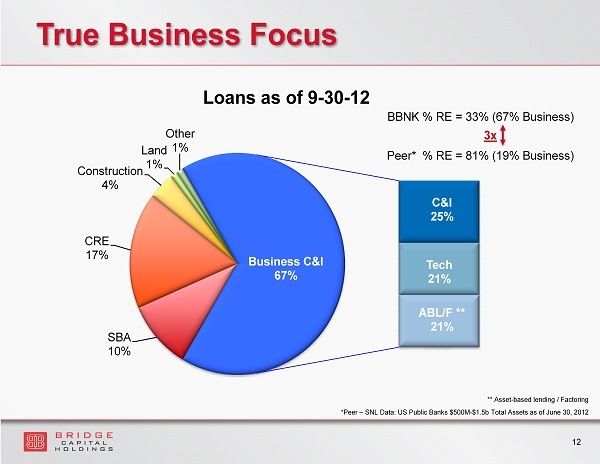
SBA 10% CRE 17% Construction 4% Land 1% Other 1% C&I 25% Tech 21% ABL/F ** 21% Business C&I 67% Loans as of 9 - 30 - 12 True Business Focus BBNK % RE = 33% ( 67% Business) Peer* % RE = 81% (19% Business) * Peer – SNL Data: US Public Banks $500M - $1.5b Total Assets as of June 30, 2012 ** Asset - based lending / Factoring 12 3x
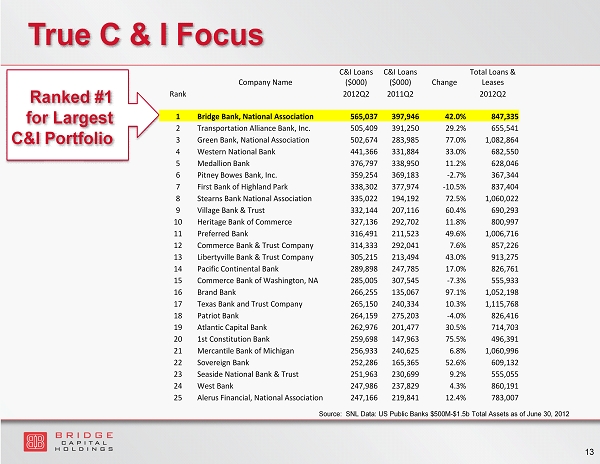
Ranked #1 for Largest C&I Portfolio Source: SNL Data: US Public Banks $500M - $1.5b Total Assets as of June 30, 2012 13 True C & I Focus Company Name C&I Loans ($000) C&I Loans ($000) Change Total Loans & Leases Rank 2012Q2 2011Q2 2012Q2 1 Bridge Bank, National Association 565,037 397,946 42.0% 847,335 2 Transportation Alliance Bank, Inc. 505,409 391,250 29.2% 655,541 3 Green Bank, National Association 502,674 283,985 77.0% 1,082,864 4 Western National Bank 441,366 331,884 33.0% 682,550 5 Medallion Bank 376,797 338,950 11.2% 628,046 6 Pitney Bowes Bank, Inc. 359,254 369,183 - 2.7% 367,344 7 First Bank of Highland Park 338,302 377,974 - 10.5% 837,404 8 Stearns Bank National Association 335,022 194,192 72.5% 1,060,022 9 Village Bank & Trust 332,144 207,116 60.4% 690,293 10 Heritage Bank of Commerce 327,136 292,702 11.8% 800,997 11 Preferred Bank 316,491 211,523 49.6% 1,006,716 12 Commerce Bank & Trust Company 314,333 292,041 7.6% 857,226 13 Libertyville Bank & Trust Company 305,215 213,494 43.0% 913,275 14 Pacific Continental Bank 289,898 247,785 17.0% 826,761 15 Commerce Bank of Washington, NA 285,005 307,545 - 7.3% 555,933 16 Brand Bank 266,255 135,067 97.1% 1,052,198 17 Texas Bank and Trust Company 265,150 240,334 10.3% 1,115,768 18 Patriot Bank 264,159 275,203 - 4.0% 826,416 19 Atlantic Capital Bank 262,976 201,477 30.5% 714,703 20 1st Constitution Bank 259,698 147,963 75.5% 496,391 21 Mercantile Bank of Michigan 256,933 240,625 6.8% 1,060,996 22 Sovereign Bank 252,286 165,365 52.6% 609,132 23 Seaside National Bank & Trust 251,963 230,699 9.2% 555,055 24 West Bank 247,986 237,829 4.3% 860,191 25 Alerus Financial, National Association 247,166 219,841 12.4% 783,007
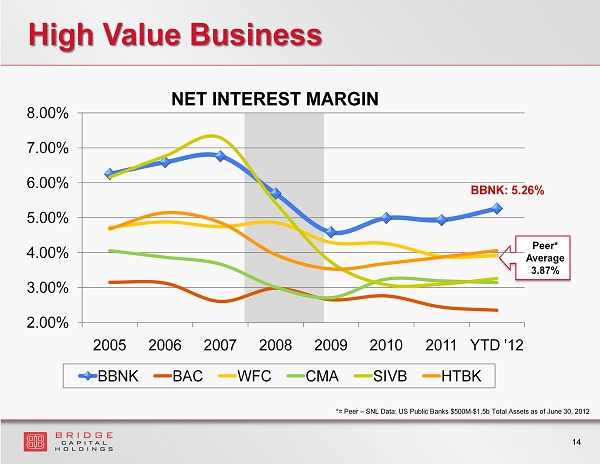
High Value Business Peer* Average 3.87% BBNK: 5.26% 14 *= Peer – SNL Data: US Public Banks $500M - $1.5b Total Assets as of June 30, 2012 2.00% 3.00% 4.00% 5.00% 6.00% 7.00% 8.00% 2005 2006 2007 2008 2009 2010 2011 YTD '12 NET INTEREST MARGIN BBNK BAC WFC CMA SIVB HTBK
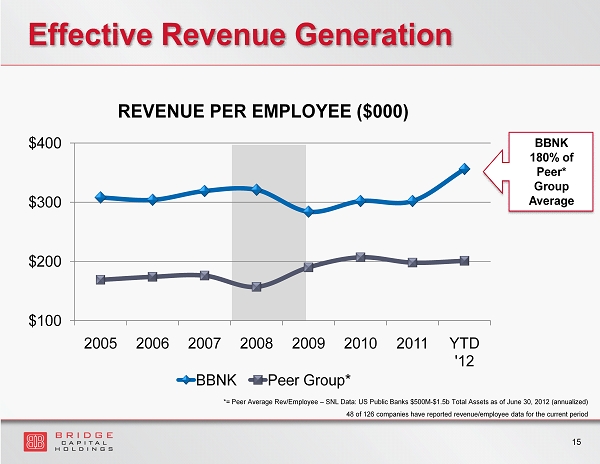
$100 $200 $300 $400 2005 2006 2007 2008 2009 2010 2011 YTD '12 REVENUE PER EMPLOYEE ($000) BBNK Peer Group* Effective Revenue Generation *= Peer Average Rev/Employee – SNL Data: US Public Banks $500M - $1.5b Total Assets as of June 30, 2012 (annualized) 48 of 126 companies have reported revenue/employee data for the current period BBNK 180% of Peer* Group Average 15
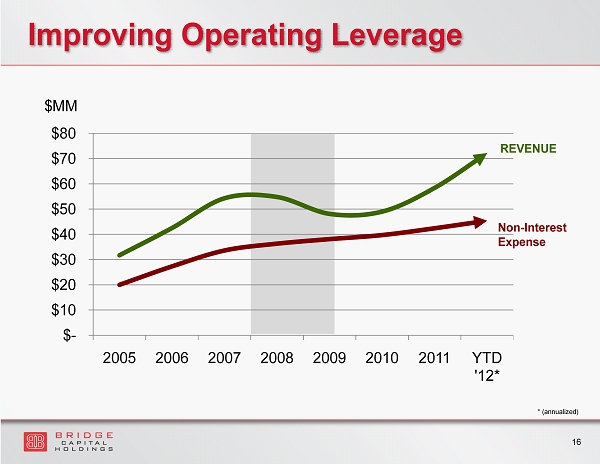
$ - $10 $20 $30 $40 $50 $60 $70 $80 2005 2006 2007 2008 2009 2010 2011 YTD '12* $MM Improving Operating Leverage REVENUE Non - Interest Expense 16 * (annualized)
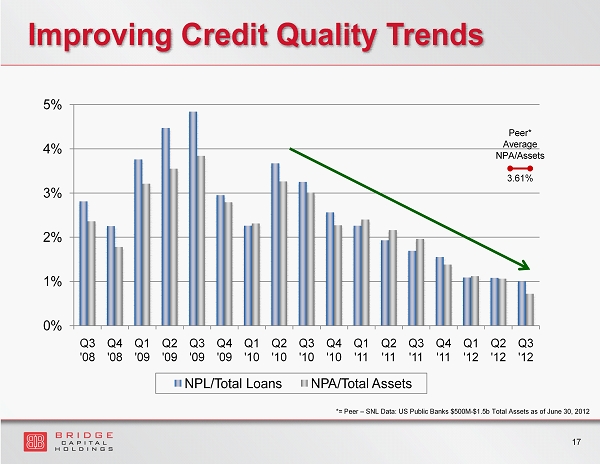
Improving Credit Quality Trends 0% 1% 2% 3% 4% 5% Q3 '08 Q4 '08 Q1 '09 Q2 '09 Q3 '09 Q4 '09 Q1 '10 Q2 '10 Q3 '10 Q4 '10 Q1 '11 Q2 '11 Q3 '11 Q4 '11 Q1 '12 Q2 '12 Q3 '12 NPL/Total Loans NPA/Total Assets Peer* Average NPA/Assets 3.61% *= Peer – SNL Data: US Public Banks $500M - $1.5b Total Assets as of June 30, 2012 17
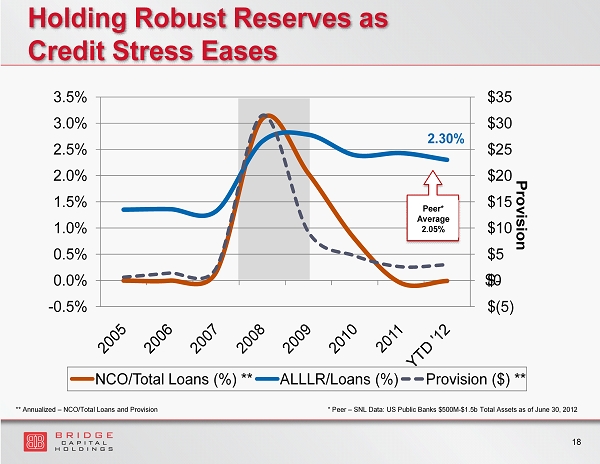
$(5) $ - $5 $10 $15 $20 $25 $30 $35 - 0.5% 0.0% 0.5% 1.0% 1.5% 2.0% 2.5% 3.0% 3.5% Provision NCO/Total Loans (%) ** ALLLR/Loans (%) Provision ($) ** Holding Robust Reserves as Credit Stress Eases 2.30% * Peer – SNL Data: US Public Banks $500M - $1.5b Total Assets as of June 30, 2012 18 $0 Peer* Average 2.05% ** Annualized – NCO/Total Loans and Provision
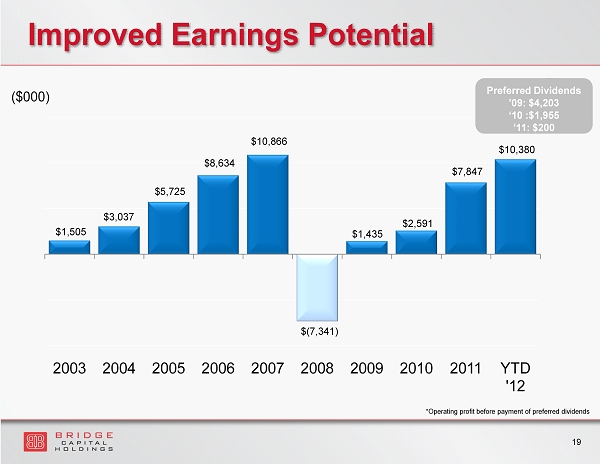
Improved Earnings Potential $(7,341) $1,505 $3,037 $5,725 $8,634 $10,866 $1,435 $2,591 $7,847 $10,380 2003 2004 2005 2006 2007 2008 2009 2010 2011 YTD '12 19 Preferred Dividends ’09: $4,203 ‘10 :$ 1,955 ’11: $200 ($000) *Operating profit before payment of preferred dividends
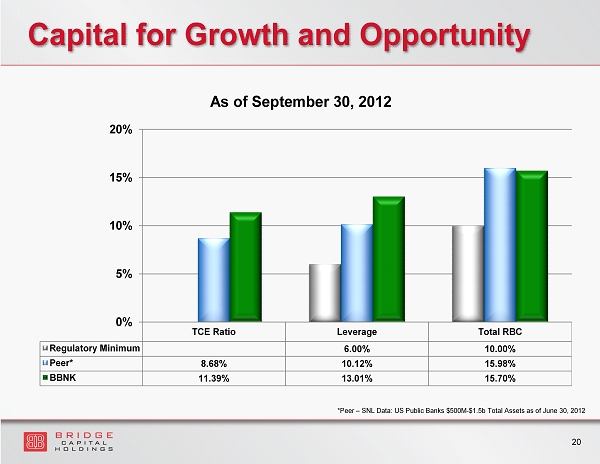
Capital for Growth and Opportunity * Peer – SNL Data: US Public Banks $500M - $1.5b Total Assets as of June 30, 2012 TCE Ratio Leverage Total RBC Regulatory Minimum 6.00% 10.00% Peer* 8.68% 10.12% 15.98% BBNK 11.39% 13.01% 15.70% 0% 5% 10% 15% 20% As of September 30, 2012 20
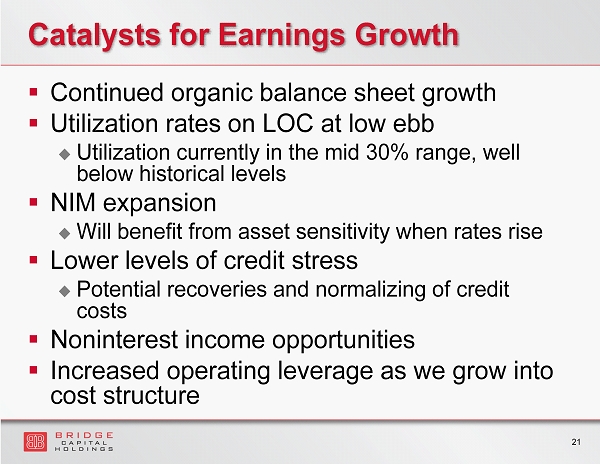
Catalysts for Earnings Growth ▪ Continued organic balance sheet growth ▪ Utilization rates on LOC at low ebb Utilization currently in the mid 30% range, well below historical levels ▪ NIM expansion Will benefit from asset sensitivity when rates rise ▪ Lower levels of credit stress Potential recoveries and normalizing of credit costs ▪ Noninterest income opportunities ▪ Increased operating leverage as we grow into cost structure 21
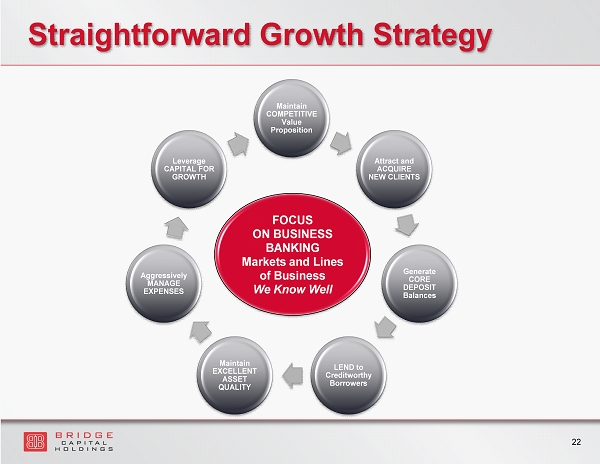
Maintain COMPETITIVE Value Proposition Attract and ACQUIRE NEW CLIENTS Generate CORE DEPOSIT Balances LEND to Creditworthy Borrowers Maintain EXCELLENT ASSET QUALITY Aggressively MANAGE EXPENSES Leverage CAPITAL FOR GROWTH FOCUS ON BU SINESS BANKING Markets and Lines of Business We Know Well Straightforward Growth Strategy 22
Contact Information Investor Relations Contact Thomas A. Sa Bridge Capital Holdings 55 Almaden Blvd., Suite 100 San Jose, CA 95113 (408) 423 - 8500 ir@bridgebank.com 23